Price Action Analysis Toolkit Development (Part 43): Candlestick Probability and Breakouts

Contents
Introduction
In this article we perform a probability analysis of three common candlestick types, Doji, Engulfing and Pinbar, to measure how they influence price action across different instrument pairs. These candles often signal either trend continuation or reversal. For example, in a downtrend a bullish Pinbar or bullish Engulfing may indicate a possible reversal to the upside, and conversely, in an uptrend a bearish Pinbar or bearish Engulfing can precede a downside reversal. A Doji often represents indecision: inside a strong trend it can signal a brief pause followed by continuation, while at key support or resistance, or after a long move, it may indicate a potential reversal. A Doji formed in a sideways market, or without volume context, is frequently neutral.
A common problem traders face is premature entries, such as seeing a bullish Pinbar and buying immediately, only to be left in a losing position when the market fails to reverse. Different instruments and timeframes respond differently to the same formation; some pairs show higher follow-through after certain patterns. This EA is built as a probability analyst; it scans historical bars and quantifies how often each pattern leads to continuation, reversal, or successful breakouts on a particular pair and timeframe. That empirical view helps price-action traders know which patterns are more reliable for reversal or continuation signals in the markets they trade.
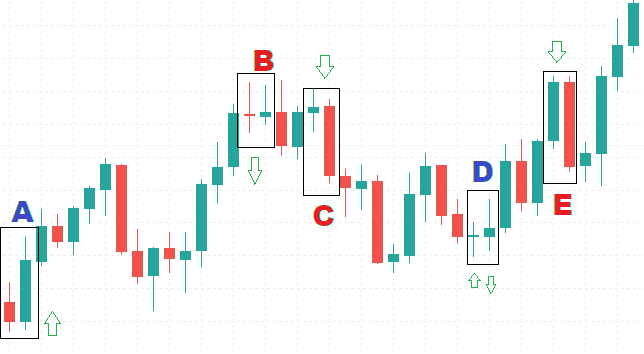
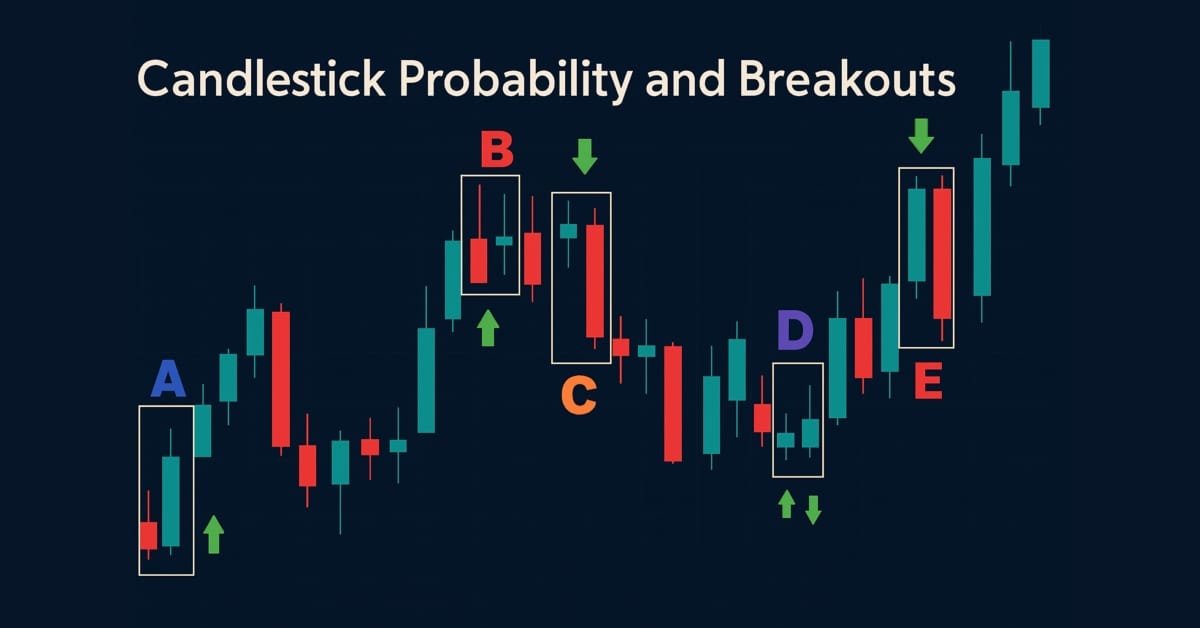
If you look closely at the diagram above, pattern A is a bullish engulfing, which resembles a buy signal, and we see the market moving higher after the formation, confirming a positive outcome. In B we observe a Doji followed by a bearish pinbar, and the market subsequently moves in the bears' favor, which validates the bearish signal. The same applies to C, which is a bearish engulfing that signaled a sell and produced the expected decline.
On D there is a Doji formed at a support level, which suggests a potential bullish reversal; the subsequent pinbar should be interpreted by its tail and placement, because candle color alone can be misleading. Finally, E shows a bearish engulfing that failed, with price moving up instead of down, which demonstrates that these patterns are probabilistic and can produce false signals. Presenting our tool as a probability analyst helps by quantifying how often each formation leads to reversal, continuation, or failure on a given pair and timeframe.
Strategy Overview
What I want you to understand here is the idea behind this tool. I will first explain the concept and provide a flowchart so you can follow the logic, then show the coding details in the implementation section.
First, the tool collects the recent price bars you asked it to analyze for the chosen symbol and timeframe. That means it loads each candle’s open, high, low, and close, together with the trading activity on that bar. It also prepares the chart display and resets all counters so every run starts fresh. The goal is to use clean, recent history so the percentages reflect the data you expect to trade.
Next, the tool examines the historical bars one by one and checks whether a bar matches one of the three candlestick shapes we track: Pinbar, Engulfing, or Doji. In plain terms, a Pinbar has a small body and a long tail, an Engulfing is when one candle’s body fully covers the previous candle’s body, and a Doji has a tiny body. When the tool finds a match, it records that moment as an occurrence of the pattern.
For each pattern occurrence, the tool records a few things: that the pattern happened, when it happened, and how much trading activity happened on that bar (the “volume”). It then checks three outcomes for that occurrence: did the very next closed bar move in the direction the pattern suggested, did price move that way at any time within the next N bars you set, and did price break past the pattern’s high or low by the preset pip amount and then get confirmed by the following bar. Each check is recorded as a yes or no, and the volumes for those specific occurrences are also stored.
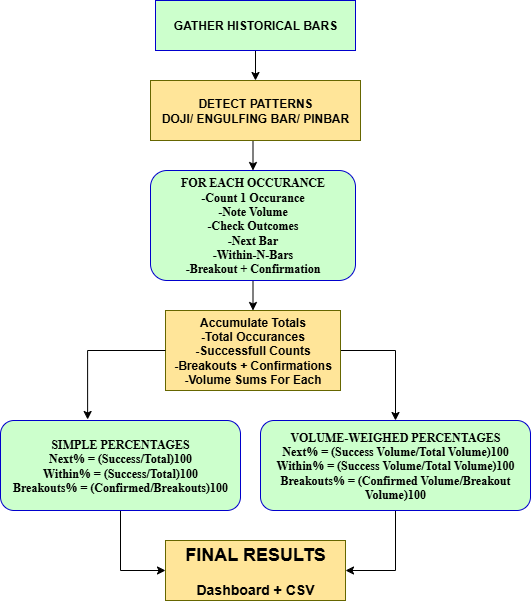
The simplest view turns those counts into percentages that are easy to read. The formulas are:
- Next-bar % = (Successful next-bar occurrences ÷ Total occurrences) × 100
- Within-N % = (Successful within-N occurrences ÷ Total occurrences) × 100
- Breakout success % = (Confirmed breakouts ÷ Total breakouts) × 100
- Next-bar % (volume-weighted) = (Volume of successful next-bar patterns ÷ Total volume of all patterns) × 100
- Within-N % (volume-weighted) = (Volume of successful within-N patterns ÷ Total volume of all patterns) × 100
- Breakout % (volume-weighted) = (Volume of confirmed breakouts ÷ Total breakout volume) × 100
Example: If the 50 pinbars together had a total volume of 10,000, and the 15 successful ones had a volume of 3,000, then 3,000 ÷ 10,000 = 0.30 → 0.30 × 100 = 30% Next-bar success (volume-weighted).
Finally, the tool shows the numbers for each pattern in the dashboard and optionally writes them to a CSV file. For each pattern, you will usually see total occurrences, next-bar %, within-N %, breakout count, and breakout success %, and the volume-weighted versions if you enabled them. If a pattern never occurred, the tool shows 0% or “N/A” for percentages that cannot be calculated. The practical tip is simple: read both views. The simple percentages tell you how often something happened, and the volume-weighted percentages tell you how much trading supported those outcomes.
Implementation
This Expert Advisor, Candlestick Probability EA, is a compact but feature-rich tool designed to identify key candlestick patterns (Pinbar, Engulfing, Doji), quantify their historical behavior, and present those findings directly on the chart and to file. The EA is built for practical research and quick visual verification: it helps traders and system developers turn pattern recognition into measurable, repeatable statistics that can inform strategy design or manual trade decisions.
Below I present a structured MQL5 implementation, covering system architecture, inputs, the statistical model, visualization, and the user interface.
Configuration and inputs
A compact, well-documented set of input parameters sits at the top of the file, allowing users to configure the EA without editing code. These parameters cover analysis horizon (LookbackBars), follow-up window (LookAheadBars), breakout thresholds (BreakoutPips, BreakoutConfirmBars), timeframe (TF), visualization and UI flags such as ShowPatternMarkers and ShowControlButtons, and export/weighting options like ExportCSV and UseVolumeWeighting. Exposing these controls upfront supports rapid experimentation and documents which knobs matter when tuning or comparing results.
//--- Inputs, user-configurable parameters
input int    LookbackBars        = 2000;       // how many bars to scan
input int    LookAheadBars       = 5;          // how many bars forward to look for follow-up
input int    BreakoutPips        = 5;          // breakout threshold in pips
input int    BreakoutConfirmBars = 1;          // bars after breakout used for confirmation
input ENUM_TIMEFRAMES TF        = PERIOD_CURRENT;
input bool   ExportCSV          = false;
input string CSVFileName        = "PatternStats.csv";

input bool   ShowPatternMarkers = true;
input int    MaxMarkers         = 500;
input int    MarkerFontSize     = 12;
input int    MarkerOffsetPips   = 3;
input int    MarkerStackWindow  = 2;

input bool   UseVolumeWeighting = true;
input bool   ShowControlButtons = true;
Pattern statistics data model
Metrics for each pattern are encapsulated in a single PatternStats struct, which collects occurrence counts, next-bar and within-lookahead matches, breakouts and confirmed breakout successes, a cumulative volume total, and volume-weighted counterparts. Organizing metrics this way keeps aggregation modular and makes adding new statistics or patterns straightforward without changing the core analysis loop.
struct PatternStats
  {
   string name;
   int    total;
   int    nextSameDir;
   int    withinLookAheadSame;
   int    breakouts;
   int    breakoutSuccess;
   double volTotal;
   double weightedNextSameDir;
   double weightedWithin;
   double weightedBreakouts;
   double weightedBreakoutSuccess;
  };

// Example declarations
PatternStats pinbar, engulfing, dojiStats;
Initialization, OnInit
Startup tasks run deterministically in OnInit(); code zeros all statistics via ResetStats(), assigns readable names to each PatternStats instance, prepares per-bar marker counters, and optionally creates control buttons when interactivity is enabled. A short event timer is started with EventSetTimer(), and Analyze() is called once immediately so the chart displays results on attach, ensuring repeatable behavior across restarts and safe operation during live sessions.
int OnInit()
  {
   // reset stats and name patterns
   ResetStats();
   pinbar.name     = "Pinbar";
   engulfing.name  = "Engulfing";
   dojiStats.name  = "Doji";

   // prepare marker counts buffer
   ArrayResize(markerCounts, 64);
   for(int i=0;i<ArraySize(markerCounts);i++) markerCounts[i]=0;

   // create UI if requested
   if(ShowControlButtons) CreateControlButtons();

   // run periodically to detect new bars
   EventSetTimer(5);

   // initial analysis
   Analyze();
   return(INIT_SUCCEEDED);
  }
Clean exit, OnDeinit
A clean teardown is implemented in OnDeinit(), which kills the timer, deletes every EA-created chart object including markers, buttons, and dashboard elements, and forces a chart redraw to remove artifacts. This careful cleanup prevents residual clutter and guarantees other tools or templates remain unaffected when the EA is removed.
void OnDeinit(const int reason)
  {
   EventKillTimer();
   DeleteAllOurObjects();   // removes only objects with EA prefixes
   ChartRedraw();
  }
Reactive Updates, OnTimer and OnChartEvent
Chart responsiveness is handled through a lightweight timer and chart event handling. OnTimer() detects new bar arrivals and triggers Analyze() only when necessary to avoid redundant work, while OnChartEvent() listens for button clicks and toggles detection streams. Clicking a control updates the enabled flag, refreshes the button label with live metrics, and re-runs analysis so user interactions immediately reflect on-screen statistics.
void OnTimer()
  {
   static datetime lastTime = 0;
   datetime t = iTime(_Symbol, TF, 1); // previous completed bar
   if(t == lastTime) return;
   lastTime = t;
   Analyze();
  }

void OnChartEvent(const int id, const long &lparam, const double &dparam, const string &sparam)
  {
   if(id == CHARTEVENT_OBJECT_CLICK && StringFind(sparam, "Btn_") == 0)
     {
      if(StringCompare(sparam, "Btn_Pinbar") == 0) { enabledPinbar = !enabledPinbar; UpdateButtonLabel("Btn_Pinbar", pinbar, enabledPinbar); Analyze(); }
      if(StringCompare(sparam, "Btn_Engulfing") == 0) { enabledEngulfing = !enabledEngulfing; UpdateButtonLabel("Btn_Engulfing", engulfing, enabledEngulfing); Analyze(); }
      if(StringCompare(sparam, "Btn_Doji") == 0) { enabledDoji = !enabledDoji; UpdateButtonLabel("Btn_Doji", dojiStats, enabledDoji); Analyze(); }
     }
  }
Pattern detection functions
Each pattern rule is implemented as a concise, parameterized helper such as IsPinbar(shift), IsEngulfing(shift), and IsDoji(shift). These functions read only the required bar fields and apply configurable thresholds such as PinbarBodyPct, PinbarTailPct, and DojiBodyPct, returning directional values (+1, −1, 0), which simplifies downstream aggregation and enables prioritized or combined pattern logic.
int IsPinbar(int shift)
  {
   if(IsDoji(shift)) return 0;
   double o = iOpen(_Symbol, TF, shift), c = iClose(_Symbol, TF, shift);
   double h = iHigh(_Symbol, TF, shift), l = iLow(_Symbol, TF, shift);
   double range = h - l;
   if(range <= 0) return 0;
   double body = MathAbs(c - o);
   if(body > PinbarBodyPct * range) return 0;
   double upperTail = h - MathMax(o, c);
   double lowerTail = MathMin(o, c) - l;
   if(lowerTail >= PinbarTailPct * range && upperTail <= (1.0 - PinbarTailPct) * range) return +1;
   if(upperTail >= PinbarTailPct * range && lowerTail <= (1.0 - PinbarTailPct) * range) return -1;
   return 0;
  }

int IsEngulfing(int shift)
  {
   int totalBars = iBars(_Symbol, TF);
   if(totalBars <= shift + 1) return 0;
   double o1 = iOpen(_Symbol, TF, shift), c1 = iClose(_Symbol, TF, shift);
   double o2 = iOpen(_Symbol, TF, shift + 1), c2 = iClose(_Symbol, TF, shift + 1);
   double body1 = c1 - o1, body2 = c2 - o2;
   if(body1 > 0 && body2 < 0 && o1 <= c2 && c1 >= o2) return +1;
   if(body1 < 0 && body2 > 0 && o1 >= c2 && c1 <= o2) return -1;
   return 0;
  }

bool IsDoji(int shift)
  {
   double o = iOpen(_Symbol, TF, shift), c = iClose(_Symbol, TF, shift);
   double h = iHigh(_Symbol, TF, shift), l = iLow(_Symbol, TF, shift);
   double range = h - l;
   if(range <= 0) return false;
   return (MathAbs(c - o) <= DojiBodyPct * range);
  }
Central analysis loop: Analyze
A single linear pass across the configured lookback window forms the heart of the EA; symbol-specific scaling for points and pips is calculated once up-front, pattern detection functions are called for each shift, matched patterns are aggregated via UpdateStatsOnPattern(), and optional stacked markers are drawn. Keeping the loop single-pass ensures deterministic results and predictable CPU cost.
void Analyze()
  {
   ResetStats();
   int totalBars = iBars(_Symbol, TF);
   if(totalBars < 3) return;
   int maxIndex = MathMin(totalBars - 1, LookbackBars);
   if(maxIndex < 2) return;

   // pip scaling
   double point = SymbolInfoDouble(_Symbol, SYMBOL_POINT);
   int digits = (int)SymbolInfoInteger(_Symbol, SYMBOL_DIGITS);
   double factor = (digits == 5 || digits == 3) ? 10.0 : 1.0;
   double breakoutPoints = BreakoutPips * point * factor;

   ArrayResize(markerCounts, MathMax(3, maxIndex + 3));
   for(int i=0;i<ArraySize(markerCounts);i++) markerCounts[i]=0;

   if(ShowPatternMarkers) DeletePatternObjects();

   int drawn=0;
   for(int shift=2; shift<=maxIndex; shift++)
     {
      int eng = IsEngulfing(shift);
      int pin = IsPinbar(shift);
      bool doj = IsDoji(shift);
      bool matched = false;

      if(eng != 0 && enabledEngulfing)
        {
         UpdateStatsOnPattern(engulfing, shift, eng, LookAheadBars, breakoutPoints);
         if(ShowPatternMarkers && drawn < MaxMarkers) { DrawPatternOnChartWithStacking(shift, "Engulfing", eng, MarkerFontSize, MarkerOffsetPips, factor); drawn++; }
         matched = true;
        }
      if(!matched && pin != 0 && enabledPinbar)
        {
         UpdateStatsOnPattern(pinbar, shift, pin, LookAheadBars, breakoutPoints);
         if(ShowPatternMarkers && drawn < MaxMarkers) { DrawPatternOnChartWithStacking(shift, "Pinbar", pin, MarkerFontSize, MarkerOffsetPips, factor); drawn++; }
         matched = true;
        }
      if(!matched && doj && enabledDoji)
        {
         UpdateStatsOnPattern(dojiStats, shift, 0, LookAheadBars, breakoutPoints);
         if(ShowPatternMarkers && drawn < MaxMarkers) { DrawPatternOnChartWithStacking(shift, "Doji", 0, MarkerFontSize, MarkerOffsetPips, factor); drawn++; }
        }
     }

   if(ExportCSV) SaveToCSV();
   DrawDashboard();
   DrawSummaryHeaderAndLabel();

   if(ShowControlButtons)
     {
      UpdateButtonLabel("Btn_Pinbar", pinbar, enabledPinbar);
      UpdateButtonLabel("Btn_Engulfing", engulfing, enabledEngulfing);
      UpdateButtonLabel("Btn_Doji", dojiStats, enabledDoji);
     }

   ChartRedraw();
  }
Updating statistics, UpdateStatsOnPattern
Recognition of a pattern activates a comprehensive measurement routine that increments occurrence counters, accumulates volume, inspects the immediate next bar and the configured lookahead window for same-direction moves, detects breakouts around the pattern extremes using BreakoutPips, and evaluates confirmation after BreakoutConfirmBars. Both raw counts and volume-weighted counters are maintained so results can be interpreted either by simple frequency or by market participation.
void UpdateStatsOnPattern(PatternStats &s, int shift, int direction, int lookAhead, double breakoutPoints)
  {
   s.total++;
   double vol = (double)iVolume(_Symbol, TF, shift);
   if(vol <= 0) vol = 1.0;
   s.volTotal += vol;

   // next-bar direction
   if(shift - 1 >= 0)
     {
      double nO = iOpen(_Symbol, TF, shift - 1), nC = iClose(_Symbol, TF, shift - 1);
      int nDir = (nC > nO) ? +1 : (nC < nO) ? -1 : 0;
      if(direction == 0)
        {
         if(nDir != 0) { s.nextSameDir++; s.weightedNextSameDir += vol; }
        }
      else
        {
         if(nDir == direction) { s.nextSameDir++; s.weightedNextSameDir += vol; }
        }
     }

   // within lookahead
   bool anySame = false; double weightedAny = 0.0;
   int totalBars = iBars(_Symbol, TF);
   for(int k=1; k<=lookAhead; k++)
     {
      int idx = shift - k;
      if(idx < 1 || idx > totalBars - 1) break;
      double o = iOpen(_Symbol, TF, idx), c = iClose(_Symbol, TF, idx);
      double v = (double)iVolume(_Symbol, TF, idx); if(v <= 0) v = 1.0;
      int d = (c > o) ? +1 : (c < o) ? -1 : 0;
      if(direction == 0)
        {
         if(d != 0) { anySame = true; weightedAny += v; break; }
        }
      else
        {
         if(d == direction) { anySame = true; weightedAny += v; break; }
        }
     }
   if(anySame) { s.withinLookAheadSame++; s.weightedWithin += (weightedAny > 0.0 ? weightedAny : vol); }

   // breakout detection and confirmation
   double highP = iHigh(_Symbol, TF, shift), lowP = iLow(_Symbol, TF, shift);
   bool breakout = false;
   if(shift - 1 >= 0)
     {
      double nextHigh = iHigh(_Symbol, TF, shift - 1), nextLow = iLow(_Symbol, TF, shift - 1);
      if(direction == +1 && nextHigh >= highP + breakoutPoints) breakout = true;
      else if(direction == -1 && nextLow <= lowP - breakoutPoints) breakout = true;
      else if(direction == 0 && (nextHigh >= highP + breakoutPoints || nextLow <= lowP - breakoutPoints)) breakout = true;
     }

   if(breakout)
     {
      s.breakouts++;
      s.weightedBreakouts += vol;
      int confirmShift = shift - 1 - BreakoutConfirmBars;
      if(confirmShift >= 0 && confirmShift <= totalBars - 1)
        {
         double cO = iOpen(_Symbol, TF, confirmShift), cC = iClose(_Symbol, TF, confirmShift);
         double cVol = (double)iVolume(_Symbol, TF, confirmShift); if(cVol <= 0) cVol = 1.0;
         int cDir = (cC > cO) ? +1 : (cC < cO) ? -1 : 0;
         bool confirmed = false;
         if(direction == +1 && cC >= highP + breakoutPoints) confirmed = true;
         else if(direction == -1 && cC <= lowP - breakoutPoints) confirmed = true;
         else if(direction == 0 && (cC >= highP + breakoutPoints || cC <= lowP - breakoutPoints)) confirmed = true;
         if(confirmed && (direction == 0 ? cDir != 0 : cDir == direction))
           {
            s.breakoutSuccess++;
            s.weightedBreakoutSuccess += cVol;
           }
        }
     }
  }
Percentage computation and CSV export
Conversion from raw counts or weighted sums to readable percentages is centralized in ComputePct(); volume-weighted percentages are returned when UseVolumeWeighting is enabled; otherwise, simple frequency percentages are used. When ExportCSV is true SaveToCSV() writes a tab-separated file with headers and one row per pattern so offline analysis in Python, R, or spreadsheet tools is straightforward and reproducible.
double ComputePct(double weightedValue, PatternStats &s, int simpleCount, int total)
  {
   if(UseVolumeWeighting)
     {
      if(s.volTotal <= 0.0) return 0.0;
      return 100.0 * weightedValue / s.volTotal;
     }
   else
     {
      if(total <= 0) return 0.0;
      return 100.0 * simpleCount / total;
     }
  }

void SaveToCSV()
  {
   int handle = FileOpen(CSVFileName, FILE_WRITE|FILE_CSV|FILE_ANSI, '\t');
   if(handle == INVALID_HANDLE) { Print("Failed to open CSV: ", CSVFileName); return; }
   FileWrite(handle, "Pattern","Total","Next%","Within%","Breakouts","Success%","VolTotal","W_Next%","W_Within%","W_Breakouts%","W_Success%");
   WriteStatsLine(handle, pinbar);
   WriteStatsLine(handle, engulfing);
   WriteStatsLine(handle, dojiStats);
   FileClose(handle);
  }

void WriteStatsLine(int handle, PatternStats &s)
  {
   double nextPct   = ComputePct(s.weightedNextSameDir, s, s.nextSameDir, s.total);
   double withinPct = ComputePct(s.weightedWithin, s, s.withinLookAheadSame, s.total);
   double successPct = s.breakouts > 0 ? 100.0 * s.breakoutSuccess / s.breakouts : 0.0;
   double wBreakoutsPct = s.volTotal > 0.0 ? 100.0 * s.weightedBreakouts / s.volTotal : 0.0;
   double wSuccessPct   = s.weightedBreakouts > 0.0 ? 100.0 * s.weightedBreakoutSuccess / s.weightedBreakouts : 0.0;
   FileWrite(handle, s.name, s.total, DoubleToString(nextPct,1), DoubleToString(withinPct,1),
             s.breakouts, DoubleToString(successPct,1), DoubleToString(s.volTotal,0),
             DoubleToString(nextPct,1), DoubleToString(withinPct,1), DoubleToString(wBreakoutsPct,1), DoubleToString(wSuccessPct,1));
  }
Chart visualization, markers, and stacking
Visual indicators are drawn by DrawPatternOnChartWithStacking(), which places compact text arrows or symbols at the pattern bar while stacking them vertically to avoid collisions. Stacking uses a per-bar markerCounts[] array and the MarkerStackWindow parameter to control tiering. Markers are color-coded and intentionally unobtrusive so they provide immediate context without obscuring price action.
void DrawPatternOnChartWithStacking(int shift, string patternName, int direction, int fontSize, int offsetPips, double factor)
  {
   string name = "Pattern_" + patternName + "_" + IntegerToString(shift);
   if(ObjectFind(0, name) != -1) ObjectDelete(0, name);

   datetime t = iTime(_Symbol, TF, shift);
   double highP = iHigh(_Symbol, TF, shift), lowP = iLow(_Symbol, TF, shift);
   double point = SymbolInfoDouble(_Symbol, SYMBOL_POINT);
   double offset = offsetPips * point * factor;
   double priceBase = (highP + lowP) / 2.0;
   if(direction > 0) priceBase = lowP - offset;
   else if(direction < 0) priceBase = highP + offset;

   int idx = shift;
   if(idx >= ArraySize(markerCounts)) ArrayResize(markerCounts, idx + 5);
   int stack = markerCounts[idx]++;
   double stackOffset = (stack / MarkerStackWindow) * offset * 1.2;
   if(direction > 0) priceBase -= stackOffset; else priceBase += stackOffset;

   string arrow = (direction>0 ? "▲" : direction<0 ? "▼" : "◆");
   string text = arrow + " " + StringSubstr(patternName, 0, 3);
   ObjectCreate(0, name, OBJ_TEXT, 0, t, priceBase);
   ObjectSetString(0, name, OBJPROP_TEXT, text);
   ObjectSetInteger(0, name, OBJPROP_FONTSIZE, fontSize);
   ObjectSetInteger(0, name, OBJPROP_SELECTABLE, 0);
   ObjectSetInteger(0, name, OBJPROP_BACK, 1);
   ObjectSetInteger(0, name, OBJPROP_COLOR, (direction>0 ? clrLime : direction<0 ? clrRed : clrLightBlue));
  }
Dashboard and summary labels
A compact on-chart dashboard produced by DrawDashboard() presents canonical columns such as Pattern, Total, Next%, Within%, Breakouts, and Success%, while DrawSummaryHeaderAndLabel() creates a top-left summary for quick inspection. Using consistent object name prefixes allows these UI elements to be reliably cleaned up by the EA when no longer needed.
void DrawDashboard()
  {
   string rectName = "Dash_Background";
   if(ObjectFind(0, rectName) != -1) ObjectDelete(0, rectName);
   ObjectCreate(0, rectName, OBJ_RECTANGLE_LABEL, 0, 0, 0);
   ObjectSetInteger(0, rectName, OBJPROP_CORNER, 0);
   ObjectSetInteger(0, rectName, OBJPROP_XDISTANCE, 8);
   ObjectSetInteger(0, rectName, OBJPROP_YDISTANCE, 70);
   ObjectSetInteger(0, rectName, OBJPROP_XSIZE, 660);
   ObjectSetInteger(0, rectName, OBJPROP_YSIZE, 80);
   ObjectSetInteger(0, rectName, OBJPROP_BACK, 1);
   ObjectSetInteger(0, rectName, OBJPROP_COLOR, clrDarkSlateGray);

   // header and rows omitted for brevity, see DrawDashboard in main code for full cell logic
  }

void DrawSummaryHeaderAndLabel()
  {
   string header = "SummaryHeader";
   if(ObjectFind(0, header) != -1) ObjectDelete(0, header);
   ObjectCreate(0, header, OBJ_LABEL, 0, 0, 0);
   ObjectSetInteger(0, header, OBJPROP_CORNER, 0);
   ObjectSetInteger(0, header, OBJPROP_XDISTANCE, 10);
   ObjectSetInteger(0, header, OBJPROP_YDISTANCE, 12);
   ObjectSetInteger(0, header, OBJPROP_FONTSIZE, 11);
   ObjectSetString(0, header, OBJPROP_TEXT, "Candlestick Pattern Stats Summary");
   ObjectSetInteger(0, header, OBJPROP_COLOR, clrBlue);

   string sum = "SummaryLabel";
   if(ObjectFind(0, sum) != -1) ObjectDelete(0, sum);
   ObjectCreate(0, sum, OBJ_LABEL, 0, 0, 0);
   ObjectSetInteger(0, sum, OBJPROP_CORNER, 0);
   ObjectSetInteger(0, sum, OBJPROP_XDISTANCE, 10);
   ObjectSetInteger(0, sum, OBJPROP_YDISTANCE, 30);
   ObjectSetInteger(0, sum, OBJPROP_FONTSIZE, 9);
   ObjectSetInteger(0, sum, OBJPROP_BACK, 1);
   ObjectSetString(0, sum, OBJPROP_TEXT, FormatStatsForLabel(pinbar) + "\n" + FormatStatsForLabel(engulfing) + "\n" + FormatStatsForLabel(dojiStats));
  }
Control buttons and dynamic labels
Auto-sized control buttons are created with CreateAutoSizedButton() and updated live by UpdateButtonLabel(). Each button shows a short identifier, an ON/OFF state, and current Next% and Succ% metrics. EstimateButtonWidth() prevents truncation, and button colors change to reflect enabled or disabled states so users can interactively tune which patterns contribute to the statistics.
void CreateAutoSizedButton(string name, int x, int y, string text)
  {
   if(ObjectFind(0, name) != -1) ObjectDelete(0, name);
   ObjectCreate(0, name, OBJ_BUTTON, 0, 0, 0);
   ObjectSetInteger(0, name, OBJPROP_CORNER, 1);
   ObjectSetInteger(0, name, OBJPROP_XDISTANCE, x);
   ObjectSetInteger(0, name, OBJPROP_YDISTANCE, y);
   ObjectSetString(0, name, OBJPROP_FONT, ButtonFont);
   ObjectSetInteger(0, name, OBJPROP_FONTSIZE, ButtonFontSize);
   ObjectSetString(0, name, OBJPROP_TEXT, text);
   int w = EstimateButtonWidth(text, ButtonFontSize);
   int h = ButtonFontSize + ButtonPaddingY * 2;
   ObjectSetInteger(0, name, OBJPROP_XSIZE, w);
   ObjectSetInteger(0, name, OBJPROP_YSIZE, h);
   ObjectSetInteger(0, name, OBJPROP_BGCOLOR, clrWhite);
  }

void UpdateButtonLabel(string name, PatternStats &s, bool enabled)
  {
   if(ObjectFind(0, name) == -1) return;
   string onoff = enabled ? "ON" : "OFF";
   double nextPct = ComputePct(s.weightedNextSameDir, s, s.nextSameDir, s.total);
   double successPct = s.breakouts > 0 ? 100.0 * s.breakoutSuccess / s.breakouts : 0.0;
   string shortName = (StringCompare(s.name, "Pinbar") == 0) ? "Pin" : (StringCompare(s.name,"Engulfing")==0) ? "Eng" : "Doj";
   string txt = shortName + ": " + onoff + "  Next% " + DoubleToString(nextPct,1) + "  Succ% " + DoubleToString(successPct,1);
   ObjectSetString(0, name, OBJPROP_TEXT, txt);
   ObjectSetInteger(0, name, OBJPROP_XSIZE, EstimateButtonWidth(txt, ButtonFontSize));
   if(enabled) { ObjectSetInteger(0, name, OBJPROP_BGCOLOR, clrWhite); ObjectSetInteger(0, name, OBJPROP_COLOR, clrBlack); }
   else { ObjectSetInteger(0, name, OBJPROP_BGCOLOR, clrLightGray); ObjectSetInteger(0, name, OBJPROP_COLOR, clrDimGray); }
  }

int EstimateButtonWidth(const string txt, const int fontSize)
  {
   int len = StringLen(txt);
   double charW = fontSize * 0.75;
   int base = (int)MathCeil(len * charW) + ButtonPaddingX * 2 + 10;
   if(base < 100) base = 100;
   return base;
  }
Housekeeping and object management
Every chart object created by the EA carries a deterministic prefix such as OBJ_PREFIX_PATTERN, OBJ_PREFIX_DASH, or OBJ_PREFIX_BTN. Companion deletion functions remove only objects matching those prefixes, minimizing the risk of accidentally deleting unrelated user objects and keeping the EA’s footprint predictable and non-invasive.
void DeleteAllOurObjects()
  {
   int total = ObjectsTotal(0);
   for(int i = total - 1; i >= 0; i--)
     {
      string nm = ObjectName(0, i);
      if(StringFind(nm, "Pattern_") == 0 || StringFind(nm, "Dash_") == 0 || StringFind(nm, "Btn_") == 0
         || StringCompare(nm, "SummaryLabel") == 0 || StringCompare(nm, "SummaryHeader") == 0)
         ObjectDelete(0, nm);
     }
  }
Testing
In this section, we evaluate the EA on the Step Index and the Boom 300 Index, selected to test the tool’s robustness across synthetic instruments with contrasting volatility profiles.
- Step Index
The diagram above illustrates the tool’s performance on the Step Index. When the EA is attached to the chart, it creates a compact dashboard in the top-left corner that summarizes pattern statistics, and a set of toggle buttons in the bottom-left that control on-chart visualization. Clicking a button disables or enables the corresponding pattern stream, removing or restoring candlestick labels so you can step through the chart and visually verify pattern identification. Toggle controls are useful when you want to focus on a single pattern type.
In the example shown, the dashboard reports success rates of 40.2% for Pinbar and 31.7% for Engulfing. The Doji shows 65.1%; however, we treat Doji as a neutral signal in this analysis because its apparent strength stems primarily from breakout filtering rather than a directional bias. Therefore, the Doji result is best interpreted as indicating a tendency toward continuation/breakout resolution on this instrument, rather than a simple bullish or bearish signal.
The results are also exported to CSV for independent verification. To generate the files, open the EA inputs and set ExportCSV = true; the summary file name can be changed via CSVFileName. The EA will write the summary CSV to your terminal’s Files folder for offline analysis.
input bool   ExportCSV          = true;
input string CSVFileName        = "PatternStats.csv";
- Boom 300 Index
On Boom 300 Index, the measured success rates are 40.0% for Engulfing, 42.1% for Pinbar, and 78.6% for Doji. These figures indicate that Doji occurrences on this instrument are far more likely to be followed by continuation or breakout-style moves under the EA’s rules, while Engulfing and Pinbar show more modest directional performance.
Comparing Boom 300 with Step Index, Pinbar performance is effectively equal across both instruments, suggesting a degree of robustness for that pattern, yet Engulfing performs noticeably better on Boom 300 than on Step Index; this implies that Engulfing signals yield more positive follow-through on Boom 300 within the EA’s parameter set and sample period.
Conclusion
This article walked through the construction of an MQL5 Expert Advisor that measures candlestick pattern probabilities across multiple instruments; it shows how to detect Pinbar, Engulfing and Doji formations; collect per-pattern statistics; and report success rates so you can evaluate which patterns generate positive follow-through on each pair. I present the EA as an experimental analysis tool for visualizing price-action patterns and their empirical probabilities. It is intended as a research and verification aid rather than a turnkey trading; robot, and users should apply their own input preferences and validation routines to match their timeframes and instruments.
When proven robust on sufficiently large samples, this approach helps set realistic expectations for how a given pattern typically behaves in live trading, it also supports reproducible tests via the CSV audit files. Looking ahead, I plan to enhance the tool in future episodes, and I welcome suggestions for improvements and requests for additional analysis features.
Read my other articles.
Warning: All rights to these materials are reserved by MetaQuotes Ltd. Copying or reprinting of these materials in whole or in part is prohibited.
This article was written by a user of the site and reflects their personal views. MetaQuotes Ltd is not responsible for the accuracy of the information presented, nor for any consequences resulting from the use of the solutions, strategies or recommendations described.

- Free trading apps
- Over 8,000 signals for copying
- Economic news for exploring financial markets
You agree to website policy and terms of use