
Combination scalping: analyzing trades from the past to increase the performance of future trades

About the method. Visual description
Imagine: there is a cannon (a trading system or an algorithm) and 2 boxes of shells — one with positive (profitable) trades, and the other with negative (losing) trades. If you shoot them and study the craters on the battlefield, it turns out that some positive deals never fall into negative craters throughout the shooting history.

Figure 1. Digital field of trading history
Pay attention to the coordinate axes in Figure 1: the key parameter of the method is Time. It is the deal expiration time (the duration of an open order before it is forcedly closed). Time, as a calculation unit, plays a huge role, because the result will differ for the same event (order opening conditions within the trading system) and it will depend on the expiration time. One time interval can have constantly negative results, another interval shows mediocre performance, while the third one can always be profitable. Such performance results can be distributed throughout the entire trading history in no particular order.
About the method. Details
Many developers have been trying to create trading systems based on indicators, a variety of types of Japanese candlesticks, their patterns and combinations, as well as a lot of other possible constructions in an attempt to find a Trading Grail. The result is "average", as such Expert Advisors often include all the extremes at a time: both good/profitable results and the worst ones which ruin the balance. However, if you add to the system time and analyze trading results for each expiration using the trading history data, it is possible to identify the ones that are always profitable and those having stable losing performance. What we need to do is to find and formalize the differences in the results. After this, we could add only profitable constructions into an automated trading system, while removing all losing ones from the code.

Figure 2. Implementing expirations into the trading system development
Example:
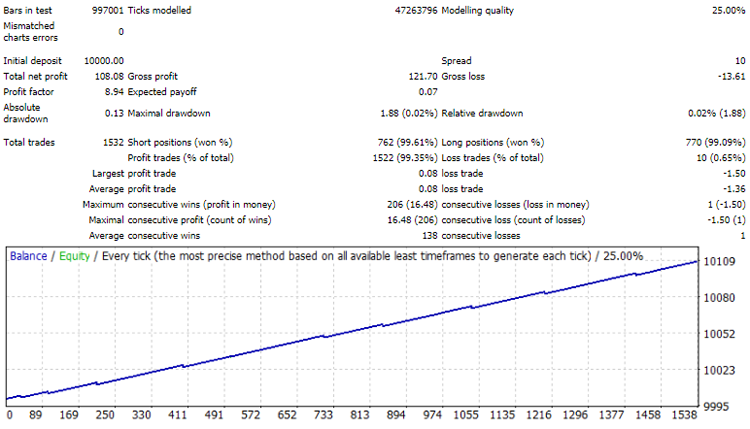
Test, for example, the Hammer reversal candlestick pattern on the trading history: in some cases, there is the expected trend reversal and thus trades are profitable; in other cases, there is no reversal, and the pattern generates losses. But, if we test this Hammer pattern for the same pips distance for all orders, setting a 5-minute expiration (which means that the order will live for 5 minutes from its opening, after which it will be closed), then 6, 7, 8 .... minute expirations, we can find out that, for example, the 7th minute (Figure 1) shows the best results, as the trend always reversed and there were no pattern failures. In this case, we should analyze the graph trying to find the differences between the 7th minute and all other options. This difference should then be described in code. Optionally, bad result differences can be formalized, and the EA can be prohibited to open trades under these conditions. The resulting Expert Advisor can work with the following performance forecasts for many years:
")
Figure 3. Strategy Tester results (EURUSD, M1, minimal lot)
Mathematical model
The simpler the better. Here the mathematics is very simple. To describe the differences and to formalize the results or to simulate deal opening conditions, it is enough to take digital measurements from the candlesticks (bars) participating in the process.
Digital measurements (in pips) include the length of the candlestick, the body of the candlestick and the direction (color) of the candlestick. Shadows are ignored.
 include the candlestick length, body color.")
Figure 4. Digital measurements (in pips) include the candlestick length, body color.
The description of digital measures of only 3 candlesticks (which precede the trade opening candlestick) is enough for their combination to be unique in history.
"Length of candlestick 1 and Body of candlestick 1 and Color of candlestick 1,
Length of candlestick 2 and Body of candlestick 2 and Color of candlestick 2,
Length of candlestick 3 and Body of candlestick 3 and Color of candlestick 3"
Here is an example of digital measurements of combinations related to profitable trades, which were repeated in the trading history for the same trading algorithm, the same expiration and the same take profit distance:
22.04.2009 03:23;R 31 - 26;G 13 - 3;G 21 - 11
07.10.2009 20:55;R 31 - 13;G 13 - 3;G 21 - 11
25.11.2011 19:48;R 22 - 2;G 13 - 3;G 21 - 11
07.06.2013 10:59;R 16 - 13;R 13 - 3;G 21 - 11
26.02.2019 18:35;R 22 - 9;G 13 - 3;G 21 - 11
When selecting combinations for an Expert Advisor database, it is better to select the measurements which fully coincide in direction (color), where G is green (growth) and R is red (fall). In our example, the following measurements match:
22.04.2009 03:23;R 31 - 26;G 13 - 3;G 21 - 11
07.10.2009 20:55;R 31 - 13;G 13 - 3;G 21 - 11
25.11.2011 19:48;R 22 - 2;G 13 - 3;G 21 - 11
26.02.2019 18:35;R 22 - 9;G 13 - 3;G 21 - 11
These measurements should then be combined into one so that it is easier to add them to code. To do this, write numbers of the relevant columns as ranges:
R (22-31) - (2-26);G 13 - 3;G 21 - 11
It is assumed that the user can take any trading system (deal opening algorithm) such as, for example, opening a deal after a growing (green) candlestick with a size of 10 pips, and test this strategy on history of the desired market, with an iteration of expirations and distances in order to create a database of combinations of digital measures for positive deals. Once the identification of profitable trades (only those whose expiration never coincided with losing trades) and recording of their measurements are complete, the resulting database of combinations can be connected to the algorithm. After that the Expert Advisor will track and execute only the earlier identified successful combinations.
Since a database of combinations is used, the described method was named Combination Scalping. The method is based on the idea that the performance of any trading system can be improved by performing a preliminary analysis of a history of trading results and expiration data, during which it is possible to select combinations of digital measures of best results for further use.
It is assumed that the probability of the occurrence and repetition of a successful deal increases if the combination of its digital measures is repeated in the trading history with no losing cases. This method allows turning of a mediocre and ordinary trading system (for example, an indicator-based system) into a successful Expert Advisor with high performance results.
An example of the predicted performance of an Expert Advisor with the same database of combinations in different years:
2016
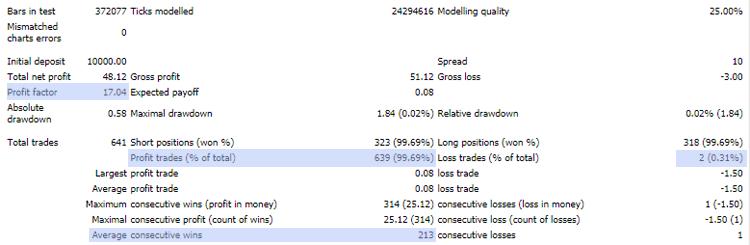
2017
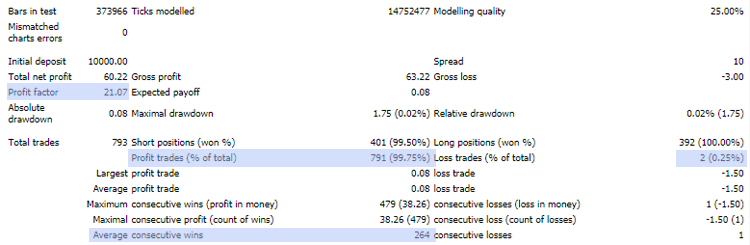
2018
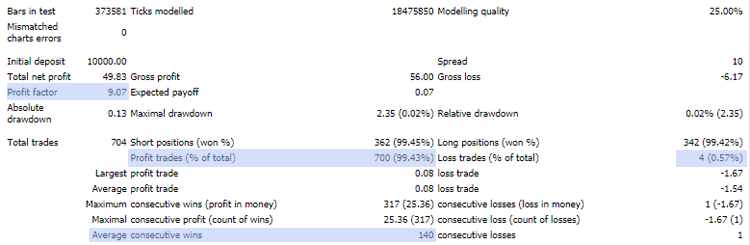
2019
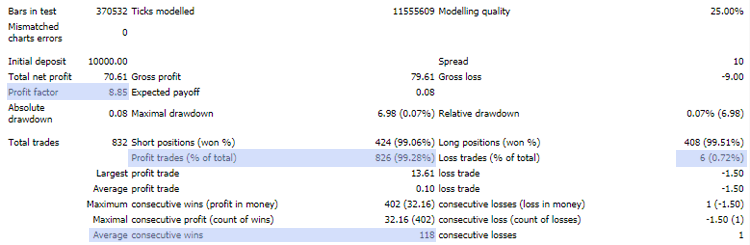
2020

Figure 5. An example of testing an Expert Advisor with the same database of combinations in different years
Why is it Scalping?
The method was original entitled as Combination Upgrade, Combination Modification Method or Combination Upgrade Method". But reality has made its corrections.
First: Scalping (in the meaning of taking the scalp). The proposed method does not change or replace existing trading systems and algorithms. It only can cut off a certain part of the iceberg, the tip of these systems, in order to expose their digital insides and reveal their mechanisms.
Second: unfortunately, the current method version can only show efficiency within a trading day and in small distances. The reason for that is in the trading history. Absolutely any market can be used here, including stocks and all other possible assets. What is important is the trading history. The longer the history, the better the selection. The most suitable variant in terms of duration is the currency market. Unfortunately, there was a historic event in the Forex market which made most of historic quotes useless. In 2009, dealing centers switched from four-digit to five-digit quotes. So, brokers started providing prices with five decimal places. All previous history became useless. So, the method could only work with the history of 2009 and later.
Here is when brokers switched from four to five decimal places:
. The length in pips is indicated above the candlesticks.")
Figure 6. Historical moment when a broker switched quotes (February 20 - 23, 2009).
The length in pips is indicated above the candlesticks
What is wrong? Why can't the method use four-decimal places?
It is simple. Imagine that millimeters did not exist before 2009. There were meters and centimeters, but there were no millimeters. Any millimeter was rounded to either zero or to one centimeter. Roughly speaking, the same happened in the Forex market: 15-millimeter long candlesticks did not exist. They were displayed on the chart as 1 or 2 centimeters long.
Therefore, the relevant data base includes only about the last 4,400,000 minutes of any Forex symbol. Furthermore, only candlesticks with the most popular size (5 to 40 pips) and "guaranteed" take profit distances of 5 to 15 pips have full statistical coverage. Longer take profit distances and large candlestick sizes have significant gaps in their statistics due to the short trading history. So, the archive of quotes for the last decade is still at the very initial stage in terms of suitability for the method. It is only a minimum, which normally covers only the initial digital measurements of candlestick combinations and distances.

Figure 7. Approximate ratio of the growth of "guaranteed" take profit distances as the trading history increases over time
After 10 years, 50-pip candlesticks and 20-pip distances will have full coverage. Another 10 years will provide data for 60-pip candlesticks and longer distances. So, every decade provides essential statistics. That is why the current stage is only suitable for scalping. Long trading distances have too many gaps and too much quoting noise. Of course, you can try to make a sample for a take profit distance of 1000 pips (100 points), but the effectiveness of the trading system upgrade will be the same as without it. The following section clearly demonstrates it (it is the composition of one of the combination databases):
| Pips | Combinations |
|---|---|
| 10 | 12 384 |
| 20 | 4 045 |
| 30 | 2 768 |
| 40 | 820 |
| 50 | 236 |
| 60 | 76 |
| 70 | 24 |
| 80 | 12 |
| 90 | 7 |
| 100 | 3 |
| 110 | 1 |
| 120 | 0 |
So, the last 100 pips are empty. There is too little statistical data. The upper numbers mean that out of the entire available trading history (which is more than 4,400,000 minutes), 12,384 combinations at a take profit distance of 10 pips have never become loss-making. It is like in the example with the cannon: 4,400,000 negative shells were fired at a distance of 10 pips and never hit 12,384 positive buildings. At a distance of 20 pips, there are only 4045 buildings left. Further, at a distance of 60 pips, only 76 shots out of 4,400,000 missed targets.
Method disadvantages
- Processing trading history
On the one hand, there is still little history. But, on the other hand, even the available archive causes some difficulties. 4,400,000 testing units are used to backtest a digital measurement of only one candlestick length. The most popular candlesticks are 5 to 40 pips. Therefore, the full historical testing is performed for all length variants (35 cycles, from 5 to 40):
This is only for Buy direction. The same number of processing iterations are needed for Sell. Furthermore, add here expirations, for example, by one minute for 30 minutes. The total is :
4,400,000 * 35 = 154,000,000 times.
So, the trading history processing is quite a complicated task. Modern computing capacities allow solving such problems in a few hours.
154,000,000 * 30 * 2 = 9,240,000,000 operations.
- Periodic updating of the combinations database
The trading history changes and grows over time. Therefore, the results can become different, and combinations of digital measurements can be corrected. So, the database must of combinations must be updated from time to time. The intervals between the updates should be a few weeks or months.
-
Provider-dependent trading history
This is the main disadvantage. The method is completely dependent on the trading history. Brokers have different price data providers and thus there is no unified history. Therefore, the database of successful combinations will only be valid for the broker whose trading history was used.
The method
Below is a visual illustration of the results obtained by testing the same combinations database with different brokers:
#1: Test results with a broker whose trading history was used for finding combinations
# 2: Another broker
. First example: a broker whose trading history was used for finding combinations. Second example: another broker")
Figure 8. A visual illustration of testing the same combinations database with different brokers (from 2018.06 to 2021.03, EURUSD,М1).
First example: a broker whose trading history was used for finding combinations. Second example: another broker
- Also, the results are absolutely dependent on the trading instrument
For example, the combinations database from EURUSD will not be compatible with AUDUSD or any other pair. And vice versa.
Final part
Despite the simplicity of the idea, the proposed method is not that simple. The main difficulty is associated with the implementation of massive data processing. Another unpleasant feature is that the method is dependent on the broker (specific trading history) and is sensitive to trading instrument spreads. Even though the method can help to improve any trading system performance, it is not the Grail. Or not the Grail as for now. Unfortunately, there can still be negative trades, because the trading history is too small and has gaps which will only be filled in the future. Anyway, it is an "eternal" technology which can work in any financial market where you can access the trading history. Furthermore, the performance of the combinations database improves with each new year or decade, while the number of combinations also grows.
Bonus for those who have read the article up to the end
Observing the results and collecting statistics from active EAs working with the combinations databases, I found some interesting points. Combination scalping has revealed the digital insides of processes which are normally invisible (especially to manual traders). I would like to share one of them.
The foreign exchange market is comprised of communicating vessels, despite the variety of existing currency pairs. All of them are coordinated with each other, with the underlying foundation of it being EURUSD. This pair that launches the main waves in the market, in which case other pairs must find a balance.
So, I noticed that there are some harmonious figures for this balancing. These are not Fibonacci, Gann or any other numbers. These seem to be some specific coordinating values related to movements and rate corrections in the Forex market.
The method
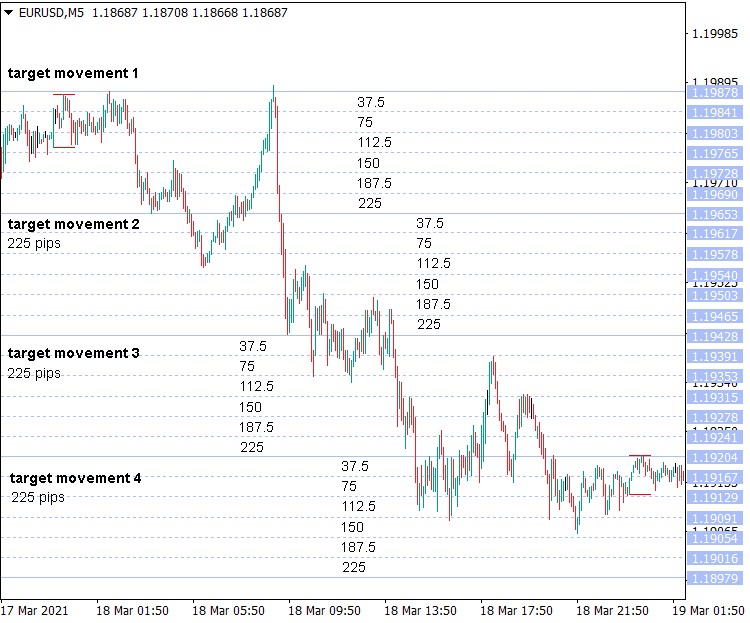
Deviation and balancing numbers (in pips):
37.5
75
112.5
150
187.5
225
Confirmation that EURUSD is the basis for corrections on other pairs was provided by the following research: if, according to a trading algorithm (any), you open orders at an arbitrary time and flat place within a day, the rate in most cases goes to some deviation and then it is corrected back to the open point. For EURUSD, this deviation usually does not exceed 37.5 pips. Rarely it reaches 75 pips and more. For other pairs these deviations are not stable — often they exceed the standard deviation of 37.5 pips. In general, only EURUSD has the most confident behavior in terms of these values. The rest of the dependent pairs are "more nervous".
Also, these numbers are responsible for the target rate movement within the day. 225 pips is the standard unit for one move to the target per day (one way). There can be moves of 4-5 units per day (one way), i.e. 900 - 1125 pips. Mainly these are 2-3 units of targeted movement per day.
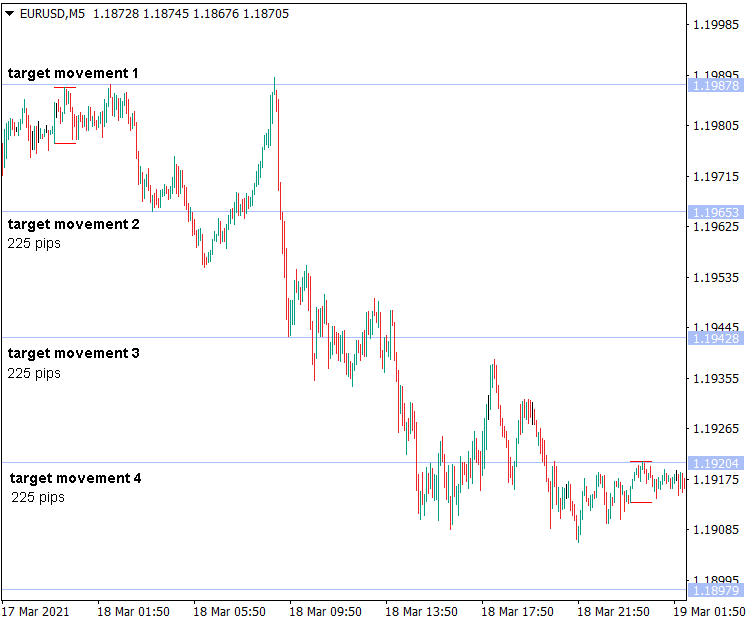
These numbers are displayed as follows on charts: 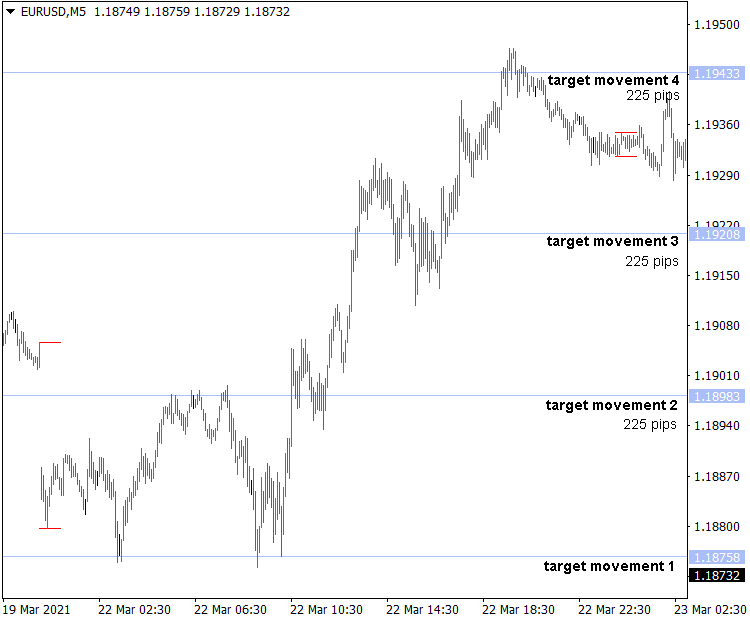
Here is the full presentation of values:
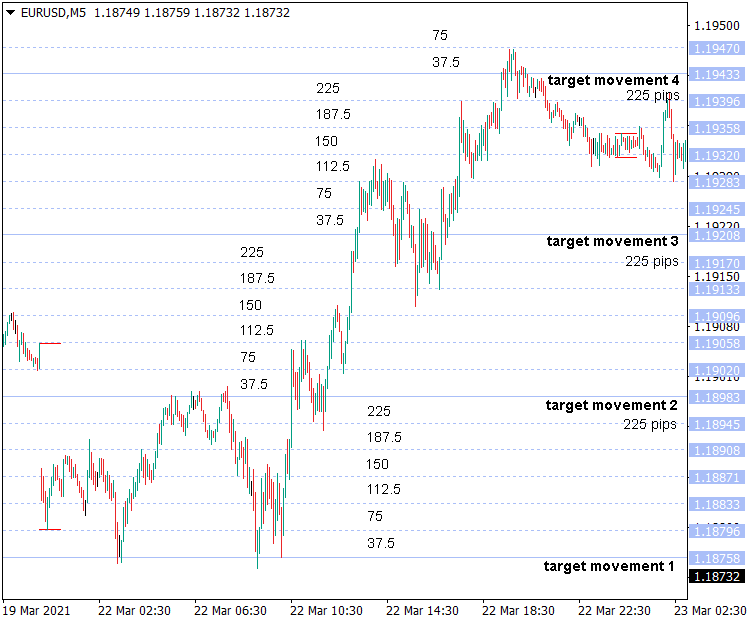
Another example:
Again, the full presentation of values:
For daily and weekly timeframes, the standard unit of the target movement is:
37.5 * 60 minutes = 2,250 pips
This, in a harmonious way, includes 10 units of target movements on 1-minute timeframes (2,250/225).
I am sure these numbers can be useful for traders, though these values can change over time. Even in this case, the combinational scalping can make a new digital analysis and find new balancing and movement numbers.
The method
Thank you for your time!
Translated from Russian by MetaQuotes Ltd.
Original article: https://www.mql5.com/ru/articles/9231
Warning: All rights to these materials are reserved by MetaQuotes Ltd. Copying or reprinting of these materials in whole or in part is prohibited.
This article was written by a user of the site and reflects their personal views. MetaQuotes Ltd is not responsible for the accuracy of the information presented, nor for any consequences resulting from the use of the solutions, strategies or recommendations described.

 Tips from a professional programmer (Part I): Code storing, debugging and compiling. Working with projects and logs
 MVC design pattern and its possible application
- Free trading apps
- Over 8,000 signals for copying
- Economic news for exploring financial markets
You agree to website policy and terms of use
New article Combination scalping: analyzing trades from the past to increase the performance of future trades has been published:
Author: Oleg Besedin
As part of the research of this "Combination Scalping Method", Agreed Forex Levels were found. This is briefly written at the end of the this article. Since then, I have devoted all my time to exploring these levels. And the preliminary results are impressive! Even simple trading algorithms work effectively, and there are many options for trading strategies. Research for the years ahead!
GBPUSD, H1
Each level (horizontal line) is 225 pips.
Examples of other trading weeks and Agreed Forex Levels:Each dot is a 225 pips movement.
Total pips per week = 11025 pips
Total pips per week = 7650 pips
Total pips per week = 8325 pips
Total pips per week = 21825 pips. 2182 points per week!
Who is looking for the treasure? Here it is! You just need to take it.