
Tips for Selecting a Trading Signal to Subscribe. Step-By-Step Guide

Introduction
Trading on financial markets is a pretty large sphere which involves a lot of people and a lot of valuable assets. Successful trading in your preferred market sector requires its deep analysis, further development of your own trading system and, of course, acquisition of steel hard discipline and composure. Some people do not have time for this, but they have an aspiration to make their financial means work and provide a benefit. The Signals service of the MQL5.com site helps to solve this problem. This article is dedicated to the system approach to the search of a required signal which would satisfy criteria of profitability, risk, trading ambitions, working on various types of accounts and financial instruments.
Trading Signals Service
Let's consider initial searching tools on the Signals service page.

Fig.1. Homepage of the Signals service
Fig.1 shows three main areas:
- In the first area you can select a terminal — MetaTrader 4 or MetaTrader 5 — where the service will be used.
- The second area offers a list of manuals and tutorials devoted to trading signals.
- The third area allows to see top rated systems in each category for both terminals.
Here it is important to select a necessary category, i.e. a list of offered signals for your trading terminal.

Fig.2. Selecting a broker and sorting trading signals
After you have selected a trading platform, the service offers a very handy filter for selecting a broker and assorts trading signals which also work with this broker. Advantages of such filter are obvious:
- You do not need to study the whole variety of brokers and operating conditions of their accounts.
- If you have selected trading signals with a necessary broker, it will be easier to know the ropes and draw samples on the assumption of a selected account type.
- It will be easier to compare volumes used by a trading signal provider with your financial possibilities. Further information on this subject is available in General Information on Trading Signals for MetaTrader 4 and MetaTrader 5.
On the right side you can find a dropdown menu for sorting trading signals using following parameters:
- Rating. General cumulative rating of the system.
- Growth. Current money resources on a trading signal as percentage from the initial balance.
- Equity. Current money resources on a trading signal account.
- Pips. Amount of net profitable points, i.e. amount of points of profitable trades excluding points of unprofitable trades.
- Date created. When the signal became available.
- Price. Monthly signal subscription fee.
- Subscribers. Amount of the trading signal subscribers.
Searching Signals Using Particular Criteria
On Fig.2 we did not review the Filter dropdown menu, which will be the first step of selecting a correct signal.
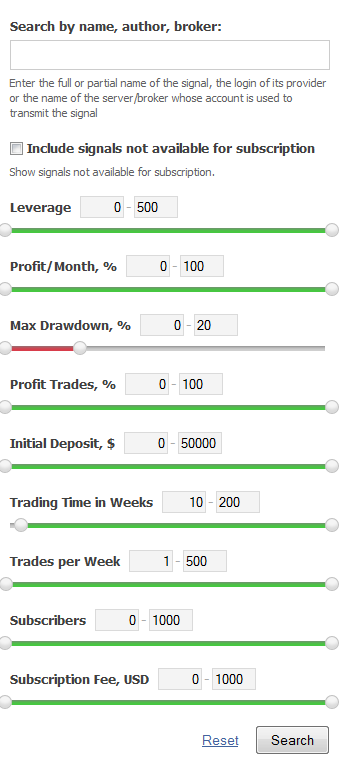
Fig.3. Filter of trading signals
Let's take a closer look at criteria of the search:
- Search by name, author and broker. You can compare signals of one author or terms of one broker.
- Signals not available for subscription. Signals which cannot be copied will also be displayed. For example, a paid signal awaiting for the provider to be registered in a Seller status.
- Leverage. Maximum leverage used in trading by the signal provider.
- Monthly profit as percentage of the initial balance.
- Maximum drawdown of the signal as percentage of the balance/equity.
- Percentage of profitable trades for the whole history of the trading signal.
- Initial deposit of the trading signal.
- Number of weeks. Trading signal lifetime.
- Trades per week. This is also a characteristic of trading frequency.
- Number of subscribers.
- Subscription fee. Zero means free subscription. Minimum fee for paid subscription is $20.
Fig.3 gives an example with initial parameters of searching trading signals. But we have selected maximum drawdown no greater than 20%, which filters out too risky signals but it can also limit your profit. Besides, we have selected trading signals having lifetime not exceeding 10 weeks and at least 1 trade per week.
Characteristics of Trading Signals
For the sake of clarity, we have selected the very first trading signal appeared after filtration.
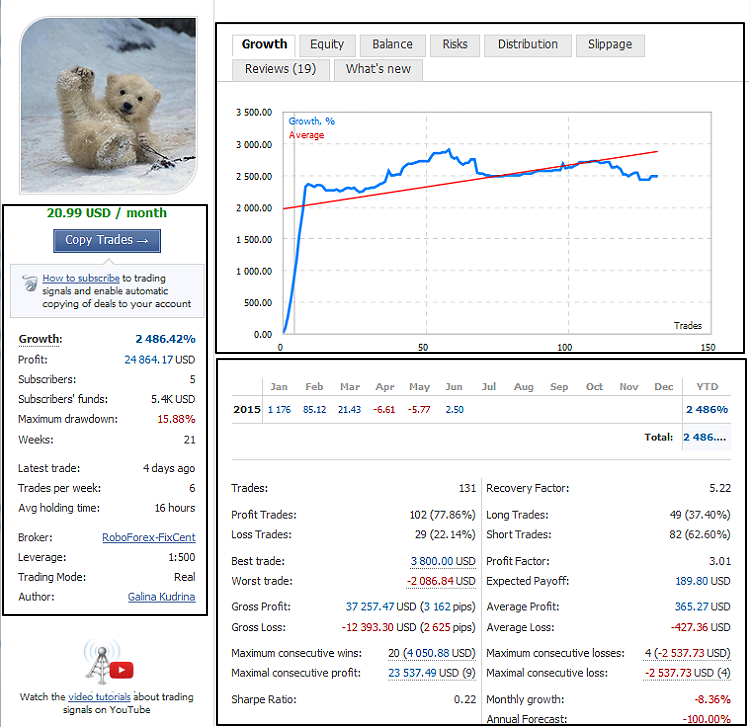
Fig.4. The main page of the trading signal
Basic parameters of the left information block include the following:
- Monthly fee for the trading signal. A button for copying the signal and a reference to the manual are located below.
- Growth. Cumulative growth as percentage of the initial balance.
- Net profit.
- Number of subscribers and total amount of funds on their real accounts.
- Maximum drawdown of the signal. Here maximum drawdown is 15.88%, which is a pretty good result and means that the signal provider's trading style does not involve a high risk.
- Weeks. Trading signal lifetime.
- The latest trade. An average number of trades per week and time of holding trades open.
- The last section indicates the broker of the provider and the account type. Maximum leverage is 1:500. Trading mode — Real is also an important parameter. It means that trading with this signal is performed with real money. At the end of the list we can also see the author, i.e. the signal provider.
The upper right block demonstrates the trading chart. The vertical axis indicates the growth of the initial balance in percentage terms, the horizontal axis indicates number of trades. This chart also demonstrates a straight average line which shows a trend and successfulness of the signal.
The lower right block is a core of the main analysis of the trading signal, provider's trading style and even possible unobvious nuances which are not seen on the chart or in the left information block.
In the upper part you can see a monthly growth/loss in percentage terms and total growth for the whole history. If you click on a particular month, the chart shows trades only for this month.
The left column shows a total number of completed trades. On the right side you can see the recovery factor: the higher its value, the faster the signal provider recovers from drawdown.
The number and percentage of profitable and unprofitable trades are specified on the left side. High percentage of profitable trades can be partially caused by success of the trading system, but do not rely upon this to the fullest extent and do not draw a conclusion about successfulness basing only on this parameter. On the right side you will see the number and total percentage of buy or sell trades. It can characterize trading style within particular time periods, for example, trading with a trend, against a trend, on rollbacks.
The best and the worst trades. A kind of the best and the worst performance of the signal provider. The worst trade will implicitly help you to judge upon a sum and percentage of the deposit, which the signal provider is ready to lose being in an unprofitable position. There is a profit factor on the right side which shows what fold profit of successful trades exceeds losses of unsuccessful trades. Expected payoff indicates mean statistical profit form every trade, i.e. if the provider enters the market, then statistically she will get $189.80 of profit from this open position (Fig.4).
Gross profit and loss in terms of money and number of points. Average values of profitable and losing trades are specified on the right side. In the given example an average loss is higher, but we should keep in mind that there are 77.86% of profitable trades. Thus, statistics shows that every 2 profitable trades with $365.27 of profit have one losing trade with $427.36 of loss.
Maximum consecutive wins/losses represent a number of trades and a sum of profit or loss. Maximal consecutive profit/loss is a sum and its corresponding consecutive trades.
Sharpe Ratio is a factor which connects profitability and risk. But its main disadvantage is that it can be really undersized in case of deviation from mean value. On the right side you can see growth for the last month and annual forecast based on this growth.
Among other important characteristics of trading signals, I would like to draw your attention to the Equity tab on Fig.5. The chart demonstrates changes in equity towards the balance, characterizes riskiness of trades and propensity for "sitting out" losses which may further lead to closing a position with large drawdown in case of an adverse movement. That may indicate that the provider does not use stops or places them unreasonably far.
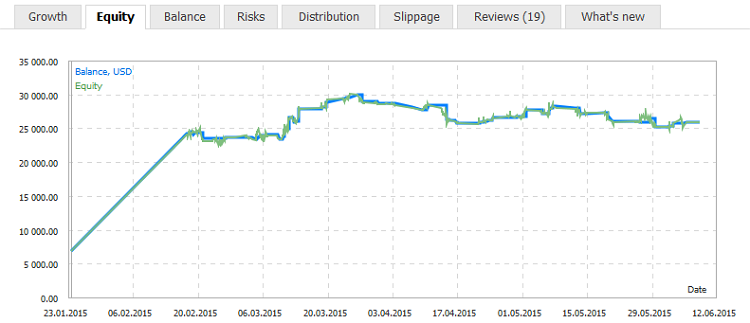
Fig.5. Balance and equity of the selected trading signal
Fig.5 demonstrates that the signal provider carefully follows her money management strategy. Significant drawdowns are not allowed though deposit was boosted at the beginning. Now it runs in place.
Three Steps of Selecting Trading Signal
Step No.1. Making a decision upon the type of a trading terminal, broker, risks and expected profitability
The first step must be selecting a trading terminal — MetaTrader 4 or MetaTrader 5. No matter how simple it seems, this is an essential step for avoiding a situation when a trading signal is selected for a wrong platform. Then we have to decide what risks are acceptable for us, i.e. what drawdown level you suppose to be reasonable and for what period, and what profit you expect from a trading signal.
Important! It is to be understood that the higher is the expected profit, the higher is the risk, possible drawdown or its duration. There are no trading signals with high profitability and low risk. As an example I have selected following parameters in the first step of search.
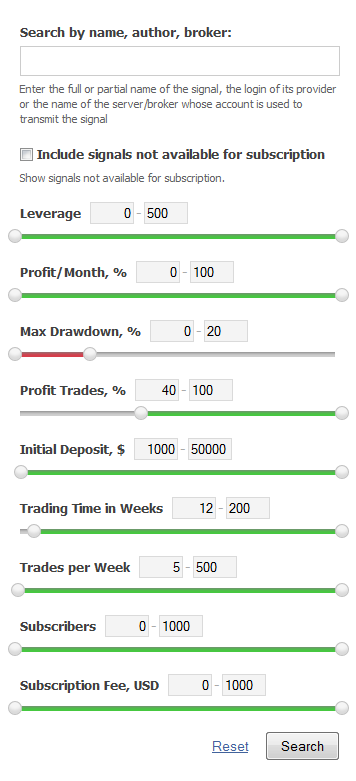
Fig.6. Selecting search criteria
On the basis of the search criteria we can briefly formulate our choice:
- Monthly profit may not have positive value all the time, i.e. small minus on monthly results is admissible.
- Nevertheless, maximum drawdown cannot exceed 20%.
- At least 40% of profitable trades.
- Initial deposit of the provider cannot be less than $1000.
- Trading signal lifetime can not be less than 12 weeks which makes about 3 months. It is enough for further examination of the signal.
- Trades per week: average number of trades is at least one per day.
As shown in Fig.2, we select Roboforex-FixCent as a broker and sorting by rating. Search criteria are quite mild, so we select the top position in the rating for examination. Key characteristics above have been described on its example.
Step No.2. Scrutinizing statistics, determining trading style, getting an overall picture of a trading signal
Let's explore positive aspects on the selected trading signal:
- Growth is over 2400%.
- Maximum drawdown is 15.88%, which even lower than the threshold set in the filter — 20%.
- Account lifetime is over 20 weeks.
- Percentage of trade profitability is 77.86%
- Recovery factor is 5.22.
- Profit factor is 3.01.
- As can be seen on Fig.5, there are no intense drawdown.
Regard must also be paid to the following:
Fig.4 shows that January growth was 1176%. This is an indication of intense deposit boosting. But trading was moderate in February/March. It's advisable to avoid signals which use boosting and consider signals with smooth growth of profit.
Fig.7 shows history of last trades of the given signal. Number of involved trading instruments is suspicious. It is better to select signals with at least implicit trading systemacity, i.e. trading is performed by 1-3 relative pairs, as systemless jumping from one pair to another usually reminds playing roulette.
Irregularity and heavy dispersion of trading volume, especially on a large number of trading instruments, cannot be an advantage of this signal. Subscribers usually feel safer when the lot increases along with the balance or can be checked against accuracy of the signal in the provider's trading system.
The recent trading tendency is as follows: abundance of small profits intersperse with demolishing large stop losses. That is why the process runs in place.
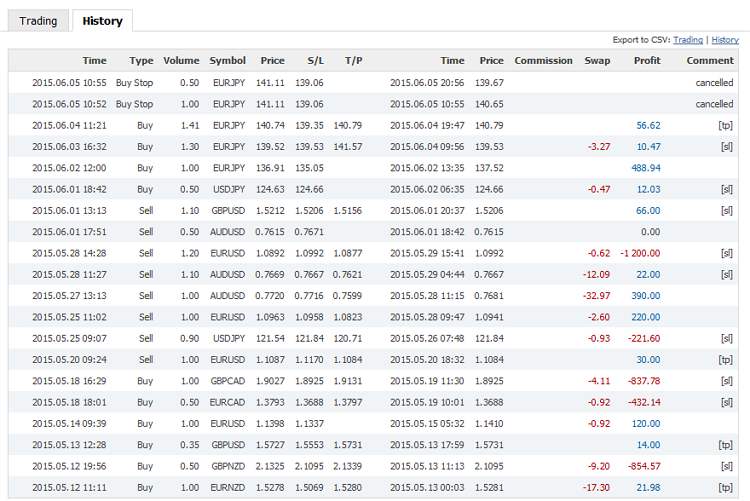
Fig.7. History of trading signal trades
Step No.3. Correlation of advantages and disadvantages. Drawing conclusions, delivering personal verdict
General conclusions on the basis of positive and negative factors can be as follows:
- The deposit was boosted which is a sort of a lottery.
- Then the trading becomes mild, but unfortunately it does not yield any outcome due to unsystematic character of lots and selection of trading instruments.
- Percentage of profitable trades by means of numerous small profits which are brought to nought by larger yet rarer stop losses.
Basing on the above mentioned, we can draw following conclusion: deposit is boosted but then the process runs in place.
General Features of Trading Signals with Different Risk Levels
The Signals service offers quite a broad list of characteristics allowing to draw a conclusion about one or another signal. This section is devoted to some brief recommendations, which are surely my personal vision of selecting appropriate trading signals.
Trading signals with low risk level and small profitability.
- Signal lifetime is at least 3-5 months.
- Maximum drawdown cannot exceed 20%.
- Trading reasonable lot with low deposit load (about 2-5%).
- Trading is performed with 1-3 instruments.
- The Balance tab does not have dramatic divergence between equity/balance lines.
- The deposit is not boosted at the beginning. The growth curve is smooth and does not have abrupt jumps.
- The trading system is usually medium-term and monthly profit is about 5-15%.
Trading signals with medium risk level and moderate profitability.
- Lifetime is at least 20-25 weeks.
- Maximum drawdown cannot exceed 40%.
- Deposit load cannot be over 10-15%.
- Trading is performed with 1-3 instruments.
- There are small divergence between equity and balance lines. It indicates that the provider accepts bigger possible loss and higher risk level.
- The growth curve can have some abrupt jumps.
- Monthly profit can start from 30-50%.
Trading signals with high risk level and profitability.
- Lifetime is at least 2-3 months.
- Maximum drawdown is up to 50-60%
- There might be significant deposit load in particular trades.
- Drawdown of the equity curve can be pretty long and notable.
- It is desirable that the profit factor has a high value.
- Monthly profit can be over 100%.
Conclusion
In this article, we have reviewed the main aspects of selecting and examining trading signals. We can conclude that to find a high-quality signal appropriate for your trading, you have to perform an in-depth analysis and take into account all peculiarities of its characteristics, trading style of the signal provider, and you also have to realize and determine the risk level. Be careful performing an analysis! Wish you to make a right choice!
Translated from Russian by MetaQuotes Ltd.
Original article: https://www.mql5.com/ru/articles/1838
Warning: All rights to these materials are reserved by MetaQuotes Ltd. Copying or reprinting of these materials in whole or in part is prohibited.
This article was written by a user of the site and reflects their personal views. MetaQuotes Ltd is not responsible for the accuracy of the information presented, nor for any consequences resulting from the use of the solutions, strategies or recommendations described.

 MQL5 Cookbook: Implementing an Associative Array or a Dictionary for Quick Data Access
 Tips for Purchasing a Product on the Market. Step-By-Step Guide
- Free trading apps
- Over 8,000 signals for copying
- Economic news for exploring financial markets
You agree to website policy and terms of use
Informative.
Thank you.