
MQL5 Trading Tools (Part 4): Improving the Multi-Timeframe Scanner Dashboard with Dynamic Positioning and Toggle Features
Introduction
In our previous article (Part 3), we developed a Multi-Timeframe Scanner Dashboard in MetaQuotes Language 5 (MQL5), displaying Relative Strength Index (RSI), Stochastic, Commodity Channel Index (CCI), Average Directional Index (ADX), and Awesome Oscillator (AO) indicators across multiple timeframes to identify trading signals for the current symbol. In Part 4, we enhance this dashboard by adding dynamic positioning to allow dragging across the chart and a toggle feature to minimize or maximize the display, improving usability and screen management. We will cover the following topics:
- Understanding the Dynamic Positioning and Toggle Architecture
- Implementation in MQL5
- Backtesting
- Conclusion
By the end, you’ll have an advanced MQL5 dashboard with flexible positioning and toggle functionality, ready for testing and further customization—let’s get started!
Understanding the Dynamic Positioning and Toggle Architecture
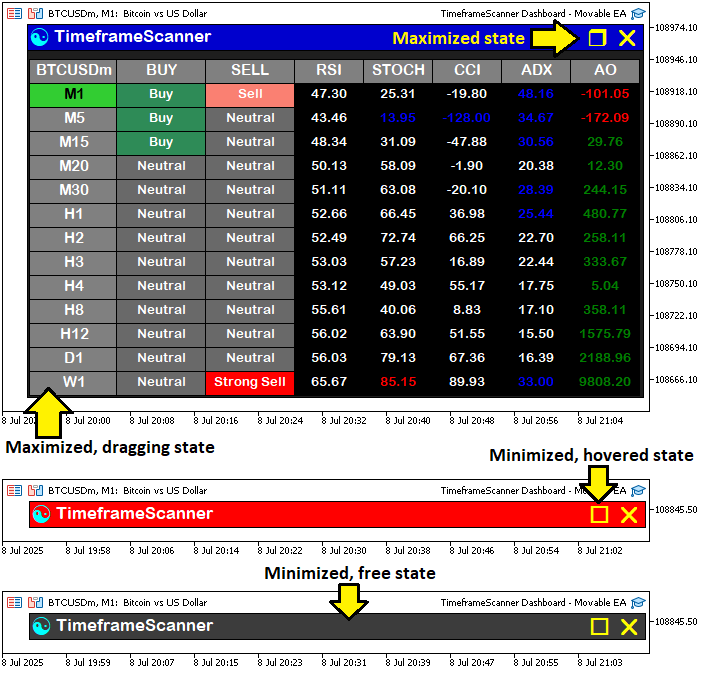
We’re enhancing our Multi-Timeframe Scanner Dashboard by adding dynamic positioning, allowing it to be dragged across the chart, and a toggle to minimize or maximize it, thereby improving usability. These features are essential for avoiding chart clutter and optimizing screen space for efficient trading analysis. We will implement mouse-driven dragging to reposition the dashboard and a toggle button to switch between compact and full views, maintaining seamless indicator updates for better trading decisions. In a nutshell, here is a visualization of what we aim to achieve.
Implementation in MQL5
To implement the enhancements in MQL5, we will define the extra toggle button object that we will use later for switching between maximized and minimized states, as the hover and drag will be done on the header object, which we already have in the implementation.
// Define identifiers and properties for UI elements
#define MAIN_PANEL              "PANEL_MAIN"                     //--- Main panel rectangle identifier

//--- THE REST OF THE EXISTING OBJECTS

#define TOGGLE_BUTTON           "BUTTON_TOGGLE"                  //--- Toggle (minimize/maximize) button identifier

//--- THE REST OF THE EXISTING OBJECTS

#define COLOR_DARK_GRAY         C'105,105,105'                   //--- Dark gray color for indicator backgrounds
We start the enhancement of our Multi-Timeframe Scanner Dashboard by updating the User Interface (UI) element definitions to include a new identifier for the toggle button, supporting our goal of adding minimize/maximize functionality. We retain the existing definitions to maintain the dashboard’s core structure. The key change is the addition of the "TOGGLE_BUTTON" identifier, defined as "BUTTON_TOGGLE", which will allow us to create a button for toggling the dashboard between minimized and maximized states.
This addition is crucial as it will enable the new toggle feature, giving us the ability to collapse the dashboard to save screen space or expand it for full visibility, improving usability without altering the existing indicator display logic. Then, we will need some more control over global variables, which we will use to store the dashboard states.
bool panel_minimized = false;                                    //--- Flag to control minimized state
int panel_x = 632, panel_y = 40;                                 //--- Panel position coordinates
bool panel_dragging = false;                                     //--- Flag to track if panel is being dragged
int panel_drag_x = 0, panel_drag_y = 0;                          //--- Mouse coordinates when drag starts
int panel_start_x = 0, panel_start_y = 0;                        //--- Panel coordinates when drag starts
int prev_mouse_state = 0;                                        //--- Variable to track previous mouse state
bool header_hovered = false;                                     //--- Header hover state
bool toggle_hovered = false;                                     //--- Toggle button hover state
bool close_hovered = false;                                      //--- Close button hover state
int last_mouse_x = 0, last_mouse_y = 0;                          //--- Track last mouse position for optimization
bool prev_header_hovered = false;                                //--- Track previous header hover state
bool prev_toggle_hovered = false;                                //--- Track previous toggle hover state
bool prev_close_hovered = false;                                 //--- Track previous close button hover state
To help track the dashboard states, we add some global variables. We introduce "panel_minimized" to track the minimized state, "panel_x" and "panel_y" for the dashboard’s position, and "panel_dragging", "panel_drag_x", "panel_drag_y", "panel_start_x", and "panel_start_y" for dragging. We also add "prev_mouse_state", "header_hovered", "toggle_hovered", "close_hovered", "last_mouse_x", "last_mouse_y", "prev_header_hovered", "prev_toggle_hovered", and "prev_close_hovered" to manage mouse events and hover states. These will enable a draggable, interactive dashboard with toggle support.
We can then move on to adding the toggle button to the dashboard. To manage the switch states, we will need to have the creation logic in separate functions for both the maximized and minimized panels. Let's start with the maximized dashboard.
//+------------------------------------------------------------------+
//| Create full dashboard UI                                         |
//+------------------------------------------------------------------+
void create_full_dashboard() {
   create_rectangle(MAIN_PANEL, panel_x, panel_y, 617, 374, C'30,30,30', BORDER_FLAT); //--- Create main panel background
   create_rectangle(HEADER_PANEL, panel_x, panel_y, 617, 27, C'60,60,60', BORDER_FLAT); //--- Create header panel background
   create_label(HEADER_PANEL_ICON, CharToString(91), panel_x - 12, panel_y + 14, 18, clrAqua, "Wingdings"); //--- Create header icon
   create_label(HEADER_PANEL_TEXT, "TimeframeScanner", panel_x - 105, panel_y + 12, 13, COLOR_WHITE); //--- Create header title
   create_label(CLOSE_BUTTON, CharToString('r'), panel_x - 600, panel_y + 14, 18, clrYellow, "Webdings"); //--- Create close button
   create_label(TOGGLE_BUTTON, CharToString('r'), panel_x - 570, panel_y + 14, 18, clrYellow, "Wingdings"); //--- Create minimize button (-)

   // Create header rectangle and label
   create_rectangle(SYMBOL_RECTANGLE, panel_x - 2, panel_y + 35, WIDTH_TIMEFRAME, HEIGHT_RECTANGLE, clrGray); //--- Create symbol rectangle
   create_label(SYMBOL_TEXT, _Symbol, panel_x - 47, panel_y + 45, 11, COLOR_WHITE); //--- Create symbol label

   // Create summary and indicator headers (rectangles and labels)
   string header_names[] = {"BUY", "SELL", "RSI", "STOCH", "CCI", "ADX", "AO"}; //--- Define header titles
   for(int header_index = 0; header_index < ArraySize(header_names); header_index++) { //--- Loop through headers
      int x_offset = panel_x - WIDTH_TIMEFRAME - (header_index < 2 ? header_index * WIDTH_SIGNAL : 2 * WIDTH_SIGNAL + (header_index - 2) * WIDTH_INDICATOR) + (1 + header_index); //--- Calculate x position
      int width = (header_index < 2 ? WIDTH_SIGNAL : WIDTH_INDICATOR); //--- Set width based on header type
      create_rectangle(HEADER_RECTANGLE + IntegerToString(header_index), x_offset, panel_y + 35, width, HEIGHT_RECTANGLE, clrGray); //--- Create header rectangle
      create_label(HEADER_TEXT + IntegerToString(header_index), header_names[header_index], x_offset - width/2, panel_y + 45, 11, COLOR_WHITE); //--- Create header label
   }

   // Create timeframe rectangles and labels, and summary/indicator cells
   for(int timeframe_index = 0; timeframe_index < ArraySize(timeframes_array); timeframe_index++) { //--- Loop through timeframes
      // Highlight current timeframe
      color timeframe_background = (timeframes_array[timeframe_index] == _Period) ? clrLimeGreen : clrGray; //--- Set background color for current timeframe
      color timeframe_text_color = (timeframes_array[timeframe_index] == _Period) ? COLOR_BLACK : COLOR_WHITE; //--- Set text color for current timeframe

      create_rectangle(TIMEFRAME_RECTANGLE + IntegerToString(timeframe_index), panel_x - 2, (panel_y + 35 + HEIGHT_RECTANGLE) + timeframe_index * HEIGHT_RECTANGLE - (1 + timeframe_index), WIDTH_TIMEFRAME, HEIGHT_RECTANGLE, timeframe_background); //--- Create timeframe rectangle
      create_label(TIMEFRAME_TEXT + IntegerToString(timeframe_index), truncate_timeframe_name(timeframe_index), panel_x - 47, (panel_y + 45 + HEIGHT_RECTANGLE) + timeframe_index * HEIGHT_RECTANGLE - (1 + timeframe_index), 11, timeframe_text_color); //--- Create timeframe label

      // Create summary and indicator cells
      for(int header_index = 0; header_index < ArraySize(header_names); header_index++) { //--- Loop through headers for cells
         string cell_rectangle_name, cell_text_name;              //--- Declare cell name and label variables
         color cell_background = (header_index < 2) ? COLOR_LIGHT_GRAY : COLOR_BLACK; //--- Set cell background color
         switch(header_index) {                                   //--- Select cell type
            case 0: cell_rectangle_name = BUY_RECTANGLE + IntegerToString(timeframe_index); cell_text_name = BUY_TEXT + IntegerToString(timeframe_index); break; //--- Buy cell
            case 1: cell_rectangle_name = SELL_RECTANGLE + IntegerToString(timeframe_index); cell_text_name = SELL_TEXT + IntegerToString(timeframe_index); break; //--- Sell cell
            case 2: cell_rectangle_name = RSI_RECTANGLE + IntegerToString(timeframe_index); cell_text_name = RSI_TEXT + IntegerToString(timeframe_index); break; //--- RSI cell
            case 3: cell_rectangle_name = STOCH_RECTANGLE + IntegerToString(timeframe_index); cell_text_name = STOCH_TEXT + IntegerToString(timeframe_index); break; //--- Stochastic cell
            case 4: cell_rectangle_name = CCI_RECTANGLE + IntegerToString(timeframe_index); cell_text_name = CCI_TEXT + IntegerToString(timeframe_index); break; //--- CCI cell
            case 5: cell_rectangle_name = ADX_RECTANGLE + IntegerToString(timeframe_index); cell_text_name = ADX_TEXT + IntegerToString(timeframe_index); break; //--- ADX cell
            case 6: cell_rectangle_name = AO_RECTANGLE + IntegerToString(timeframe_index); cell_text_name = AO_TEXT + IntegerToString(timeframe_index); break; //--- AO cell
         }
         int x_offset = panel_x - WIDTH_TIMEFRAME - (header_index < 2 ? header_index * WIDTH_SIGNAL : 2 * WIDTH_SIGNAL + (header_index - 2) * WIDTH_INDICATOR) + (1 + header_index); //--- Calculate x position
         int width = (header_index < 2 ? WIDTH_SIGNAL : WIDTH_INDICATOR); //--- Set width based on cell type
         create_rectangle(cell_rectangle_name, x_offset, (panel_y + 35 + HEIGHT_RECTANGLE) + timeframe_index * HEIGHT_RECTANGLE - (1 + timeframe_index), width, HEIGHT_RECTANGLE, cell_background); //--- Create cell rectangle
         create_label(cell_text_name, "-/-", x_offset - width/2, (panel_y + 45 + HEIGHT_RECTANGLE) + timeframe_index * HEIGHT_RECTANGLE - (1 + timeframe_index), 10, COLOR_WHITE); //--- Create cell label
      }
   }
   ChartRedraw(0);
}
We implement the dashboard states by creating the "create_full_dashboard" function, moving the static creation logic to it, and updating it to support dynamic positioning and toggle functionality. The primary change is integrating the "panel_x" and "panel_y" variables into the positioning of all dashboard elements, allowing the dashboard to be placed anywhere on the chart. We create the main panel with "create_rectangle" using "MAIN_PANEL", "panel_x", and "panel_y" for the position, maintaining the 617x374 size. Similarly, we position the header panel, icon, and title using "create_rectangle" and "create_label" for "HEADER_PANEL", "HEADER_PANEL_ICON", and "HEADER_PANEL_TEXT", adjusting their x and y coordinates relative to "panel_x" and "panel_y".
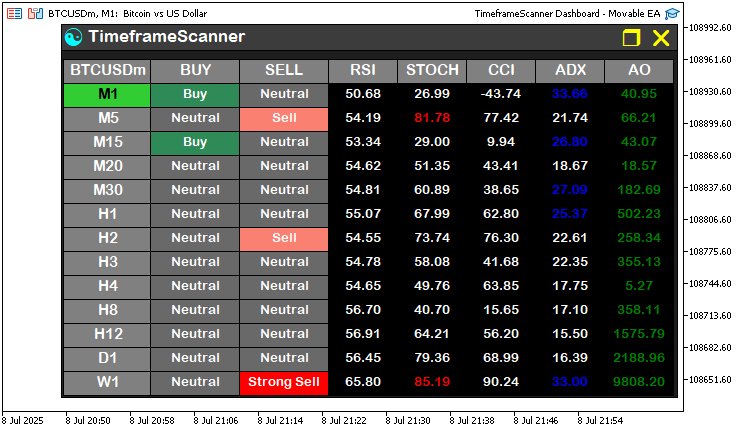
We add the new "TOGGLE_BUTTON" with "create_label", placing it at "panel_x - 570" and "panel_y + 14", displaying a minimize symbol ('r' in Webdings). The symbol rectangle and label ("SYMBOL_RECTANGLE" and "SYMBOL_TEXT") and header rectangles and labels ("HEADER_RECTANGLE" and "HEADER_TEXT") use "panel_x" and "panel_y" for their x and y offsets, ensuring they move with the panel. For each timeframe in "timeframes_array", we create timeframe rectangles and labels ("TIMEFRAME_RECTANGLE" and "TIMEFRAME_TEXT") and indicator cells ("RSI_RECTANGLE", "STOCH_RECTANGLE", etc.) with positions calculated relative to "panel_x" and "panel_y", preserving the layout but making it relocatable. We call the ChartRedraw function to update the display. Unlike the previous version’s fixed coordinates (e.g., 632, 40), this function uses dynamic coordinates, enabling the dashboard to be dragged, and adds a toggle button for minimizing/maximizing. We will get something that resembles the below sample.
We can then have a function to create the minimized panel.
//+------------------------------------------------------------------+
//| Create minimized dashboard UI                                    |
//+------------------------------------------------------------------+
void create_minimized_dashboard() {
   create_rectangle(HEADER_PANEL, panel_x, panel_y, 617, 27, C'60,60,60', BORDER_FLAT); //--- Create header panel background
   create_label(HEADER_PANEL_ICON, CharToString(91), panel_x - 12, panel_y + 14, 18, clrAqua, "Wingdings"); //--- Create header icon
   create_label(HEADER_PANEL_TEXT, "TimeframeScanner", panel_x - 105, panel_y + 12, 13, COLOR_WHITE); //--- Create header title
   create_label(CLOSE_BUTTON, CharToString('r'), panel_x - 600, panel_y + 14, 18, clrYellow, "Webdings"); //--- Create close button
   create_label(TOGGLE_BUTTON, CharToString('o'), panel_x - 570, panel_y + 14, 18, clrYellow, "Wingdings"); //--- Create maximize button (+)
   ChartRedraw(0);
}
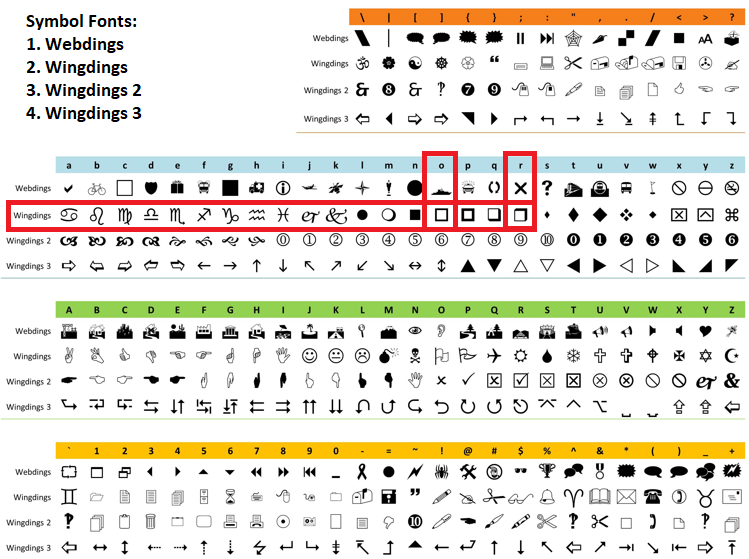
To support toggling to a compact view, we define the "create_minimized_dashboard" function. We create the header panel with "create_rectangle" for "HEADER_PANEL" at "panel_x" and "panel_y", add "HEADER_PANEL_ICON" and "HEADER_PANEL_TEXT" with "create_label" for the icon and title, include "CLOSE_BUTTON", and add "TOGGLE_BUTTON" with a maximize symbol ('o' in Webdings) at "panel_x - 570" and "panel_y + 14". We call "ChartRedraw" to update the display, enabling a movable, minimized dashboard state. As you might have noticed, we chose the Wingdings font for both the maximize and minimize buttons because of consistency. You can choose any of your like. In our case, the icon characters are 'r' and 'o' respectively. Here is a centralized view of them.
When you run the minimized panel state, you get the following outcome.

Armed with the functions, we can choose whichever to use based on the user command. Now, since we created several objects, we can centralize the deletion of all the objects in a function because we will need to delete the objects and create them again automatically.
//+------------------------------------------------------------------+
//| Delete all dashboard objects                                     |
//+------------------------------------------------------------------+
void delete_all_objects() {
   ObjectDelete(0, MAIN_PANEL);                                  //--- Delete main panel
   ObjectDelete(0, HEADER_PANEL);                                //--- Delete header panel
   ObjectDelete(0, HEADER_PANEL_ICON);                           //--- Delete header icon
   ObjectDelete(0, HEADER_PANEL_TEXT);                           //--- Delete header title
   ObjectDelete(0, CLOSE_BUTTON);                                //--- Delete close button
   ObjectDelete(0, TOGGLE_BUTTON);                               //--- Delete toggle button

   ObjectsDeleteAll(0, SYMBOL_RECTANGLE);                        //--- Delete all symbol rectangles
   ObjectsDeleteAll(0, SYMBOL_TEXT);                             //--- Delete all symbol labels
   ObjectsDeleteAll(0, TIMEFRAME_RECTANGLE);                     //--- Delete all timeframe rectangles
   ObjectsDeleteAll(0, TIMEFRAME_TEXT);                          //--- Delete all timeframe labels
   ObjectsDeleteAll(0, HEADER_RECTANGLE);                        //--- Delete all header rectangles
   ObjectsDeleteAll(0, HEADER_TEXT);                             //--- Delete all header labels
   ObjectsDeleteAll(0, RSI_RECTANGLE);                           //--- Delete all RSI rectangles
   ObjectsDeleteAll(0, RSI_TEXT);                                //--- Delete all RSI labels
   ObjectsDeleteAll(0, STOCH_RECTANGLE);                         //--- Delete all Stochastic rectangles
   ObjectsDeleteAll(0, STOCH_TEXT);                              //--- Delete all Stochastic labels
   ObjectsDeleteAll(0, CCI_RECTANGLE);                           //--- Delete all CCI rectangles
   ObjectsDeleteAll(0, CCI_TEXT);                                //--- Delete all CCI labels
   ObjectsDeleteAll(0, ADX_RECTANGLE);                           //--- Delete all ADX rectangles
   ObjectsDeleteAll(0, ADX_TEXT);                                //--- Delete all ADX labels
   ObjectsDeleteAll(0, AO_RECTANGLE);                            //--- Delete all AO rectangles
   ObjectsDeleteAll(0, AO_TEXT);                                 //--- Delete all AO labels
   ObjectsDeleteAll(0, BUY_RECTANGLE);                           //--- Delete all buy rectangles
   ObjectsDeleteAll(0, BUY_TEXT);                                //--- Delete all buy labels
   ObjectsDeleteAll(0, SELL_RECTANGLE);                          //--- Delete all sell rectangles
   ObjectsDeleteAll(0, SELL_TEXT);                               //--- Delete all sell labels
}
To have more control over when to delete our objects, we create and update the "delete_all_objects" function to include the removal of the new "TOGGLE_BUTTON", supporting our toggle functionality improvement. We add the ObjectDelete function for "TOGGLE_BUTTON" to the list of objects being removed, ensuring the toggle button is properly deleted when the dashboard is closed or toggled. We retain the deletion of all other objects, such as "MAIN_PANEL", "HEADER_PANEL", "HEADER_PANEL_ICON", "HEADER_PANEL_TEXT", "CLOSE_BUTTON", and all symbol, timeframe, header, indicator, and signal rectangles and labels using the ObjectsDeleteAll function. This change ensures our movable and minimizable dashboard cleans up all components, including the new toggle button, maintaining a tidy chart when the dashboard is hidden or reinitialized.
To enhance dynamic positioning, we will need to create a function that will create and update the dashboard elements based on the cursor position. Here is the logic we use to achieve that.
//+------------------------------------------------------------------+
//| Update panel object positions                                    |
//+------------------------------------------------------------------+
void update_panel_positions() {
   // Update header and buttons
   ObjectSetInteger(0, HEADER_PANEL, OBJPROP_XDISTANCE, panel_x); //--- Set header panel x position
   ObjectSetInteger(0, HEADER_PANEL, OBJPROP_YDISTANCE, panel_y); //--- Set header panel y position
   ObjectSetInteger(0, HEADER_PANEL_ICON, OBJPROP_XDISTANCE, panel_x - 12); //--- Set header icon x position
   ObjectSetInteger(0, HEADER_PANEL_ICON, OBJPROP_YDISTANCE, panel_y + 14); //--- Set header icon y position
   ObjectSetInteger(0, HEADER_PANEL_TEXT, OBJPROP_XDISTANCE, panel_x - 105); //--- Set header title x position
   ObjectSetInteger(0, HEADER_PANEL_TEXT, OBJPROP_YDISTANCE, panel_y + 12); //--- Set header title y position
   ObjectSetInteger(0, CLOSE_BUTTON, OBJPROP_XDISTANCE, panel_x - 600); //--- Set close button x position
   ObjectSetInteger(0, CLOSE_BUTTON, OBJPROP_YDISTANCE, panel_y + 14); //--- Set close button y position
   ObjectSetInteger(0, TOGGLE_BUTTON, OBJPROP_XDISTANCE, panel_x - 570); //--- Set toggle button x position
   ObjectSetInteger(0, TOGGLE_BUTTON, OBJPROP_YDISTANCE, panel_y + 14); //--- Set toggle button y position

   if (!panel_minimized) {
      // Update main panel
      ObjectSetInteger(0, MAIN_PANEL, OBJPROP_XDISTANCE, panel_x); //--- Set main panel x position
      ObjectSetInteger(0, MAIN_PANEL, OBJPROP_YDISTANCE, panel_y); //--- Set main panel y position

      // Update symbol rectangle and label
      ObjectSetInteger(0, SYMBOL_RECTANGLE, OBJPROP_XDISTANCE, panel_x - 2); //--- Set symbol rectangle x position
      ObjectSetInteger(0, SYMBOL_RECTANGLE, OBJPROP_YDISTANCE, panel_y + 35); //--- Set symbol rectangle y position
      ObjectSetInteger(0, SYMBOL_TEXT, OBJPROP_XDISTANCE, panel_x - 47); //--- Set symbol text x position
      ObjectSetInteger(0, SYMBOL_TEXT, OBJPROP_YDISTANCE, panel_y + 45); //--- Set symbol text y position

      // Update header rectangles and labels
      string header_names[] = {"BUY", "SELL", "RSI", "STOCH", "CCI", "ADX", "AO"};
      for(int header_index = 0; header_index < ArraySize(header_names); header_index++) { //--- Loop through headers
         int x_offset = panel_x - WIDTH_TIMEFRAME - (header_index < 2 ? header_index * WIDTH_SIGNAL : 2 * WIDTH_SIGNAL + (header_index - 2) * WIDTH_INDICATOR) + (1 + header_index); //--- Calculate x position
         ObjectSetInteger(0, HEADER_RECTANGLE + IntegerToString(header_index), OBJPROP_XDISTANCE, x_offset); //--- Set header rectangle x position
         ObjectSetInteger(0, HEADER_RECTANGLE + IntegerToString(header_index), OBJPROP_YDISTANCE, panel_y + 35); //--- Set header rectangle y position
         ObjectSetInteger(0, HEADER_TEXT + IntegerToString(header_index), OBJPROP_XDISTANCE, x_offset - (header_index < 2 ? WIDTH_SIGNAL/2 : WIDTH_INDICATOR/2)); //--- Set header text x position
         ObjectSetInteger(0, HEADER_TEXT + IntegerToString(header_index), OBJPROP_YDISTANCE, panel_y + 45); //--- Set header text y position
      }

      // Update timeframe rectangles, labels, and cells
      for(int timeframe_index = 0; timeframe_index < ArraySize(timeframes_array); timeframe_index++) { //--- Loop through timeframes
         int y_offset = (panel_y + 35 + HEIGHT_RECTANGLE) + timeframe_index * HEIGHT_RECTANGLE - (1 + timeframe_index); //--- Calculate y position
         ObjectSetInteger(0, TIMEFRAME_RECTANGLE + IntegerToString(timeframe_index), OBJPROP_XDISTANCE, panel_x - 2); //--- Set timeframe rectangle x position
         ObjectSetInteger(0, TIMEFRAME_RECTANGLE + IntegerToString(timeframe_index), OBJPROP_YDISTANCE, y_offset); //--- Set timeframe rectangle y position
         ObjectSetInteger(0, TIMEFRAME_TEXT + IntegerToString(timeframe_index), OBJPROP_XDISTANCE, panel_x - 47); //--- Set timeframe text x position
         ObjectSetInteger(0, TIMEFRAME_TEXT + IntegerToString(timeframe_index), OBJPROP_YDISTANCE, y_offset + 10); //--- Set timeframe text y position

         for(int header_index = 0; header_index < ArraySize(header_names); header_index++) { //--- Loop through cells
            string cell_rectangle_name, cell_text_name;
            switch(header_index) { //--- Select cell type
               case 0: cell_rectangle_name = BUY_RECTANGLE + IntegerToString(timeframe_index); cell_text_name = BUY_TEXT + IntegerToString(timeframe_index); break; //--- Buy cell
               case 1: cell_rectangle_name = SELL_RECTANGLE + IntegerToString(timeframe_index); cell_text_name = SELL_TEXT + IntegerToString(timeframe_index); break; //--- Sell cell
               case 2: cell_rectangle_name = RSI_RECTANGLE + IntegerToString(timeframe_index); cell_text_name = RSI_TEXT + IntegerToString(timeframe_index); break; //--- RSI cell
               case 3: cell_rectangle_name = STOCH_RECTANGLE + IntegerToString(timeframe_index); cell_text_name = STOCH_TEXT + IntegerToString(timeframe_index); break; //--- Stochastic cell
               case 4: cell_rectangle_name = CCI_RECTANGLE + IntegerToString(timeframe_index); cell_text_name = CCI_TEXT + IntegerToString(timeframe_index); break; //--- CCI cell
               case 5: cell_rectangle_name = ADX_RECTANGLE + IntegerToString(timeframe_index); cell_text_name = ADX_TEXT + IntegerToString(timeframe_index); break; //--- ADX cell
               case 6: cell_rectangle_name = AO_RECTANGLE + IntegerToString(timeframe_index); cell_text_name = AO_TEXT + IntegerToString(timeframe_index); break; //--- AO cell
            }
            int x_offset = panel_x - WIDTH_TIMEFRAME - (header_index < 2 ? header_index * WIDTH_SIGNAL : 2 * WIDTH_SIGNAL + (header_index - 2) * WIDTH_INDICATOR) + (1 + header_index); //--- Calculate x position
            int width = (header_index < 2 ? WIDTH_SIGNAL : WIDTH_INDICATOR); //--- Set cell width
            ObjectSetInteger(0, cell_rectangle_name, OBJPROP_XDISTANCE, x_offset); //--- Set cell rectangle x position
            ObjectSetInteger(0, cell_rectangle_name, OBJPROP_YDISTANCE, y_offset); //--- Set cell rectangle y position
            ObjectSetInteger(0, cell_text_name, OBJPROP_XDISTANCE, x_offset - width/2); //--- Set cell text x position
            ObjectSetInteger(0, cell_text_name, OBJPROP_YDISTANCE, y_offset + 10); //--- Set cell text y position
         }
      }
   }
   ChartRedraw(0);                                               //--- Redraw chart
}
To support dynamic positioning of the dashboard, we introduce a new "update_panel_positions" function. The function adjusts the positions of all dashboard elements based on the current "panel_x" and "panel_y" coordinates, enabling the dashboard to be dragged across the chart. We update the header panel, icon, title, close button, and toggle button ("HEADER_PANEL", "HEADER_PANEL_ICON", "HEADER_PANEL_TEXT", "CLOSE_BUTTON", "TOGGLE_BUTTON") using the ObjectSetInteger function with OBJPROP_XDISTANCE and "OBJPROP_YDISTANCE", setting their positions relative to "panel_x" and "panel_y".
If "panel_minimized" is false, we reposition the main panel ("MAIN_PANEL"), symbol rectangle and label ("SYMBOL_RECTANGLE", "SYMBOL_TEXT"), header rectangles and labels ("HEADER_RECTANGLE", "HEADER_TEXT"), and timeframe rectangles, labels, and indicator cells ("TIMEFRAME_RECTANGLE", "TIMEFRAME_TEXT", "BUY_RECTANGLE", "RSI_RECTANGLE", etc.) using calculated offsets from "panel_x" and "panel_y". We call the ChartRedraw function to refresh the display. This function will ensure all elements move together when the dashboard is dragged, a critical feature for our movable dashboard enhancement. We can then try testing the dashboard. For this, we will call the function to create the full dashboard in the OnInit event handler and call the destroy function in the OnDeinit event handler.
//+------------------------------------------------------------------+
//| Expert initialization function                                   |
//+------------------------------------------------------------------+
int OnInit()                                                     //--- Initialize EA
{
   create_full_dashboard();                                      //--- Create full dashboard
   ArraySetAsSeries(rsi_values, true);                           //--- Set RSI array as timeseries
   ArraySetAsSeries(stochastic_values, true);                    //--- Set Stochastic array as timeseries
   ArraySetAsSeries(cci_values, true);                           //--- Set CCI array as timeseries
   ArraySetAsSeries(adx_values, true);                           //--- Set ADX array as timeseries
   ArraySetAsSeries(ao_values, true);                            //--- Set AO array as timeseries

   ChartSetInteger(0, CHART_EVENT_MOUSE_MOVE, true);             //--- Enable mouse move events
   return(INIT_SUCCEEDED);                                       //--- Return initialization success
}

//+------------------------------------------------------------------+
//| Expert deinitialization function                                 |
//+------------------------------------------------------------------+
void OnDeinit(const int reason)                                  //--- Deinitialize EA
{
   delete_all_objects();                                         //--- Delete all objects
   ChartSetInteger(0, CHART_EVENT_MOUSE_MOVE, false);            //--- Disable mouse move events
   ChartRedraw(0);                                               //--- Redraw chart
}
Here, we just call the respective functions during initialization and deinitialization of the program to enable us to test the basic responses before we move on to the next parts. It is always a better programming manner to compile your program stepwise to ascertain that it is working. We have the following outcome upon compilation.
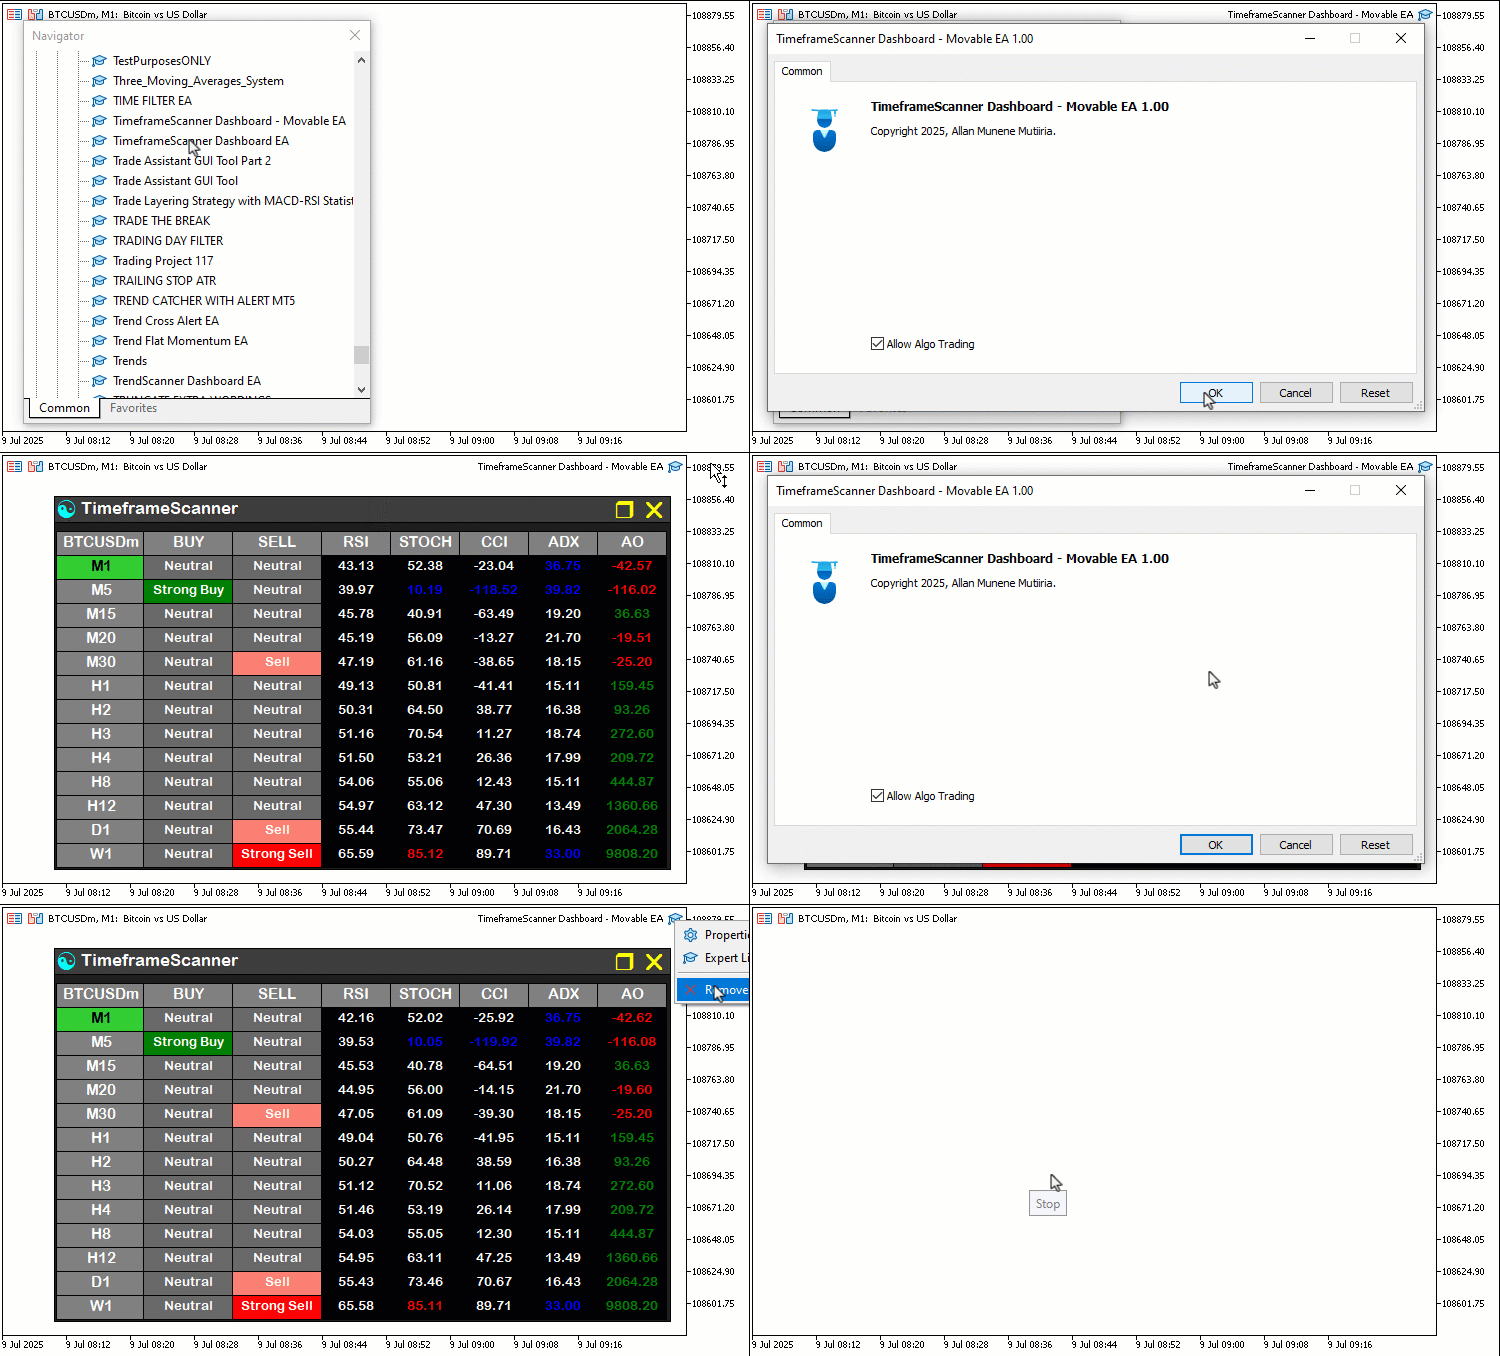
From the visualization, we can see that we can initialize and remove the panel successfully. Now, let us move on to making the dashboard responsive. We first need to get the cursor position to determine if it is in the header or in the buttons, so that we know specifically what the user might want to do. We will also get the button movement path so we can know and visualize hover states and click states by changing the color, but first, let us define a function to determine the cursor position relative to the dashboard elements.
//+------------------------------------------------------------------+
//| Check if cursor is inside header or buttons                      |
//+------------------------------------------------------------------+
bool is_cursor_in_header_or_buttons(int mouse_x, int mouse_y) {
   int chart_width = (int)ChartGetInteger(0, CHART_WIDTH_IN_PIXELS);

   // Header panel bounds
   int header_x = (int)ObjectGetInteger(0, HEADER_PANEL, OBJPROP_XDISTANCE);
   int header_y = (int)ObjectGetInteger(0, HEADER_PANEL, OBJPROP_YDISTANCE);
   int header_width = (int)ObjectGetInteger(0, HEADER_PANEL, OBJPROP_XSIZE);
   int header_height = (int)ObjectGetInteger(0, HEADER_PANEL, OBJPROP_YSIZE);
   int header_left = chart_width - header_x;
   int header_right = header_left + header_width;
   bool in_header = (mouse_x >= header_left && mouse_x <= header_right &&
                     mouse_y >= header_y && mouse_y <= header_y + header_height);

   // Close button bounds
   int close_x = (int)ObjectGetInteger(0, CLOSE_BUTTON, OBJPROP_XDISTANCE);
   int close_y = (int)ObjectGetInteger(0, CLOSE_BUTTON, OBJPROP_YDISTANCE);
   int close_width = 20;
   int close_height = 20;
   int close_left = chart_width - close_x;
   int close_right = close_left + close_width;
   bool in_close = (mouse_x >= close_left && mouse_x <= close_right &&
                    mouse_y >= close_y && mouse_y <= close_y + close_height);

   // Toggle button bounds
   int toggle_x = (int)ObjectGetInteger(0, TOGGLE_BUTTON, OBJPROP_XDISTANCE);
   int toggle_y = (int)ObjectGetInteger(0, TOGGLE_BUTTON, OBJPROP_YDISTANCE);
   int toggle_width = 20;
   int toggle_height = 20;
   int toggle_left = chart_width - toggle_x;
   int toggle_right = toggle_left + toggle_width;
   bool in_toggle = (mouse_x >= toggle_left && mouse_x <= toggle_right &&
                     mouse_y >= toggle_y && mouse_y <= toggle_y + toggle_height);

   return in_header || in_close || in_toggle;
}
First, we introduce a new "is_cursor_in_header_or_buttons" function to support dynamic positioning and toggle functionality. The function will check if the mouse cursor is over the header panel, close button, or toggle button, enabling interactive dragging and button actions. We start by retrieving the chart width using ChartGetInteger with CHART_WIDTH_IN_PIXELS. For the header panel, we get "header_x", "header_y", "header_width", and "header_height" using ObjectGetInteger with "OBJPROP_XDISTANCE", "OBJPROP_YDISTANCE", "OBJPROP_XSIZE", and OBJPROP_YSIZE for "HEADER_PANEL", calculating "header_left" and "header_right" relative to the chart width. We check if "mouse_x" and "mouse_y" fall within these bounds, setting "in_header" to true if they do.
For the close button, we fetch "close_x" and "close_y" for "CLOSE_BUTTON", define a 20x20 pixel area, and calculate "close_left" and "close_right", setting "in_close" to true if the cursor is within this area. Similarly, for the toggle button, we get "toggle_x" and "toggle_y" for "TOGGLE_BUTTON", define a 20x20 area, and set "in_toggle" to true if the cursor is inside. We return true if the cursor is in any of these areas ("in_header", "in_close", or "in_toggle"). This function will be crucial for detecting mouse interactions with the dashboard’s draggable header and buttons, enabling our enhanced movable and interactive features. We can then update the hover states by visualizing the colors for easier recognition.
//+------------------------------------------------------------------+
//| Update button hover states                                       |
//+------------------------------------------------------------------+
void update_button_hover_states(int mouse_x, int mouse_y) {
   int chart_width = (int)ChartGetInteger(0, CHART_WIDTH_IN_PIXELS);

   // Close button hover
   int close_x = (int)ObjectGetInteger(0, CLOSE_BUTTON, OBJPROP_XDISTANCE);
   int close_y = (int)ObjectGetInteger(0, CLOSE_BUTTON, OBJPROP_YDISTANCE);
   int close_width = 20;
   int close_height = 20;
   int close_left = chart_width - close_x;
   int close_right = close_left + close_width;
   bool is_close_hovered = (mouse_x >= close_left && mouse_x <= close_right &&
                            mouse_y >= close_y && mouse_y <= close_y + close_height);

   if (is_close_hovered != prev_close_hovered) {
      ObjectSetInteger(0, CLOSE_BUTTON, OBJPROP_COLOR, is_close_hovered ? clrWhite : clrYellow);
      ObjectSetInteger(0, CLOSE_BUTTON, OBJPROP_BGCOLOR, is_close_hovered ? clrDodgerBlue : clrNONE);
      prev_close_hovered = is_close_hovered;
      ChartRedraw(0);
   }

   // Toggle button hover
   int toggle_x = (int)ObjectGetInteger(0, TOGGLE_BUTTON, OBJPROP_XDISTANCE);
   int toggle_y = (int)ObjectGetInteger(0, TOGGLE_BUTTON, OBJPROP_YDISTANCE);
   int toggle_width = 20;
   int toggle_height = 20;
   int toggle_left = chart_width - toggle_x;
   int toggle_right = toggle_left + toggle_width;
   bool is_toggle_hovered = (mouse_x >= toggle_left && mouse_x <= toggle_right &&
                             mouse_y >= toggle_y && mouse_y <= toggle_y + toggle_height);

   if (is_toggle_hovered != prev_toggle_hovered) {
      ObjectSetInteger(0, TOGGLE_BUTTON, OBJPROP_COLOR, is_toggle_hovered ? clrWhite : clrYellow);
      ObjectSetInteger(0, TOGGLE_BUTTON, OBJPROP_BGCOLOR, is_toggle_hovered ? clrDodgerBlue : clrNONE);
      prev_toggle_hovered = is_toggle_hovered;
      ChartRedraw(0);
   }
}

//+------------------------------------------------------------------+
//| Update header hover state                                        |
//+------------------------------------------------------------------+
void update_header_hover_state(int mouse_x, int mouse_y) {
   int chart_width = (int)ChartGetInteger(0, CHART_WIDTH_IN_PIXELS);
   int header_x = (int)ObjectGetInteger(0, HEADER_PANEL, OBJPROP_XDISTANCE);
   int header_y = (int)ObjectGetInteger(0, HEADER_PANEL, OBJPROP_YDISTANCE);
   int header_width = (int)ObjectGetInteger(0, HEADER_PANEL, OBJPROP_XSIZE);
   int header_height = (int)ObjectGetInteger(0, HEADER_PANEL, OBJPROP_YSIZE);
   int header_left = chart_width - header_x;
   int header_right = header_left + header_width;

   // Exclude button areas from header hover
   int close_x = (int)ObjectGetInteger(0, CLOSE_BUTTON, OBJPROP_XDISTANCE);
   int close_y = (int)ObjectGetInteger(0, CLOSE_BUTTON, OBJPROP_YDISTANCE);
   int close_width = 20;
   int close_height = 20;
   int close_left = chart_width - close_x;
   int close_right = close_left + close_width;

   int toggle_x = (int)ObjectGetInteger(0, TOGGLE_BUTTON, OBJPROP_XDISTANCE);
   int toggle_y = (int)ObjectGetInteger(0, TOGGLE_BUTTON, OBJPROP_YDISTANCE);
   int toggle_width = 20;
   int toggle_height = 20;
   int toggle_left = chart_width - toggle_x;
   int toggle_right = toggle_left + toggle_width;

   bool is_header_hovered = (mouse_x >= header_left && mouse_x <= header_right &&
                             mouse_y >= header_y && mouse_y <= header_y + header_height &&
                             !(mouse_x >= close_left && mouse_x <= close_right &&
                               mouse_y >= close_y && mouse_y <= close_y + close_height) &&
                             !(mouse_x >= toggle_left && mouse_x <= toggle_right &&
                               mouse_y >= toggle_y && mouse_y <= toggle_y + toggle_height));

   if (is_header_hovered != prev_header_hovered && !panel_dragging) {
      ObjectSetInteger(0, HEADER_PANEL, OBJPROP_BGCOLOR, is_header_hovered ? clrRed : C'60,60,60');
      prev_header_hovered = is_header_hovered;
      ChartRedraw(0);
   }

   update_button_hover_states(mouse_x, mouse_y);
}
Here, we introduce two new functions, "update_button_hover_states" and "update_header_hover_state," to add visual feedback for user interactions, improving the dashboard’s usability. We start with the "update_button_hover_states" function, which takes "mouse_x" and "mouse_y" to detect hover over the close and toggle buttons. For the "CLOSE_BUTTON", we fetch "close_x" and "close_y" using ObjectGetInteger with "OBJPROP_XDISTANCE" and "OBJPROP_YDISTANCE", calculate a 20x20 pixel area relative to the chart width from ChartGetInteger with "CHART_WIDTH_IN_PIXELS", and set "is_close_hovered" if the cursor is within this area.
If "is_close_hovered" differs from "prev_close_hovered", we update "CLOSE_BUTTON" with "ObjectSetInteger", setting "OBJPROP_COLOR" to "clrWhite" and OBJPROP_BGCOLOR to "clrDodgerBlue" when hovered, or "clrYellow" and "clrNONE" when not, update "prev_close_hovered", and call the ChartRedraw function. Similarly, for "TOGGLE_BUTTON", we fetch "toggle_x" and "toggle_y", check the 20x20 area, and update its colors and "prev_toggle_hovered" if "is_toggle_hovered" changes, ensuring responsive button feedback.
Next, we create the "update_header_hover_state" function, also taking "mouse_x" and "mouse_y". We get "header_x", "header_y", "header_width", and "header_height" for "HEADER_PANEL" using "ObjectGetInteger", calculate the header’s bounds, and exclude the areas of "CLOSE_BUTTON" and "TOGGLE_BUTTON" (20x20 pixels each) to avoid overlap. If "is_header_hovered" differs from "prev_header_hovered" and "panel_dragging" is false, we update "HEADER_PANEL"’s "OBJPROP_BGCOLOR" to "clrRed" when hovered or "C'60,60,60'" when not, update "prev_header_hovered", and call "ChartRedraw". We then call "update_button_hover_states" to ensure button states are updated. These functions will provide visual cues for dragging and button interactions, enhancing the dashboard’s interactivity. We can then use the functions in the OnChartEvent event handler for full implementation. Here is the logic we apply.
//+------------------------------------------------------------------+
//| Expert chart event handler                                       |
//+------------------------------------------------------------------+
void OnChartEvent(const int event_id, const long& long_param, const double& double_param, const string& string_param)
{
   if (event_id == CHARTEVENT_OBJECT_CLICK) {                    //--- Handle object click event
      if (string_param == CLOSE_BUTTON) {                        //--- Check if close button clicked
         Print("Closing the panel now");                         //--- Log panel closure
         PlaySound("alert.wav");                                 //--- Play alert sound
         panel_is_visible = false;                               //--- Hide panel
         delete_all_objects();                                   //--- Delete all objects
         ChartRedraw(0);                                         //--- Redraw chart
      } else if (string_param == TOGGLE_BUTTON) {                //--- Toggle button clicked
         delete_all_objects();                                   //--- Delete current UI
         panel_minimized = !panel_minimized;                     //--- Toggle minimized state
         if (panel_minimized) {
            Print("Minimizing the panel");                       //--- Log minimization
            create_minimized_dashboard();                        //--- Create minimized UI
         } else {
            Print("Maximizing the panel");                       //--- Log maximization
            create_full_dashboard();                             //--- Create full UI
         }
         // Reset hover states after toggle
         prev_header_hovered = false;
         prev_close_hovered = false;
         prev_toggle_hovered = false;
         ObjectSetInteger(0, HEADER_PANEL, OBJPROP_BGCOLOR, C'60,60,60');
         ObjectSetInteger(0, CLOSE_BUTTON, OBJPROP_COLOR, clrYellow);
         ObjectSetInteger(0, CLOSE_BUTTON, OBJPROP_BGCOLOR, clrNONE);
         ObjectSetInteger(0, TOGGLE_BUTTON, OBJPROP_COLOR, clrYellow);
         ObjectSetInteger(0, TOGGLE_BUTTON, OBJPROP_BGCOLOR, clrNONE);
         ChartRedraw(0);
      }
   }
   else if (event_id == CHARTEVENT_MOUSE_MOVE && panel_is_visible) { //--- Handle mouse move events
      int mouse_x = (int)long_param;                             //--- Get mouse x-coordinate
      int mouse_y = (int)double_param;                           //--- Get mouse y-coordinate
      int mouse_state = (int)string_param;                       //--- Get mouse state

      if (mouse_x == last_mouse_x && mouse_y == last_mouse_y && !panel_dragging) { //--- Skip redundant updates
         return;
      }
      last_mouse_x = mouse_x;                                    //--- Update last mouse x position
      last_mouse_y = mouse_y;                                    //--- Update last mouse y position

      update_header_hover_state(mouse_x, mouse_y);               //--- Update header and button hover states

      int chart_width = (int)ChartGetInteger(0, CHART_WIDTH_IN_PIXELS);
      int header_x = (int)ObjectGetInteger(0, HEADER_PANEL, OBJPROP_XDISTANCE);
      int header_y = (int)ObjectGetInteger(0, HEADER_PANEL, OBJPROP_YDISTANCE);
      int header_width = (int)ObjectGetInteger(0, HEADER_PANEL, OBJPROP_XSIZE);
      int header_height = (int)ObjectGetInteger(0, HEADER_PANEL, OBJPROP_YSIZE);
      int header_left = chart_width - header_x;
      int header_right = header_left + header_width;

      int close_x = (int)ObjectGetInteger(0, CLOSE_BUTTON, OBJPROP_XDISTANCE);
      int close_width = 20;
      int close_left = chart_width - close_x;
      int close_right = close_left + close_width;

      int toggle_x = (int)ObjectGetInteger(0, TOGGLE_BUTTON, OBJPROP_XDISTANCE);
      int toggle_width = 20;
      int toggle_left = chart_width - toggle_x;
      int toggle_right = toggle_left + toggle_width;

      if (prev_mouse_state == 0 && mouse_state == 1) {           //--- Detect mouse button down
         if (mouse_x >= header_left && mouse_x <= header_right &&
             mouse_y >= header_y && mouse_y <= header_y + header_height &&
             !(mouse_x >= close_left && mouse_x <= close_right) &&
             !(mouse_x >= toggle_left && mouse_x <= toggle_right)) { //--- Exclude button areas
            panel_dragging = true;                              //--- Start dragging
            panel_drag_x = mouse_x;                             //--- Store mouse x-coordinate
            panel_drag_y = mouse_y;                             //--- Store mouse y-coordinate
            panel_start_x = header_x;                           //--- Store panel x-coordinate
            panel_start_y = header_y;                           //--- Store panel y-coordinate
            ObjectSetInteger(0, HEADER_PANEL, OBJPROP_BGCOLOR, clrMediumBlue); //--- Set header to blue on drag start
            ChartSetInteger(0, CHART_MOUSE_SCROLL, false);      //--- Disable chart scrolling
         }
      }

      if (panel_dragging && mouse_state == 1) {                  //--- Handle dragging
         int dx = mouse_x - panel_drag_x;                        //--- Calculate x displacement
         int dy = mouse_y - panel_drag_y;                        //--- Calculate y displacement
         panel_x = panel_start_x - dx;                           //--- Update panel x-position (inverted for CORNER_RIGHT_UPPER)
         panel_y = panel_start_y + dy;                           //--- Update panel y-position

         int chart_width = (int)ChartGetInteger(0, CHART_WIDTH_IN_PIXELS); //--- Get chart width
         int chart_height = (int)ChartGetInteger(0, CHART_HEIGHT_IN_PIXELS); //--- Get chart height
         panel_x = MathMax(617, MathMin(chart_width, panel_x));  //--- Keep panel within right edge
         panel_y = MathMax(0, MathMin(chart_height - (panel_minimized ? 27 : 374), panel_y)); //--- Adjust height based on state

         update_panel_positions();                               //--- Update all panel object positions
         ChartRedraw(0);                                         //--- Redraw chart during dragging
      }

      if (mouse_state == 0 && prev_mouse_state == 1) {           //--- Detect mouse button release
         if (panel_dragging) {
            panel_dragging = false;                              //--- Stop dragging
            update_header_hover_state(mouse_x, mouse_y);          //--- Update hover state immediately after drag
            ChartSetInteger(0, CHART_MOUSE_SCROLL, true);        //--- Re-enable chart scrolling
            ChartRedraw(0);                                      //--- Redraw chart
         }
      }

      prev_mouse_state = mouse_state;                            //--- Update previous mouse state
   }
}
Here, we enhance our program by updating the OnChartEvent event handler to support dynamic positioning and toggle functionality, significantly improving on the previous version. We retain the handling of CHARTEVENT_OBJECT_CLICK for the "CLOSE_BUTTON", which logs closure with Print, plays a sound with PlaySound, sets "panel_is_visible" to false, calls the "delete_all_objects" function, and redraws the chart.
The new addition is the handling of clicks on the "TOGGLE_BUTTON", where we call the "delete_all_objects" function, toggle "panel_minimized", and either create a minimized dashboard with "create_minimized_dashboard" (logging "Minimizing the panel") or a full dashboard with "create_full_dashboard" (logging "Maximizing the panel"). We reset hover states ("prev_header_hovered", "prev_close_hovered", "prev_toggle_hovered") to false, restore default colors for "HEADER_PANEL", "CLOSE_BUTTON", and "TOGGLE_BUTTON" using the ObjectSetInteger function, and redraw the chart.
For dynamic positioning, we add CHARTEVENT_MOUSE_MOVE handling when "panel_is_visible" is true. We get "mouse_x", "mouse_y", and "mouse_state" from event parameters, skip redundant updates if coordinates match "last_mouse_x" and "last_mouse_y" and "panel_dragging" is false, and update these coordinates. We call "update_header_hover_state" to manage hover effects. If "prev_mouse_state" is 0 and "mouse_state" is 1, we check if the cursor is over "HEADER_PANEL" (excluding "CLOSE_BUTTON" and "TOGGLE_BUTTON" areas) using "ObjectGetInteger" and ChartGetInteger, then set "panel_dragging" to true, store coordinates in "panel_drag_x", "panel_drag_y", "panel_start_x", and "panel_start_y", set "HEADER_PANEL" color to "clrMediumBlue", and disable chart scrolling with "ChartSetInteger".
While "panel_dragging" and "mouse_state" are 1, we calculate displacement, update "panel_x" and "panel_y" within chart bounds, call "update_panel_positions", and redraw. On mouse release, we stop dragging, update hover states, re-enable scrolling, and redraw. We update "prev_mouse_state". These changes will now enable dragging and toggling, unlike the previous static click-only handling. Upon compilation, we get the following outcome.
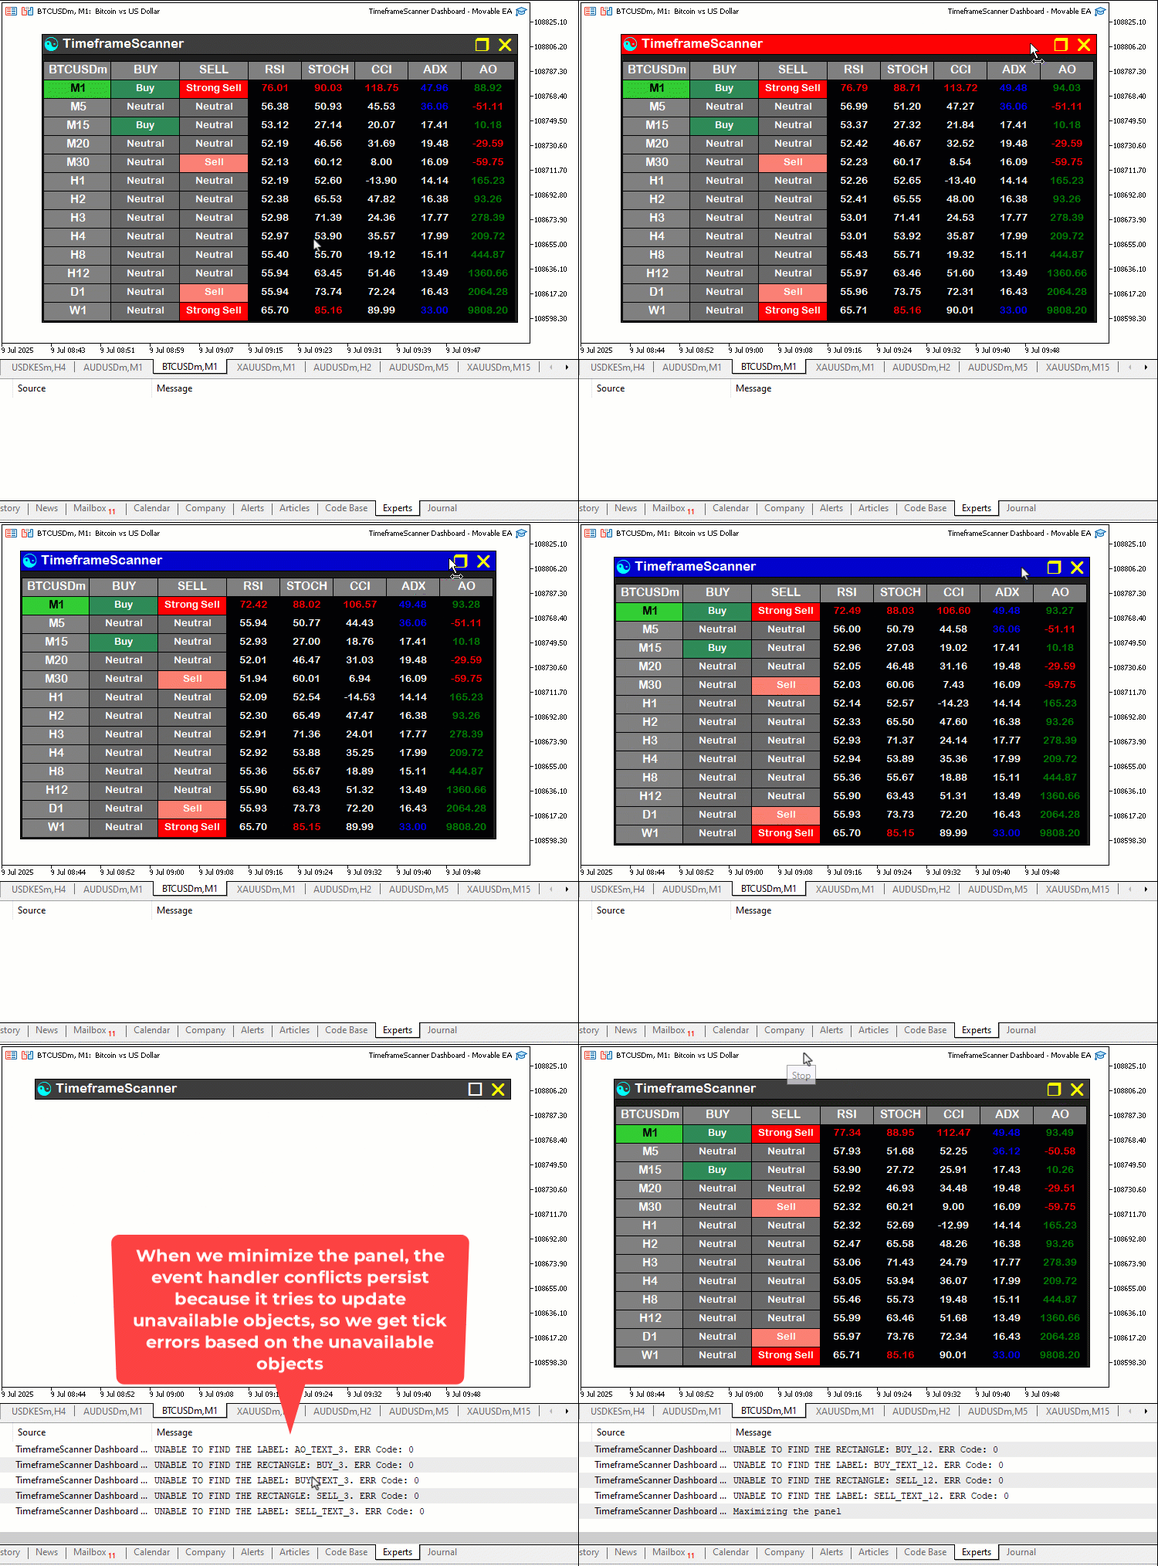
From the visualization, we can see the dashboard is coming to life, but we need to take care of the conflicts between the event handlers. We need to give one event handler the right of way so it can be prioritized to increase productivity. For example, when we are hovering or dragging, or even in minimized mode, we need to prioritize the chart events. If we are in the dormant state or maximized state, we need to prioritize the dashboard updates. We will achieve that by altering the tick processing event, since that is where we update the dashboard.
//+------------------------------------------------------------------+
//| Expert tick function                                             |
//+------------------------------------------------------------------+
void OnTick()                                                     //--- Handle tick events
{
   if (panel_is_visible && !panel_minimized && !is_cursor_in_header_or_buttons(last_mouse_x, last_mouse_y)) { //--- Update indicators only if panel is visible, not minimized, and cursor is not in header/buttons
      updateIndicators();                                        //--- Update indicators
   }
}
We update the OnTick event handler to optimize indicator updates. Unlike the previous version, which called the "updateIndicators" function solely based on "panel_is_visible", we now add conditions to only update indicators when "panel_is_visible" is true, "panel_minimized" is false, and the cursor is not over the header or buttons, checked using "is_cursor_in_header_or_buttons" with "last_mouse_x" and "last_mouse_y". This change will ensure that indicator updates are paused when the dashboard is minimized or the user is interacting with the header, close button, or toggle button, reducing unnecessary processing and improving performance during dragging or toggling actions. Upon compilation, we have the following outcome.
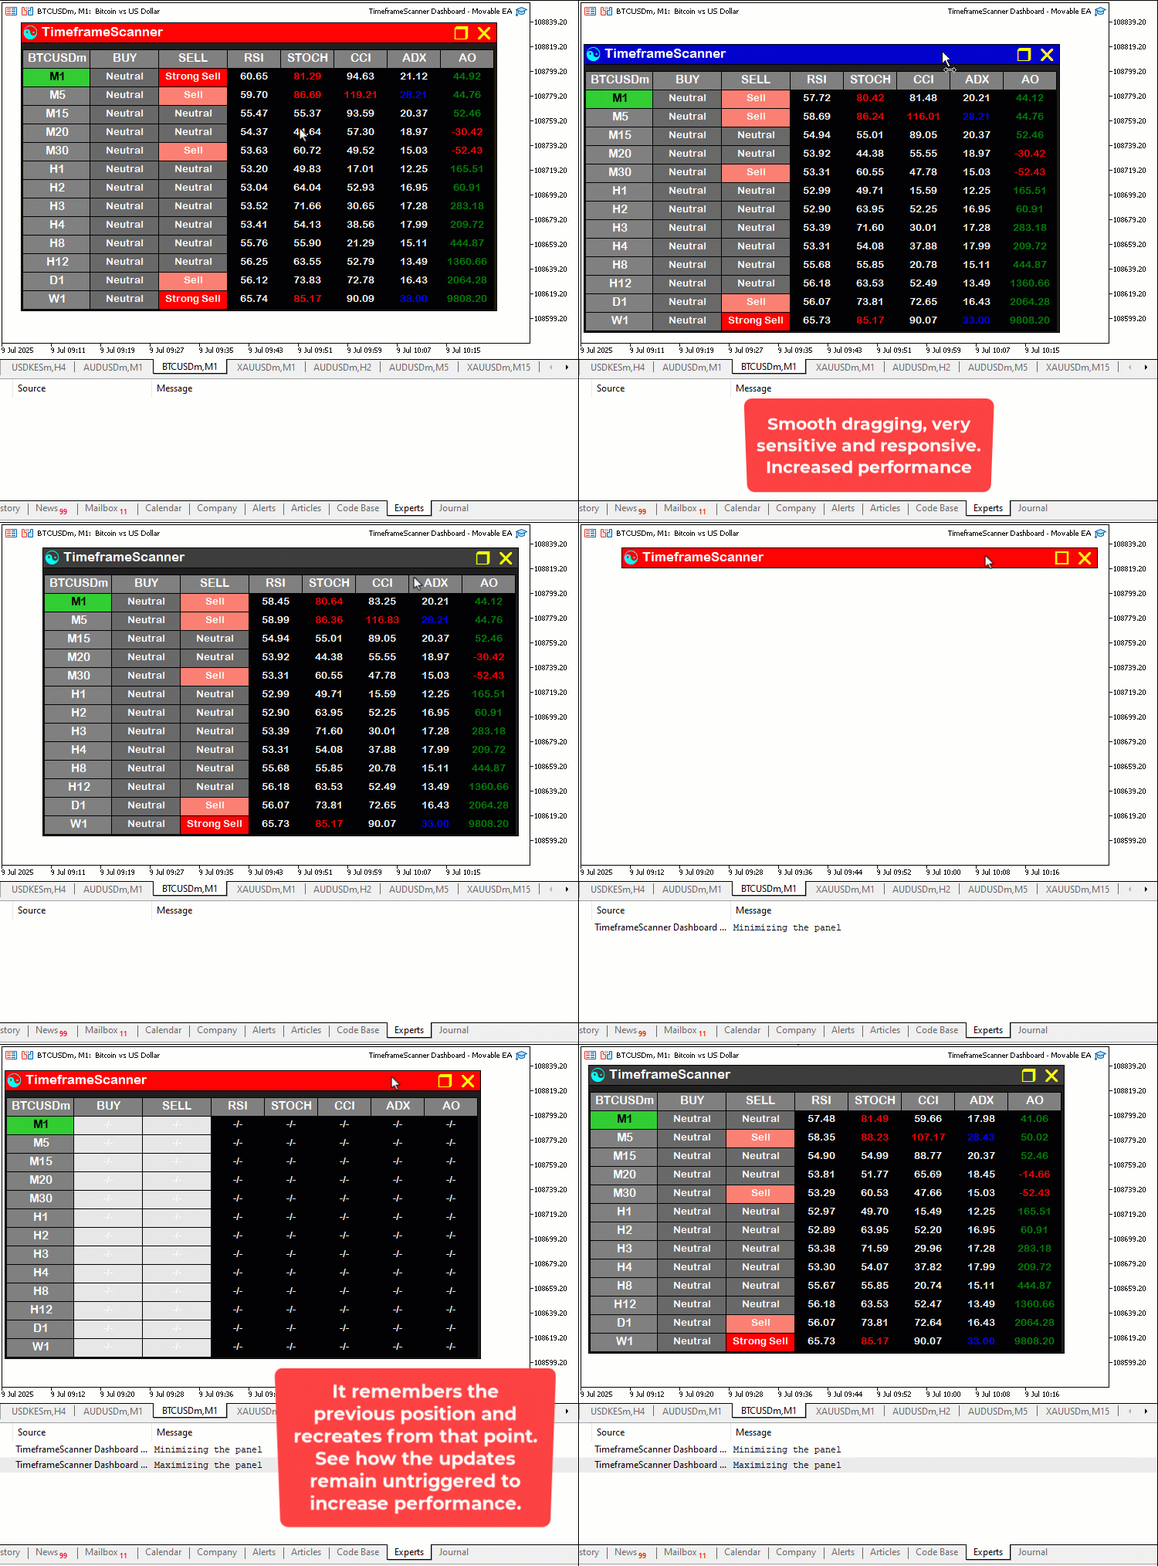
From the visualization, we can see that there is improved performance in the dashboard, and all the objectives have been met. What now remains is testing the workability of the project, and that is handled in the preceding section.
Backtesting
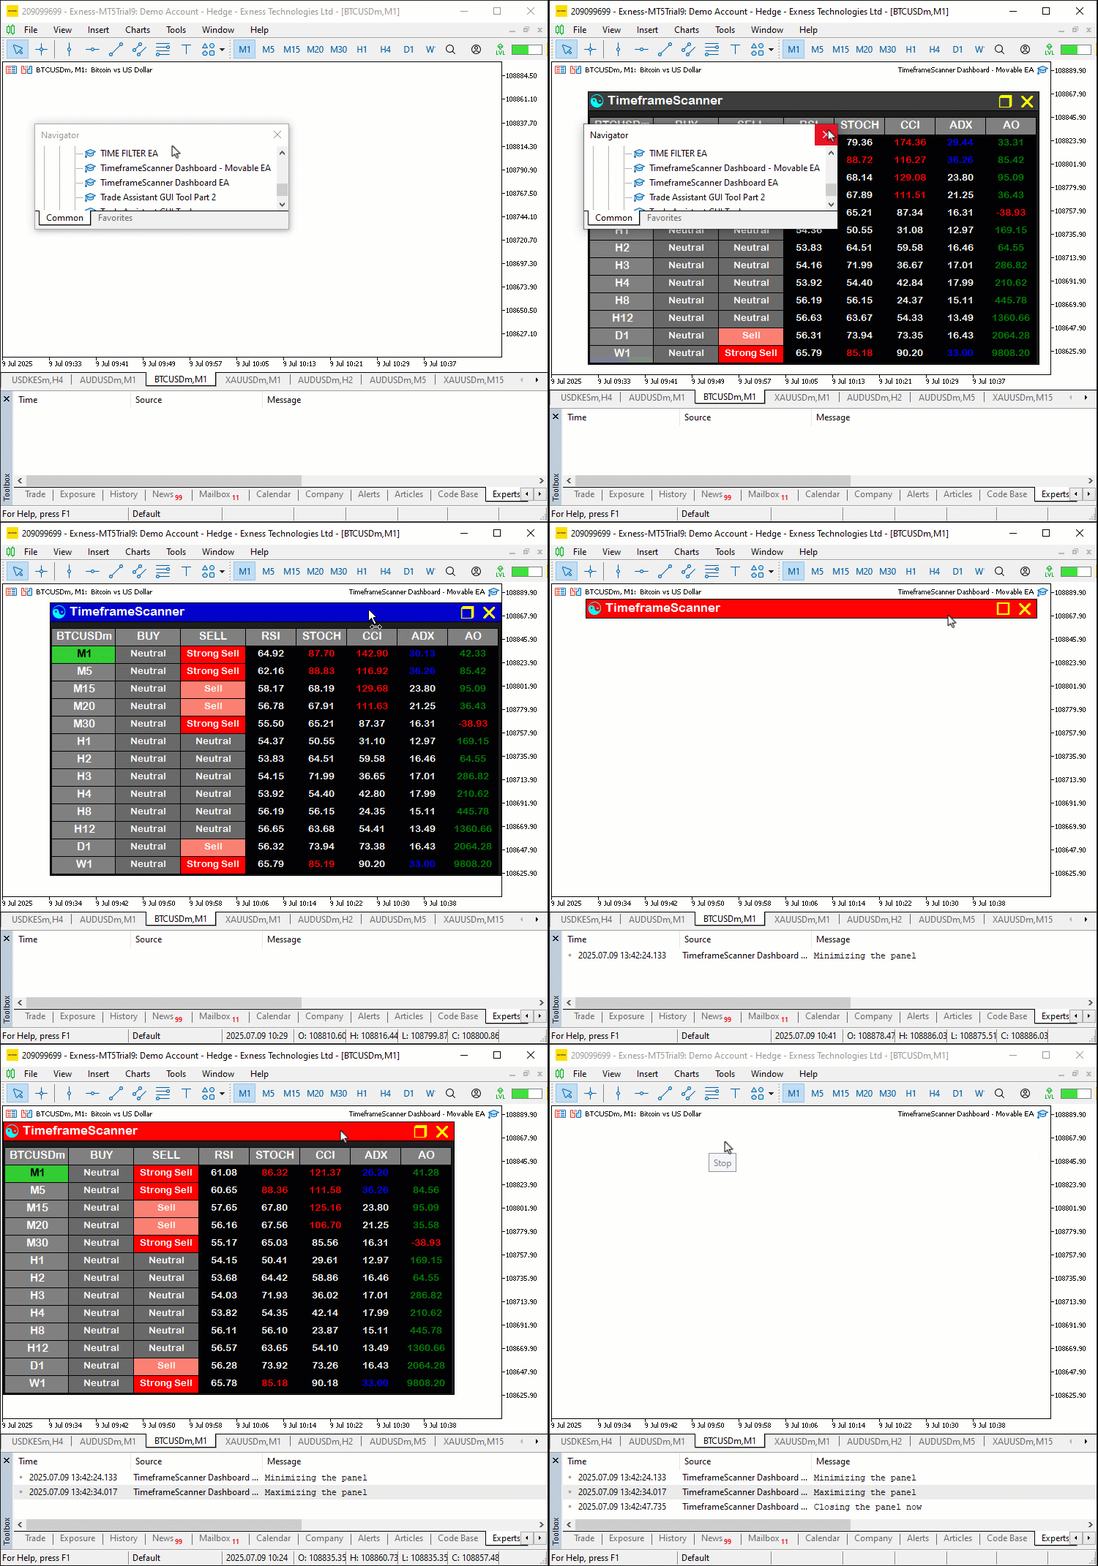
We did the testing, and below is the compiled visualization in a single Graphics Interchange Format (GIF) bitmap image format.
Conclusion
In conclusion, we’ve enhanced our Multi-Timeframe Scanner Dashboard in MQL5 by adding dynamic positioning and toggle functionality, building on Part 3 with a movable interface, minimize/maximize toggle, and interactive hover effects for better user control. We’ve demonstrated how to implement these improvements using functions like "create_minimized_dashboard" and "update_header_hover_state", ensuring seamless integration with the existing indicator grid for real-time trading insights. You can further customize this dashboard to suit your trading needs, boosting your ability to monitor market signals efficiently across multiple timeframes.
Warning: All rights to these materials are reserved by MetaQuotes Ltd. Copying or reprinting of these materials in whole or in part is prohibited.
This article was written by a user of the site and reflects their personal views. MetaQuotes Ltd is not responsible for the accuracy of the information presented, nor for any consequences resulting from the use of the solutions, strategies or recommendations described.
 Implementing Practical Modules from Other Languages in MQL5 (Part 02): Building the REQUESTS Library, Inspired by Python
 Cycles and trading
 MQL5 Wizard Techniques you should know (Part 75): Using Awesome Oscillator and the Envelopes
 From Basic to Intermediate: Recursion
- Free trading apps
- Over 8,000 signals for copying
- Economic news for exploring financial markets
You agree to website policy and terms of use
Thank you Allan , That is pretty cool , well documented and covers features I didn't know much appreciated