MQL5 Trading Tools (Part 3): Building a Multi-Timeframe Scanner Dashboard for Strategic Trading

Introduction
In our previous article, Part 2, we enhanced a Trade Assistant Tool in MetaQuotes Language 5 (MQL5) with dynamic visual feedback for improved interactivity. Now, we focus on building a multi-timeframe scanner dashboard to deliver real-time trading signals for strategic decision-making. We introduce a grid-based interface with indicator-driven signals and a close button, covering these advancements through the following subtopics:
These sections guide us toward creating an intuitive and powerful trading dashboard.
The plan of the Scanner Dashboard
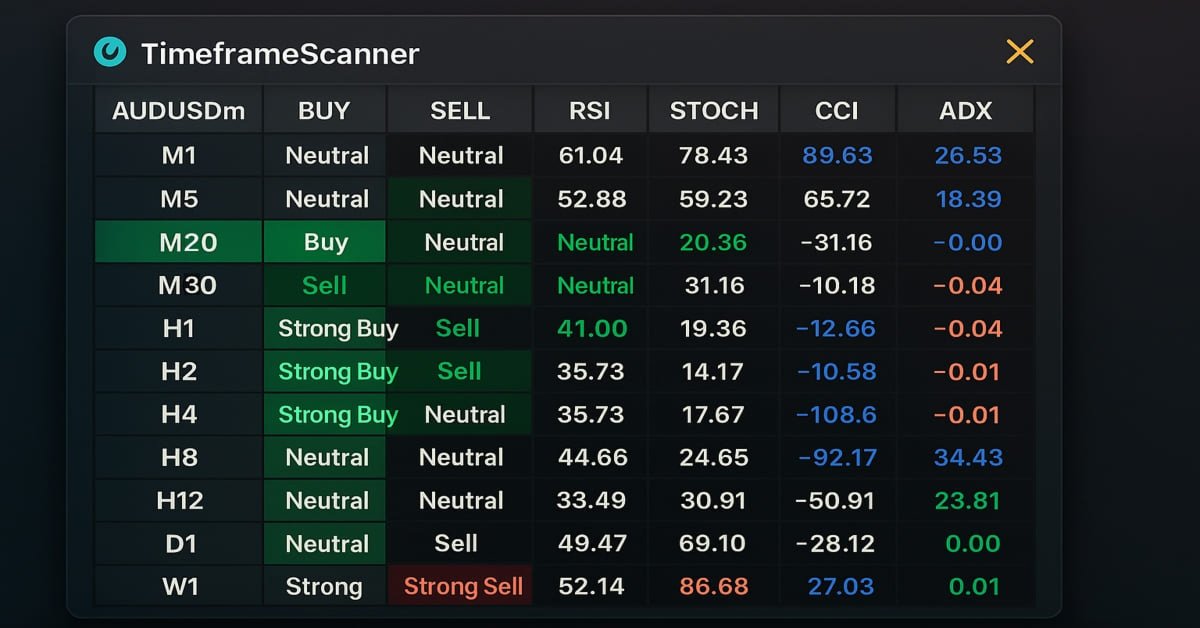
We aim to create a multi-timeframe scanner dashboard that provides clear, real-time trading signals to enhance strategic decision-making. The dashboard will feature a grid layout displaying buy and sell signals across multiple timeframes, allowing us to quickly assess market conditions without switching charts. A close button will be included to enable easy panel dismissal, ensuring a clean and flexible user experience that adapts to our trading needs.
We will incorporate signals from key indicators, including the Relative Strength Index (RSI), Stochastic Oscillator (STOCH), Commodity Channel Index (CCI), Average Directional Index (ADX), and Awesome Oscillator (AO), which are designed to identify potential trade opportunities with customizable strength thresholds. Still, the choice of the indicators or price action data to use is upon you. This setup will help us spot trends and reversals across timeframes, supporting both short-term and long-term strategies. Our goal is a streamlined, intuitive tool that delivers actionable insights while remaining user-friendly, paving the way for future enhancements like automated alerts or additional indicators. Below is a visualization of what we aim to achieve.

Implementation in MQL5
To create the program in MQL5, we will need to define the program metadata, and then define some object name constants, that will help us refer to the dashboard objects and manage them easily.
//+------------------------------------------------------------------+
//|                             TimeframeScanner Dashboard EA.mq5    |
//|                           Copyright 2025, Allan Munene Mutiiria. |
//+------------------------------------------------------------------+
#property copyright "Copyright 2025, Allan Munene Mutiiria."
#property link      "https://t.me/Forex_Algo_Trader"
#property version   "1.00"

// Define identifiers and properties for UI elements
#define MAIN_PANEL              "PANEL_MAIN"                     //--- Main panel rectangle identifier
#define HEADER_PANEL            "PANEL_HEADER"                   //--- Header panel rectangle identifier
#define HEADER_PANEL_ICON       "PANEL_HEADER_ICON"              //--- Header icon label identifier
#define HEADER_PANEL_TEXT       "PANEL_HEADER_TEXT"              //--- Header title label identifier
#define CLOSE_BUTTON            "BUTTON_CLOSE"                   //--- Close button identifier
#define SYMBOL_RECTANGLE        "SYMBOL_HEADER"                  //--- Symbol rectangle identifier
#define SYMBOL_TEXT             "SYMBOL_TEXT"                    //--- Symbol text label identifier
#define TIMEFRAME_RECTANGLE     "TIMEFRAME_"                     //--- Timeframe rectangle prefix
#define TIMEFRAME_TEXT          "TIMEFRAME_TEXT_"                //--- Timeframe text label prefix
#define HEADER_RECTANGLE        "HEADER_"                        //--- Header rectangle prefix
#define HEADER_TEXT             "HEADER_TEXT_"                   //--- Header text label prefix
#define RSI_RECTANGLE           "RSI_"                           //--- RSI rectangle prefix
#define RSI_TEXT                "RSI_TEXT_"                      //--- RSI text label prefix
#define STOCH_RECTANGLE         "STOCH_"                         //--- Stochastic rectangle prefix
#define STOCH_TEXT              "STOCH_TEXT_"                    //--- Stochastic text label prefix
#define CCI_RECTANGLE           "CCI_"                           //--- CCI rectangle prefix
#define CCI_TEXT                "CCI_TEXT_"                      //--- CCI text label prefix
#define ADX_RECTANGLE           "ADX_"                           //--- ADX rectangle prefix
#define ADX_TEXT                "ADX_TEXT_"                      //--- ADX text label prefix
#define AO_RECTANGLE            "AO_"                            //--- AO rectangle prefix
#define AO_TEXT                 "AO_TEXT_"                       //--- AO text label prefix
#define BUY_RECTANGLE           "BUY_"                           //--- Buy rectangle prefix
#define BUY_TEXT                "BUY_TEXT_"                      //--- Buy text label prefix
#define SELL_RECTANGLE          "SELL_"                          //--- Sell rectangle prefix
#define SELL_TEXT               "SELL_TEXT_"                     //--- Sell text label prefix
#define WIDTH_TIMEFRAME         90                               //--- Width of timeframe and symbol rectangles
#define WIDTH_INDICATOR         70                               //--- Width of indicator rectangles
#define WIDTH_SIGNAL            90                               //--- Width of BUY/SELL signal rectangles
#define HEIGHT_RECTANGLE        25                               //--- Height of all rectangles
#define COLOR_WHITE             clrWhite                         //--- White color for text and backgrounds
#define COLOR_BLACK             clrBlack                         //--- Black color for borders and text
#define COLOR_LIGHT_GRAY        C'230,230,230'                   //--- Light gray color for signal backgrounds
#define COLOR_DARK_GRAY         C'105,105,105'                   //--- Dark gray color for indicator backgrounds
We start by establishing the user interface framework for our multi-timeframe scanner dashboard by using the #define directive to create constants like "MAIN_PANEL" and "HEADER_PANEL" for the main and header panel rectangles, and "HEADER_PANEL_ICON", "HEADER_PANEL_TEXT", and "CLOSE_BUTTON" for the header’s icon, title, and close button elements.
We define identifiers for the dashboard’s grid structure. For the symbol, we set "SYMBOL_RECTANGLE" and "SYMBOL_TEXT", while "TIMEFRAME_RECTANGLE" and "TIMEFRAME_TEXT" prefixes handle timeframe rows. We use "HEADER_RECTANGLE" and "HEADER_TEXT" prefixes for column headers, and prefixes like "RSI_RECTANGLE", "STOCH_RECTANGLE", "BUY_RECTANGLE", with corresponding "RSI_TEXT", "STOCH_TEXT", and "BUY_TEXT" for indicator and signal cells.
We configure sizes with "WIDTH_TIMEFRAME" (90 pixels), "WIDTH_INDICATOR" (70 pixels), "WIDTH_SIGNAL" (90 pixels), and "HEIGHT_RECTANGLE" (25 pixels). We define colors using "COLOR_WHITE" and "COLOR_BLACK" for text and borders, "COLOR_LIGHT_GRAY" ("C'230,230,230'") for signal backgrounds, and "COLOR_DARK_GRAY" ("C'105,105,105'") for indicators, ensuring a uniform and clear layout. We then need to define some more global variables that we will throughout the program.
bool panel_is_visible = true;                                    //--- Flag to control panel visibility

// Define the timeframes to be used
ENUM_TIMEFRAMES timeframes_array[] = {PERIOD_M1, PERIOD_M5, PERIOD_M15, PERIOD_M20, PERIOD_M30,
                                      PERIOD_H1, PERIOD_H2, PERIOD_H3, PERIOD_H4, PERIOD_H8,
                                      PERIOD_H12, PERIOD_D1, PERIOD_W1}; //--- Array of timeframes for scanning

// Global variables for indicator values
double rsi_values[];                                             //--- Array to store RSI values
double stochastic_values[];                                      //--- Array to store Stochastic signal line values
double cci_values[];                                             //--- Array to store CCI values
double adx_values[];                                             //--- Array to store ADX values
double ao_values[];                                              //--- Array to store AO values
Here, we declare the boolean variable "panel_is_visible" and set it to true, which determines whether the dashboard is displayed on the chart. This flag allows us to toggle the dashboard’s visibility as needed, especially when we don't need data updates. We then define the array "timeframes_array" using the ENUM_TIMEFRAMES type, listing periods from "PERIOD_M1" (1-minute) to "PERIOD_W1" (weekly). This array specifies the timeframes the dashboard will analyze, enabling us to scan market signals across multiple time horizons in a structured manner. If you don't need some or need twisting, just modify the enumerations.
To store indicator data, we create double arrays "rsi_values", "stochastic_values", "cci_values", "adx_values", and "ao_values". These arrays hold the calculated values for the Relative Strength Index, Stochastic Oscillator, Commodity Channel Index, Average Directional Index, and Awesome Oscillator, respectively, allowing us to process and display trading signals for each timeframe efficiently. We can now define some helper functions that we will use to determine the direction and truncation of the retrieved chart symbol as follows.
//+------------------------------------------------------------------+
//| Truncate timeframe enum to display string                        |
//+------------------------------------------------------------------+
string truncate_timeframe_name(int timeframe_index)              //--- Function to format timeframe name
{
   string timeframe_string = StringSubstr(EnumToString(timeframes_array[timeframe_index]), 7); //--- Extract timeframe name
   return timeframe_string;                                      //--- Return formatted name
}

//+------------------------------------------------------------------+
//| Calculate signal strength for buy/sell                           |
//+------------------------------------------------------------------+
string calculate_signal_strength(double rsi, double stochastic, double cci, double adx, double ao, bool is_buy) //--- Function to compute signal strength
{
   int signal_strength = 0;                                      //--- Initialize signal strength counter

   if(is_buy && rsi < 40) signal_strength++;                     //--- Increment for buy if RSI is oversold
   else if(!is_buy && rsi > 60) signal_strength++;               //--- Increment for sell if RSI is overbought

   if(is_buy && stochastic < 40) signal_strength++;              //--- Increment for buy if Stochastic is oversold
   else if(!is_buy && stochastic > 60) signal_strength++;        //--- Increment for sell if Stochastic is overbought

   if(is_buy && cci < -70) signal_strength++;                    //--- Increment for buy if CCI is oversold
   else if(!is_buy && cci > 70) signal_strength++;               //--- Increment for sell if CCI is overbought

   if(adx > 40) signal_strength++;                               //--- Increment if ADX indicates strong trend

   if(is_buy && ao > 0) signal_strength++;                       //--- Increment for buy if AO is positive
   else if(!is_buy && ao < 0) signal_strength++;                 //--- Increment for sell if AO is negative

   if(signal_strength >= 3) return is_buy ? "Strong Buy" : "Strong Sell"; //--- Return strong signal if 3+ conditions met
   if(signal_strength >= 2) return is_buy ? "Buy" : "Sell";      //--- Return regular signal if 2 conditions met
   return "Neutral";                                             //--- Return neutral if insufficient conditions
}
Here, we define the "truncate_timeframe_name" function, which takes an integer parameter "timeframe_index" to format timeframe names for display. Inside, we use the StringSubstr function to extract a substring from the result of the EnumToString function applied to "timeframes_array[timeframe_index]", starting at position 7, and store it in "timeframe_string". We then return "timeframe_string", providing a clean, user-readable timeframe name.
We create the "calculate_signal_strength" function to determine buy or sell signals based on indicator values. We initialize an integer "signal_strength" to zero to count matching conditions. For the Relative Strength Index, we increment "signal_strength" if "is_buy" is true and "rsi" is below 40 (oversold) or if "is_buy" is false and "rsi" exceeds 60 (overbought). Similarly, we check "stochastic" (below 40 or above 60), "CCI" (below -70 or above 70), and "ao" (positive for buy, negative for sell), incrementing "signal_strength" for each met condition.
We also evaluate the Average Directional Index, incrementing "signal_strength" if "adx" exceeds 40, indicating a strong trend for both buy and sell scenarios. If "signal_strength" reaches 3 or more, we return “Strong Buy” for "is_buy" true or “Strong Sell” otherwise. If it’s 2, we return “Buy” or “Sell”, and for fewer, we return “Neutral”, enabling clear signal classification for the dashboard. Finally, we can now define the functions that will enable us to create the objects.
//+------------------------------------------------------------------+
//| Create a rectangle for the UI                                    |
//+------------------------------------------------------------------+
bool create_rectangle(string object_name, int x_distance, int y_distance, int x_size, int y_size,
                      color background_color, color border_color = COLOR_BLACK) //--- Function to create a rectangle
{
   ResetLastError();                                                            //--- Reset error code
   if(!ObjectCreate(0, object_name, OBJ_RECTANGLE_LABEL, 0, 0, 0)) {            //--- Create rectangle object
      Print(__FUNCTION__, ": failed to create Rectangle: ERR Code: ", GetLastError()); //--- Log creation failure
      return(false);                                                            //--- Return failure
   }
   ObjectSetInteger(0, object_name, OBJPROP_XDISTANCE, x_distance);             //--- Set x position
   ObjectSetInteger(0, object_name, OBJPROP_YDISTANCE, y_distance);             //--- Set y position
   ObjectSetInteger(0, object_name, OBJPROP_XSIZE, x_size);                     //--- Set width
   ObjectSetInteger(0, object_name, OBJPROP_YSIZE, y_size);                     //--- Set height
   ObjectSetInteger(0, object_name, OBJPROP_CORNER, CORNER_RIGHT_UPPER);        //--- Set corner to top-right
   ObjectSetInteger(0, object_name, OBJPROP_BGCOLOR, background_color);         //--- Set background color
   ObjectSetInteger(0, object_name, OBJPROP_BORDER_COLOR, border_color);        //--- Set border color
   ObjectSetInteger(0, object_name, OBJPROP_BORDER_TYPE, BORDER_FLAT);          //--- Set flat border style
   ObjectSetInteger(0, object_name, OBJPROP_BACK, false);                       //--- Set to foreground

   ChartRedraw(0);                                                              //--- Redraw chart
   return(true);                                                                //--- Return success
}

//+------------------------------------------------------------------+
//| Create a text label for the UI                                   |
//+------------------------------------------------------------------+
bool create_label(string object_name, string text, int x_distance, int y_distance, int font_size = 12,
                  color text_color = COLOR_BLACK, string font = "Arial Rounded MT Bold") //--- Function to create a label
{
   ResetLastError();                                                               //--- Reset error code
   if(!ObjectCreate(0, object_name, OBJ_LABEL, 0, 0, 0)) {                         //--- Create label object
      Print(__FUNCTION__, ": failed to create Label: ERR Code: ", GetLastError()); //--- Log creation failure
      return(false);                                                               //--- Return failure
   }
   ObjectSetInteger(0, object_name, OBJPROP_XDISTANCE, x_distance);                //--- Set x position
   ObjectSetInteger(0, object_name, OBJPROP_YDISTANCE, y_distance);                //--- Set y position
   ObjectSetInteger(0, object_name, OBJPROP_CORNER, CORNER_RIGHT_UPPER);           //--- Set corner to top-right
   ObjectSetString(0, object_name, OBJPROP_TEXT, text);                            //--- Set label text
   ObjectSetString(0, object_name, OBJPROP_FONT, font);                            //--- Set font
   ObjectSetInteger(0, object_name, OBJPROP_FONTSIZE, font_size);                  //--- Set font size
   ObjectSetInteger(0, object_name, OBJPROP_COLOR, text_color);                    //--- Set text color
   ObjectSetInteger(0, object_name, OBJPROP_ANCHOR, ANCHOR_CENTER);                //--- Center text

   ChartRedraw(0);                                                                 //--- Redraw chart
   return(true);                                                                   //--- Return success
}
To enable the creation of the objects, we define the "create_rectangle" function with parameters "object_name", "x_distance", "y_distance", "x_size", "y_size", "background_color", and "border_color". We use the ResetLastError function, create an OBJ_RECTANGLE_LABEL with the ObjectCreate function, and log errors with the "Print" function if it fails, returning false.
We set rectangle properties with the ObjectSetInteger function for the position, size, "CORNER_RIGHT_UPPER", "background_color", "border_color", and "BORDER_FLAT", ensuring foreground display. We use the ChartRedraw function and return true. For text, we define the "create_label" function with "object_name", "text", "x_distance", "y_distance", "font_size", "text_color", and "font".
We use the "ResetLastError" function, create an "OBJ_LABEL" with the "ObjectCreate" function, and log errors if it fails. We use the "ObjectSetInteger" function for position, size, color, and "ANCHOR_CENTER", and the ObjectSetString function for "text" and "font". We use the "ChartRedraw" function and return true. Armed with these functions, we can now create the initial panel objects to give us a starting point in the "OnInit" event handler.
//+------------------------------------------------------------------+
//| Expert initialization function                                   |
//+------------------------------------------------------------------+
int OnInit()                                                                             //--- Initialize EA
{
   create_rectangle(MAIN_PANEL, 632, 40, 617, 374, C'30,30,30', BORDER_FLAT);            //--- Create main panel background
   create_rectangle(HEADER_PANEL, 632, 40, 617, 27, C'60,60,60', BORDER_FLAT);           //--- Create header panel background
   create_label(HEADER_PANEL_ICON, CharToString(91), 620, 54, 18, clrAqua, "Wingdings"); //--- Create header icon
   create_label(HEADER_PANEL_TEXT, "TimeframeScanner", 527, 52, 13, COLOR_WHITE);        //--- Create header title
   create_label(CLOSE_BUTTON, CharToString('r'), 32, 54, 18, clrYellow, "Webdings");     //--- Create close button

   // Create header rectangle and label
   create_rectangle(SYMBOL_RECTANGLE, 630, 75, WIDTH_TIMEFRAME, HEIGHT_RECTANGLE, clrGray); //--- Create symbol rectangle
   create_label(SYMBOL_TEXT, _Symbol, 585, 85, 11, COLOR_WHITE); //--- Create symbol label

   // Create summary and indicator headers (rectangles and labels)
   string header_names[] = {"BUY", "SELL", "RSI", "STOCH", "CCI", "ADX", "AO"};            //--- Define header titles
   for(int header_index = 0; header_index < ArraySize(header_names); header_index++) {     //--- Loop through headers
      int x_offset = (630 - WIDTH_TIMEFRAME) - (header_index < 2 ? header_index * WIDTH_SIGNAL : 2 * WIDTH_SIGNAL + (header_index - 2) * WIDTH_INDICATOR) + (1 + header_index); //--- Calculate x position
      int width = (header_index < 2 ? WIDTH_SIGNAL : WIDTH_INDICATOR);                     //--- Set width based on header type
      create_rectangle(HEADER_RECTANGLE + IntegerToString(header_index), x_offset, 75, width, HEIGHT_RECTANGLE, clrGray);             //--- Create header rectangle
      create_label(HEADER_TEXT + IntegerToString(header_index), header_names[header_index], x_offset - width/2, 85, 11, COLOR_WHITE); //--- Create header label
   }

   // Create timeframe rectangles and labels, and summary/indicator cells
   for(int timeframe_index = 0; timeframe_index < ArraySize(timeframes_array); timeframe_index++) {            //--- Loop through timeframes
      // Highlight current timeframe
      color timeframe_background = (timeframes_array[timeframe_index] == _Period) ? clrLimeGreen : clrGray;    //--- Set background color for current timeframe
      color timeframe_text_color = (timeframes_array[timeframe_index] == _Period) ? COLOR_BLACK : COLOR_WHITE; //--- Set text color for current timeframe

      create_rectangle(TIMEFRAME_RECTANGLE + IntegerToString(timeframe_index), 630, (75 + HEIGHT_RECTANGLE) + timeframe_index * HEIGHT_RECTANGLE - (1 + timeframe_index), WIDTH_TIMEFRAME, HEIGHT_RECTANGLE, timeframe_background);   //--- Create timeframe rectangle
      create_label(TIMEFRAME_TEXT + IntegerToString(timeframe_index), truncate_timeframe_name(timeframe_index), 585, (85 + HEIGHT_RECTANGLE) + timeframe_index * HEIGHT_RECTANGLE - (1 + timeframe_index), 11, timeframe_text_color); //--- Create timeframe label

      // Create summary and indicator cells
      for(int header_index = 0; header_index < ArraySize(header_names); header_index++) { //--- Loop through headers for cells
         string cell_rectangle_name, cell_text_name;                                      //--- Declare cell name and label variables
         color cell_background = (header_index < 2) ? COLOR_LIGHT_GRAY : COLOR_BLACK;     //--- Set cell background color
         switch(header_index) {                                   //--- Select cell type
            case 0: cell_rectangle_name = BUY_RECTANGLE + IntegerToString(timeframe_index); cell_text_name = BUY_TEXT + IntegerToString(timeframe_index); break;     //--- Buy cell
            case 1: cell_rectangle_name = SELL_RECTANGLE + IntegerToString(timeframe_index); cell_text_name = SELL_TEXT + IntegerToString(timeframe_index); break;   //--- Sell cell
            case 2: cell_rectangle_name = RSI_RECTANGLE + IntegerToString(timeframe_index); cell_text_name = RSI_TEXT + IntegerToString(timeframe_index); break;     //--- RSI cell
            case 3: cell_rectangle_name = STOCH_RECTANGLE + IntegerToString(timeframe_index); cell_text_name = STOCH_TEXT + IntegerToString(timeframe_index); break; //--- Stochastic cell
            case 4: cell_rectangle_name = CCI_RECTANGLE + IntegerToString(timeframe_index); cell_text_name = CCI_TEXT + IntegerToString(timeframe_index); break;     //--- CCI cell
            case 5: cell_rectangle_name = ADX_RECTANGLE + IntegerToString(timeframe_index); cell_text_name = ADX_TEXT + IntegerToString(timeframe_index); break;     //--- ADX cell
            case 6: cell_rectangle_name = AO_RECTANGLE + IntegerToString(timeframe_index); cell_text_name = AO_TEXT + IntegerToString(timeframe_index); break;       //--- AO cell
         }
         int x_offset = (630 - WIDTH_TIMEFRAME) - (header_index < 2 ? header_index * WIDTH_SIGNAL : 2 * WIDTH_SIGNAL + (header_index - 2) * WIDTH_INDICATOR) + (1 + header_index);        //--- Calculate x position
         int width = (header_index < 2 ? WIDTH_SIGNAL : WIDTH_INDICATOR); //--- Set width based on cell type
         create_rectangle(cell_rectangle_name, x_offset, (75 + HEIGHT_RECTANGLE) + timeframe_index * HEIGHT_RECTANGLE - (1 + timeframe_index), width, HEIGHT_RECTANGLE, cell_background); //--- Create cell rectangle
         create_label(cell_text_name, "-/-", x_offset - width/2, (85 + HEIGHT_RECTANGLE) + timeframe_index * HEIGHT_RECTANGLE - (1 + timeframe_index), 10, COLOR_WHITE);                  //--- Create cell label
      }
   }

   // Initialize indicator arrays
   ArraySetAsSeries(rsi_values, true);                       //--- Set RSI array as timeseries
   ArraySetAsSeries(stochastic_values, true);                //--- Set Stochastic array as timeseries
   ArraySetAsSeries(cci_values, true);                       //--- Set CCI array as timeseries
   ArraySetAsSeries(adx_values, true);                       //--- Set ADX array as timeseries
   ArraySetAsSeries(ao_values, true);                        //--- Set AO array as timeseries

   return(INIT_SUCCEEDED);                                   //--- Return initialization success
}
In the OnInit event handler, we initialize the multi-timeframe scanner dashboard’s user interface. We use the "create_rectangle" function to draw the "MAIN_PANEL" at (632, 40) with size 617x374 pixels in “C’30,30,30’” and the "HEADER_PANEL" at the same position with a 27-pixel height in “C’60,60,60’”. We use the "create_label" function to add the "HEADER_PANEL_ICON" with a Wingdings character at (620, 54). We use the default characters in MQL5 and use the CharToString function to convert the character code to a string. Here is the character code we used, 91, but you can use any of your liking.

We then create the "HEADER_PANEL_TEXT" with “TimeframeScanner” at (527, 52), and "CLOSE_BUTTON" at (32, 54), but this time round we advance to using a different font and map the letter "r" to the string. Here is a visualization of the different font symbols you can use.

We set up the symbol display using the "create_rectangle" function for the "SYMBOL_RECTANGLE" at (630, 75), sized "WIDTH_TIMEFRAME" by "HEIGHT_RECTANGLE", in gray. We use the "create_label" function to place the "SYMBOL_TEXT" at (585, 85) with the current symbol. For headers, we define the "header_names" array with titles like “BUY” and “RSI”, looping to create "HEADER_RECTANGLE" at y=75 with x-offsets based on "WIDTH_SIGNAL" and "WIDTH_INDICATOR", and "HEADER_TEXT" labels at y=85 using the "create_label" function.
We build the timeframe grid by looping through "timeframes_array". We use the "create_rectangle" function for "TIMEFRAME_RECTANGLE" at x=630, y-offsets from (75 + "HEIGHT_RECTANGLE") adjusted by -(1 + "timeframe_index"), colored with "timeframe_background". We use the "create_label" function for "TIMEFRAME_TEXT" with names from the "truncate_timeframe_name" function. For cells, we loop to create "BUY_RECTANGLE", "RSI_RECTANGLE", etc., with the "create_rectangle" function, using "cell_background", and add “-/-” labels with the "create_label" function. We initialize indicator arrays like "rsi_values" using the ArraySetAsSeries function, setting them as time series for data handling. We return INIT_SUCCEEDED to confirm successful initialization, establishing the dashboard’s layout and data structure. Upon compilation, we have the following outcome.

From the image, we can see that we have the dashboard ready. All we have to do now is add the indicator values and use them for analysis. We already have a function for the analysis, we just need to get the data. To achieve that easily, we create a function to handle all the dynamic update logic.
//+------------------------------------------------------------------+
//| Update indicator values                                          |
//+------------------------------------------------------------------+
void updateIndicators()                                                                               //--- Update dashboard indicators
{
   for(int timeframe_index = 0; timeframe_index < ArraySize(timeframes_array); timeframe_index++) {   //--- Loop through timeframes
      // Initialize indicator handles
      int rsi_indicator_handle = iRSI(_Symbol, timeframes_array[timeframe_index], 14, PRICE_CLOSE);   //--- Create RSI handle
      int stochastic_indicator_handle = iStochastic(_Symbol, timeframes_array[timeframe_index], 14, 3, 3, MODE_SMA, STO_LOWHIGH); //--- Create Stochastic handle
      int cci_indicator_handle = iCCI(_Symbol, timeframes_array[timeframe_index], 20, PRICE_TYPICAL); //--- Create CCI handle
      int adx_indicator_handle = iADX(_Symbol, timeframes_array[timeframe_index], 14);                //--- Create ADX handle
      int ao_indicator_handle = iAO(_Symbol, timeframes_array[timeframe_index]);                      //--- Create AO handle

      // Check for valid handles
      if(rsi_indicator_handle == INVALID_HANDLE || stochastic_indicator_handle == INVALID_HANDLE ||
         cci_indicator_handle == INVALID_HANDLE || adx_indicator_handle == INVALID_HANDLE ||
         ao_indicator_handle == INVALID_HANDLE) {                                                             //--- Check if any handle is invalid
         Print("Failed to create indicator handle for timeframe ", truncate_timeframe_name(timeframe_index)); //--- Log failure
         continue;                                                                                            //--- Skip to next timeframe
      }

      // Copy indicator values
      if(CopyBuffer(rsi_indicator_handle, 0, 0, 1, rsi_values) <= 0 ||                            //--- Copy RSI value
         CopyBuffer(stochastic_indicator_handle, 1, 0, 1, stochastic_values) <= 0 ||              //--- Copy Stochastic signal line value
         CopyBuffer(cci_indicator_handle, 0, 0, 1, cci_values) <= 0 ||                            //--- Copy CCI value
         CopyBuffer(adx_indicator_handle, 0, 0, 1, adx_values) <= 0 ||                            //--- Copy ADX value
         CopyBuffer(ao_indicator_handle, 0, 0, 1, ao_values) <= 0) {                              //--- Copy AO value
         Print("Failed to copy buffer for timeframe ", truncate_timeframe_name(timeframe_index)); //--- Log copy failure
         continue;                                                                                //--- Skip to next timeframe
      }

      // Update RSI
      color rsi_text_color = (rsi_values[0] < 30) ? clrBlue : (rsi_values[0] > 70) ? clrRed : COLOR_WHITE;         //--- Set RSI text color
      update_label(RSI_TEXT + IntegerToString(timeframe_index), DoubleToString(rsi_values[0], 2), rsi_text_color); //--- Update RSI label

      // Update Stochastic (Signal Line only)
      color stochastic_text_color = (stochastic_values[0] < 20) ? clrBlue : (stochastic_values[0] > 80) ? clrRed : COLOR_WHITE;    //--- Set Stochastic text color
      update_label(STOCH_TEXT + IntegerToString(timeframe_index), DoubleToString(stochastic_values[0], 2), stochastic_text_color); //--- Update Stochastic label

      // Update CCI
      color cci_text_color = (cci_values[0] < -100) ? clrBlue : (cci_values[0] > 100) ? clrRed : COLOR_WHITE;      //--- Set CCI text color
      update_label(CCI_TEXT + IntegerToString(timeframe_index), DoubleToString(cci_values[0], 2), cci_text_color); //--- Update CCI label

      // Update ADX
      color adx_text_color = (adx_values[0] > 25) ? clrBlue : COLOR_WHITE;                                         //--- Set ADX text color
      update_label(ADX_TEXT + IntegerToString(timeframe_index), DoubleToString(adx_values[0], 2), adx_text_color); //--- Update ADX label

      // Update AO
      color ao_text_color = (ao_values[0] > 0) ? clrGreen : (ao_values[0] < 0) ? clrRed : COLOR_WHITE;          //--- Set AO text color
      update_label(AO_TEXT + IntegerToString(timeframe_index), DoubleToString(ao_values[0], 2), ao_text_color); //--- Update AO label

      // Update Buy/Sell signals
      string buy_signal = calculate_signal_strength(rsi_values[0], stochastic_values[0], cci_values[0],
                                                   adx_values[0], ao_values[0], true);                          //--- Calculate buy signal
      string sell_signal = calculate_signal_strength(rsi_values[0], stochastic_values[0], cci_values[0],
                                                    adx_values[0], ao_values[0], false);                        //--- Calculate sell signal

      color buy_text_color = (buy_signal == "Strong Buy") ? COLOR_WHITE : COLOR_WHITE;                          //--- Set buy text color
      color buy_background = (buy_signal == "Strong Buy") ? clrGreen :
                            (buy_signal == "Buy") ? clrSeaGreen : COLOR_DARK_GRAY;                              //--- Set buy background color
      update_rectangle(BUY_RECTANGLE + IntegerToString(timeframe_index), buy_background);                       //--- Update buy rectangle
      update_label(BUY_TEXT + IntegerToString(timeframe_index), buy_signal, buy_text_color);                    //--- Update buy label

      color sell_text_color = (sell_signal == "Strong Sell") ? COLOR_WHITE : COLOR_WHITE;                       //--- Set sell text color
      color sell_background = (sell_signal == "Strong Sell") ? clrRed :
                             (sell_signal == "Sell") ? clrSalmon : COLOR_DARK_GRAY;                             //--- Set sell background color
      update_rectangle(SELL_RECTANGLE + IntegerToString(timeframe_index), sell_background);                     //--- Update sell rectangle
      update_label(SELL_TEXT + IntegerToString(timeframe_index), sell_signal, sell_text_color);                 //--- Update sell label

      // Release indicator handles
      IndicatorRelease(rsi_indicator_handle);                   //--- Release RSI handle
      IndicatorRelease(stochastic_indicator_handle);            //--- Release Stochastic handle
      IndicatorRelease(cci_indicator_handle);                   //--- Release CCI handle
      IndicatorRelease(adx_indicator_handle);                   //--- Release ADX handle
      IndicatorRelease(ao_indicator_handle);                    //--- Release AO handle
   }
}
To easily manage the dashboard values update, we implement the "updateIndicators" function to refresh the indicator values and signals. We loop through "timeframes_array" using "timeframe_index", processing each timeframe. We use the iRSI, "iStochastic", "iCCI", iADX, and "iAO" functions to create indicator handles like "rsi_indicator_handle" for the current symbol and timeframe, configuring parameters such as a 14-period RSI and a 20-period CCI. All the indicator settings are customizable to fit your needs, so don't limit yourself to the default values.
We then check if any handle, such as "rsi_indicator_handle", equals INVALID_HANDLE, indicating a creation failure. If so, we use the "Print" function to log the error with the "truncate_timeframe_name" function’s output and skip to the next timeframe. We use the CopyBuffer function to fetch the latest values into arrays like "rsi_values", and if any fail, we log the error and continue. We update indicator displays using the "update_label" function. For example, we set "rsi_text_color" based on "rsi_values[0]" (blue if <30, red if >70, else "COLOR_WHITE") and update "RSI_TEXT" with the "DoubleToString" function’s formatted value. We repeat this for "stochastic_values", "cci_values", "adx_values", and "ao_values", applying color logic (e.g., green for positive "ao_values").
We calculate signals using the "calculate_signal_strength" function, passing "rsi_values[0]" and others, to get "buy_signal" and "sell_signal". We set "buy_background" (e.g., green for “Strong Buy”) and use the "update_rectangle" function for "BUY_RECTANGLE", updating "BUY_TEXT" with "update_label". We do the same for "sell_background" and "SELL_TEXT". Finally, we use the IndicatorRelease function to free handles like "rsi_indicator_handle", ensuring efficient resource management. The helper functions that we used, are defined as below.
//+------------------------------------------------------------------+
//| Update rectangle background color                                |
//+------------------------------------------------------------------+
bool update_rectangle(string object_name, color background_color)//--- Function to update rectangle color
{
   int found = ObjectFind(0, object_name);                       //--- Find rectangle object
   if(found < 0) {                                               //--- Check if object not found
      ResetLastError();                                          //--- Reset error code
      Print("UNABLE TO FIND THE RECTANGLE: ", object_name, ". ERR Code: ", GetLastError()); //--- Log error
      return(false);                                             //--- Return failure
   }
   ObjectSetInteger(0, object_name, OBJPROP_BGCOLOR, background_color); //--- Set background color

   ChartRedraw(0);                                               //--- Redraw chart
   return(true);                                                 //--- Return success
}

//+------------------------------------------------------------------+
//| Update label text and color                                      |
//+------------------------------------------------------------------+
bool update_label(string object_name, string text, color text_color) //--- Function to update label
{
   int found = ObjectFind(0, object_name);                       //--- Find label object
   if(found < 0) {                                               //--- Check if object not found
      ResetLastError();                                          //--- Reset error code
      Print("UNABLE TO FIND THE LABEL: ", object_name, ". ERR Code: ", GetLastError()); //--- Log error
      return(false);                                             //--- Return failure
   }
   ObjectSetString(0, object_name, OBJPROP_TEXT, text);          //--- Set label text
   ObjectSetInteger(0, object_name, OBJPROP_COLOR, text_color);  //--- Set text color

   ChartRedraw(0);                                               //--- Redraw chart
   return(true);                                                 //--- Return success
}
We define the "update_rectangle" function, taking "object_name" and "background_color" as parameters to modify a rectangle’s appearance. We use the ObjectFind function to locate the rectangle, storing the result in "found". If "found" is less than 0, indicating the object is missing, we use the ResetLastError function, log the error with the "Print" function and "GetLastError", and return false. We update the rectangle’s background by using the "ObjectSetInteger" function to set "OBJPROP_BGCOLOR" to "background_color". We use the ChartRedraw function to refresh the chart and return true for success. For text updates, we define the "update_label" function with parameters "object_name", "text", and "text_color".
We use the "ObjectFind" function to check for the label’s existence, and if "found" is negative, we use the "ResetLastError" function, log the error with the "Print" function, and return false. We use the ObjectSetString function to set "OBJPROP_TEXT" to "text" and the ObjectSetInteger function to set "OBJPROP_COLOR" to "text_color". We use the "ChartRedraw" function to update the chart and return true, enabling dynamic label updates. We can now call the update function on the tick to make updates to the dashboard.
//+------------------------------------------------------------------+
//| Expert tick function                                             |
//+------------------------------------------------------------------+
void OnTick()                                                    //--- Handle tick events
{
   if (panel_is_visible) {                                       //--- Check if panel is visible
      updateIndicators();                                        //--- Update indicators
   }
}
Here, in the OnTick event handler, we just call the "updateIndicators" function if the panel is visible to apply the updates. We finally need to delete the objects that we created so that they are removed from that chart when we no longer need them.
//+------------------------------------------------------------------+
//| Expert deinitialization function                                 |
//+------------------------------------------------------------------+
void OnDeinit(const int reason)                                  //--- Deinitialize EA
{
   ObjectDelete(0, MAIN_PANEL);                                  //--- Delete main panel
   ObjectDelete(0, HEADER_PANEL);                                //--- Delete header panel
   ObjectDelete(0, HEADER_PANEL_ICON);                           //--- Delete header icon
   ObjectDelete(0, HEADER_PANEL_TEXT);                           //--- Delete header title
   ObjectDelete(0, CLOSE_BUTTON);                                //--- Delete close button

   ObjectsDeleteAll(0, SYMBOL_RECTANGLE);                        //--- Delete all symbol rectangles
   ObjectsDeleteAll(0, SYMBOL_TEXT);                             //--- Delete all symbol labels
   ObjectsDeleteAll(0, TIMEFRAME_RECTANGLE);                     //--- Delete all timeframe rectangles
   ObjectsDeleteAll(0, TIMEFRAME_TEXT);                          //--- Delete all timeframe labels
   ObjectsDeleteAll(0, HEADER_RECTANGLE);                        //--- Delete all header rectangles
   ObjectsDeleteAll(0, HEADER_TEXT);                             //--- Delete all header labels
   ObjectsDeleteAll(0, RSI_RECTANGLE);                           //--- Delete all RSI rectangles
   ObjectsDeleteAll(0, RSI_TEXT);                                //--- Delete all RSI labels
   ObjectsDeleteAll(0, STOCH_RECTANGLE);                         //--- Delete all Stochastic rectangles
   ObjectsDeleteAll(0, STOCH_TEXT);                              //--- Delete all Stochastic labels
   ObjectsDeleteAll(0, CCI_RECTANGLE);                           //--- Delete all CCI rectangles
   ObjectsDeleteAll(0, CCI_TEXT);                                //--- Delete all CCI labels
   ObjectsDeleteAll(0, ADX_RECTANGLE);                           //--- Delete all ADX rectangles
   ObjectsDeleteAll(0, ADX_TEXT);                                //--- Delete all ADX labels
   ObjectsDeleteAll(0, AO_RECTANGLE);                            //--- Delete all AO rectangles
   ObjectsDeleteAll(0, AO_TEXT);                                 //--- Delete all AO labels
   ObjectsDeleteAll(0, BUY_RECTANGLE);                           //--- Delete all buy rectangles
   ObjectsDeleteAll(0, BUY_TEXT);                                //--- Delete all buy labels
   ObjectsDeleteAll(0, SELL_RECTANGLE);                          //--- Delete all sell rectangles
   ObjectsDeleteAll(0, SELL_TEXT);                               //--- Delete all sell labels

   ChartRedraw(0);                                               //--- Redraw chart
}
Finally, we implement the cleanup process using the OnDeinit function, which runs when the Expert Advisor is removed. We use the ObjectDelete function to remove individual UI elements, starting with the "MAIN_PANEL" rectangle, followed by the "HEADER_PANEL", "HEADER_PANEL_ICON", "HEADER_PANEL_TEXT", and "CLOSE_BUTTON", ensuring the main panel and header components are cleared from the chart.
We systematically remove all dashboard objects by using the ObjectsDeleteAll function for each element type. We delete all rectangles and labels associated with "SYMBOL_RECTANGLE" and "SYMBOL_TEXT", "TIMEFRAME_RECTANGLE" and "TIMEFRAME_TEXT", and "HEADER_RECTANGLE" and "HEADER_TEXT", clearing the symbol, timeframe, and header displays. We also remove indicator-related objects, including "RSI_RECTANGLE", "STOCH_RECTANGLE", "CCI_RECTANGLE", "ADX_RECTANGLE", and "AO_RECTANGLE", along with their respective text labels like "RSI_TEXT".
We complete the cleanup by using the "ObjectsDeleteAll" function to delete all "BUY_RECTANGLE" and "SELL_RECTANGLE" objects, along with their "BUY_TEXT" and "SELL_TEXT" labels, removing all signal-related elements. Finally, we use the ChartRedraw function to refresh the chart, ensuring a clean visual state after deinitialization. Finally, we need to take care of the cancel button so that when clicked, we close the dashboard and disable further updates.
//+------------------------------------------------------------------+
//| Expert chart event handler                                       |
//+------------------------------------------------------------------+
void OnChartEvent(const int       event_id,                      //--- Event ID
                  const long&     long_param,                    //--- Long parameter
                  const double&   double_param,                  //--- Double parameter
                  const string&   string_param)                  //--- String parameter
{
   if (event_id == CHARTEVENT_OBJECT_CLICK) {                    //--- Check for object click event
      if (string_param == CLOSE_BUTTON) {                        //--- Check if close button clicked
         Print("Closing the panel now");                         //--- Log panel closure
         PlaySound("alert.wav");                                 //--- Play alert sound
         panel_is_visible = false;                               //--- Hide panel

         ObjectDelete(0, MAIN_PANEL);                            //--- Delete main panel
         ObjectDelete(0, HEADER_PANEL);                          //--- Delete header panel
         ObjectDelete(0, HEADER_PANEL_ICON);                     //--- Delete header icon
         ObjectDelete(0, HEADER_PANEL_TEXT);                     //--- Delete header title
         ObjectDelete(0, CLOSE_BUTTON);                          //--- Delete close button

         ObjectsDeleteAll(0, SYMBOL_RECTANGLE);                  //--- Delete all symbol rectangles
         ObjectsDeleteAll(0, SYMBOL_TEXT);                       //--- Delete all symbol labels
         ObjectsDeleteAll(0, TIMEFRAME_RECTANGLE);               //--- Delete all timeframe rectangles
         ObjectsDeleteAll(0, TIMEFRAME_TEXT);                    //--- Delete all timeframe labels
         ObjectsDeleteAll(0, HEADER_RECTANGLE);                  //--- Delete all header rectangles
         ObjectsDeleteAll(0, HEADER_TEXT);                       //--- Delete all header labels
         ObjectsDeleteAll(0, RSI_RECTANGLE);                     //--- Delete all RSI rectangles
         ObjectsDeleteAll(0, RSI_TEXT);                          //--- Delete all RSI labels
         ObjectsDeleteAll(0, STOCH_RECTANGLE);                   //--- Delete all Stochastic rectangles
         ObjectsDeleteAll(0, STOCH_TEXT);                        //--- Delete all Stochastic labels
         ObjectsDeleteAll(0, CCI_RECTANGLE);                     //--- Delete all CCI rectangles
         ObjectsDeleteAll(0, CCI_TEXT);                          //--- Delete all CCI labels
         ObjectsDeleteAll(0, ADX_RECTANGLE);                     //--- Delete all ADX rectangles
         ObjectsDeleteAll(0, ADX_TEXT);                          //--- Delete all ADX labels
         ObjectsDeleteAll(0, AO_RECTANGLE);                      //--- Delete all AO rectangles
         ObjectsDeleteAll(0, AO_TEXT);                           //--- Delete all AO labels
         ObjectsDeleteAll(0, BUY_RECTANGLE);                     //--- Delete all buy rectangles
         ObjectsDeleteAll(0, BUY_TEXT);                          //--- Delete all buy labels
         ObjectsDeleteAll(0, SELL_RECTANGLE);                    //--- Delete all sell rectangles
         ObjectsDeleteAll(0, SELL_TEXT);                         //--- Delete all sell labels

         ChartRedraw(0);                                         //--- Redraw chart
      }
   }
}
In the OnChartEvent event handler, we listen to object clicks when the event id is CHARTEVENT_OBJECT_CLICK, and the object clicked is the cancel button, and we play an alert sound using the PlaySound function to alert the user that the panel is being disabled, then disable the visibility of the panel, and use the same logic we used to clear the chart on OnDeinit to clear the dashboard. Upon compilation, we have the following outcome.

From the image, we can see that we have the dashboard updated with the indicator data and trading directions indicated. What now remains is testing the workability of the project, and that is handledin in the section following this.
Backtesting
We did the testing and below is the compiled visualization in a single Graphics Interchange Format (GIF) bitmap image format.

Conclusion
In conclusion, we’ve developed a multi-timeframe scanner dashboard in MQL5, integrating a structured grid layout, real-time indicator signals, and an interactive close button to enhance strategic trading decisions. We’ve shown the design and implementation of these features, ensuring their effectiveness through robust initialization and dynamic updates tailored to our trading requirements. You can adapt this dashboard to fit your preferences, greatly improving your ability to monitor and act on market signals across multiple timeframes.
Warning: All rights to these materials are reserved by MetaQuotes Ltd. Copying or reprinting of these materials in whole or in part is prohibited.
This article was written by a user of the site and reflects their personal views. MetaQuotes Ltd is not responsible for the accuracy of the information presented, nor for any consequences resulting from the use of the solutions, strategies or recommendations described.

- Free trading apps
- Over 8,000 signals for copying
- Economic news for exploring financial markets
You agree to website policy and terms of use