Introduction to MQL5 (Part 17): Building Expert Advisors for Trend Reversals

Introduction
Welcome back to Part 17 of the Introduction to MQL5 series! This part continues to build on everything we’ve explored so far, using our signature project-based approach to help you sharpen your MQL5 skills through real-world examples. In Part 16, we focused on the Head and Shoulders pattern, building an Expert Advisor that could automatically detect it, place trades, and even visualize it on the chart. It was a great way to learn how to work with chart patterns in MQL5.
For this article, I had originally intended to use a single continuation or reversal pattern, such as the Flag, Falling Wedge, or Rising Wedge. However, when I dug further, I discovered something crucial: a lot of these patterns have a similar structure and frequently depend on trend line breaks or reversals. This section will therefore concentrate on developing an Expert Advisor that can identify and trade trend line breakouts and reversal situations, rather than restricting ourselves to a single pattern. With a few adjustments, you may apply these fundamental ideas to various chart patterns after you have mastered them.
In this article, you'll learn:
- How to retrieve the exact price value of a trend line at the time of any given candle using ObjectGetValueByTime().
- Identify potential breakout and reversal signals based on candle structure around trend lines.
- The difference between ascending and descending trend lines, and how to interpret their interaction with price action.
- About the Importance of checking recent candle behavior (like wicks and closes) to confirm price rejection or breakout.
- The practical use of time-based comparisons to avoid executing trades on outdated or irrelevant signals.
- How to build a basic yet flexible Expert Advisor (EA) that trades automatically based on interactions with trend lines.
1. Understanding Trend Lines
A straight line that crosses two or more price points on a chart is called a trend line. When properly positioned, it helps you recognize the current trend and possible trading chances. Trend lines are skewed and follow the market's natural direction, which may be sideways, upward, or downward, as opposed to established horizontal support and resistance levels.
Since many chart patterns are framed by or created around trend lines, trend lines are particularly crucial for identifying certain patterns. For instance, the price is squeezed between two convergent trend lines until a breakthrough happens in a falling or rising wedge. The consolidation zone before the continuation move is defined by trend lines in Flag and Pennant patterns.
1.1. Types of Trend Lines
1.1.1. Ascending Trend Line
In an uptrend, an ascending trend line serves as a support level by joining higher lows. It assists you in identifying probable selling chances when the price breaks below it, indicating a potential trend reversal or deeper downturn, and buying opportunities during pullbacks.

1.1.2. Descending Trend Line
A falling trend line indicates bearish momentum, whereas an ascending trend line slopes upward. In a descending market, it is created by joining two or more lower highs. As a resistance level, this downward-sloping line indicates that the market is moving in a bearish general direction.
During brief price increases, descending trend lines provide sell opportunities since they predict a downward price reversal once the price touches the line. A breakout, however, is important, as is the case with ascending trend lines. The price may signal a likely turnaround from a downward to an upward trend and present a potential buy opportunity if it breaks above the falling trend line.

A descending trend line indicates bearish momentum, whereas an ascending trend line slopes upward. In a descending market, it is created by joining two or more lower highs. As a resistance level, this downward-sloping line indicates that the market is moving in a bearish general direction.
By emphasizing significant breakouts that frequently indicate changes in market momentum, trend lines provide visual clarity and tactical trade entries. Understanding trend line behavior, as opposed to learning specific patterns by heart, offers a versatile basis for pattern recognition and is particularly helpful when developing automated techniques such as Expert Advisors in MQL5.
2. Setting up the Project
2.1. How the EA Works
In this project, we'll create an Expert Advisor that uses the chart's trend lines to make trades automatically. Depending on the state of the market, the EA creates legitimate ascending or descending trend lines by analyzing recent swing highs and lows.
The EA tracks how the price interacts with the trend lines once they are established. In two primary scenarios, it will take trades. The EA will first trade in the trend's direction, anticipating a reversal, when the price reaches the trend line and reverses. Second, the EA will identify a breakout-retest pattern and place a trade in the breakout direction when the price crosses a trend line and then retests it from the opposite side. Because of this logic, the EA may be used with various chart patterns, including wedges, flags, triangles, and channels, all of which mostly depend on the dynamics of trend lines.
2.1.1. Ascending Trend Line
2.1.1.1. Logic for Buy
- The EA will detect two swing lows and draw an ascending trend line across them.
- The EA continuously watches for price movement that returns to touch or approach the trend line without breaking it.
- When the price touches the trend line and immediately forms a bullish candle, the EA considers it a valid bounce.
- Upon confirmation of a bullish bounce from the ascending trend line, the EA places a buy order.
- The user can specify the number of points below the entry price or the low of the bounce candle as the SL.
- The user can specify the TP in points above the entry price.

2.1.1.2. Logic for Sell
- The EA will detect two swing lows and draw an ascending trend line across them.
- It continuously monitors for a bearish breakout below this ascending trend line.
- Once the price breaks below the trend line, the EA waits for a retest — where the price returns to touch the trend line from below.
- If a bearish candle forms immediately after the retest and the low price is below the trend line, the EA considers this a valid breakout and confirmation.
- Upon confirmation of the bearish retest, the EA places a sell order.
- The user can specify the number of points above the entry price or above the high of the retest candle as the SL.
- The user can also specify the TP in points below the entry price.

2.1.2. Descending Trend Line
2.1.2.1. Logic for Buy
- The EA will detect two swing highs and draw a descending trend line across them.
- It continuously monitors for a bullish breakout above the descending trend line.
- Once the price breaks above the trend line, the EA waits for a retest — where the price returns to touch or approach the broken trend line from above.
- If a bullish candle forms immediately after the retest and high price is above the trend line, the EA considers this a valid breakout and confirmation.
- Upon confirmation of the bullish retest, the EA places a buy order.
- The user can specify the number of points below the entry price or below the low of the retest candle as the Stop Loss (SL).
- The user can also specify the Take Profit (TP) in points above the entry price.

2.1.2.2. Logic for Sell
- The EA will detect two swing highs and draw a descending trend line across them.
- It continuously monitors for price movement that touches the descending trend line.
- When the price touches the trend line and immediately forms a bearish candle, the EA considers it a valid reversal.
- Upon confirmation of a bearish bounce from the descending trend line, the EA places a sell order.
- The user can specify the number of points above the entry price or the high of the bounce candle as the Stop Loss (SL).
- The user can also specify the Take Profit (TP) in points below the entry price.

Note: Developing your knowledge of MQL5 programming ideas, particularly how to work with chart patterns and create useful Expert Advisors, is the primary goal of the trading strategy that will be explored in this project. It is not meant to be used with real money or for live trading. Before implementing any technique in a live market, always conduct a comprehensive back-test and get advice from a financial expert.
3. Identifying Ascending and Descending Trend Line
We can start putting things into practice programmatically now that we have thoroughly discussed the idea of how the Expert Advisor will operate. Enabling the EA to recognize and draw trend lines automatically is the first step. The EA will first locate two significant swing points on the chart before drawing a trend line. It will look for the two most recent higher lows (swing lows), which indicate upward momentum, for an ascending trend line.
It will search for the two most recent lower highs (swing highs), which signify downward pressure, for a falling trend line. After identifying these swing locations, the EA will connect them with a trend line. Then, this line serves as the benchmark for identifying possible breakout or reversal possibilities.
3.1. Retrieving Candlestick Data
The key component of any project involving chart patterns is candlestick data. Without it, it is impossible to assess price structure or identify swing highs and lows. For this reason, extracting historical candlestick data from the chart is the first stage in creating our EA. Important price details like each candle's Open, High, Low, and Close are included in this data. With the use of this data, we will be able to recognize trend lines, spot market structure, and use reversal or breakout signals to discover possible trade entries.
Example:// Timeframe to use for retrieving candlestick data (default is the current chart timeframe) input ENUM_TIMEFRAMES time_frame = PERIOD_CURRENT; // Number of past bars (candlesticks) to check int bars_check = 500; // Arrays to store candlestick data double close_price[]; // Stores close prices double open_price[]; // Stores open prices double low_price[]; // Stores low prices double high_price[]; // Stores high prices datetime time_price[]; // Stores time data for each candle //+------------------------------------------------------------------+ //| Expert initialization function | //+------------------------------------------------------------------+ int OnInit() { // Set arrays as series so the newest bar is index 0 ( start from the latest bar) ArraySetAsSeries(close_price, true); ArraySetAsSeries(open_price, true); ArraySetAsSeries(low_price, true); ArraySetAsSeries(high_price, true); ArraySetAsSeries(time_price, true); return(INIT_SUCCEEDED); // Signal that the EA initialized successfully } //+------------------------------------------------------------------+ //| Expert deinitialization function | //+------------------------------------------------------------------+ void OnDeinit(const int reason) { } //+------------------------------------------------------------------+ //| Expert tick function | //+------------------------------------------------------------------+ void OnTick() { // Copy the latest candlestick data into the arrays CopyOpen(_Symbol, time_frame, 1, bars_check, open_price); // Open prices CopyClose(_Symbol, time_frame, 1, bars_check, close_price); // Close prices CopyLow(_Symbol, time_frame, 1, bars_check, low_price); // Low prices CopyHigh(_Symbol, time_frame, 1, bars_check, high_price); // High prices CopyTime(_Symbol, time_frame, 1, bars_check, time_price); // Candle times }
Explanation:
To create an EA that reacts to chart patterns, historical candlestick data must be gathered. The code stores this information in five arrays: open, close, high, low, and time. These arrays serve as the basis for trend line drawing and swing point detection. With PERIOD_CURRENT as the default, the EA uses the timeframe of the current chart. Users can select the timeframe the EA should operate on (e.g., M1, H1, D1) using the input variable time_frame. The bars_check variable, which is set to 500 in this instance, determines how many prior candles should be examined. Thus, ignoring the candle that is now forming, the EA will retrieve and examine the last 500 completed candlesticks.
Each of these arrays is set up using ArraySetAsSeries(..., true); inside the OnInit() function. Because it flips the array order, this step is crucial because it makes index 0 relate to the most recent finished candle, index 1 to the candle that came before it, and so on. Starting with the most recent price activity and working backward, this indexing method is in line with how traders intuitively examine charts.
The OnTick() method is where the majority of the data retrieval takes place. This function is activated on each tick, or whenever the market price changes. Within it, the EA pulls candlestick data into the appropriate arrays using CopyOpen, CopyClose, CopyHigh, CopyLow, and CopyTime. While the first option guarantees that the EA avoids the present developing candle (because it might change quickly and isn't dependable for pattern discovery), the second argument is the chosen timeframe. The information obtained goes back to bars_check candles.
3.2. Identifying Ascending Trend Line
Finding swing points in the price movement comes next once candlestick data has been retrieved. Finding an ascending trend line, which usually appears when the market is making higher lows, will be our first goal. This implies that finding two legitimate swing lows must come first. To help the EA identify possible bullish setups like rebounds or breakouts along this upward support, these swing lows will act as anchor points for drawing the ascending trend line.
Example:
// Timeframe to use for retrieving candlestick data (default is the current chart timeframe)
input ENUM_TIMEFRAMES time_frame = PERIOD_CURRENT;
// Input to enable or disable drawing of the ascending trend line (true = allow drawing)
input bool allow_uptrend = true;
// Number of candles to look back when identifying swing lows for drawing the trend line
input int LookbackBars = 5;

// Number of past bars (candlesticks) to check
int bars_check = 500;

// Arrays to store candlestick data
double close_price[];   // Stores close prices
double open_price[];    // Stores open prices
double low_price[];     // Stores low prices
double high_price[];    // Stores high prices
datetime time_price[];  // Stores time data for each candle

double first_low;           // Price value of the first identified swing low
datetime first_low_time;    // Time when the first swing low occurred

double second_low;          // Price value of the second identified swing low
datetime second_low_time;   // Time when the second swing low occurred

string up_trend = "Up Trend";  // Label used to name the ascending trend line object on the chart

long chart_id = ChartID();     // Stores the current chart ID for referencing during object creation or manipulation

//+------------------------------------------------------------------+
//| Expert initialization function                                   |
//+------------------------------------------------------------------+
int OnInit()
  {
// Set arrays as series so the newest bar is index 0 ( start from the latest bar)
   ArraySetAsSeries(close_price, true);
   ArraySetAsSeries(open_price, true);
   ArraySetAsSeries(low_price, true);
   ArraySetAsSeries(high_price, true);
   ArraySetAsSeries(time_price, true);

   return(INIT_SUCCEEDED);  // Signal that the EA initialized successfully
  }

//+------------------------------------------------------------------+
//| Expert deinitialization function                                 |
//+------------------------------------------------------------------+
void OnDeinit(const int reason)
  {

   ObjectsDeleteAll(chart_id);

  }

//+------------------------------------------------------------------+
//| Expert tick function                                             |
//+------------------------------------------------------------------+
void OnTick()
  {
// Copy the latest candlestick data into the arrays
   CopyOpen(_Symbol, time_frame, 1, bars_check, open_price);     // Open prices
   CopyClose(_Symbol, time_frame, 1, bars_check, close_price);   // Close prices
   CopyLow(_Symbol, time_frame, 1, bars_check, low_price);       // Low prices
   CopyHigh(_Symbol, time_frame, 1, bars_check, high_price);     // High prices
   CopyTime(_Symbol, time_frame, 1, bars_check, time_price);     // Candle times

// If the user allows drawing of ascending trend line
   if(allow_uptrend)
     {
      // First loop: Find the most recent swing low (first low)
      for(int i = LookbackBars; i < bars_check - LookbackBars; i++)
        {
         // Check if current point is a swing low
         if(IsSwingLow(low_price, i, LookbackBars))
           {
            // Store price and time of the first (latest) swing low
            first_low = low_price[i];
            first_low_time = time_price[i];
            break;  // Exit loop after finding the first swing low
           }
        }

      // Second loop: Find an earlier swing low that is lower than the first low
      for(int i = LookbackBars; i < bars_check - LookbackBars; i++)
        {
         // Check for earlier swing low that is lower and occurs before the first low
         if(IsSwingLow(low_price, i, LookbackBars) && low_price[i] < first_low && time_price[i] < first_low_time)
           {
            // Store price and time of the second (older) swing low
            second_low = low_price[i];
            second_low_time = time_price[i];
            break;  // Exit loop after finding the second swing low
           }
        }

      // Create an ascending trend line from the second low to the first low
      ObjectCreate(chart_id, up_trend, OBJ_TREND, 0, second_low_time, second_low, first_low_time, first_low);
      ObjectSetInteger(chart_id, up_trend, OBJPROP_TIMEFRAMES, OBJ_NO_PERIODS);  // Temporarily hide line on all timeframes

      // If the swing structure is valid (i.e., second low is lower than first)
      if(first_low > second_low && second_low > 0)
        {
         // Extend the trend line to the right
         ObjectSetInteger(chart_id, up_trend, OBJPROP_RAY_RIGHT, true);

         // Show the trend line on all timeframes
         ObjectSetInteger(chart_id, up_trend, OBJPROP_TIMEFRAMES, OBJ_ALL_PERIODS);

         // Set visual properties: color and thickness
         ObjectSetInteger(chart_id, up_trend, OBJPROP_COLOR, clrBlue);
         ObjectSetInteger(chart_id, up_trend, OBJPROP_WIDTH, 3);
        }
     }

  }

//+------------------------------------------------------------------+
//| FUNCTION FOR LOWS                                                |
//+------------------------------------------------------------------+
bool IsSwingLow(const double &low[], int index, int lookback)
  {

   for(int i = 1; i <= lookback; i++)
     {

      if(low[index] > low[index - i] || low[index] > low[index + i])
         return false;
     }
   return true;
  }
Output:

Explanation:
Finding swing lows in a price series is the purpose of the IsSwingLow function. An array of low prices (low[]), a certain index inside that array (index), and a lookback number that specifies how many bars to the left and right should be checked are the three arguments it requires. The for loop inside the method iterates from 1 to lookback. It compares the low at the current index to the lows at index + i (right) and index - i (left) for every iteration.
The function returns false, indicating that the point is not a swing low, if the current low is greater than any of the nearby lows. The function returns true, indicating the discovery of a swing low, if the current low is lower than all nearby lows within the lookback range. In essence, it guarantees that the low at the designated index is a local minimum. That is, the lowest point in the area surrounding it.
The trend line logic is controlled by two essential inputs. The first, allow_uptrend, is a boolean that lets users choose whether to draw the trend line in ascending order. The code will try to locate two swing lows and create a trend line connecting them if it is set to true. LookbackBars, the second input, specifies how many candles should be examined to the left and right of a point to establish whether it is a swing low. The IsSwingLow function makes use of the same lookback value. The swing low requirement becomes more sensitive with a lower value and stricter with a higher value (requiring a more severe dip).
The price values of the two most recent swing lows found in the candlestick data are stored in the variables first_low and second_low. The time values at which such swing lows happened are correspondingly stored in first_low_time and second_low_time. The upward trend line will thereafter be drawn using these time-price pairs. The ID of the current chart is stored in chart_id, and the name of the trend line object (a straightforward label: "Up Trend") is stored in the up_trend variable. When generating or altering graphical objects such as trend lines, the chart ID is required to determine the appropriate chart context.
The EA starts by searching for two legitimate swing lows when allow_uptrend is true. To prevent accessing out-of-bounds array items, the first for loop runs through the price data from LookbackBars up to bars_check - LookbackBars. To ascertain whether each point is a swing low, it makes use of the IsSwingLow function. After determining the most recent legitimate swing low, it records its price and time in first_low and first_low_time before ending the loop.
Following the identification of the first low, the second for loop uses IsSwingLow to continue the scan in the same direction, but this time it adds two requirements: the second low must be lower than the first, and it must have happened earlier than the first low. After locating such a point, it breaks the loop after storing the price and time in second_low and second_low_time. To create an ascending trend line, the EA must first discover an earlier, lower low and then a newer, higher low, which is ensured by this two-step search.
The code then uses ObjectCreate to build the ascending trend line after identifying both swing lows. Using their respective timestamps, this function links the chart's second_low and first_low. To prevent drawing the line too soon, it is first concealed from all times using OBJ_NO_PERIODS. Following confirmation that the structure is correct (first_low > second_low and second_low > 0), OBJPROP_RAY_RIGHT is used to extend the line to the right, causing it to project forward in time. OBJ_ALL_PERIODS is also used to make it viewable across all timeframes.
The trend line's color is changed to blue (clrBlue), and its width is set to three pixels to increase its visual clarity. These improvements help the trend line stand out from other chart elements and make it simple to identify on the chart.
3.3. Identifying Descending Trend Line
The next step is to duplicate a similar procedure for locating and drawing a descending trend line, now that we have successfully used the theory for creating an ascending trend line using swing lows. This time, though, we will concentrate on swing highs rather than swing lows. A swing high is a local maximum that happens when a price point is greater than a predetermined number of surrounding bars on the left and right.
We'll develop a function to identify swing highs, loop through historical candlesticks to identify two legitimate highs (where the second high is lower than the first), and then draw a descending trend line connecting these two points, just like we did with the ascending trend line. With its downward slope, this line will indicate a downtrend and serve as a possible resistance level where traders may want to sell or anticipate price rejection.
Example:// Timeframe to use for retrieving candlestick data (default is the current chart timeframe) input ENUM_TIMEFRAMES time_frame = PERIOD_CURRENT; // Input to enable or disable drawing of the ascending trend line (true = allow drawing) input bool allow_uptrend = true; // Number of candles to look back when identifying swing lows for drawing the trend line input int LookbackBars = 5; // Input to enable or disable drawing of the descebding trend line (true = allow drawing) input bool allow_downtrend = true; // Number of past bars (candlesticks) to check int bars_check = 500; // Arrays to store candlestick data double close_price[]; // Stores close prices double open_price[]; // Stores open prices double low_price[]; // Stores low prices double high_price[]; // Stores high prices datetime time_price[]; // Stores time data for each candle double first_low; // Price value of the first identified swing low datetime first_low_time; // Time when the first swing low occurred double second_low; // Price value of the second identified swing low datetime second_low_time; // Time when the second swing low occurred string up_trend = "Up Trend"; // Label used to name the ascending trend line object on the chart long chart_id = ChartID(); // Stores the current chart ID for referencing during object creation or manipulation double first_high; // Price value of the first identified swing high (latest high) datetime first_high_time; // Time when the first swing high occurred double second_high; // Price value of the second identified swing high (older high) datetime second_high_time; // Time when the second swing high occurred string down_trend = "Down Trend"; // Label used to name the descending trend line object on the chart //+------------------------------------------------------------------+ //| Expert initialization function | //+------------------------------------------------------------------+ int OnInit() { // Set arrays as series so the newest bar is index 0 ( start from the latest bar) ArraySetAsSeries(close_price, true); ArraySetAsSeries(open_price, true); ArraySetAsSeries(low_price, true); ArraySetAsSeries(high_price, true); ArraySetAsSeries(time_price, true); return(INIT_SUCCEEDED); // Signal that the EA initialized successfully } //+------------------------------------------------------------------+ //| Expert deinitialization function | //+------------------------------------------------------------------+ void OnDeinit(const int reason) { ObjectsDeleteAll(chart_id); } //+------------------------------------------------------------------+ //| Expert tick function | //+------------------------------------------------------------------+ void OnTick() { // Copy the latest candlestick data into the arrays CopyOpen(_Symbol, time_frame, 1, bars_check, open_price); // Open prices CopyClose(_Symbol, time_frame, 1, bars_check, close_price); // Close prices CopyLow(_Symbol, time_frame, 1, bars_check, low_price); // Low prices CopyHigh(_Symbol, time_frame, 1, bars_check, high_price); // High prices CopyTime(_Symbol, time_frame, 1, bars_check, time_price); // Candle times // If the user allows drawing of ascending trend line if(allow_uptrend) { // First loop: Find the most recent swing low (first low) for(int i = LookbackBars; i < bars_check - LookbackBars; i++) { // Check if current point is a swing low if(IsSwingLow(low_price, i, LookbackBars)) { // Store price and time of the first (latest) swing low first_low = low_price[i]; first_low_time = time_price[i]; break; // Exit loop after finding the first swing low } } // Second loop: Find an earlier swing low that is lower than the first low for(int i = LookbackBars; i < bars_check - LookbackBars; i++) { // Check for earlier swing low that is lower and occurs before the first low if(IsSwingLow(low_price, i, LookbackBars) && low_price[i] < first_low && time_price[i] < first_low_time) { // Store price and time of the second (older) swing low second_low = low_price[i]; second_low_time = time_price[i]; break; // Exit loop after finding the second swing low } } // Create an ascending trend line from the second low to the first low ObjectCreate(chart_id, up_trend, OBJ_TREND, 0, second_low_time, second_low, first_low_time, first_low); ObjectSetInteger(chart_id, up_trend, OBJPROP_TIMEFRAMES, OBJ_NO_PERIODS); // Temporarily hide line on all timeframes // If the swing structure is valid (i.e., second low is lower than first) if(first_low > second_low && second_low > 0) { // Extend the trend line to the right ObjectSetInteger(chart_id, up_trend, OBJPROP_RAY_RIGHT, true); // Show the trend line on all timeframes ObjectSetInteger(chart_id, up_trend, OBJPROP_TIMEFRAMES, OBJ_ALL_PERIODS); // Set visual properties: color and thickness ObjectSetInteger(chart_id, up_trend, OBJPROP_COLOR, clrBlue); ObjectSetInteger(chart_id, up_trend, OBJPROP_WIDTH, 3); } } // // Only proceed if drawing descending trend lines is enabled if(allow_downtrend) { // First loop: Find the most recent swing high (first high) for(int i = LookbackBars; i < bars_check - LookbackBars; i++) { // Check if the current bar is a swing high if(IsSwingHigh(high_price, i, LookbackBars)) { // Store the price and time of this latest swing high first_high = high_price[i]; first_high_time = time_price[i]; break; // Exit loop once the first swing high is found } } // Second loop: Find an earlier swing high that is higher than the first high and occurred before it for(int i = LookbackBars; i < bars_check - LookbackBars; i++) { // Check for earlier swing high that is higher and happened before the first one if(IsSwingHigh(high_price, i, LookbackBars) && high_price[i] > first_high && time_price[i] < first_high_time) { // Store the price and time of this older swing high second_high = high_price[i]; second_high_time = time_price[i]; break; // Exit loop once the second swing high is found } } // Create a trend line object from the second swing high to the first swing high ObjectCreate(chart_id, down_trend, OBJ_TREND, 0, second_high_time, second_high, first_high_time, first_high); // Initially hide the trend line across all timeframes to avoid partial drawing ObjectSetInteger(chart_id, down_trend, OBJPROP_TIMEFRAMES, OBJ_NO_PERIODS); // Validate the swing structure: // The older swing high should be higher than the later swing high to confirm a descending trend line if(first_high < second_high && second_high > 0) { // Extend the trend line indefinitely to the right for better visual guidance ObjectSetInteger(chart_id, down_trend, OBJPROP_RAY_RIGHT, true); // Make the trend line visible on all chart timeframes ObjectSetInteger(chart_id, down_trend, OBJPROP_TIMEFRAMES, OBJ_ALL_PERIODS); // Set the trend line color to dark green for clear distinction ObjectSetInteger(chart_id, down_trend, OBJPROP_COLOR, clrDarkGreen); // Set the thickness of the trend line to 3 pixels for better visibility ObjectSetInteger(chart_id, down_trend, OBJPROP_WIDTH, 3); } } } //+------------------------------------------------------------------+ //| FUNCTION FOR LOWS | //+------------------------------------------------------------------+ bool IsSwingLow(const double &low[], int index, int lookback) { for(int i = 1; i <= lookback; i++) { if(low[index] > low[index - i] || low[index] > low[index + i]) return false; } return true; } //+------------------------------------------------------------------+ //| FUNCTION FOR HIGHS | //+------------------------------------------------------------------+ bool IsSwingHigh(const double &high[], int index, int lookback) { for(int i = 1; i <= lookback; i++) { if(high[index] < high[index - i] || high[index] < high[index + i]) return false; } return true; }
Output:

Explanation:
By comparing a bar's high price to the highs of nearby bars during a predetermined lookback period, the function IsSwingHigh determines if a given bar is a swing high. The bar returns true, confirming a local peak, if its high is greater than any of these neighbors; if not, it returns false. The descending trend line on the chart can be drawn or disabled using the input variable allow_downtrend.
The code initially looks for the most recent swing high, or first_high, and records its price and time to determine the descending trend line. It then searches for an earlier swing high (second_high) that preceded the first and was higher. The trend line that connects these two places is therefore called "Down Trend." A descending trend line becomes clear when a recent swing high is lower than a previous one, confirming a downtrend. It connects lower highs, is styled for visibility, and extends forward on the chart. This logic is essentially the opposite of an ascending trend line, which links higher lows to show an uptrend.
4. Executing Trades Based on Trend Line Breakouts and Reversals
We discussed in the last chapter how to use the price chart's important swing points to programmatically build both ascending and descending trend lines. Building on that basis, we will discuss how to execute trades based on trend line breakouts and reversals in this chapter. We'll specifically look at how to recognize when the price crosses certain trend lines or reverses course, as well as how to use these indicators to efficiently enter or exit trades.
4.1. Ascending Trend Lines
We have only so far concentrated on identifying the first and second swing lows to build the ascending trend line. However, how can we determine when the market breaks out and might retest the trend line, or when it touches it and reverses? To base trading decisions on how the price interacts with the trend line, this stage is essential. Thanks to built-in functions that let us obtain the price level of a trend line at any given time or bar index, MQL5 has thankfully made this process simpler.
To make more informed trading decisions, we will go over how to recognize when the price approaches or crosses an ascending trend line in this section. We'll look at the tools that MQL5 offers, whether you're trying to catch a bounce off support or a breakout-and-retest entry. We will concentrate on examining the final four bars on the chart because breakouts and reversals usually take place within the most recent candles. In most cases, these recent bars will show the indications of a trend line being broken or respected.
Consequently, we will carefully examine if all four of the most recent bars satisfy the requirements for either a breakout or a reversal, rather than looking over the complete chart history. We can respond to new market movements and make informed trading decisions with this strategy. We'll use MQL5 to programmatically implement this reasoning in the parts that follow.
Example:double t_line_value; // Ascending trend line price level at the time of the most recent bar (not the ticking bar) double t1_line_value; // Ascending trend line price level at the time of the second most recent bar double t2_line_value; // Ascending trend line price level at the time of the third most recent bar double t3_line_value; // Ascending trend line price level at the time of the fourth most recent bar
if(allow_uptrend)
  {
// First loop: Find the most recent swing low (first low)
   for(int i = LookbackBars; i < bars_check - LookbackBars; i++)
     {
      // Check if current point is a swing low
      if(IsSwingLow(low_price, i, LookbackBars))
        {
         // Store price and time of the first (latest) swing low
         first_low = low_price[i];
         first_low_time = time_price[i];
         break;  // Exit loop after finding the first swing low
        }
     }

// Second loop: Find an earlier swing low that is lower than the first low
   for(int i = LookbackBars; i < bars_check - LookbackBars; i++)
     {
      // Check for earlier swing low that is lower and occurs before the first low
      if(IsSwingLow(low_price, i, LookbackBars) && low_price[i] < first_low && time_price[i] < first_low_time)
        {
         // Store price and time of the second (older) swing low
         second_low = low_price[i];
         second_low_time = time_price[i];
         break;  // Exit loop after finding the second swing low
        }
     }

// Create an ascending trend line from the second low to the first low
   ObjectCreate(chart_id, up_trend, OBJ_TREND, 0, second_low_time, second_low, first_low_time, first_low);
   ObjectSetInteger(chart_id, up_trend, OBJPROP_TIMEFRAMES, OBJ_NO_PERIODS);  // Temporarily hide line on all timeframes

// If the swing structure is valid (i.e., second low is lower than first)
   if(first_low > second_low && second_low > 0)
     {
      // Extend the trend line to the right
      ObjectSetInteger(chart_id, up_trend, OBJPROP_RAY_RIGHT, true);

      // Show the trend line on all timeframes
      ObjectSetInteger(chart_id, up_trend, OBJPROP_TIMEFRAMES, OBJ_ALL_PERIODS);

      // Set visual properties: color and thickness
      ObjectSetInteger(chart_id, up_trend, OBJPROP_COLOR, clrBlue);
      ObjectSetInteger(chart_id, up_trend, OBJPROP_WIDTH, 3);


      // Get the price values of the trend line at the corresponding times of the four most recent bars
      t_line_value = ObjectGetValueByTime(chart_id, up_trend, time_price[0], 0);   // Current bar
      t1_line_value = ObjectGetValueByTime(chart_id, up_trend, time_price[1], 0);  // One bar ago
      t2_line_value = ObjectGetValueByTime(chart_id, up_trend, time_price[2], 0);  // Two bars ago
      t3_line_value = ObjectGetValueByTime(chart_id, up_trend, time_price[3], 0);  // Three bars ago

      Comment("Ascending trend tine value for the last 4 Bars",
              "\nBar 0: ",  DoubleToString(t_line_value, _Digits),
              "\nBar 1: ", DoubleToString(t1_line_value, _Digits),
              "\nBar 2: ",  DoubleToString(t2_line_value, _Digits),
              "\nBar 3: ",  DoubleToString(t3_line_value, _Digits));

     }
  }
Output:

Explanation:
The ObjectGetValueByTime() function, which yields the price level of the designated chart object (in this case, the trend line) at a specific time, is used to obtain the trend line value. This enables us to determine the location of the trend line at the closing of each of the most recent bars.
For this, we employ four distinct variables. The trend line value at bar 0, which is the most recent completed bar rather than the one that is actively building (commonly referred to as the "ticking bar"), is stored in the variable t_line_value. The trend line level at bar 1, or the bar immediately preceding the most recent, is stored in the variable t1_line_value. The trend line values for bars 2 and 3, which reflect bars that closed two and three periods ago, respectively, are similarly stored in t2_line_value and t3_line_value.
It should be noted that even though we call time_price[0] "bar 0," it really shows up on the chart as the second bar from the right. This is because we don't utilize the final bar, the one farthest to the right, in our analysis because it is still growing and hasn't closed. The way we utilized the CopyTime() function earlier in the code, where copying started at index 1 and skipped the current (unclosed) bar for more trustworthy data, is likewise consistent with this pattern. For the sake of review or debugging, the code prints these trend line values directly on the chart using the Comment() function. This output lets you observe how the trend line is acting in relation to the most recent bars and is displayed in the upper-left area of the chart window. It is especially helpful for figuring out whether the trend line is the site of a breakout or a reversal.
4.1.1. Ascending Trend Line Trade Execution
The next step is to provide the logic that decides when to execute a trade, whether it be a breakout or a reversal, now that we know how to precisely extract the trend line values at the moment of the most recent closed bars. We can now determine what is happening at the trend line by comparing the trend line values for the most recent bars to the actual price movement, such as candle closes or lows/highs.
4.1.1.1. Reversal
It is now up to us to specify the logic for carrying out trades based on reversal signals, since we now know how to obtain the trend line's price values at various bar timings. To ascertain whether the market has respected the trend line and is reversing from it, current bar prices are compared to the matching trend line values. Look for a rebound off the trend line, even if this concept might seem straightforward. Accurately implementing it can be a little more difficult. Reversals can have many structures and are frequently subtle. At times, the entire body of the candle may rest on the trend line, while at other times, the candle may simply wick into the line and close above it. Sometimes the price will even break below a certain level and then turn back violently, a phenomenon called a false breakout.
The parameters necessary to accurately identify a real reversal may become complicated as a result of these variances. The way several candles interact with the trend line should also be considered, in addition to the current candle's position. This could entail verifying with supportive indicators like bullish candle patterns, making sure there isn't a significant closing below the trend line, and seeing if the lows of recent candles are touching or bouncing off the line. To minimize false signals, these layered conditions necessitate careful programming logic and make reversal detection with trend lines more complex.
Below are some valid reversal conditions:
Wick Rejection and Bullish Reversal at Ascending Trend Line: 
As you can see, the candle instantly reversed upward after only the wick hit the rising trend line. This proves that the price was swiftly rejected when it challenged the trend line as support. The reversal is further supported by the fact that the same bar later closed as a bullish candle. Because it shows a strong reaction from buyers at a crucial support level, this kind of price action where the wick interacts with the trend line, but the body closes sharply in the other direction is a legitimate requirement for making a buy trade.
Bearish Candle Wick Touch Followed by Bullish Confirmation:

A bearish candle's wick touched the ascending trend line in the graphic above, and the candle closed above the line. The candle does not, however, instantly satisfy the need for a reversal entry because it is bearish. The immediately following bullish candle provides confirmation. This bullish candle is a legitimate condition for executing a buy trade since it indicates that buyers have intervened following the trend line contact. To validate the reversal, a bullish bar must be present.
Multiple Bearish Closes Before Bullish Reversal Confirmation:

A bearish candle closed above the ascending trend line when its wick touched it. Despite being bearish as well, the next candle closed above the trend line. A bullish candle that satisfied the requirements for a reversal entry didn't form until the third candle. The market obeyed the trend line, but it took a few candles for the bulls to take control, as this setup demonstrates. A possible buy transaction is confirmed by the last bullish candle.
False Breakout Reversal with Immediate Bullish Confirmation: 
A potential breakthrough could be indicated by the fact that the first candle to touch the ascending trend line closed below it. The candle that followed, nevertheless, was a powerful bullish one that closed above the trend line. This prompt reaction is crucial, since the bullish candle that developed right after the touch supports the reversal. The market still regards the trend line as support, as evidenced by the instantaneous bullish reaction, despite a brief close below it. It is therefore a legitimate setup for a buy trade.
There are particular conditions that render a reversal at the trend line invalid, just as there are many conditions that justify it. We can steer clear of bad trades and erroneous alerts thanks to these incorrect circumstances. They are also essential in preventing the execution of several trades in a brief period of time that are prompted by similar or repeating signals. This keeps our approach disciplined and prevents overtrading.
Invalid Reversal after Confirmed Breakout:

The rising trend line has already been crossed by two bearish candles. A bullish candle no longer qualifies as a legitimate reversal indicator, even if it eventually finishes above the trend line. The breakout is regarded as confirmed because the structure has already been breached. Any further bullish activity is regarded as noise or a possible retest and is not considered a legitimate entry.
Preventing Repetitive Trade Signals on Multiple Reversals:

Each of the three bullish candles in the preceding image has a wick that touches the rising trend line before reversing upward. The algorithm might execute several trades for every touch if the right conditions aren't in place to filter such patterns, even if they are all part of the same broad reversal move. In these situations, it's critical to create logic that restricts trade execution to the first valid signal.
Your logic needs to be thoroughly examined and considered for this and a number of other comparable situations. They may result in delayed entries, repeating trades, or false signals if improperly handled. Strict validation requirements must be put in place to avoid needless or duplicate trade executions during densely packed signals, in addition to verifying legitimate reversal situations.
Example:
#include <Trade/Trade.mqh>
CTrade trade;
int MagicNumber = 532127;


// Timeframe to use for retrieving candlestick data (default is the current chart timeframe)
input ENUM_TIMEFRAMES time_frame = PERIOD_CURRENT;
// Input to enable or disable drawing of the ascending trend line (true = allow drawing)
input bool allow_uptrend = true;
// Number of candles to look back when identifying swing lows for drawing the trend line
input int LookbackBars = 5;

// Input to enable or disable drawing of the descebding trend line (true = allow drawing)
input bool allow_downtrend = true;
input bool allow_break_out = true;    // Enable or disable trade execution on trend line breakout (true = allow)
input bool allow_reversal = true;     // Enable or disable trade execution on trend line reversal (true = allow)
input double lot_size = 0.6;          // Lot size for each trade
input double sl_points = 10;          // Stop Loss in points from entry price
input double tp_points = 50;          // Take Profit in points from entry price

// Number of past bars (candlesticks) to check
int bars_check = 500;

// Arrays to store candlestick data
double close_price[];   // Stores close prices
double open_price[];    // Stores open prices
double low_price[];     // Stores low prices
double high_price[];    // Stores high prices
datetime time_price[];  // Stores time data for each candle

double first_low;           // Price value of the first identified swing low
datetime first_low_time;    // Time when the first swing low occurred

double second_low;          // Price value of the second identified swing low
datetime second_low_time;   // Time when the second swing low occurred
string up_trend = "Up Trend";  // Label used to name the ascending trend line object on the chart
long chart_id = ChartID();     // Stores the current chart ID for referencing during object creation or manipulation
double first_high;          // Price value of the first identified swing high (latest high)
datetime first_high_time;   // Time when the first swing high occurred
double second_high;         // Price value of the second identified swing high (older high)
datetime second_high_time;  // Time when the second swing high occurred
string down_trend = "Down Trend";  // Label used to name the descending trend line object on the chart
double t_line_value;   // Ascending trend line price level at the time of the most recent bar (not the ticking bar)
double t1_line_value;  // Ascending trend line price level at the time of the second most recent bar
double t2_line_value;  // Ascending trend line price level at the time of the third most recent bar
double t3_line_value;  // Ascending trend line price level at the time of the fourth most recent bar

// Time boundary used to limit lookback for valid reversal setups
datetime lookbackf_time;

datetime lastTradeBarTime = 0;

//+------------------------------------------------------------------+
//| Expert initialization function                                   |
//+------------------------------------------------------------------+
int OnInit()
  {
// Set arrays as series so the newest bar is index 0 ( start from the latest bar)
   ArraySetAsSeries(close_price, true);
   ArraySetAsSeries(open_price, true);
   ArraySetAsSeries(low_price, true);
   ArraySetAsSeries(high_price, true);
   ArraySetAsSeries(time_price, true);

   trade.SetExpertMagicNumber(MagicNumber);

   return(INIT_SUCCEEDED);  // Signal that the EA initialized successfully
  }

//+------------------------------------------------------------------+
//| Expert deinitialization function                                 |
//+------------------------------------------------------------------+
void OnDeinit(const int reason)
  {

   ObjectsDeleteAll(chart_id);

  }

//+------------------------------------------------------------------+
//| Expert tick function                                             |
//+------------------------------------------------------------------+
void OnTick()
  {
// Copy the latest candlestick data into the arrays
   CopyOpen(_Symbol, time_frame, 1, bars_check, open_price);     // Open prices
   CopyClose(_Symbol, time_frame, 1, bars_check, close_price);   // Close prices
   CopyLow(_Symbol, time_frame, 1, bars_check, low_price);       // Low prices
   CopyHigh(_Symbol, time_frame, 1, bars_check, high_price);     // High prices
   CopyTime(_Symbol, time_frame, 1, bars_check, time_price);     // Candle times

   double ask_price = SymbolInfoDouble(_Symbol,SYMBOL_ASK);
   datetime currentBarTime = iTime(_Symbol, time_frame, 0);

// If the user allows drawing of ascending trend line
   if(allow_uptrend)
     {
      // First loop: Find the most recent swing low (first low)
      for(int i = LookbackBars; i < bars_check - LookbackBars; i++)
        {
         // Check if current point is a swing low
         if(IsSwingLow(low_price, i, LookbackBars))
           {
            // Store price and time of the first (latest) swing low
            first_low = low_price[i];
            first_low_time = time_price[i];
            lookbackf_time = time_price[i - 3];

            break;  // Exit loop after finding the first swing low
           }
        }

      // Second loop: Find an earlier swing low that is lower than the first low
      for(int i = LookbackBars; i < bars_check - LookbackBars; i++)
        {
         // Check for earlier swing low that is lower and occurs before the first low
         if(IsSwingLow(low_price, i, LookbackBars) && low_price[i] < first_low && time_price[i] < first_low_time)
           {
            // Store price and time of the second (older) swing low
            second_low = low_price[i];
            second_low_time = time_price[i];
            break;  // Exit loop after finding the second swing low
           }
        }

      // Create an ascending trend line from the second low to the first low
      ObjectCreate(chart_id, up_trend, OBJ_TREND, 0, second_low_time, second_low, first_low_time, first_low);
      ObjectSetInteger(chart_id, up_trend, OBJPROP_TIMEFRAMES, OBJ_NO_PERIODS);  // Temporarily hide line on all timeframes

      // If the swing structure is valid (i.e., second low is lower than first)
      if(first_low > second_low && second_low > 0)
        {
         // Extend the trend line to the right
         ObjectSetInteger(chart_id, up_trend, OBJPROP_RAY_RIGHT, true);

         // Show the trend line on all timeframes
         ObjectSetInteger(chart_id, up_trend, OBJPROP_TIMEFRAMES, OBJ_ALL_PERIODS);

         // Set visual properties: color and thickness
         ObjectSetInteger(chart_id, up_trend, OBJPROP_COLOR, clrBlue);
         ObjectSetInteger(chart_id, up_trend, OBJPROP_WIDTH, 3);

         // Get the price values of the trend line at the corresponding times of the four most recent bars
         t_line_value = ObjectGetValueByTime(chart_id, up_trend, time_price[0], 0);   // Current bar
         t1_line_value = ObjectGetValueByTime(chart_id, up_trend, time_price[1], 0);  // One bar ago
         t2_line_value = ObjectGetValueByTime(chart_id, up_trend, time_price[2], 0);  // Two bars ago
         t3_line_value = ObjectGetValueByTime(chart_id, up_trend, time_price[3], 0);  // Three bars ago

         // Number of bars between the valid bullish confirmation candle and current time
         int no_bars = 0;

         // Loop through the last 4 bars to check for reversal wick touch on the trend line
         for(int i = 0; i <= 3; i++)
           {
            // Condition: Wick of the candle touches below the trend line but opens above it (indicating a potential reversal zone)
            if(low_price[i] < ObjectGetValueByTime(chart_id, up_trend, time_price[i], 0) &&
               open_price[i] > ObjectGetValueByTime(chart_id, up_trend, time_price[i], 0))
              {
               // Check if there's a bullish confirmation candle after the wick touch (within or immediately after)
               for(int j = i; j >= 0; j--)
                 {
                  // Bullish candle that closed above the trend line
                  if(close_price[j] > open_price[j] &&
                     close_price[j] > ObjectGetValueByTime(chart_id, up_trend, time_price[j], 0))
                    {
                     // Count how many bars ago this confirmation occurred
                     no_bars = Bars(_Symbol, time_frame, time_price[j], TimeCurrent());
                     break;
                    }
                 }
               break; // Exit after first valid reversal zone is found
              }
           }

         // Check whether a similar wick touch (reversal) happened recently to avoid repeated signals
         bool prev_touch = false;

         if((low_price[1] < t1_line_value && close_price[1] > open_price[1]) ||  // Bar 1 had reversal wick and bullish body
            (low_price[2] < t2_line_value && close_price[2] > open_price[2]))    // Bar 2 had reversal wick and bullish body
           {
            prev_touch = true;  // Flag that a recent touch already occurred
           }

         // Final condition for executing a BUY trade on a reversal setup
         if(
            // One of the recent 4 bars touched and rejected the trend line (wick below, open above), AND
            ((low_price[0] < t_line_value && open_price[0] > t_line_value) ||
             (low_price[1] < t1_line_value && open_price[1] > t1_line_value) ||
             (low_price[2] < t2_line_value && open_price[2] > t2_line_value) ||
             (low_price[3] < t3_line_value && open_price[3] > t3_line_value))
            &&
            // Current candle must be bullish and close above the trend line
            (close_price[0] > open_price[0]) && close_price[0] > t_line_value
            &&
            // The bullish confirmation must occur within 3 bars
            (no_bars < 3)
            &&
            // No recent wick reversal signal already processed
            prev_touch == false
            &&
            // The signal must be more recent than the lookback time threshold
            (time_price[3] > lookbackf_time)
            &&
            // Reversal signals are allowed and this signal is not duplicated from the same bar
            (allow_reversal == true && currentBarTime != lastTradeBarTime)
         )
           {
            // Execute BUY trade with defined lot size, SL and TP
            trade.Buy(lot_size, _Symbol, ask_price, ask_price - sl_points, ask_price + tp_points);
            lastTradeBarTime = currentBarTime; // Update last trade bar time to avoid duplicate signals
           }
        }
     }

//
// Only proceed if drawing descending trend lines is enabled
   if(allow_downtrend)
     {
      // First loop: Find the most recent swing high (first high)
      for(int i = LookbackBars; i < bars_check - LookbackBars; i++)
        {
         // Check if the current bar is a swing high
         if(IsSwingHigh(high_price, i, LookbackBars))
           {
            // Store the price and time of this latest swing high
            first_high = high_price[i];
            first_high_time = time_price[i];

            break;  // Exit loop once the first swing high is found
           }
        }

      // Second loop: Find an earlier swing high that is higher than the first high and occurred before it
      for(int i = LookbackBars; i < bars_check - LookbackBars; i++)
        {
         // Check for earlier swing high that is higher and happened before the first one
         if(IsSwingHigh(high_price, i, LookbackBars) && high_price[i] > first_high && time_price[i] < first_high_time)
           {
            // Store the price and time of this older swing high
            second_high = high_price[i];
            second_high_time = time_price[i];

            break;  // Exit loop once the second swing high is found
           }
        }

      // Create a trend line object from the second swing high to the first swing high
      ObjectCreate(chart_id, down_trend, OBJ_TREND, 0, second_high_time, second_high, first_high_time, first_high);

      // Initially hide the trend line across all timeframes to avoid partial drawing
      ObjectSetInteger(chart_id, down_trend, OBJPROP_TIMEFRAMES, OBJ_NO_PERIODS);

      // Validate the swing structure:
      // The older swing high should be higher than the later swing high to confirm a descending trend line
      if(first_high < second_high && second_high > 0)
        {
         // Extend the trend line indefinitely to the right for better visual guidance
         ObjectSetInteger(chart_id, down_trend, OBJPROP_RAY_RIGHT, true);

         // Make the trend line visible on all chart timeframes
         ObjectSetInteger(chart_id, down_trend, OBJPROP_TIMEFRAMES, OBJ_ALL_PERIODS);

         // Set the trend line color to dark green for clear distinction
         ObjectSetInteger(chart_id, down_trend, OBJPROP_COLOR, clrDarkGreen);

         // Set the thickness of the trend line to 3 pixels for better visibility
         ObjectSetInteger(chart_id, down_trend, OBJPROP_WIDTH, 3);

        }
     }
  }

//+------------------------------------------------------------------+
//| FUNCTION FOR LOWS                                                |
//+------------------------------------------------------------------+
bool IsSwingLow(const double &low[], int index, int lookback)
  {

   for(int i = 1; i <= lookback; i++)
     {

      if(low[index] > low[index - i] || low[index] > low[index + i])
         return false;
     }
   return true;
  }

//+------------------------------------------------------------------+
//| FUNCTION FOR HIGHS                                               |
//+------------------------------------------------------------------+
bool IsSwingHigh(const double &high[], int index, int lookback)
  {

   for(int i = 1; i <= lookback; i++)
     {
      if(high[index] < high[index - i] || high[index] < high[index + i])
         return false;
     }
   return true;
  }
Output:


Explanation:
To access the CTrade class, which is used to place and manage trades in MQL5, the code first includes the trade library Trade.mqh. Like Buy() and Sell() perform trading operations, a CTrade object called trade is constructed. To differentiate transactions executed by this specific Expert Advisor from others, the computer assigns the EA a unique MagicNumber. SetExpertMagicNumber() is used to set this value.
A number of input parameters are then specified. These let the user alter the behavior of the EA without changing the main code. To regulate whether trades should be permitted in downtrend situations, on breakout patterns, or in reversal setups, for instance, the on/off switches allow_downtrend, allow_break_out, and allow_reversal are used. While sl_points and tp_points specify the distance in points between the stop loss and take profit from the entry price, the lot_size parameter establishes the size of each position.
For timing control, two variables are used: lookbackf_time and lastTradeBarTime. How far back in time the software should search for legitimate reversal configurations is determined by the lookbackf_time. Any previous configurations are disregarded at this point. To help eliminate redundant or duplicate signals, the lastTradeBarTime variable is utilized to prevent performing multiple trades on the same candle.
int no_bars = 0;
for(int i = 0; i <= 3; i++)
  {
   if(low_price[i] < ObjectGetValueByTime(chart_id, up_trend, time_price[i], 0) &&
      open_price[i] > ObjectGetValueByTime(chart_id, up_trend, time_price[i], 0))
     {
      for(int j = i; j >= 0; j--)
        {
         if(close_price[j] > open_price[j] &&
            close_price[j] > ObjectGetValueByTime(chart_id, up_trend, time_price[j], 0))
           {
            no_bars = Bars(_Symbol, time_frame, time_price[j], TimeCurrent());
            break;
           }
        }
      break;
     }
  }
The latest four candles (bars 0 through 3) are scanned in this part to see if any of them showed wick behavior that would indicate a reversal signal: the low broke below the trend line, but the open stayed above it. This implies that the trend line has been rejected. Once such a candle has been identified, the inner loop searches for a bullish confirmation candle, which is one that closed above both the open and the trend line. If it is located, it uses Bars() to determine how many bars ago that confirmation occurred and saves the result in no_bars.
bool prev_touch = false;
if((low_price[1] < t1_line_value && close_price[1] > open_price[1]) ||
   (low_price[2] < t2_line_value && close_price[2] > open_price[2])) {
    prev_touch = true;
}
This block determines whether candles 1 or 2 have already touched the trend line and closed bullish, to prevent repeating or premature warnings. Prev_touch is set to true if either of the two conditions is true, suggesting that a reversal may have previously occurred recently and that another signal on the current bar should be disregarded.
if(
   ((low_price[0] < t_line_value && open_price[0] > t_line_value) ||
    (low_price[1] < t1_line_value && open_price[1] > t1_line_value) ||
    (low_price[2] < t2_line_value && open_price[2] > t2_line_value) ||
    (low_price[3] < t3_line_value && open_price[3] > t3_line_value))
   &&
   (close_price[0] > open_price[0]) && close_price[0] > t_line_value
   &&
   (no_bars < 3)
   &&
   prev_touch == false
   &&
   (time_price[3] > lookbackf_time)
   &&
   (allow_reversal == true && currentBarTime != lastTradeBarTime)
)
  {
   trade.Buy(lot_size, _Symbol, ask_price, ask_price - sl_points, ask_price + tp_points);
   lastTradeBarTime = currentBarTime;
  }
It first verifies that at least one of the last four candles showed wick behavior, which is when the price touched the trend line but opened above it, suggesting a possible rejection zone; it then requires that the current candle is bullish and has closed above the trend line, strengthening the signal; and finally, it requires that the bullish confirmation candle that was previously identified occurred within the last three bars to ensure that the setup is still valid. This conditional block verifies whether a reversal buy trade should be executed by checking a number of important criteria.
The algorithm verifies that no comparable wick-based touch signal was recently detected, hence prev_touch must be false to prevent repeated entries. Additionally, it makes sure that the setup is more recent than the lookbackf_time that is supplied, which restricts the range of signals that the program accepts as legitimate.
Lastly, by verifying that currentBarTime is not equal to lastTradeBarTime, it prevents duplication and verifies that reversal transactions are permitted (allow_reversal is true) and that no trade has already been conducted on the same candle. A buy order with the designated lot size, stop loss, and take profit values is executed if all of these requirements are satisfied. To stop more trades from being made on the same candle, the lastTradeBarTime is then updated to the time of the current bar.
4.1.1.2. Breakout and Retest
Breakout and retest setups around an ascending trend line follow similar order placement criteria as reversals. The price may retreat to retest the broken support, which is now serving as resistance, after breaking below the trend line. A full-bodied candle or just a wick hitting the trend line can trigger this retest. The breakout can be confirmed by placing a sell order if the retest is successful and the price is refused.

Example:
// If the user allows drawing of ascending trend line
if(allow_uptrend)
  {
// First loop: Find the most recent swing low (first low)
   for(int i = LookbackBars; i < bars_check - LookbackBars; i++)
     {
      // Check if current point is a swing low
      if(IsSwingLow(low_price, i, LookbackBars))
        {
         // Store price and time of the first (latest) swing low
         first_low = low_price[i];
         first_low_time = time_price[i];
         lookbackf_time = time_price[i - 3];

         break;  // Exit loop after finding the first swing low
        }
     }

// Second loop: Find an earlier swing low that is lower than the first low
   for(int i = LookbackBars; i < bars_check - LookbackBars; i++)
     {
      // Check for earlier swing low that is lower and occurs before the first low
      if(IsSwingLow(low_price, i, LookbackBars) && low_price[i] < first_low && time_price[i] < first_low_time)
        {
         // Store price and time of the second (older) swing low
         second_low = low_price[i];
         second_low_time = time_price[i];
         break;  // Exit loop after finding the second swing low
        }
     }

// Create an ascending trend line from the second low to the first low
   ObjectCreate(chart_id, up_trend, OBJ_TREND, 0, second_low_time, second_low, first_low_time, first_low);
   ObjectSetInteger(chart_id, up_trend, OBJPROP_TIMEFRAMES, OBJ_NO_PERIODS);  // Temporarily hide line on all timeframes

// If the swing structure is valid (i.e., second low is lower than first)
   if(first_low > second_low && second_low > 0)
     {
      // Extend the trend line to the right
      ObjectSetInteger(chart_id, up_trend, OBJPROP_RAY_RIGHT, true);

      // Show the trend line on all timeframes
      ObjectSetInteger(chart_id, up_trend, OBJPROP_TIMEFRAMES, OBJ_ALL_PERIODS);

      // Set visual properties: color and thickness
      ObjectSetInteger(chart_id, up_trend, OBJPROP_COLOR, clrBlue);
      ObjectSetInteger(chart_id, up_trend, OBJPROP_WIDTH, 3);


      // Get the price values of the trend line at the corresponding times of the four most recent bars
      t_line_value = ObjectGetValueByTime(chart_id, up_trend, time_price[0], 0);   // Current bar
      t1_line_value = ObjectGetValueByTime(chart_id, up_trend, time_price[1], 0);  // One bar ago
      t2_line_value = ObjectGetValueByTime(chart_id, up_trend, time_price[2], 0);  // Two bars ago
      t3_line_value = ObjectGetValueByTime(chart_id, up_trend, time_price[3], 0);  // Three bars ago

      // Number of bars between the valid bullish confirmation candle and current time
      int no_bars = 0;

      // Loop through the last 4 bars to check for reversal wick touch on the trend line
      for(int i = 0; i <= 3; i++)
        {
         // Condition: Wick of the candle touches below the trend line but opens above it (indicating a potential reversal zone)
         if(low_price[i] < ObjectGetValueByTime(chart_id, up_trend, time_price[i], 0) &&
            open_price[i] > ObjectGetValueByTime(chart_id, up_trend, time_price[i], 0))
           {
            // Check if there's a bullish confirmation candle after the wick touch (within or immediately after)
            for(int j = i; j >= 0; j--)
              {
               // Bullish candle that closed above the trend line
               if(close_price[j] > open_price[j] &&
                  close_price[j] > ObjectGetValueByTime(chart_id, up_trend, time_price[j], 0))
                 {
                  // Count how many bars ago this confirmation occurred
                  no_bars = Bars(_Symbol, time_frame, time_price[j], TimeCurrent());
                  break;
                 }
              }
            break; // Exit after first valid reversal zone is found
           }
        }

      // Check whether a similar wick touch (reversal) happened recently to avoid repeated signals
      bool prev_touch = false;

      if((low_price[1] < t1_line_value && close_price[1] > open_price[1]) ||  // Bar 1 had reversal wick and bullish body
         (low_price[2] < t2_line_value && close_price[2] > open_price[2]))    // Bar 2 had reversal wick and bullish body
        {
         prev_touch = true;  // Flag that a recent touch already occurred
        }

      // Final condition for executing a BUY trade on a reversal setup
      if(
         // One of the recent 4 bars touched and rejected the trend line (wick below, open above), AND
         ((low_price[0] < t_line_value && open_price[0] > t_line_value) ||
          (low_price[1] < t1_line_value && open_price[1] > t1_line_value) ||
          (low_price[2] < t2_line_value && open_price[2] > t2_line_value) ||
          (low_price[3] < t3_line_value && open_price[3] > t3_line_value))
         &&
         // Current candle must be bullish and close above the trend line
         (close_price[0] > open_price[0]) && close_price[0] > t_line_value
         &&
         // The bullish confirmation must occur within 3 bars
         (no_bars < 3)
         &&
         // No recent wick reversal signal already processed
         prev_touch == false
         &&
         // The signal must be more recent than the lookback time threshold
         (time_price[3] > lookbackf_time)
         &&
         // Reversal signals are allowed and this signal is not duplicated from the same bar
         (allow_reversal == true && currentBarTime != lastTradeBarTime)
      )
        {
         // Execute BUY trade with defined lot size, SL and TP
         trade.Buy(lot_size, _Symbol, ask_price, ask_price - sl_points, ask_price + tp_points);
         lastTradeBarTime = currentBarTime; // Update last trade bar time to avoid duplicate signals
        }

      //BREAKOUT AND RETEST

      // Flag to track whether a recent bearish wick rejection (touch) already occurred
      bool prev_touch2 = false;

      // Check the last 2 bars to see if a candle had its high wick above the trend line,
      // but closed bearishly below the open - indicating a possible rejection
      if((high_price[1] > t1_line_value && close_price[1] < open_price[1]) ||
         (high_price[2] > t2_line_value && close_price[2] < open_price[2] && open_price[2] < t2_line_value))
        {
         prev_touch2 = true; // Set flag to avoid duplicate signals
        }

      // Variable to store how many bars ago the bearish confirmation candle appeared
      int no_bars2 = 0;

      // Loop through the last 4 candles to detect a wick rejection of the trend line (retest)
      for(int i = 0; i <= 3; i++)
        {
         // Condition: Candle wick (high) goes above the trend line, but the open is below it
         if(high_price[i] > ObjectGetValueByTime(chart_id, up_trend, time_price[i], 0) &&
            open_price[i] < ObjectGetValueByTime(chart_id, up_trend, time_price[i], 0))
           {
            // Search backward from that bar for a bearish confirmation candle
            for(int j = i; j >= 0; j--)
              {
               // Bearish candle that also closed below the trend line
               if(close_price[j] < open_price[j] &&
                  close_price[j] < ObjectGetValueByTime(chart_id, up_trend, time_price[j], 0))
                 {
                  // Count bars between that confirmation and now
                  no_bars2 = Bars(_Symbol, time_frame, time_price[j], TimeCurrent());
                  break; // Exit inner loop
                 }
              }
            break; // Exit outer loop after first valid retest
           }
        }

      // Final conditions to confirm a breakout and retest sell setup:
      // 1. One of the last 4 candles had a wick above the trend line but opened below it
      // 2. Current candle is bearish and closed below the trend line
      // 3. There was no recent similar signal (prev_touch2 == false)
      // 4. The bearish confirmation occurred within the last 3 bars
      // 5. Breakout trades are allowed and this signal is not from the same bar as the last trade
      if(((high_price[1] >= t1_line_value && open_price[1] < t1_line_value) ||
          (high_price[2] >= t2_line_value && open_price[2] < t2_line_value) ||
          (high_price[3] >= t3_line_value && open_price[3] < t3_line_value) ||
          (high_price[0] >= t_line_value)) &&
         (close_price[0] < t_line_value && close_price[0] < open_price[0] && open_price[1] < t1_line_value) &&
         prev_touch2 == false &&
         (no_bars2 < 3) &&
         (allow_break_out == true && currentBarTime != lastTradeBarTime))
        {
         // All conditions met - place SELL trade with defined SL and TP
         trade.Sell(lot_size, _Symbol, ask_price, ask_price + sl_points, ask_price - tp_points);

         // Update timestamp to prevent duplicate signals from the same bar
         lastTradeBarTime = currentBarTime;
        }
     }
  }
Outputs:


Explanation:
The code begins by declaring a boolean variable named prev_touch2, which serves as a flag to detect whether a bearish wick rejection (a false breakout) has already occurred recently. The purpose of this flag is to prevent the algorithm from triggering multiple trade signals from a similar setup that has already been handled. This helps reduce false signals and ensures the Expert Advisor only reacts to fresh, valid setups.
The algorithm then looks for indications of bearish rejection at the trend line by analyzing the preceding two candles (high_price[1] and high_price[2]). It specifically examines whether the candle's high eventually closed below its open, indicating bearish pressure and an inability to sustain the breakout, or if it briefly broke above the trend line, suggesting a potential breakout attempt. To validate the rejection, it adds a condition for the second bar ([2]) to make sure the open price is likewise below the trend line. Prev_touch2 is set to true if any of these criteria are satisfied.
After a wick touches the trend line, the variable no_bars2 is initialized to indicate how many bars ago a bearish confirmation candle appeared. This data is crucial for confirming that the signal is still genuine and that the retest was conducted lately.
After that, the code enters a loop that repeats the previous four candles. Finding a candle whose wick (the high) crossed the trend line but opened below it is its aim; this indicates that the price tried the trend line but failed to break out cleanly. After locating such a candle, a nested loop searches backward from it searching for a bearish confirmation, which is a candle that closed below both the open and the trend line at that moment. If this confirmation is discovered, the Bars() method is used to determine how many bars ago that candle occurred, and the result is stored in no_bars2. To save computation, the loops end early once valid signals are detected.
Finally, the code evaluates a set of combined conditions to determine whether to place a sell trade. These conditions check that:
- One of the last four candles had a wick that spiked above the trend line but opened below it.
- The current candle is bearish and has closed below both the trend line and its own open.
- There was no previous similar signal flagged (prev_touch2 == false).
- The bearish confirmation candle occurred recently (within the last 3 bars).
- The trade is allowed (allow_break_out == true) and it is not being duplicated from the same bar (currentBarTime != lastTradeBarTime).
A sell trade with the specified lot size, stop loss, and take profit values is executed if all of these requirements are satisfied. To prevent making another trade from the same signal, the time of the current bar is then saved in lastTradeBarTime.
4.1.2. Descending Trend Line Trade Execution
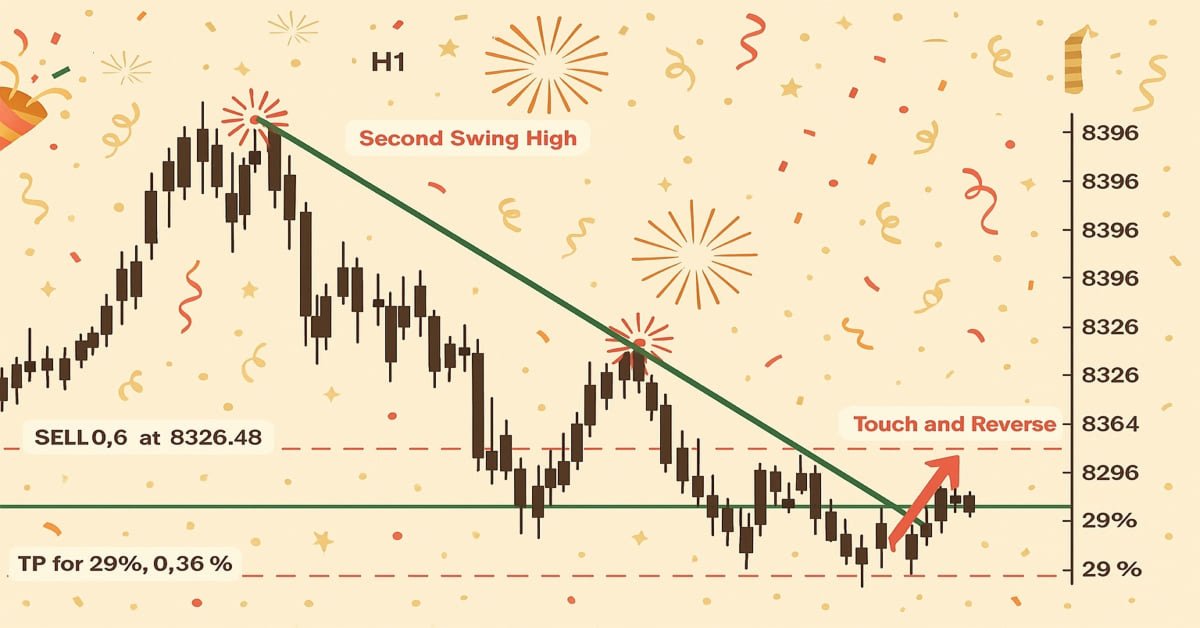
We will be searching for breakout and reversal possibilities on a descending trend line in this section. The reasoning is just the reverse of what we did for the trend line that was rising. To save needless duplication, we won't go into too much depth here because the methodology and structure are rather identical. Our attention will be on bearish setups during reversals and bullish setups during breakouts and retests, since the descending trend line serves as resistance. This is the main distinction.
Example:
// Only proceed if drawing descending trend lines is enabled
if(allow_downtrend)
  {
// First loop: Find the most recent swing high (first high)
   for(int i = LookbackBars; i < bars_check - LookbackBars; i++)
     {
      // Check if the current bar is a swing high
      if(IsSwingHigh(high_price, i, LookbackBars))
        {
         // Store the price and time of this latest swing high
         first_high = high_price[i];
         first_high_time = time_price[i];

         break;  // Exit loop once the first swing high is found
        }
     }

// Second loop: Find an earlier swing high that is higher than the first high and occurred before it
   for(int i = LookbackBars; i < bars_check - LookbackBars; i++)
     {
      // Check for earlier swing high that is higher and happened before the first one
      if(IsSwingHigh(high_price, i, LookbackBars) && high_price[i] > first_high && time_price[i] < first_high_time)
        {
         // Store the price and time of this older swing high
         second_high = high_price[i];
         second_high_time = time_price[i];

         break;  // Exit loop once the second swing high is found
        }
     }

// Create a trend line object from the second swing high to the first swing high
   ObjectCreate(chart_id, down_trend, OBJ_TREND, 0, second_high_time, second_high, first_high_time, first_high);

// Initially hide the trend line across all timeframes to avoid partial drawing
   ObjectSetInteger(chart_id, down_trend, OBJPROP_TIMEFRAMES, OBJ_NO_PERIODS);

// Validate the swing structure:
// The older swing high should be higher than the later swing high to confirm a descending trend line
   if(first_high < second_high && second_high > 0)
     {
      // Extend the trend line indefinitely to the right for better visual guidance
      ObjectSetInteger(chart_id, down_trend, OBJPROP_RAY_RIGHT, true);

      // Make the trend line visible on all chart timeframes
      ObjectSetInteger(chart_id, down_trend, OBJPROP_TIMEFRAMES, OBJ_ALL_PERIODS);

      // Set the trend line color to dark green for clear distinction
      ObjectSetInteger(chart_id, down_trend, OBJPROP_COLOR, clrDarkGreen);

      // Set the thickness of the trend line to 3 pixels for better visibility
      ObjectSetInteger(chart_id, down_trend, OBJPROP_WIDTH, 3);

      //REVERSAL

      td_line_value = ObjectGetValueByTime(chart_id,down_trend,time_price[0],0);
      td1_line_value = ObjectGetValueByTime(chart_id,down_trend,time_price[1],0);
      td2_line_value = ObjectGetValueByTime(chart_id,down_trend,time_price[2],0);
      td3_line_value = ObjectGetValueByTime(chart_id,down_trend,time_price[3],0);

      int no_bars = 0;

      for(int i = 0; i <= 3; i++)
        {

         if(high_price[i] > ObjectGetValueByTime(chart_id,down_trend,time_price[i],0) && open_price[i] < ObjectGetValueByTime(chart_id,down_trend,time_price[i],0)
           )
           {

            for(int j = i; j >= 0; j--)
              {

               if(close_price[j] < open_price[j] && close_price[j] < ObjectGetValueByTime(chart_id,down_trend,time_price[j],0))
                 {

                  no_bars = Bars(_Symbol,time_frame,time_price[j],TimeCurrent());

                  break;

                 }

              }
            break;

           }

        }

      bool prev_touch = false;

      if((high_price[1] > td1_line_value && close_price[1] < open_price[1])
         ||
         (high_price[2] > td2_line_value && close_price[2] < open_price[2])
        )
        {

         prev_touch = true;

        }

      if(((high_price[1] >= td1_line_value && open_price[1] < td1_line_value) || (high_price[2] >= td2_line_value && open_price[2] < td2_line_value)
          || (high_price[3] >= td3_line_value && open_price[3] < td3_line_value) || (high_price[0] >= td_line_value))
         && (close_price[0] < td_line_value && close_price[0] < open_price[0] && open_price[1] < td1_line_value)
         && (no_bars < 3)
         && prev_touch == false
         && (allow_reversal == true  && currentBarTime != lastTradeBarTime)
        )
        {

         trade.Sell(lot_size,_Symbol,ask_price,ask_price + sl_points, ask_price - tp_points);
         lastTradeBarTime = currentBarTime;

        }

      //BREAKOUT AMD RETEST

      // Flag to track whether a recent bullish wick rejection (touch) already occurred
      bool prev_touch2 = false;

      // Check the last 2 candles for bullish rejection from below the descending trend line
      // A bullish rejection occurs when the low goes below the trend line but closes above the open (bullish candle)
      if((low_price[1] < td1_line_value && close_price[1] > open_price[1]) ||
         (low_price[2] < td2_line_value && close_price[2] > open_price[2] && open_price[2] > td2_line_value))
        {
         prev_touch2 = true; // Set flag to prevent duplicate signals from the same type of setup
        }

      // Variable to hold how many bars ago a bullish confirmation candle occurred after wick rejection
      int no_bars2 = 0;

      // Loop through the last 4 candles to detect a wick rejection of the descending trend line
      for(int i = 0; i <= 3; i++)
        {
         // Condition: Candle wick (low) goes below the trend line, but the open is above it
         if(low_price[i] < ObjectGetValueByTime(chart_id, down_trend, time_price[i], 0) &&
            open_price[i] > ObjectGetValueByTime(chart_id, down_trend, time_price[i], 0))
           {
            // Look backward for a bullish confirmation candle that closes above the trend line
            for(int j = i; j >= 0; j--)
              {
               if(close_price[j] > open_price[j] &&
                  close_price[j] > ObjectGetValueByTime(chart_id, down_trend, time_price[j], 0))
                 {
                  // Count how many bars ago that bullish confirmation happened
                  no_bars2 = Bars(_Symbol, time_frame, time_price[j], TimeCurrent());
                  break; // Exit inner loop once confirmation is found
                 }
              }
            break; // Exit outer loop after the first valid retest is processed
           }
        }

      // Final conditions to confirm a breakout or retest for a BUY setup on descending trend line:
      // 1. One of the last 4 candles had a wick below the trend line but opened above it
      // 2. Current candle is bullish and closed above the trend line
      // 3. A valid bullish confirmation occurred within the last 3 bars
      // 4. No recent similar touch detected (prev_touch2 == false)
      // 5. Candle timestamps are valid (not too far back)
      // 6. Breakout trading is allowed, and this bar is not the same as the last trade bar
      if(
         ((low_price[0] < td_line_value && open_price[0] > td_line_value) ||
          (low_price[1] < td1_line_value && open_price[1] > td1_line_value) ||
          (low_price[2] < td2_line_value && open_price[2] > td2_line_value) ||
          (low_price[3] < td3_line_value && open_price[3] > td3_line_value)) &&
         (close_price[0] > open_price[0]) && close_price[0] > td_line_value &&
         (no_bars2 < 3) &&
         prev_touch2 == false &&
         (time_price[3] > lookbackfd_time) &&
         (allow_break_out == true && currentBarTime != lastTradeBarTime)
      )
        {
         // All conditions met - place a BUY trade with defined SL and TP
         trade.Buy(lot_size, _Symbol, ask_price, ask_price - sl_points, ask_price + tp_points);

         // Update the last trade time to avoid repeated trades from the same bar
         lastTradeBarTime = currentBarTime;
        }
     }
  }
Outputs:


Explanation:
The logic for executing BUY trades based on the breakout or rejection of a descending trend line is implemented in this section. To determine whether a recent bullish wick rejection has already taken place, we first construct a boolean variable called prev_touch2. By doing this, you can prevent making duplicate trades using the same signal. Next, we look at the last two candles to determine whether any of them had wicks that ended up closing bullish (i.e., higher than the open) despite piercing below the declining trend line. We set prev_touch2 to true if such a scenario is discovered.
The number of candles since the appearance of a legitimate bullish confirmation candle is then stored in a variable called no_bars2. To determine whether a retest is likely, we go through the last four candles and see if any of them had wicks that fell below the falling trend line while opening above it. We next loop backward from that candle to find a bullish confirmation candle, one that closed above the declining trend line and its open price, if such a wick rejection is discovered. Once located, we save the confirmation candle in no_bars2 and determine how many bars ago it appeared.
To verify a legitimate BUY configuration, we lastly integrate multiple conditions. We look to see if any of the previous four candles opened above the trend line but had wicks below it. We additionally validate that the current candle has closed above the trend line, is bullish (close is above open), and that the bullish confirmation occurred within the previous three bars.
Likewise, we also make sure that the time frame is legitimate, breakout trades are permitted, the signal isn't from the same candle as the previous trade, and no recent rejections (prev_touch2) have previously been recorded. The EA uses the specified lot size, stop loss, and take profit values to execute a BUY transaction if all of these criteria are satisfied. It also modifies lastTradeBarTime to avoid making duplicate trades from the same candle.
Conclusion
With everything we've covered in this article, you now have the foundational knowledge to work with any chart pattern that involves trend lines. From channels to ascending and descending trend lines, you've learned how to retrieve trend line values and compare them with price action, and execute trades based on clear breakout or reversal conditions. We applied this knowledge practically by using it to build an Expert Advisor (EA) that can automatically detect and respond to trend line interactions in real time. This logic is highly adaptable, which means you can apply it to other chart patterns such as triangles, wedges, and even double tops or bottoms.
Warning: All rights to these materials are reserved by MetaQuotes Ltd. Copying or reprinting of these materials in whole or in part is prohibited.
This article was written by a user of the site and reflects their personal views. MetaQuotes Ltd is not responsible for the accuracy of the information presented, nor for any consequences resulting from the use of the solutions, strategies or recommendations described.

- Free trading apps
- Over 8,000 signals for copying
- Economic news for exploring financial markets
You agree to website policy and terms of use
Thank you for this article! Just want to inform you that there is a little bug with the stoploss and takeprofit calculation :-) It's not based on points. Try it out on any fx pair (EURUSD, GBPUSD, etc.)
Hello Bro
Can your Ea will work on Deriv on Volatility??
Thank you for this article, it is very instructive. God bless you.
You're welcome, thank you for your kind words.