 MetaTrader 5
 Uzmanlar
 Göstergeler
 Kütüphaneler
 Yardımcı programlar
 Widget'lar
 Kurallar
YouTube'dan Mağaza ile ilgili öğretici videoları izleyin
Bir alım-satım robotu veya gösterge nasıl satın alınır?
Uzman Danışmanınızı
sanal sunucuda çalıştırın
sanal sunucuda çalıştırın
Satın almadan önce göstergeyi/alım-satım robotunu test edin
Mağazada kazanç sağlamak ister misiniz?
Satış için bir ürün nasıl sunulur?
MetaTrader 5 için yeni Teknik Göstergeler - 114
 Teknik göstergelerden gelen sinyaller, borsa ve Forex piyasalarında işlemler açılması ve kapatılmasında çok önemli bir rol oynar. Göstergeler, fiyat değişikliklerini tahmin etmeyi amaçlayan, finansal sembol fiyatının matematiksel dönüşümüdür.
Piyasa davranışını daha iyi tahmin etmek ve bundan kar elde etmek için teknik göstergeleri test edin.

AI Forecasts MT5 Göstergesi:
Yapay Zeka ve Derin Öğrenme ile Gelecek Tahmin Sistemi (AI + ML)
_ Temel Özellikler: Dinamik veri analizine dayalı 20 mum ileriye gelecek görüş Scalping işlemleri için uygun Tahminlerdeki güven düzeylerini yansıtan çok renkli tahmin grafikleri ve mevcut Al/Sat durumunun yanındaki beyaz pip sayacı Olasılık değişim marjı ve yönü ile beklenen fiyat yollarını gösteren olasılık bölgeleri Başlıca Shock Pullback göstergesine dayalı çok değişkenli analiz, şunları içerir: G

Projective SR – Gerçek Zamanlı Projelendirilmiş Destek ve Dirençler Projective SR , grafikteki temel destek ve direnç noktalarını otomatik olarak tespit eden ve fiyatın tepki verebileceği potansiyel bölgeleri öngörerek bunları çapraz ve dinamik bir şekilde geleceğe yansıtan gelişmiş bir göstergedir. Yalnızca sabit seviyeleri gösteren geleneksel göstergelerin aksine, Projective SR fiyatın geometrisini analiz eder , en alakalı pivotları belirler ve piyasa hareketine uyum sağlayan eğik çizgiler çiz
FREE

The Oracle is the perfect companion for traders who need accurate market analysis without managing multiple indicators.
While most indicators show single-perspective signals, The Oracle merges scientifically proven methods with proprietary enhancements into one consensus histogram. Seven models, including our Ultimate Flow Index (UFI) with Ehlers smoothing algorithms, vote independently every bar.
When enough models agree threshold you set from 4/7 aggressive to 7/7 conservative—direction be
FREE
Shadow Pulse Kısa Açıklama Shadow Pulse, ortalamaya dönüş yöntemine dayalı olarak dönüş noktalarını belirlemek için profesyonel bir göstergedir. Akıllı çok seviyeli filtreleme sistemi kullanarak son derece doğru alım ve satım sinyalleri üretir. İşlem Stratejisi Gösterge, M1'den H4'e kadar tüm zaman dilimlerinde çalışacak şekilde tasarlanmıştır ve altın (XAUUSD) scalping'inde olağanüstü sonuçlar gösterir. Düşük periyotlarda agresif işlemler için ve yüksek zaman dilimlerinde orta vadeli pozisyonla
Haven QQE PRO - Tüm Zaman Dilimlerinde Trendler için Görsel Rehberiniz Bir yatırımcının ana görevini çözmek için oluşturulmuş QQE algoritmasına dayalı pratik bir araç olan Haven QQE PRO 'yu sunuyoruz: mevcut trendi hızla belirlemek ve yönünde işlem yapmak. İndikatör, aynı anda birden fazla zaman diliminden gelen verileri analiz eder ve piyasada kimin baskın olduğunu (alıcılar mı yoksa satıcılar mı) açıkça gösterir. Diğer ürünler -> BURADA . Grafikler arasında geçiş yapma ihtiyacını unutun.

Price Compass , finansal piyasalarda sizin trend navigasyon sisteminiz olarak işlev görmek üzere tasarlanmış güçlü bir teknik analiz aracıdır. Piyasanın ortalama yön baskısını değerlendirir, kısa vadeli gürültüyü etkili bir şekilde filtreler ve hakim hareketi netlikle tanımlar. İndikatör, mevcut fiyatın "merkezi ortalamasından" ne kadar uzakta olduğunu ölçerek, piyasa yönelimi hakkında kesin bir sinyal (Yükseliş, Düşüş veya Nötr) sağlar. Yorumlama (Pusulanın Üç Hali) (Interpretação - Os Três Est

️ Power Moving Average Signals Genel Bakış: Power Moving Average Signals , biri hızlı diğeri yavaş olmak üzere iki hareketli ortalamanın kesişimine dayanan bir trend takip stratejisidir . Piyasa momentumu değiştiğinde net alım ve satım sinyalleri üretir: Alım Sinyali : Hızlı MA, yavaş MA’yı aşağıdan yukarıya doğru keserse Satım Sinyali : Hızlı MA, yavaş MA’yı yukarıdan aşağıya doğru keserse Döviz çiftleri için optimize edilmiştir: Bu strateji, özellikle Forex piyasasında güçlü perform

İşte Türkçe çevirisi, orijinal metnin biçimi aynen korunarak ve İngilizce terimler (istek üzerine) parantez içinde verilerek: Ortalama Giriş Pozisyonları Göstergesi (The Average Entry Positions Indicator) Ortalama Giriş Pozisyonları Göstergesi (The Average Entry Positions Indicator), yatırımcılara grafikteki ortalama alış ve satış giriş fiyatlarının (average buy and sell entry prices) net bir görsel temsilini sunar. Bu güçlü araç artık, kritik ticaret yönetimi bilgilerini (trade management infor

️ Ichimoku Kinko Hyo System Kesin ve etkili piyasa analizi için akıllı bir araç Bu gösterge, kanıtlanmış Ichimoku Kinko Hyo sistemine dayanır ve piyasa yapısı, dinamikleri ve olası fiyat hareketleri hakkında kapsamlı bir bakış sunar. Trader’ların görsel olarak hızlı kararlar alabilmesi için tasarlanmıştır. Temel Özellikler: Yüksek doğruluk – birden fazla zaman diliminde gelişmiş piyasa analizi ️ Anlık piyasa görünümü – fiyat yönü ve sinyal gücü net şekilde gösterilir Görsel sinya
DS Auto Thousand Grid (Evrensel) Piyasadaki temel psikolojik ve kurumsal fiyat seviyelerini otomatik olarak tespit eder. Açıklama DS Auto Thousand Grid (Evrensel) , büyük piyasa oyuncularının en çok işlem yaptığı binlik fiyat seviyelerini (örnek: 127000, 91000, 150000, 1.16000 vb.) grafikte otomatik olarak işaretler. Bu bölgeler, psikolojik ve kurumsal bariyerler olarak görev yapar; bankalar, fonlar ve algoritmalar bu seviyelerde savunma, hedef ve likidite işlemleri gerçekleştirir.
İnce ve no

Daily Support and Resistance Levels 는 클래식 피벗 포인트 방식으로 일중 거래 핵심 가격 레벨을 자동 계산/표시하는 전문 지표입니다. 주요 기능: 피벗 포인트(PP) 자동 계산 3개의 저항 레벨(R1, R2, R3) 3개의 지지 레벨(S1, S2, S3) 전일 고가/저가 표시 실시간 정보 패널 상승/하락 바이어스 표시 최근 레벨까지 거리 표시 색상/표시 완전 사용자 설정 매일 자동 업데이트 모든 타임프레임 지원 계산 방식: 전일 고가/저가/종가 기반 클래식 피벗 포인트. 트레이딩 활용: 지지/저항 반등 매매 돌파 전략 레인지 거래 방향성 판단 목표가 설정 사용 방법: 차트에 인디케이터 적용 레벨 자동 생성 가격 > PP = 상승 바이어스 가격 < PP = 하락 바이어스 S1-S3 = 지지 구간 R1-R3 = 저항 구간 설정 옵션: 피벗/지지/저항 색상 라인 굵기/스타일 가격 라벨 표시/숨기기 정보 패널 ON/OFF 패널 위치/폰트 크기 전일 고가/저가 표
FREE

This indicator is primarily used for scalping XAUUSD. It marks the Open, Low, and High prices for: the current day the previous day the current week the previous week the current month the previous month Based on these price levels, you can identify which levels the price is likely to react to. If you have any questions or requirements, please feel free to contact me via chat. Thank you, and I hope you have a nice day!

Hızlı Çizim Paneli, herhangi bir grafik köşesine düzgün bir şekilde sabitlenmiş panelden tek bir tıklamayla özel işlem nesnelerini (bölgeler ve trend çizgileri) anında çizmenizi sağlar.
Artık araç çubukları veya menüler arasında arama yapmanıza gerek yok; tek tıklama, tek bir nesne, tamam. Tamamen özelleştirilebilir renkler, çizgi boyutu ve stil.
İdeal Olanlar İçin:
Kurumsal / Akıllı Para Konsepti (SMC) / Arz ve Talep yatırımcıları. Arz ve Talep bölgesi işaretlemesi. Teknik Analiz işaretleme
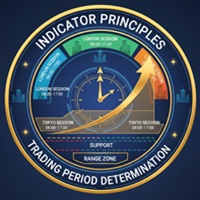
RangeZone Indicator General Overview: Global Exchange Trading from East to West World financial markets operate on the principle of continuous trading sessions, where activity moves with the sun from one financial center to another. Understanding this dynamic is key to successful trading! How Trading Moves Around the World: Asian Session (Sydney, Tokyo): Opens first, sets the tone for daily volatility Japanese yen, Australian dollar, Asian indices Often forms key support/resistance level

BVCandleView is a fresh indicator designed to give discretionary traders a visual edge by rounding price data. Pair it with a free custom-symbol service to display Bob Volman–style tick charts right inside MetaTrader 5. Rounded candles with dynamic coloring make every tick movement instantly readable. Quick Manual Installation Place BVCandleView.mq5 in MQL5/Indicators . Restart MetaTrader 5 and attach the indicator to any chart.
Key Settings Rounding Settings : choose rounding mode (round/ce
≤§≥ The red magic channel Order Blocks Indicator scans the chart for order blocks using several filters
and displays horizontal lines at the high and low prices of the order block candle.
≤§≥ All red magic channel products come with a pdf manual in English.
Here is the link for the Order Blocks Indicator : https://drive.google.com/file/d/1tPoyo7EUJghH5I8fQARzbqXYh_UOn67V/view?usp=sharing
≤§≥ If you encounter any issues with the Order Blocks Indicator, contact us at redmagicchanne

≤§≥ The red magic channel Position Manager Indicator helps you build a trading plan from scratch
and shows all the parameters directly on the chart.
≤§≥ All red magic channel products come with a pdf manual in English.
Here is the link for the Position Manager Indicator : https://drive.google.com/file/d/1tPoyo7EUJghH5I8fQARzbqXYh_UOn67V/view?usp=sharing
≤§≥ If you encounter any issues with the Position Manager Indicator, contact us at redmagicchannel@gmail.com

Sweeper PRO – Advanced Candle Sweep Detector (3-in-1) WhatsApp Support: Contact1 Money.transporter@gmail.com
Overview Sweeper PRO is a powerful and fully customizable indicator designed to detect three unique types of candle sweeps — smart entry and reversal patterns commonly used by professional price action traders.
It automatically identifies potential fakeouts, liquidity grabs, and continuation signals , helping you anticipate market reversals and confirm strong directional moves

Who is he?: Peter Tuchman, a stock trader on the NYSE.
Why is he famous?: He's known as the "Einstein of Wall Street" because of his physical resemblance to the famous trader and his hairstyle. He's frequently photographed by the media, earning him the nickname "the most photographed trader on Wall Street." His image is often used to illustrate market volatility. Career history: He started in 1985 as a telegraph operator and has held various positions before becoming a stockbroker.
AND THIS I
FREE

SMC Market Blueprint Institutional Market Structure Analyzer Based on Smart Money and ICT Concepts Overview SMC Market Blueprint is a comprehensive institutional-grade indicator designed to decode the true structure of the market using Smart Money Concepts (SMC) and ICT (Inner Circle Trader) methodology. It maps the internal market framework — identifying structure shifts, liquidity zones, and order flow transitions across multiple timeframes — giving traders a clear blueprint of how institution
≤§≥ The red magic channel Trend Indicator displays relevant highs and lows.
This allows you to easily spot reversals and trend continuation moves.
≤§≥ All red magic channel products come with a pdf manual in English.
Here is the link for the Trend Indicator : https://drive.google.com/file/d/1tPoyo7EUJghH5I8fQARzbqXYh_UOn67V/view?usp=sharing
≤§≥ If you encounter any issues with the Trend Indicator, contact us at redmagicchannel@gmail.com

N/B: All our product purchase comes with our free ‘’DAILY SCALPER EA’’ - bit.ly/4qlFLNh Whatsapp Developer for yours after successful purchase
OMEGA ONE SPIKE DETECTOR: Catch Every Explosive Move /Spikes with Surgical Precision
"I Used To Watch Spikes Fly By - Now I Catch Them Consistently Using Institutional Order Levels"
WATCHING 500-POINT SPIKE and not profiting? ENTERING TOO LATE after the big move already happened? GETTING STOPPED OUT right before the explosion?
What If

VWAP (Volume Weighted Average Price) indicator with ±1σ and ±2σ bands calculated from real traded volume and tick volume too for forex The start and end times of the session are fully configurable, as well as the standard deviation levels and the number of bands displayed. It shows the day’s volume-weighted average price and helps traders identify value areas, price extremes, and intraday trading opportunities with precision.
FREE
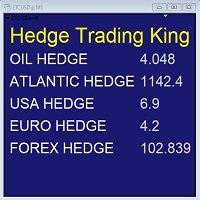
Hedge Trading Monitor is my indicator that instantly monitors the difference or ratio between two assets useful for hedge trading. How to use it + Download the indicator + Apply the indicator on an open chart + You can change the assets using the settings. Distribution + It is distributed only on MQL5.vom + Free license (FREE) - Contact me privately on MQL5.com: send me a message
FREE

A decision-support indicator for MetaTrader 5 that visualizes market structure using two complementary elements: adaptive Support/Resistance zones and a best-fit Trend Channel computed by regression. Zones scale with volatility (ATR and smoothed ATR) and update only after a pivot is validated, which helps filter noise. The channel shows prevailing slope and parallel boundaries based on average deviation; optional dotted alternatives provide additional confluence. The tool works on any symbol a

PICO RSI KF — RSI with Kalman Filtering The PICO RSI KF indicator was designed especially for scalpers and day traders who need to make fast and confident trading decisions .
It applies a 1D Kalman Filter to a volume-weighted RSI , creating a smooth and responsive signal that highlights the true turning points in market momentum. Unlike traditional oscillators, PICO RSI KF is not meant to act alone.
It is a complementary tool , ideal for confirming signals from other systems or strategies such a

Overview
The Ultimate RSI Indicator for MT5 is an advanced oscillator designed to provide a more adaptive and dynamic interpretation of market momentum compared to the traditional RSI. It incorporates range normalization, adaptive smoothing, and flexible averaging methods to enhance responsiveness and reduce lag. How It Works
Unlike the standard RSI, which only measures relative price strength, the Ultimate RSI dynamically adjusts to recent price range expansions and contractions. It calculate

Trend Regularity Adaptive Moving Average Indicator for MT5
TRAMA Indicator for MT5 Overview
The Trend Regularity Adaptive Moving Average (TRAMA) is an intelligent adaptive moving average that dynamically adjusts its sensitivity based on market structure and trend consistency. Unlike standard moving averages, TRAMA reacts to how frequently new highs or lows are formed within a defined period, providing an adaptive balance between trend-following precision and range stability. How It Works
TRAM

Trendlines with Breaks Overview The Trendlines with Breaks indicator automatically detects and plots pivot-based trendlines, dynamically adjusting their slope and steepness to highlight significant breakout events. Designed for traders who rely on price action and market structure , this tool provides an automated, real-time way to track evolving momentum and breakout confirmations . How It Works The indicator identifies swing highs and swing lows , connecting them to form adaptive trendlines ba

Stop Loss Pro – Precision Risk Management for Every Trader
Stop Loss Pro is a powerful, free MetaTrader indicator designed to take the guesswork out of risk management. Built on advanced market structure analysis, it automatically identifies and displays the most reliable stop‑loss levels directly on your chart. With this tool, traders can protect their trades with confidence, knowing that each suggested level is backed by a blend of technical logic, volume dynamics, and volatility filters. Ho
FREE

Hidden Trend Channel Project 17 Tool
SPECIAL NOVEMBER SALE is now finished. Price goes back to normal.
This is an Automated Tool for Multi Timeframe Trend Channel Analysis Visualization with Intelligent Range Market, Trending Market, Reversal, Breakout Detection. It draws multiple Trend Channels with multiple sub-trendlines levels inside the channel for perfectly give you the trader, the crystal clear Trend channels where price trend direction is moving.
This tool is accurately useful for T
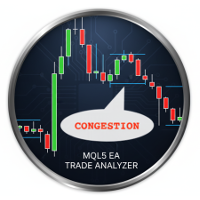
Accumulation zone indicator that identifies congestion caused by a large initial candle containing, between its high and low, the close of at least four subsequent candles. This indicator allows you to identify accumulation zones that can generate market price accelerations. Useful for analyzing historical data (you can freely configure the number of historical candles to analyze and the number of candles forming the congestion) and building your own trading strategy.
Buy Sell Swing Indicator Adaptive Swing High/Low Detector Buy Sell Swing Indicator is a dynamic swing detection indicator designed to automatically adapt to different timeframes and market conditions. It identifies key swing highs and lows with precision, helping traders analyze market structure and potential turning points without manual adjustment. The indicator removes the need for constant parameter tuning by automatically optimizing its sensitivity based on the active chart timeframe. Core

Infinity Predictor MA
Infinity Predictor MA is a next‑generation forecasting indicator that transforms the traditional Moving Average into a powerful predictive tool. Unlike standard MAs that only smooth past data, this indicator projects the moving average line up to 40 bars into the future, giving traders a unique perspective on potential market direction.
The engine behind Infinity Predictor MA combines multiple advanced regression models to capture both smooth trends and sudden market shi
FREE

MACD with 4-Color Histogram Overview MACD with 4-Color Histogram is a modern upgrade of the classic MACD indicator — redesigned for clarity, precision, and visual power .
It provides instant insight into market momentum , signal strength , and trend reversals using four distinct color zones that make trading decisions faster and more confident. Color Logic Color Condition Interpretation Green MACD > 0, Signal < MACD Bullish momentum strengthening Orange MACD > 0, Signal > MACD Bul
FREE

ICT Unicorn Killer — Complete Liquidity Reversal Detector IMPORTANT: Use in combination with the Multi-Time-Frame 'Unicorn Hunter' (scanner) for a complete detect and kill system. https://www.mql5.com/en/market/product/153999
Unicorn Killer identifies high-probability smart-money reversal setups by combining five key technical confluences into one streamlined visual tool: Fractals → Liquidity Sweep → Break of Structure → Breaker Block → Fair Value Gap → VALID UNICORN! When a Valid Unicorn

Super-Accurate ADR Scalping Machine for MT5
The 200 FREE download promotion has ended. The price has now been updated. Thank you, everyone! Checkout many example setups here, Happening Every Day : https://www.mql5.com/en/market/product/154469/comments
Love it? Hate it? Let me know in a review! Feature requests and ideas for new tools are highly appreciated. :) What It Does:
The ADR Lines Indicator automatically calculates the Average Daily Range (ADR) and plots dynamic support and resis

Comprehensive Multi-Timeframe Volume-Based Support and Resistance Indicator Overview VolumePoint Pro is a complete analytical tool built around the concept of Point of Control (POC) — the price level where the highest traded volume occurred during a specific session or period.
By tracking and displaying these price nodes over multiple timeframes, the indicator allows traders to clearly identify zones of high market participation, which often act as powerful support and resistance levels. The ind

- What does this do?
This indicator draws the standard EMAs used in Steve Mauro's BTMM (Beat the Market Maker) method:
• The 5 EMA (Mustard)
• The 13 EMA (Ketchup)
• The 50 EMA (Water)
• The 200 EMA (Mayo)
• The 800 EMA (Blueberry)
- What improvement does this indicator offer?
The original version provided by Steve Mauro was for MetaTrader4. This is for MetaTrader5.
The original version provided by Steve Mauro misplaced the EMA-crossover arrows. This indicator handle

Trend Entropy – Adaptive Chaos & Order Detector
Entropy is the scientific measure of disorder or uncertainty in a system. In physics, it shows how energy disperses and why systems move toward chaos. In information theory, it measures unpredictability in data. Low entropy means order and predictability, while high entropy reflects randomness, complexity, and reduced clarity of outcomes.
Trend Entropy is a next‑generation trading indicator designed for MetaTrader 5. Unlike conventional oscillat
FREE
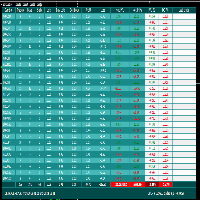
FCK Trade Report This indicator was developed by Fx Candle King. BEFORE CHOOSE CUSTOM PERIOD, GO TO TERMINAL WINDOW (ctrl+T), right click on ACCOUNT HISTORY and CHOOSE ALL HISTORY. This report searches the filtered data in your ACCOUNT CURRENT & HISTORY TRADE, Select your timespan for the report open and closed trades etc... Chose the report type - List only OPEN orders / List only CLOSED orders / List both OPEN and CLOSED orders
FREE

Magic History is a detailed trade visualization indicator designed to bring the full story of your trading activity directly onto the chart. If you’re a developer or trader who uses magic numbers, this is made for you. Smart pagination - never lose track of your trades again. Pagination means dividing content into separate pages instead of showing everything all at once.
In the context of your Magic History indicator:
Pagination is a system that lets you view your trades in sections (pages) — f

- What does this do?
This indicator draws the standard session boxes used in Steve Mauro's BTMM (Beat the Market Maker) method:
• Asian session boxes
• Brinks boxes: London and New York session changeover boxes
• New York session boxes
• Stop-hunt boxes
- Is this for me?
If you use the BTMM trading system and you are on MetaTrader5, this is for you.
• The one provided by Steve Mauro was for MetaTrader4. This is its first MetaTrader5 adaptation. You cannot find this anyw

Find potential stop-run zones before price gets there. Bank Levels Tracker highlights potential liquidity levels around obvious swing highs and lows, where retail stop losses may cluster. These areas can become important stop-run zones, often watched by Smart Money Concepts traders for possible liquidity grabs, fakeouts, and reversal setups. Instead of manually marking the same highs and lows over and over again, Bank Levels Tracker plots the levels in advance and sends an instant alert when pr
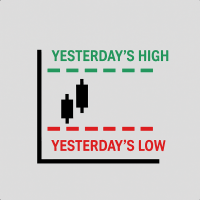
- What does this do?
This indicator draws previous day's high and low as blue tracers on the chart. It is used in Steve Mauro's BTMM (Beat the Market Maker) method.
- What improvement does this indicator offer?
The original version provided by Steve Mauro was for MetaTrader4. This is the first adaptation for MetaTrader5.
Highly optimized for computing resources. It does not affect your computer's performance at all.

- What does this do?
This indicator show the ADR and 3xADR on the chart. It is used in Steve Mauro's BTMM (Beat the Market Maker) method.
It also mark the ADR High and ADR Low as vertical line segments.
- What improvement does this indicator offer?
The original version provided by Steve Mauro was for MetaTrader4. This is the first adaptation for MetaTrader5.
Highly optimized for computing resources. It does not affect your computer's performance at all.
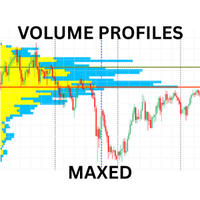
Advanced Volume Profile Indicator for MT5
Transform your trading with professional-grade volume analysis. This comprehensive volume profile indicator delivers institutional-quality market insights with multiple profile types, advanced alert system, and customizable display options. KEY FEATURES Multiple Profile Types Visible Range Profile: Analyzes volume within the current chart window Fixed Range Profile: Custom date range analysis with visual markers Session Profile: Automatic daily/week

Here our more valuable tools
SMC Trend Trading , Easy SMC Trading , Institutional SMC Architect Volume Analysis Tools , Volume flow Profile , Market volume profile , FVG with Volume , Liquidity Heatmap Profile , Volume Spread Analysis
The Fractals_Price indicator is a technical analysis tool that identifies fractal patterns on price charts. Fractals are recurring patterns that signal potential trend reversals or continuation points. This indicator marks both upward and downward
DUAL-ENGINE ANALYSIS SYSTEM: Average Tick Size Indicator : Measures bid movement strength across 6 customizable lookback periods (36, 96, 369, 500, 1000, 2000 ticks) Multi Timeframe Tick Analyzer : Calculates buy/sell pressure percentages across 6 different timeframes (100.200,300,400,500,600 ticks) REAL-TIME SIGNAL GENERATION: Combined Buy/Sell Alerts : Only triggers when BOTH analytical engines confirm the same direction Visual Arrow Signals : Clear green up arrows for buy signals, red down

Dynamic Dollar Value Indicator - Know Your Risk Before You Trade! Stop guessing and start knowing exactly what every price move means in real dollar terms! The Dynamic Dollar Value Indicator is an essential tool for professional traders who want instant visibility into the monetary value of price movements for any trading instrument. KEY FEATURES: REAL-TIME DOLLAR CALCULATIONS: Instantly displays the dollar value of 1% price moves for any symbol Automatically adapts to Forex, Stocks, In
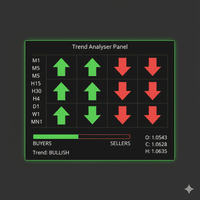
The Trend Analysis Dashboard is a powerful, all-in-one technical analysis tool designed for traders who need a clear, consolidated view of market momentum across multiple timeframes. Instead of cluttering your chart with numerous separate indicators, this tool aggregates signals from four key oscillators (Stochastic, RSI, and dual CCI) into a single, easy-to-read panel. It calculates the directional bias (Buy, Sell, or Neutral) for each enabled timeframe and provides a visual summary of over
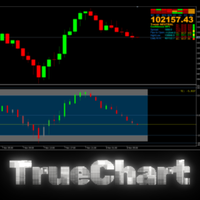
Proprietary Signal Amplification Technology
Unlike conventional indicators that merely display data, TrueChart employs advanced signal amplification that emphasizes only high-probability trading opportunities. The system automatically filters out market noise and amplifies genuine signals through multiple confirmation layers, ensuring you only see what truly matters. Revolutionary Multi-Dimensional Confirmation System
Most indicators operate in a single dimension. Our technology simultaneously

Product Description ZigZag Pro ATR - Smart Swing Detection That Adapts to Market Volatility Tired of standard ZigZag indicators that work only in specific market conditions? ZigZag Pro ATR is the professional solution. This advanced swing detection tool automatically adapts to changing volatility using ATR (Average True Range), giving you cleaner signals and a clearer view of the true market structure. Stop constantly adjusting parameters manually. Our indicator intelligently filters out mar
Stop guessing where the market will turn. Our advanced High/Low Indicator for MT5 is the ultimate tool for mastering price action and identifying key market structure. It automatically scans the chart to identify and clearly plot all critical swing highs and lows in real-time, helping you see the true story behind the candles. These crucial, non-repainting levels form the backbone of any successful trading strategy. Use them to instantly visualize the market's framework, allowing you to pinpoint
FREE

这是一个功能完整的MT5相关性矩阵指标。 主要功能 相关性矩阵显示 显示多个货币对之间的皮尔逊相关系数 正相关显示为绿色,负相关显示为红色 对角线显示为1.0(自身完全相关) 智能品种检测 支持自定义品种列表 自动匹配平台上可用的交易品种 处理不同经纪商的品种后缀 排序货币对列表 最高正相关货币对(前15名) 接近0相关性货币对(前15名) 最高负相关货币对(前15名) 自定义化设置 可调整计算周期 自定义更新频率 颜色、字体、位置等可视化参数 使用说明 输入参数 CorrelationPeriod : 相关性计算周期(默认60) UpdateInterval : 更新间隔毫秒数(默认1000) UseCustomSymbols : 是否使用自定义品种列表 CustomSymbols : 自定义品种列表(逗号分隔) MatrixPositionX/Y : 矩阵显示位置 SortedListX/YOffset : 排序列表位置 显示解读 绿色数值 : 正相关(越接近1相关性越强) 红色数值 : 负相关(越接近-1负相关性越强) 接近0的数值 : 相关性较弱 这个指标对于识别货币对之间的关
FREE
This RSI, ADX, MA, ATR, CCI MTF Dashboard v1 – Professional Multi-Timeframe Consensus ========================================================================
Professional-grade Multi-Timeframe (MTF) Dashboard with Intelligent Weighted Consensus A powerful, clean, and CPU-optimized visual tool that combines RSI, ADX, EMA, ATR, and CCI across up to 6 timeframes (W1 to M5) with a dynamic consensus engine.
Key Features: • Real MTF analysis using native iRSI, iADX, iMA, iATR, iCCI – no repaint

SMC Indicator for MT5 – Trade Like Institutions Unlock the power of institutional trading with the Smart Money Concepts (SMC) Indicator for MetaTrader 5 . Designed for traders who want to go beyond retail strategies, this advanced tool helps you identify market structure shifts, order blocks, liquidity zones, and fair value gaps with precision and clarity. Key Features: Automatic Market Structure Detection : Instantly spot Breaks of Structure (BOS), CHoCH, and trend shifts. Multi-Timeframe
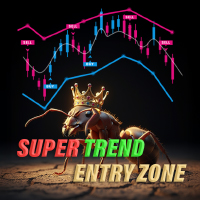
Super Trend Entry Signal Indicator is a powerful trading tool designed to identify precise entry points based on market volatility. Using the Average True Range (ATR) as its core, this indicator dynamically adjusts to current market conditions — helping traders spot potential breakout or reversal opportunities with confidence. Key Features: - Volatility-Based Entries: Calculates entry zones using real-time ATR values for adaptive precision. - Multi-Timeframe Support: Works seamlessly on any time

# Ralli Düşüş ve Taban Mumları - Profesyonel Desen Tanıma
## Genel Bakış
Ralli Düşüş ve Taban Mumları, yatırımcıların yüksek olasılıklı arz ve talep bölgelerini tespit etmelerine yardımcı olmak için tasarlanmış profesyonel bir mum deseni tanımlama sistemidir. Bu gösterge, kurumsal yatırım stratejilerinin temelini oluşturan üç kritik mum türünü otomatik olarak belirler ve vurgular: Ralli mumları (güçlü alım baskısı), Düşüş mumları (güçlü satış baskısı) ve Taban mumları (konsolidasyon bölgeleri
Signal Histogram — MetaTrader 5 platformu için güvenilir bir teknik göstergedir, mevcut trendi fiyat kapanışını hareketli ortalama ile karşılaştırarak görsel olarak belirlemek için tasarlanmıştır. Gösterge ayrı bir pencerede bir histogram görüntüler: yeşil çubuklar fiyatın ortalamanın üzerinde olduğunu, kırmızı çubuklar ise fiyatın ortalamanın altında veya eşit olduğunu gösterir. Bu yaklaşım, trend yönünü hızla değerlendirmeye ve potansiyel dönüş noktalarını belirlemeye olanak tanır. Gösterge,
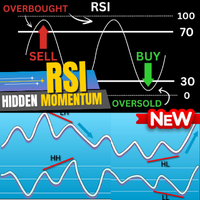
The Real RSI – Profesyonel Diverjans Göstergesi Genel Bakış The Real RSI, RSI tabanlı dönüş ve trend devam sinyallerini kurumsal düzeyde doğrulukla tespit etmek isteyen profesyonel yatırımcılar için tasarlanmış bir göstergedir.
Fiyat ile RSI arasındaki düzenli (regular) ve gizli (hidden) diverjansları otomatik olarak algılar ve her bir yapıyı akıllı pivot mantığı ile gerçek zamanlı olarak doğrular.
Bu gösterge, yeniden çizim (repaint) olmadan ve gecikmesiz sinyallerle , doğruluk, kararlılık ve g
FREE
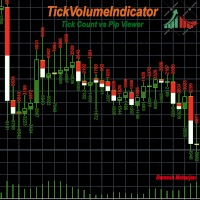
Bir grafikteki trendleri belirlemek için çeşitli göstergeler ve yöntemler mevcuttur. TickVolumeIndicator bunlardan biridir. Geçmiş trendleri tick verilerini kullanarak görüntüleyerek gelecekteki trendleri belirlemenize ve tahmin etmenize yardımcı olur.
TickVolumeIndicator, grafikteki görüntülenebilir mumlara tick hacimlerini kullanarak renk çizen bir göstergedir. Tick hacimleri, alış ve satış değerleridir. Kullanıcılar, mumların zaman dilimi için tick'in alış ve satış sayılarını veya pip değiş
FREE
Advanced UT BOT ALERTS for MT5 Profesyonel Çok Katmanlı Trend Tespit Sistemi | Geliştirilmiş UT BOT Motoru Yalnızca yüksek kaliteli göstergeler sunuyoruz. Advanced UT BOT , profesyonel kullanım için tasarlanmıştır.
Kararlı sinyal mantığı ve güvenli hesaplama yapısı sayesinde gecikme veya hatalı güncelleme olmaz.
Geçmiş sinyalleri yeniden çizmez, değiştirmez veya silmez.
Tüm BUY ve SELL sinyalleri mum kapanışı gerçekleştikten sonra oluşturulur ve sabitlenir.
Canlı işlem sırasında repaint yoktur
Multiple Divergence Detection System for MT5 Çoklu Gösterge Diverjans Tespit ve Görselleştirme Sistemi (Regular / Hidden, 10 gösterge kaynağı, hafif ve verimli) Temel Özellikler • Tüm sinyaller tek grafikte – Fiyat ile göstergeler arasındaki normal (Regular) ve gizli (Hidden) uyumsuzlukları otomatik olarak tespit eder ve çizgilerle net biçimde gösterir.
• Çoklu kaynak analizi – MACD / MACD Histogram / RSI / Stochastic / CCI / Momentum / OBV / VWMACD / CMF / MFI destekler.
Minimu

LogVar , fiyatın logaritmik değişimini hesaplayan ve gösteren bir göstergedir. Bu, dönemler arasındaki yüzde değişiklikleri ölçmenin daha doğru bir yoludur. Geçerli kapanış fiyatını n dönem önceki kapanışla ( iPeriod ) karşılaştırır ve sonucu genişletilmiş logaritmik ölçekte sunar. Çizgi otomatik olarak renklendirilir: Yeşil: fiyat referansın üzerinde (yükseliş trendi). Kırmızı: fiyat referansın altında (düşüş trendi). 0 seviyesi , pozitif ve negatif değişimleri ayıran nötr çizgidir. Ana özel
FREE

Kurumsal Likidite Sıkışma Göstergesi Bu gösterge, Bollinger Bantlarının normalize edilmiş genişliğini, hacmi ve ortalama spread’i kullanarak likidite daralmasını gerçek zamanlı olarak ölçer ve fiyat kırılmalarından önceki sıkışma evrelerini tespit eder. Görünüm:
Profesyonel tarzda ayrı bir pencerede “Compression Score” histogramı ve “Threshold” referans çizgisi. Temel Özellikler Erken tespit: Fiyat hareketlerinden önce daralma bölgelerini belirler. Çok faktörlü ölçüm: Normalize edilmiş Bollinge
Mean Reversion Probability – İstatistiksel Dönüş Göstergesi Kısa açıklama
Piyasa yorgunluk bölgelerini nicel hassasiyetle tanımlayan, 200 hareketli ortalamaya geri dönüş olasılığını tarihsel aşırılıklar analizine dayanarak hesaplayan kurumsal bir göstergedir. Temel Özellikler
Gelişmiş istatistiksel analiz – Gerçek olasılıkları hesaplamak için 500+ tarihsel aşırılık veritabanı oluşturur
Olasılık skoru 0–99% – Ortalama dönüş olasılığını kesin olarak ölçer
Yorgunluk tespiti – Aşırılığın süresini

ARB , yüksek olasılıklı kırılma (breakout) fırsatlarını belirlemek için tasarlanmış bir göstergedir.
Adaptif ATR kanal sistemi ve hassas çok faktörlü puanlama modeli (0–100) sayesinde çalışır.
Volatilite, hacim, momentum ve çoklu zaman dilimi trendini birleştirerek, filtrelenmiş, görsel ve gerçek zamanlı olarak kullanılabilir sinyaller sunar. ÇALIŞMA PRENSİPLERİ Gösterge, Adaptive Range Breakout (ARB) kavramına dayanır — bu modern kırılma ticareti yaklaşımı, piyasa volatilitesine (ATR) ve fiyatı

İşte Türkçe çevirisi: Dönüşleri Gerçekleşmeden Önce Yakalayın Bu İndikatör Neleri YAPMAZ Bu bir al/sat sinyal üreteci değildir. Size işlemlere ne zaman gireceğinizi veya ne zaman çıkacağınızı otomatik olarak söylemez. Bu İndikatör Neleri Yapar Early Reversal Detector, fiyat davranışındaki değişimleri tespit ederek optimum giriş noktalarını hassas bir şekilde belirler. Nasıl Çalışır İndikatör, ana grafiğinizdeki fiyat mumlarına benzeyen mumları ayrı bir panelde oluşturur - ancak önemli bir farkla

DS Candle Percent Panel – A complete market overview at a glance The DS Candle Percent Panel is an advanced indicator that displays in real time the percentage change of price relative to the opening of each candle across multiple timeframes — from M1 to D1 , including custom periods like H2 and H6 . With this tool, you no longer need to switch between multiple charts to see whether the market is rising on H1 while falling on M1. Everything is shown clearly, coherently, and instantly in a com
MetaTrader Mağazası, geçmiş verileri kullanarak test ve optimizasyon için alım-satım robotunun ücretsiz demosunu indirebileceğiniz tek mağazadır.
Uygulamaya genel bakışı ve diğer müşterilerin değerlendirmelerini okuyun, doğrudan terminalinize indirin ve satın almadan önce alım-satım robotunu test edin. Yalnızca MetaTrader Mağazasında bir uygulamayı tamamen ücretsiz olarak test edebilirsiniz.

Alım-satım fırsatlarını kaçırıyorsunuz:
- Ücretsiz alım-satım uygulamaları
- İşlem kopyalama için 8.000'den fazla sinyal
- Finansal piyasaları keşfetmek için ekonomik haberler
Kayıt
Giriş yap
Web sitesi politikasını ve kullanım şartlarını kabul edersiniz
Hesabınız yoksa, lütfen kaydolun