
Outras classes na biblioteca DoEasy (Parte 72): rastreamento e fixação dos parâmetros de objetos-gráficos numa coleção

Sumário
Ideia
Este artigo será o último a descrever as classes de objetos-gráficos e suas coleções. Já todos nossos gráficos abertos no terminal do cliente, suas subjanelas e indicadores são armazenados na coleção de gráficos. Se as propriedades de um gráfico mudarem, processaremos alguns eventos e enviaremos, para o gráfico de um programa de controle, um evento personalizado sobre a mudança de gráfico, de janela ou de indicador ocorrida na janela do gráfico. Também poderemos alterar as propriedades de um objeto-gráfico ou sua janela, só precisaremos inserir os novos valores das propriedades alteradas nos parâmetros do objeto alterado.
Felizmente, há muito tempo criamos um objeto que confere a todos os seus descendentes a funcionalidade de evento (o objeto base estendido que compreende todos os objetos da biblioteca). E nossas classes de objetos-gráficos e janelas de gráficos já são seus herdeiros. Só precisamos acrescentar um processamento padrão das mudanças das propriedades de seu objeto-descendente, e esta classe atualizará automaticamente todas as propriedades de seu descendente e criará uma lista de eventos que ocorreram com seu objeto descendente quando as propriedades especificadas tiverem mudado.
Para que os eventos que ocorrem num objeto sejam criados e enviados ao gráfico do programa de controle, será necessário especificar todas as propriedades monitoradas que desejamos rastrear em nosso programa. O objeto base estendido permite definir o valor de mudança da propriedade especificada, o valor limite da propriedade monitorada ou uma combinação de mudanças das propriedades monitoradas.
Quaisquer mudanças feitas nas propriedades de um objeto serão automaticamente escritas em seus parâmetros, e se forem definidas permissões para rastrear as propriedades do objeto, essas propriedades "sinalizarão" as mudanças fixadas que queremos rastrear.
Quase todos os objetos da biblioteca têm a mesma estrutura - um conjunto de propriedades (inteiras, reais e string), critérios de ordenação de objetos que correspondem exclusivamente às propriedades de cada objeto, e alguns métodos de busca e classificação em listas, métodos de descrição de propriedades de objetos e uma classe que permite a busca na lista de objetos pela propriedade especificada e retorna o índice de objetos na lista com o valor máximo ou mínimo da propriedade requerida.
Todas estas longas descrições de propriedade do objeto, que estão ligadas ao próprio objeto, tornam a criação do próprio objeto um pouco complicada, mas muitas vezes simplificam o trabalho posterior. Assim, quanto à classe do objeto-gráfico, nós a tornamos incompleta (como todos os objetos básicos da biblioteca), e simplificamos a tarefa - não escrever todas as suas propriedades separadamente, e colocá-las nas propriedades do objeto-gráfico ao qual a janela pertence.
Agora, ao criar atualizações automáticas das propriedades do objeto-gráfico e suas subjanelas, teremos dificuldade ao salvar o estado anterior dessas propriedades, usando os métodos de sua classe pai. Portanto, decidimos tornar o objeto-janela um objeto completo da biblioteca, o que simplificaria muito a criação de sua atualização automática com a busca de eventos rastreados (já fizemos tudo isso ao criar a classe pai - o objeto estendido de todos os objetos da biblioteca).
Aprimorando as classes da biblioteca
No arquivo \MQL5\Include\DoEasy\Data.mqh inserimos os índices das novas mensagens da biblioteca:
   MSG_LIB_TEXT_SYMBOL,                               // symbol:
   MSG_LIB_TEXT_ACCOUNT,                              // account:
   MSG_LIB_TEXT_CHART,                                // chart:
   MSG_LIB_TEXT_CHART_WND,                            // chart window:
   MSG_LIB_TEXT_PROP_VALUE,                           // Property value
...
   MSG_CHART_COLLECTION_CHART_OPENED,                 // Chart opened
   MSG_CHART_COLLECTION_CHART_CLOSED,                 // Chart closed

   MSG_CHART_COLLECTION_CHART_SYMB_CHANGED,           // Chart symbol changed
   MSG_CHART_COLLECTION_CHART_TF_CHANGED,             // Chart timeframe changed
   MSG_CHART_COLLECTION_CHART_SYMB_TF_CHANGED,        // Chart symbol and timeframe changed

  };
//+------------------------------------------------------------------+
e os textos que correspondem aos índices recém-adicionados:
   {"символа: ","symbol property: "},
   {"аккаунта: ","account property: "},
   {"чарта: ","chart property: "},
   {"окна чарта: ","chart window property: "},
   {"Значение свойства ","Value of the "},
...
   {"Открыт график","Open chart"},
   {"Закрыт график","Closed chart"},

   {"Изменён символ графика","Changed chart symbol"},
   {"Изменён таймфрейм графика","Changed chart timeframe"},
   {"Изменён символ и таймфрейм графика","Changed the symbol and timeframe of the chart"},

  };
//+---------------------------------------------------------------------+
Na seção de identificadores das listas de coleções do arquivo \MQL5\Include\DoEasy\Defines.mqh escrevemos um novo identificador da lista de janelas do gráfico:
//--- Collection list IDs
#define COLLECTION_HISTORY_ID          (0x777A)                   // Historical collection list ID
#define COLLECTION_MARKET_ID           (0x777B)                   // Market collection list ID
#define COLLECTION_EVENTS_ID           (0x777C)                   // Event collection list ID
#define COLLECTION_ACCOUNT_ID          (0x777D)                   // Account collection list ID
#define COLLECTION_SYMBOLS_ID          (0x777E)                   // Symbol collection list ID
#define COLLECTION_SERIES_ID           (0x777F)                   // Timeseries collection list ID
#define COLLECTION_BUFFERS_ID          (0x7780)                   // Indicator buffer collection list ID
#define COLLECTION_INDICATORS_ID       (0x7781)                   // Indicator collection list ID
#define COLLECTION_INDICATORS_DATA_ID  (0x7782)                   // Indicator data collection list ID
#define COLLECTION_TICKSERIES_ID       (0x7783)                   // Tick series collection list ID
#define COLLECTION_MBOOKSERIES_ID      (0x7784)                   // DOM series collection list ID
#define COLLECTION_MQL5_SIGNALS_ID     (0x7785)                   // MQL5 signals collection list ID
#define COLLECTION_CHARTS_ID           (0x7786)                   // Chart collection list ID
#define COLLECTION_CHART_WND_ID        (0x7787)                   // Chart window list ID
//--- Pending request type IDs
Podemos usar esses identificadores para rastrear a qual coleção ou lista um determinado objeto pertence. Neste caso, precisamos deste identificador para determinar de qual objeto surgiu um evento e para criar uma descrição desse evento. Tudo isso é feito na classe de objeto base estendido de todos os objetos da biblioteca.
No último artigo criamos o processamento de alguns eventos gráficos, hoje acrescentaremos a ele a mudança do símbolo e do período gráfico.
Para fazer isso, no mesmo arquivo adicionamos estas três constantes adicionais à enumeração de possíveis eventos do gráfico:
//+------------------------------------------------------------------+
//| Data for working with charts                                     |
//+------------------------------------------------------------------+
//+------------------------------------------------------------------+
//| List of possible chart events                                    |
//+------------------------------------------------------------------+
enum ENUM_CHART_OBJ_EVENT
  {
   CHART_OBJ_EVENT_NO_EVENT = SIGNAL_MQL5_EVENTS_NEXT_CODE, // No event
   CHART_OBJ_EVENT_CHART_OPEN,                        // "New chart opening" event
   CHART_OBJ_EVENT_CHART_CLOSE,                       // "Chart closure" event
   CHART_OBJ_EVENT_CHART_SYMB_CHANGE,                 // "Chart symbol changed" event
   CHART_OBJ_EVENT_CHART_SYMB_TF_CHANGE,              // "Chart symbol and timeframe changed" event
   CHART_OBJ_EVENT_CHART_TF_CHANGE,                   // "Chart timeframe changed" event
   CHART_OBJ_EVENT_CHART_WND_ADD,                     // "Adding a new window on the chart" event
   CHART_OBJ_EVENT_CHART_WND_DEL,                     // "Removing a window from the chart" event
   CHART_OBJ_EVENT_CHART_WND_IND_ADD,                 // "Adding a new indicator to the chart window" event
   CHART_OBJ_EVENT_CHART_WND_IND_DEL,                 // "Removing an indicator from the chart window" event
   CHART_OBJ_EVENT_CHART_WND_IND_CHANGE,              // "Changing indicator parameters in the chart window" event
  };
#define CHART_OBJ_EVENTS_NEXT_CODE  (CHART_OBJ_EVENT_CHART_WND_IND_CHANGE+1)  // The code of the next event after the last chart event code
//+------------------------------------------------------------------+
Excluímos o número da janela do gráfico da enumeração de propriedades inteiras:
   CHART_PROP_WINDOW_NUM,                             // Chart window index
  };
this property belongs to the chart window object,
vamos transferir algumas propriedades comuns tanto do gráfico quanto de sua janela ao final da lista de constantes de enumeração:
//+------------------------------------------------------------------+
//| Chart integer property                                           |
//+------------------------------------------------------------------+
enum ENUM_CHART_PROP_INTEGER
  {
   CHART_PROP_ID = 0,                                 // Chart ID
   CHART_PROP_TIMEFRAME,                              // Chart timeframe
   CHART_PROP_SHOW,                                   // Price chart drawing
   CHART_PROP_IS_OBJECT,                              // Chart object (OBJ_CHART) identification attribute
   CHART_PROP_BRING_TO_TOP,                           // Show chart above all others
   CHART_PROP_CONTEXT_MENU,                           // Enable/disable access to the context menu using the right click
   CHART_PROP_CROSSHAIR_TOOL,                         // Enable/disable access to the Crosshair tool using the middle click
   CHART_PROP_MOUSE_SCROLL,                           // Scroll the chart horizontally using the left mouse button
   CHART_PROP_EVENT_MOUSE_WHEEL,                      // Send messages about mouse wheel events (CHARTEVENT_MOUSE_WHEEL) to all MQL5 programs on a chart
   CHART_PROP_EVENT_MOUSE_MOVE,                       // Send messages about mouse button click and movement events (CHARTEVENT_MOUSE_MOVE) to all MQL5 programs on a chart
   CHART_PROP_EVENT_OBJECT_CREATE,                    // Send messages about the graphical object creation event (CHARTEVENT_OBJECT_CREATE) to all MQL5 programs on a chart
   CHART_PROP_EVENT_OBJECT_DELETE,                    // Send messages about the graphical object destruction event (CHARTEVENT_OBJECT_DELETE) to all MQL5 programs on a chart
   CHART_PROP_MODE,                                   // Type of the chart (candlesticks, bars or line (ENUM_CHART_MODE))
   CHART_PROP_FOREGROUND,                             // Price chart in the foreground
   CHART_PROP_SHIFT,                                  // Mode of shift of the price chart from the right border
   CHART_PROP_AUTOSCROLL,                             // The mode of automatic shift to the right border of the chart
   CHART_PROP_KEYBOARD_CONTROL,                       // Allow managing the chart using a keyboard
   CHART_PROP_QUICK_NAVIGATION,                       // Allow the chart to intercept Space and Enter key strokes to activate the quick navigation bar
   CHART_PROP_SCALE,                                  // Scale
   CHART_PROP_SCALEFIX,                               // Fixed scale mode
   CHART_PROP_SCALEFIX_11,                            // 1:1 scale mode
   CHART_PROP_SCALE_PT_PER_BAR,                       // The mode of specifying the scale in points per bar
   CHART_PROP_SHOW_TICKER,                            // Display a symbol ticker in the upper left corner
   CHART_PROP_SHOW_OHLC,                              // Display OHLC values in the upper left corner
   CHART_PROP_SHOW_BID_LINE,                          // Display Bid value as a horizontal line on the chart
   CHART_PROP_SHOW_ASK_LINE,                          // Display Ask value as a horizontal line on a chart
   CHART_PROP_SHOW_LAST_LINE,                         // Display Last value as a horizontal line on a chart
   CHART_PROP_SHOW_PERIOD_SEP,                        // Display vertical separators between adjacent periods
   CHART_PROP_SHOW_GRID,                              // Display a grid on the chart
   CHART_PROP_SHOW_VOLUMES,                           // Display volumes on a chart
   CHART_PROP_SHOW_OBJECT_DESCR,                      // Display text descriptions of objects
   CHART_PROP_VISIBLE_BARS,                           // Number of bars on a chart that are available for display
   CHART_PROP_WINDOWS_TOTAL,                          // The total number of chart windows including indicator subwindows
   CHART_PROP_WINDOW_HANDLE,                          // Chart window handle
   CHART_PROP_FIRST_VISIBLE_BAR,                      // Number of the first visible bar on the chart
   CHART_PROP_WIDTH_IN_BARS,                          // Width of the chart in bars
   CHART_PROP_WIDTH_IN_PIXELS,                        // Width of the chart in pixels
   CHART_PROP_COLOR_BACKGROUND,                       // Color of background of the chart
   CHART_PROP_COLOR_FOREGROUND,                       // Color of axes, scale and OHLC line
   CHART_PROP_COLOR_GRID,                             // Grid color
   CHART_PROP_COLOR_VOLUME,                           // Color of volumes and position opening levels
   CHART_PROP_COLOR_CHART_UP,                         // Color for the up bar, shadows and body borders of bull candlesticks
   CHART_PROP_COLOR_CHART_DOWN,                       // Color of down bar, its shadow and border of body of the bullish candlestick
   CHART_PROP_COLOR_CHART_LINE,                       // Color of the chart line and the Doji candlesticks
   CHART_PROP_COLOR_CANDLE_BULL,                      // Color of body of a bullish candlestick
   CHART_PROP_COLOR_CANDLE_BEAR,                      // Color of body of a bearish candlestick
   CHART_PROP_COLOR_BID,                              // Color of the Bid price line
   CHART_PROP_COLOR_ASK,                              // Color of the Ask price line
   CHART_PROP_COLOR_LAST,                             // Color of the last performed deal's price line (Last)
   CHART_PROP_COLOR_STOP_LEVEL,                       // Color of stop order levels (Stop Loss and Take Profit)
   CHART_PROP_SHOW_TRADE_LEVELS,                      // Display trade levels on the chart (levels of open positions, Stop Loss, Take Profit and pending orders)
   CHART_PROP_DRAG_TRADE_LEVELS,                      // Enable the ability to drag trading levels on a chart using mouse
   CHART_PROP_SHOW_DATE_SCALE,                        // Display the time scale on a chart
   CHART_PROP_SHOW_PRICE_SCALE,                       // Display a price scale on a chart
   CHART_PROP_SHOW_ONE_CLICK,                         // Display the quick trading panel on the chart
   CHART_PROP_IS_MAXIMIZED,                           // Chart window maximized
   CHART_PROP_IS_MINIMIZED,                           // Chart window minimized
   CHART_PROP_IS_DOCKED,                              // Chart window docked
   CHART_PROP_FLOAT_LEFT,                             // Left coordinate of the undocked chart window relative to the virtual screen
   CHART_PROP_FLOAT_TOP,                              // Upper coordinate of the undocked chart window relative to the virtual screen
   CHART_PROP_FLOAT_RIGHT,                            // Right coordinate of the undocked chart window relative to the virtual screen
   CHART_PROP_FLOAT_BOTTOM,                           // Bottom coordinate of the undocked chart window relative to the virtual screen
   CHART_PROP_YDISTANCE,                              // Distance in Y axis pixels between the upper frame of the indicator subwindow and the upper frame of the chart main window
   CHART_PROP_HEIGHT_IN_PIXELS,                       // Height of the chart in pixels
   CHART_PROP_WINDOW_IND_HANDLE,                      // Indicator handle on the chart
   CHART_PROP_WINDOW_IND_INDEX,                       // Indicator index on the chart
  };
#define CHART_PROP_INTEGER_TOTAL (66)                 // Total number of integer properties
#define CHART_PROP_INTEGER_SKIP  (2)                  // Number of integer properties not used in sorting
//+------------------------------------------------------------------+
Isto reduz em 1 o número de propriedades inteiras no gráfico, assim, escrevemos 66 em vez de 67, e especificamos que as duas últimas propriedades não devem estar envolvidas na busca e classificação, e portanto não aparecerão nas propriedades do gráfico. Estas constantes são necessárias para a classe do objeto-indicador na janela do gráfico (também é feito numa versão simplificada).
De acordo com as alterações feitas na enumeração das propriedades do gráfico, é necessário fazer alterações na enumeração dos critérios para classificar os objetos-gráficos:
//+------------------------------------------------------------------+
//| Possible chart sorting criteria                                  |
//+------------------------------------------------------------------+
#define FIRST_CHART_DBL_PROP  (CHART_PROP_INTEGER_TOTAL-CHART_PROP_INTEGER_SKIP)
#define FIRST_CHART_STR_PROP  (CHART_PROP_INTEGER_TOTAL-CHART_PROP_INTEGER_SKIP+CHART_PROP_DOUBLE_TOTAL-CHART_PROP_DOUBLE_SKIP)
enum ENUM_SORT_CHART_MODE
  {
//--- Sort by integer properties
   SORT_BY_CHART_ID = 0,                              // Sort by chart ID
   SORT_BY_CHART_TIMEFRAME,                           // Sort by chart timeframe
   SORT_BY_CHART_SHOW,                                // Sort by the price chart drawing attribute
   SORT_BY_CHART_IS_OBJECT,                           // Sort by chart object (OBJ_CHART) identification attribute
   SORT_BY_CHART_BRING_TO_TOP,                        // Sort by the flag of displaying a chart above all others
   SORT_BY_CHART_CONTEXT_MENU,                        // Sort by the flag of enabling/disabling access to the context menu using the right click
   SORT_BY_CHART_CROSSHAIR_TOO,                       // Sort by the flag of enabling/disabling access to the Crosshair tool using the middle click
   SORT_BY_CHART_MOUSE_SCROLL,                        // Sort by the flag of scrolling the chart horizontally using the left mouse button
   SORT_BY_CHART_EVENT_MOUSE_WHEEL,                   // Sort by the flag of sending messages about mouse wheel events to all MQL5 programs on a chart
   SORT_BY_CHART_EVENT_MOUSE_MOVE,                    // Sort by the flag of sending messages about mouse button click and movement events to all MQL5 programs on a chart
   SORT_BY_CHART_EVENT_OBJECT_CREATE,                 // Sort by the flag of sending messages about the graphical object creation event to all MQL5 programs on a chart
   SORT_BY_CHART_EVENT_OBJECT_DELETE,                 // Sort by the flag of sending messages about the graphical object destruction event to all MQL5 programs on a chart
   SORT_BY_CHART_MODE,                                // Sort by chart type
   SORT_BY_CHART_FOREGROUND,                          // Sort by the "Price chart in the foreground" flag
   SORT_BY_CHART_SHIFT,                               // Sort by the "Mode of shift of the price chart from the right border" flag
   SORT_BY_CHART_AUTOSCROLL,                          // Sort by the "The mode of automatic shift to the right border of the chart" flag
   SORT_BY_CHART_KEYBOARD_CONTROL,                    // Sort by the flag allowing the chart management using a keyboard
   SORT_BY_CHART_QUICK_NAVIGATION,                    // Sort by the flag allowing the chart to intercept Space and Enter key strokes to activate the quick navigation bar
   SORT_BY_CHART_SCALE,                               // Sort by scale
   SORT_BY_CHART_SCALEFIX,                            // Sort by the fixed scale flag
   SORT_BY_CHART_SCALEFIX_11,                         // Sort by the 1:1 scale flag
   SORT_BY_CHART_SCALE_PT_PER_BAR,                    // Sort by the flag of specifying the scale in points per bar
   SORT_BY_CHART_SHOW_TICKER,                         // Sort by the flag displaying a symbol ticker in the upper left corner
   SORT_BY_CHART_SHOW_OHLC,                           // Sort by the flag displaying OHLC values in the upper left corner
   SORT_BY_CHART_SHOW_BID_LINE,                       // Sort by the flag displaying Bid value as a horizontal line on the chart
   SORT_BY_CHART_SHOW_ASK_LINE,                       // Sort by the flag displaying Ask value as a horizontal line on the chart
   SORT_BY_CHART_SHOW_LAST_LINE,                      // Sort by the flag displaying Last value as a horizontal line on the chart
   SORT_BY_CHART_SHOW_PERIOD_SEP,                     // Sort by the flag displaying vertical separators between adjacent periods
   SORT_BY_CHART_SHOW_GRID,                           // Sort by the flag of displaying a grid on the chart
   SORT_BY_CHART_SHOW_VOLUMES,                        // Sort by the mode of displaying volumes on a chart
   SORT_BY_CHART_SHOW_OBJECT_DESCR,                   // Sort by the flag of displaying object text descriptions
   SORT_BY_CHART_VISIBLE_BARS,                        // Sort by the number of bars on a chart that are available for display
   SORT_BY_CHART_WINDOWS_TOTAL,                       // Sort by the total number of chart windows including indicator subwindows
   SORT_BY_CHART_WINDOW_HANDLE,                       // Sort by the chart handle
   SORT_BY_CHART_FIRST_VISIBLE_BAR,                   // Sort by the number of the first visible bar on the chart
   SORT_BY_CHART_WIDTH_IN_BARS,                       // Sort by the width of the chart in bars
   SORT_BY_CHART_WIDTH_IN_PIXELS,                     // Sort by the width of the chart in pixels
   SORT_BY_CHART_COLOR_BACKGROUND,                    // Sort by the color of the chart background
   SORT_BY_CHART_COLOR_FOREGROUND,                    // Sort by color of axes, scale and OHLC line
   SORT_BY_CHART_COLOR_GRID,                          // Sort by grid color
   SORT_BY_CHART_COLOR_VOLUME,                        // Sort by the color of volumes and position opening levels
   SORT_BY_CHART_COLOR_CHART_UP,                      // Sort by the color for the up bar, shadows and body borders of bull candlesticks
   SORT_BY_CHART_COLOR_CHART_DOWN,                    // Sort by the color of down bar, its shadow and border of body of the bullish candlestick
   SORT_BY_CHART_COLOR_CHART_LINE,                    // Sort by the color of the chart line and the Doji candlesticks
   SORT_BY_CHART_COLOR_CANDLE_BULL,                   // Sort by the color of a bullish candlestick body
   SORT_BY_CHART_COLOR_CANDLE_BEAR,                   // Sort by the color of a bearish candlestick body
   SORT_BY_CHART_COLOR_BID,                           // Sort by the color of the Bid price line
   SORT_BY_CHART_COLOR_ASK,                           // Sort by the color of the Ask price line
   SORT_BY_CHART_COLOR_LAST,                          // Sort by the color of the last performed deal's price line (Last)
   SORT_BY_CHART_COLOR_STOP_LEVEL,                    // Sort by the color of stop order levels (Stop Loss and Take Profit)
   SORT_BY_CHART_SHOW_TRADE_LEVELS,                   // Sort by the flag of displaying trading levels on the chart
   SORT_BY_CHART_DRAG_TRADE_LEVELS,                   // Sort by the flag enabling the ability to drag trading levels on a chart using mouse
   SORT_BY_CHART_SHOW_DATE_SCALE,                     // Sort by the flag of displaying the time scale on the chart
   SORT_BY_CHART_SHOW_PRICE_SCALE,                    // Sort by the flag of displaying the price scale on the chart
   SORT_BY_CHART_SHOW_ONE_CLICK,                      // Sort by the flag of displaying the quick trading panel on the chart
   SORT_BY_CHART_IS_MAXIMIZED,                        // Sort by the "Chart window maximized" flag
   SORT_BY_CHART_IS_MINIMIZED,                        // Sort by the "Chart window minimized" flag
   SORT_BY_CHART_IS_DOCKED,                           // Sort by the "Chart window docked" flag
   SORT_BY_CHART_FLOAT_LEFT,                          // Sort by the left coordinate of the undocked chart window relative to the virtual screen
   SORT_BY_CHART_FLOAT_TOP,                           // Sort by the upper coordinate of the undocked chart window relative to the virtual screen
   SORT_BY_CHART_FLOAT_RIGHT,                         // Sort by the right coordinate of the undocked chart window relative to the virtual screen
   SORT_BY_CHART_FLOAT_BOTTOM,                        // Sort by the bottom coordinate of the undocked chart window relative to the virtual screen
   SORT_BY_CHART_YDISTANCE,                           // Sort by the distance in Y axis pixels between the upper frame of the indicator subwindow and the upper frame of the chart main window
   SORT_BY_CHART_HEIGHT_IN_PIXELS,                    // Sort by the height of the chart in pixels
//--- Sort by real properties
   SORT_BY_CHART_SHIFT_SIZE = FIRST_CHART_DBL_PROP,   // Sort by the shift size of the zero bar from the right border in %
   SORT_BY_CHART_FIXED_POSITION,                      // Sort by the chart fixed position from the left border in %
   SORT_BY_CHART_FIXED_MAX,                           // Sort by the fixed chart maximum
   SORT_BY_CHART_FIXED_MIN,                           // Sort by the fixed chart minimum
   SORT_BY_CHART_POINTS_PER_BAR,                      // Sort by the scale value in points per bar
   SORT_BY_CHART_PRICE_MIN,                           // Sort by the chart minimum
   SORT_BY_CHART_PRICE_MAX,                           // Sort by the chart maximum
//--- Sort by string properties
   SORT_BY_CHART_COMMENT = FIRST_CHART_STR_PROP,      // Sort by a comment text on the chart
   SORT_BY_CHART_EXPERT_NAME,                         // Sort by a name of an EA launched on the chart
   SORT_BY_CHART_SCRIPT_NAME,                         // Sort by a name of a script launched on the chart
   SORT_BY_CHART_INDICATOR_NAME,                      // Sort by a name of an indicator launched in the chart window
   SORT_BY_CHART_SYMBOL,                              // Sort by chart symbol
  };
//+------------------------------------------------------------------+
Se olharmos atentamente para os critérios de classificação por propriedades inteiras, veremos que as duas últimas propriedades estão faltando - porque as tornamos não utilizadas na classificação, portanto, não há necessidade de inseri-las aqui - cada critério para classificação por uma determinada propriedade corresponde estritamente ao valor numérico da constante das propriedades a partir da enumeração do objeto.
Como agora vamos tornar o objeto-janela do gráfico completo, será necessário registrar as enumerações das suas propriedades inteiras, reais e string:
//+------------------------------------------------------------------+
//| Data for handling chart windows                                  |
//+------------------------------------------------------------------+
//+------------------------------------------------------------------+
//| Chart window integer properties                                  |
//+------------------------------------------------------------------+
enum ENUM_CHART_WINDOW_PROP_INTEGER
  {
   CHART_WINDOW_PROP_ID = 0,                          // Chart ID
   CHART_WINDOW_PROP_WINDOW_NUM,                      // Chart window index
   CHART_WINDOW_PROP_YDISTANCE,                       // Distance in Y axis pixels between the upper frame of the indicator subwindow and the upper frame of the chart main window
   CHART_WINDOW_PROP_HEIGHT_IN_PIXELS,                // Height of the chart in pixels
   //--- for CWndInd
   CHART_WINDOW_PROP_WINDOW_IND_HANDLE,               // Indicator handle in the chart window
   CHART_WINDOW_PROP_WINDOW_IND_INDEX,                // Indicator index in the chart window
  };
#define CHART_WINDOW_PROP_INTEGER_TOTAL (6)           // Total number of integer properties
#define CHART_WINDOW_PROP_INTEGER_SKIP  (0)           // Number of integer DOM properties not used in sorting
//+------------------------------------------------------------------+
//| Chart window real properties                                     |
//+------------------------------------------------------------------+
enum ENUM_CHART_WINDOW_PROP_DOUBLE
  {
   CHART_WINDOW_PROP_PRICE_MIN = CHART_WINDOW_PROP_INTEGER_TOTAL, // Chart minimum
   CHART_WINDOW_PROP_PRICE_MAX,                       // Chart maximum
  };
#define CHART_WINDOW_PROP_DOUBLE_TOTAL  (2)           // Total number of real properties
#define CHART_WINDOW_PROP_DOUBLE_SKIP   (0)           // Number of real properties not used in sorting
//+------------------------------------------------------------------+
//| Chart window string properties                                   |
//+------------------------------------------------------------------+
enum ENUM_CHART_WINDOW_PROP_STRING
  {
   CHART_WINDOW_PROP_IND_NAME = (CHART_WINDOW_PROP_INTEGER_TOTAL+CHART_WINDOW_PROP_DOUBLE_TOTAL), // Name of the indicator launched in the window
   CHART_WINDOW_PROP_SYMBOL,                          // Chart symbol
  };
#define CHART_WINDOW_PROP_STRING_TOTAL  (2)           // Total number of string properties
//+------------------------------------------------------------------+
E, finalmente, inserimos a enumeração dos critérios possíveis para classificar os objetos-janelas do gráfico:
//+------------------------------------------------------------------+
//| Possible criteria of sorting chart windows                       |
//+------------------------------------------------------------------+
#define FIRST_CHART_WINDOW_DBL_PROP  (CHART_WINDOW_PROP_INTEGER_TOTAL-CHART_WINDOW_PROP_INTEGER_SKIP)
#define FIRST_CHART_WINDOW_STR_PROP  (CHART_WINDOW_PROP_INTEGER_TOTAL-CHART_WINDOW_PROP_INTEGER_SKIP+CHART_WINDOW_PROP_DOUBLE_TOTAL-CHART_WINDOW_PROP_DOUBLE_SKIP)
enum ENUM_SORT_CHART_WINDOW_MODE
  {
//--- Sort by integer properties
   SORT_BY_CHART_WINDOW_ID = 0,                       // Sort by chart ID
   SORT_BY_CHART_WINDOW_NUM,                          // Sort by chart window index
   SORT_BY_CHART_WINDOW_YDISTANCE,                    // Sort by the distance in Y axis pixels between the upper frame of the indicator subwindow and the upper frame of the chart main window
   SORT_BY_CHART_WINDOW_HEIGHT_IN_PIXELS,             // Sort by the height of the chart in pixels
   SORT_BY_CHART_WINDOW_IND_HANDLE,                   // Sort by the indicator handle in the chart window
   SORT_BY_CHART_WINDOW_IND_INDEX,                    // Sort by the indicator index in the chart window
//--- Sort by real properties
   SORT_BY_CHART_WINDOW_PRICE_MIN = FIRST_CHART_WINDOW_DBL_PROP,  // Sort by chart window minimum
   SORT_BY_CHART_WINDOW_PRICE_MAX,                    // Sort by chart window maximum
//--- Sort by string properties
   SORT_BY_CHART_WINDOW_IND_NAME = FIRST_CHART_WINDOW_STR_PROP,   // Sort by name of an indicator launched in the window
   SORT_BY_CHART_WINDOW_SYMBOL,                       // Sort by chart symbol
  };
//+------------------------------------------------------------------+
Voltando ao identificador da lista de objetos-janelas do gráfico, lembramo-nos de que precisamos modificar o objeto CBaseObjExt base estendido, cuja classe está escrita no arquivo de classe do objeto base \MQL5\Include\DoEasy\Objects\BaseObj.mqh.
Tudo o que precisamos fazer é adicionar em seu método EventDescription() o processamento de duas novas listas às quais pertencem os objetos que serão herdeiros desta classe -objeto-gráfico e objeto-janela do gráfico:
//+------------------------------------------------------------------+
//| Return an object event description                               |
//+------------------------------------------------------------------+
string CBaseObjExt::EventDescription(const int property,
                                  const ENUM_BASE_EVENT_REASON reason,
                                  const int source,
                                  const string value,
                                  const string property_descr,
                                  const int digits)
  {
//--- Depending on the collection ID, create th object type description
   string type=
     (
      this.Type()==COLLECTION_SYMBOLS_ID     ? CMessage::Text(MSG_LIB_TEXT_SYMBOL)     :
      this.Type()==COLLECTION_ACCOUNT_ID     ?  CMessage::Text(MSG_LIB_TEXT_ACCOUNT)   :
      this.Type()==COLLECTION_CHARTS_ID      ?  CMessage::Text(MSG_LIB_TEXT_CHART)     :
      this.Type()==COLLECTION_CHART_WND_ID   ?  CMessage::Text(MSG_LIB_TEXT_CHART_WND) :
      ""
     );
//--- Depending on the property type, create the property change value description
   string level=
     (
      property<this.m_long_prop_total ?
      ::DoubleToString(this.GetControlledLongValueLEVEL(property),digits) :
      ::DoubleToString(this.GetControlledDoubleValueLEVEL(property),digits)
     );
//--- Depending on the event reason, create the event description text
   string res=
     (
      reason==BASE_EVENT_REASON_INC       ?  CMessage::Text(MSG_LIB_TEXT_PROP_VALUE)+type+property_descr+CMessage::Text(MSG_LIB_TEXT_INC_BY)+value    :
      reason==BASE_EVENT_REASON_DEC       ?  CMessage::Text(MSG_LIB_TEXT_PROP_VALUE)+type+property_descr+CMessage::Text(MSG_LIB_TEXT_DEC_BY)+value    :
      reason==BASE_EVENT_REASON_MORE_THEN ?  CMessage::Text(MSG_LIB_TEXT_PROP_VALUE)+type+property_descr+CMessage::Text(MSG_LIB_TEXT_MORE_THEN)+level :
      reason==BASE_EVENT_REASON_LESS_THEN ?  CMessage::Text(MSG_LIB_TEXT_PROP_VALUE)+type+property_descr+CMessage::Text(MSG_LIB_TEXT_LESS_THEN)+level :
      reason==BASE_EVENT_REASON_EQUALS    ?  CMessage::Text(MSG_LIB_TEXT_PROP_VALUE)+type+property_descr+CMessage::Text(MSG_LIB_TEXT_EQUAL)+level     :
      CMessage::Text(MSG_LIB_TEXT_BASE_OBJ_UNKNOWN_EVENT)+type
     );
//--- Return the object name+created event description text
   return this.m_name+": "+res;
  }
//+------------------------------------------------------------------+
O artigo 37 fala sobre o trabalho desta classe.
Bem, corrigiremos um erro de design - modificaremos a classe do objeto da janela do gráfico para uma classe completa, como outros objetos da biblioteca principal. Precisaremos adicionar arrays para armazenar as propriedades do objeto, métodos para definir e retornar suas propriedades (vamos refazer os métodos prontos) e métodos para exibir informações sobre as propriedades do objeto.
Vamos abrir o arquivo \MQL5\Include\DoEasy\Objects\Chart\ChartWnd.mqh e fazer as correções necessárias. O mesmo arquivo contém a classe auxiliar do objeto-indicador na janela. Como alteramos algumas das propriedades desses objetos, no método Compare() da classe CWndInd escrevemos as constantes das novas enumerações:
//+------------------------------------------------------------------+
//| Compare CWndInd objects with each other by the specified property|
//+------------------------------------------------------------------+
int CWndInd::Compare(const CObject *node,const int mode=0) const
  {
   const CWndInd *obj_compared=node;
   if(mode==CHART_WINDOW_PROP_WINDOW_IND_HANDLE) return(this.Handle()>obj_compared.Handle() ? 1 : this.Handle()<obj_compared.Handle() ? -1 : 0);
   else if(mode==CHART_WINDOW_PROP_WINDOW_IND_INDEX) return(this.Index()>obj_compared.Index() ? 1 : this.Index()<obj_compared.Index() ? -1 : 0);
   return(this.Name()==obj_compared.Name() ? 0 : this.Name()<obj_compared.Name() ? -1 : 1);
  }
//+------------------------------------------------------------------+
Anteriormente, essas constantes já foram removidas de outra enumeração CHART_PROP_WINDOW_IND_HANDLE e CHART_PROP_WINDOW_IND_INDEX.
À seção privada da classe adicionamos a variável m_digits para armazenar Digits() do símbolo do gráfico, matrizes para armazenar propriedades inteiras, reais e string, bem como métodos para retornar o índice real de propriedades reais e string na matriz adequada:
//+------------------------------------------------------------------+
//| Chart window object class                                        |
//+------------------------------------------------------------------+
class CChartWnd : public CBaseObjExt
  {
private:
   CArrayObj         m_list_ind;                                        // Indicator list
   CArrayObj        *m_list_ind_del;                                    // Pointer to the list of indicators removed from the indicator window
   CArrayObj        *m_list_ind_param;                                  // Pointer to the list of changed indicators
   long              m_long_prop[CHART_WINDOW_PROP_INTEGER_TOTAL];      // Integer properties
   double            m_double_prop[CHART_WINDOW_PROP_DOUBLE_TOTAL];     // Real properties
   string            m_string_prop[CHART_WINDOW_PROP_STRING_TOTAL];     // String properties
   int               m_digits;                                          // Symbol's Digits()
   int               m_wnd_coord_x;                                     // The X coordinate for the time on the chart in the window
   int               m_wnd_coord_y;                                     // The Y coordinate for the price on the chart in the window
//--- Return the index of the array the (1) double and (2) string properties are actually located at
   int               IndexProp(ENUM_CHART_WINDOW_PROP_DOUBLE property)  const { return(int)property-CHART_WINDOW_PROP_INTEGER_TOTAL;                                 }
   int               IndexProp(ENUM_CHART_WINDOW_PROP_STRING property)  const { return(int)property-CHART_WINDOW_PROP_INTEGER_TOTAL-CHART_WINDOW_PROP_DOUBLE_TOTAL;  }
Na seção pública da classe, escrevemos os métodos para definir e retornar as propriedades especificadas do objeto:
public:
//--- Set object's (1) integer, (2) real and (3) string properties
   void              SetProperty(ENUM_CHART_WINDOW_PROP_INTEGER property,long value)   { this.m_long_prop[property]=value;                      }
   void              SetProperty(ENUM_CHART_WINDOW_PROP_DOUBLE property,double value)  { this.m_double_prop[this.IndexProp(property)]=value;    }
   void              SetProperty(ENUM_CHART_WINDOW_PROP_STRING property,string value)  { this.m_string_prop[this.IndexProp(property)]=value;    }
//--- Return object’s (1) integer, (2) real and (3) string property from the properties array
   long              GetProperty(ENUM_CHART_WINDOW_PROP_INTEGER property)        const { return this.m_long_prop[property];                     }
   double            GetProperty(ENUM_CHART_WINDOW_PROP_DOUBLE property)         const { return this.m_double_prop[this.IndexProp(property)];   }
   string            GetProperty(ENUM_CHART_WINDOW_PROP_STRING property)         const { return this.m_string_prop[this.IndexProp(property)];   }
//--- Return itself
   CChartWnd        *GetObject(void)                                                   { return &this;   }
Todos os métodos que retornam sinalizadores de que o objeto suporta a propriedade inteira/real/string especificada retornará true, indicando que cada uma das propriedades é suportado. Os métodos que retornam descrições de propriedades do objeto serão simplesmente declarados, e sua implementação será escrita fora do corpo da classe. Assim, no momento temos este método retorna "propriedade não suportada" - moveremos sua implementação para fora do corpo da classe, uma vez que as outras duas já foram escritas:
//--- Return itself
   CChartWnd        *GetObject(void)                                                   { return &this;   }

//--- Return the flag of the object supporting this property
   virtual bool      SupportProperty(ENUM_CHART_WINDOW_PROP_INTEGER property)          { return true;    }
   virtual bool      SupportProperty(ENUM_CHART_WINDOW_PROP_DOUBLE property)           { return true;    }
   virtual bool      SupportProperty(ENUM_CHART_WINDOW_PROP_STRING property)           { return true;    }

//--- Get description of (1) integer, (2) real and (3) string properties
   string            GetPropertyDescription(ENUM_CHART_WINDOW_PROP_INTEGER property);
   string            GetPropertyDescription(ENUM_CHART_WINDOW_PROP_DOUBLE property);
   string            GetPropertyDescription(ENUM_CHART_WINDOW_PROP_STRING property);
Substituímos todas as ocorrências da string "this.m_window_num" por "this.WindowNum()" (claro, sem aspas) - como removemos a variável m_window_num, e agora o número da janela está localizado nas propriedades do objeto, retornaremos o valor desta propriedade usando o método WindowNum().
Anteriormente o método WindowNum() retornava o valor da variável m_window_num:
int WindowNum(void) const { return this.m_window_num; }
Agora, este método irá retornara propriedade do objeto:
int WindowNum(void) const { return (int)this.GetProperty(CHART_WINDOW_PROP_WINDOW_NUM); }
Vamos adicionar dois métodos para retornar propriedades reais e consertamos os métodos existentes para retornar e definir valores de propriedades do objeto correspondente:
//--- Return (1) the subwindow index, (2) the number of indicators attached to the window, (3) the name of a symbol chart, as well as (4) the highest and (5) lowest prices
   int               WindowNum(void)                              const { return (int)this.GetProperty(CHART_WINDOW_PROP_WINDOW_NUM);     }
   int               IndicatorsTotal(void)                        const { return this.m_list_ind.Total();                                 }
   string            Symbol(void)                                 const { return this.GetProperty(CHART_WINDOW_PROP_SYMBOL);              }
   double            PriceMax(void)                               const { return this.GetProperty(CHART_WINDOW_PROP_PRICE_MAX);           }
   double            PriceMin(void)                               const { return this.GetProperty(CHART_WINDOW_PROP_PRICE_MIN);           }
//--- Set (1) the subwindow index and (2) the chart symbol
   void              SetWindowNum(const int num)                        { this.SetProperty(CHART_WINDOW_PROP_WINDOW_NUM,num);             }
   void              SetSymbol(const string symbol)                     { this.SetProperty(CHART_WINDOW_PROP_SYMBOL,symbol);              }
Para implementar a atualização automática das propriedades do objeto fornecidas pela classe CBaseObjExt, que é o pai da classe editada, precisamos fazer algumas alterações nos métodos Refresh() e, para gerar a funcionalidade de evento, adicionaremos métodos adicionais para definir valores de propriedades rastreadas de objetos e valores de propriedades controlados - para encontrar os momentos em que os valores rastreados especificados interceptam os valores das propriedades dos objetos que controlamos.
Em princípio, podemos evitar fazer estes métodos - a classe CBaseObjExt já fornece a capacidade de definir valores de controle e propriedades rastreáveis, mas como a classe é universal, seus métodos são bastante abstratos e precisamos lembrar os nomes das constantes que precisamos para controlar as propriedades. E isso é inconveniente. Portanto, adicionamos esses métodos a essas classes que funcionam com base na classe do objeto estendido CBaseObjExt - eles indicam explicitamente o que definimos para o objeto com eles.
Assim, no final da listagem do corpo da classe, escreveremos dois blocos de código para definir as propriedades rastreadas para distância em pixels entre as bordas das janelas e para a altura da janela do gráfico em pixels:
//+------------------------------------------------------------------+
//| Get and set the parameters of tracked property changes           |
//+------------------------------------------------------------------+
//--- Distance in Y axis pixels between the upper frame of the indicator subwindow and the upper frame of the chart main window
//--- set the controlled (1) growth, (2) decrease, (3) reference distance level in pixels by the vertical Y axis between the window frames
//--- get (4) the distance change in pixels by the vertical Y axis between the window frames,
//--- get the distance change flag in pixels by the vertical Y axis between the window frames exceeding the (5) growth and (6) decrease values
   void              SetControlWindowYDistanceInc(const long value)        { this.SetControlledValueINC(CHART_WINDOW_PROP_YDISTANCE,(long)::fabs(value));         }
   void              SetControlWindowYDistanceDec(const long value)        { this.SetControlledValueDEC(CHART_WINDOW_PROP_YDISTANCE,(long)::fabs(value));         }
   void              SetControlWindowYDistanceLevel(const long value)      { this.SetControlledValueLEVEL(CHART_WINDOW_PROP_YDISTANCE,(long)::fabs(value));       }
   long              GetValueChangedWindowYDistance(void)            const { return this.GetPropLongChangedValue(CHART_WINDOW_PROP_YDISTANCE);                    }
   bool              IsIncreasedWindowYDistance(void)                const { return (bool)this.GetPropLongFlagINC(CHART_WINDOW_PROP_YDISTANCE);                   }
   bool              IsDecreasedWindowYDistance(void)                const { return (bool)this.GetPropLongFlagDEC(CHART_WINDOW_PROP_YDISTANCE);                   }

//--- Height of the chart in pixels
//--- setting the controlled spread (1) increase, (2) decrease value and (3) reference chart height in pixels
//--- get (4) the chart height change in pixels,
//--- get the flag of the chart height change in pixels exceeding (5) the growth and (6) decrease values
   void              SetControlHeightInPixelsInc(const long value)         { this.SetControlledValueINC(CHART_WINDOW_PROP_HEIGHT_IN_PIXELS,(long)::fabs(value));   }
   void              SetControlHeightInPixelsDec(const long value)         { this.SetControlledValueDEC(CHART_WINDOW_PROP_HEIGHT_IN_PIXELS,(long)::fabs(value));   }
   void              SetControlHeightInPixelsLevel(const long value)       { this.SetControlledValueLEVEL(CHART_WINDOW_PROP_HEIGHT_IN_PIXELS,(long)::fabs(value)); }
   long              GetValueChangedHeightInPixels(void)             const { return this.GetPropLongChangedValue(CHART_WINDOW_PROP_HEIGHT_IN_PIXELS);              }
   bool              IsIncreasedHeightInPixels(void)                 const { return (bool)this.GetPropLongFlagINC(CHART_WINDOW_PROP_HEIGHT_IN_PIXELS);             }
   bool              IsDecreasedHeightInPixels(void)                 const { return (bool)this.GetPropLongFlagDEC(CHART_WINDOW_PROP_HEIGHT_IN_PIXELS);             }

  };
//+------------------------------------------------------------------+
Agora podemos definir os valores rastreados desejados para essas propriedades em nosso programa, e a biblioteca irá rastreá-los automaticamente e enviar eventos que ocorreram com essas propriedades para o gráfico do programa de controle, onde podemos processá-los. Tudo isso foi discutido em detalhes ao criar o objeto base estendido de todos os objetos da biblioteca.
O construtor paramétrico da classe sofreu alterações:
//+------------------------------------------------------------------+
//| Parametric constructor                                           |
//+------------------------------------------------------------------+
CChartWnd::CChartWnd(const long chart_id,const int wnd_num,const string symbol,CArrayObj *list_ind_del,CArrayObj *list_ind_param) : m_wnd_coord_x(0),m_wnd_coord_y(0)
  {
   this.m_digits=(int)::SymbolInfoInteger(symbol,SYMBOL_DIGITS);
   this.m_list_ind_del=list_ind_del;
   this.m_list_ind_param=list_ind_param;
   CBaseObj::SetChartID(chart_id);
   this.m_type=COLLECTION_CHART_WND_ID;

//--- Initialize base object data arrays
   this.SetControlDataArraySizeLong(CHART_WINDOW_PROP_INTEGER_TOTAL);
   this.SetControlDataArraySizeDouble(CHART_WINDOW_PROP_DOUBLE_TOTAL);
   this.ResetChangesParams();
   this.ResetControlsParams();

//--- Set object properties
   this.SetProperty(CHART_WINDOW_PROP_WINDOW_NUM,wnd_num);
   this.SetProperty(CHART_WINDOW_PROP_SYMBOL,symbol);
   this.SetProperty(CHART_WINDOW_PROP_ID,chart_id);
   this.SetProperty(CHART_WINDOW_PROP_YDISTANCE,::ChartGetInteger(chart_id,CHART_WINDOW_YDISTANCE,wnd_num));
   this.SetProperty(CHART_WINDOW_PROP_HEIGHT_IN_PIXELS,::ChartGetInteger(chart_id,CHART_HEIGHT_IN_PIXELS,wnd_num));
   this.SetProperty(CHART_WINDOW_PROP_PRICE_MIN,::ChartGetDouble(chart_id,CHART_PRICE_MIN,wnd_num));
   this.SetProperty(CHART_WINDOW_PROP_PRICE_MAX,::ChartGetDouble(chart_id,CHART_PRICE_MAX,wnd_num));
   this.m_name=this.Header();

//--- Fill in the symbol current data
   for(int i=0;i<CHART_WINDOW_PROP_INTEGER_TOTAL;i++)
      this.m_long_prop_event[i][3]=this.m_long_prop[i];
   for(int i=0;i<CHART_WINDOW_PROP_DOUBLE_TOTAL;i++)
      this.m_double_prop_event[i][3]=this.m_double_prop[i];
//--- Update the base object data and search for changes
   CBaseObjExt::Refresh();

//--- Create the indicator list
   this.IndicatorsListCreate();
  }
//+------------------------------------------------------------------+
Aqui: obtemos Digits() do símbolo do gráfico (para exibir informações), definimos o tipo de objeto igual ao identificador da lista de objetos-janela do gráfico.
In the block of initializing the arrays of the base object data, set the size of the current object arrays (storing the object data during the last check) for the base object arrays and reset all values to zero.
In the block setting the object properties, write all the necessary chart data to the object parameters.
In the block of filling in the current symbol data, write all the data set in the object properties to the base object arrays.
In the block of updating data in the base object and searching for changes, fill in the base object arrays with the current object data and compare them with the previous state. If the property tracking flags are set, check if this is a manageable situation. If the check is positive, create a basic event and place it to the list of base object events.
No método de comparação de dois objetos-janelas do gráfico substituímos todas as constantes de enumeração excluídas por novas:
//+------------------------------------------------------------------+
//| Compare CChartWnd objects with each other by a specified property|
//+------------------------------------------------------------------+
int CChartWnd::Compare(const CObject *node,const int mode=0) const
  {
   const CChartWnd *obj_compared=node;
   if(mode==CHART_WINDOW_PROP_YDISTANCE)
      return(this.YDistance()>obj_compared.YDistance() ? 1 : this.YDistance()<obj_compared.YDistance() ? -1 : 0);
   else if(mode==CHART_WINDOW_PROP_HEIGHT_IN_PIXELS)
      return(this.HeightInPixels()>obj_compared.HeightInPixels() ? 1 : this.HeightInPixels()<obj_compared.HeightInPixels() ? -1 : 0);
   else if(mode==CHART_WINDOW_PROP_WINDOW_NUM)
      return(this.WindowNum()>obj_compared.WindowNum() ? 1 : this.WindowNum()<obj_compared.WindowNum() ? -1 : 0);
   else if(mode==CHART_WINDOW_PROP_SYMBOL)
      return(this.Symbol()==obj_compared.Symbol() ? 0 : this.Symbol()>obj_compared.Symbol() ? 1 : -1);
   return -1;
  }
//+------------------------------------------------------------------+
No método que retorna uma descrição da propriedade inteira de um objeto, também substituímos as constantes de enumeração por novas e adicionamos o retorno da descrição das novas propriedades:
//+------------------------------------------------------------------+
//| Return description of object's integer property                  |
//+------------------------------------------------------------------+
string CChartWnd::GetPropertyDescription(ENUM_CHART_WINDOW_PROP_INTEGER property)
  {
   return
     (
      property==CHART_WINDOW_PROP_ID  ?  CMessage::Text(MSG_CHART_OBJ_ID)+
         (!this.SupportProperty(property) ?  ": "+CMessage::Text(MSG_LIB_PROP_NOT_SUPPORTED) :
          ": "+(string)CBaseObj::GetChartID()
         )  :
      property==CHART_WINDOW_PROP_WINDOW_NUM  ?  CMessage::Text(MSG_CHART_OBJ_WINDOW_N)+
         (!this.SupportProperty(property) ?  ": "+CMessage::Text(MSG_LIB_PROP_NOT_SUPPORTED) :
          ": "+(string)this.WindowNum()
         )  :
      property==CHART_WINDOW_PROP_YDISTANCE  ?  CMessage::Text(MSG_CHART_OBJ_WINDOW_YDISTANCE)+
         (!this.SupportProperty(property) ?  ": "+CMessage::Text(MSG_LIB_PROP_NOT_SUPPORTED) :
          ": "+(string)this.YDistance()
         )  :
      property==CHART_WINDOW_PROP_HEIGHT_IN_PIXELS  ?  CMessage::Text(MSG_CHART_OBJ_HEIGHT_IN_PIXELS)+
         (!this.SupportProperty(property) ?  ": "+CMessage::Text(MSG_LIB_PROP_NOT_SUPPORTED) :
          ": "+(string)this.HeightInPixels()
         )  :
      ""
     );
  }
//+------------------------------------------------------------------+
Vamos escrever a implementação do método que retorna uma descrição de uma propriedade real de um objeto:
//+------------------------------------------------------------------+
//| Return description of object's real property                     |
//+------------------------------------------------------------------+
string CChartWnd::GetPropertyDescription(ENUM_CHART_WINDOW_PROP_DOUBLE property)
  {
   return
     (
      property==CHART_WINDOW_PROP_PRICE_MIN  ?  CMessage::Text(MSG_CHART_OBJ_PRICE_MIN)+
         (!this.SupportProperty(property) ?  ": "+CMessage::Text(MSG_LIB_PROP_NOT_SUPPORTED) :
          ": "+::DoubleToString(this.PriceMin(),this.m_digits)
         )  :
      property==CHART_WINDOW_PROP_PRICE_MAX  ?  CMessage::Text(MSG_CHART_OBJ_PRICE_MAX)+
         (!this.SupportProperty(property) ?  ": "+CMessage::Text(MSG_LIB_PROP_NOT_SUPPORTED) :
          ": "+::DoubleToString(this.PriceMax(),this.m_digits)
         )  :
      ""
     );
  }
//+------------------------------------------------------------------+
No método que retorna uma descrição da propriedade string de um objeto, também substituímos as constantes de enumeração por novas:
//+------------------------------------------------------------------+
//| Return description of object's string property                   |
//+------------------------------------------------------------------+
string CChartWnd::GetPropertyDescription(ENUM_CHART_WINDOW_PROP_STRING property)
  {
   return
     (
      property==CHART_WINDOW_PROP_SYMBOL  ?  CMessage::Text(MSG_LIB_PROP_SYMBOL)+
         (!this.SupportProperty(property) ?  ": "+CMessage::Text(MSG_LIB_PROP_NOT_SUPPORTED) :
          ": "+this.Symbol()
         )  :
      ""
     );
  }
//+------------------------------------------------------------------+
No método que registra propriedades do objeto, também foram feitas correções para constantes de enumeração e foram removidas as marcas de comentário do bloco de código responsável por exibir as propriedades reais do objeto (anteriormente, este bloco de código era comentado dentro do loop, mas não removido do método):
//+------------------------------------------------------------------+
//| Display object properties in the journal                         |
//+------------------------------------------------------------------+
void CChartWnd::Print(const bool full_prop=false)
  {
   ::Print("============= ",CMessage::Text(MSG_LIB_PARAMS_LIST_BEG)," (",this.Header(),") =============");
   int beg=0, end=CHART_WINDOW_PROP_INTEGER_TOTAL;
   for(int i=beg; i<end; i++)
     {
      ENUM_CHART_WINDOW_PROP_INTEGER prop=(ENUM_CHART_WINDOW_PROP_INTEGER)i;
      if(prop==CHART_WINDOW_PROP_WINDOW_IND_HANDLE || prop==CHART_WINDOW_PROP_WINDOW_IND_INDEX) continue;
      if(!full_prop && !this.SupportProperty(prop)) continue;
      ::Print(this.GetPropertyDescription(prop));
     }
   ::Print("------");
   beg=end; end+=CHART_WINDOW_PROP_DOUBLE_TOTAL;
   for(int i=beg; i<end; i++)
     {
      ENUM_CHART_WINDOW_PROP_DOUBLE prop=(ENUM_CHART_WINDOW_PROP_DOUBLE)i;
      if(!full_prop && !this.SupportProperty(prop)) continue;
      ::Print(this.GetPropertyDescription(prop));
     }
   beg=end; end+=CHART_WINDOW_PROP_STRING_TOTAL;
   for(int i=beg; i<end; i++)
     {
      ENUM_CHART_WINDOW_PROP_STRING prop=(ENUM_CHART_WINDOW_PROP_STRING)i;
      if(prop==CHART_WINDOW_PROP_IND_NAME)
        {
         this.PrintIndicators();
         continue;
        }
      if(!full_prop && !this.SupportProperty(prop)) continue;
      ::Print(this.GetPropertyDescription(prop));
     }
   ::Print("============= ",CMessage::Text(MSG_LIB_PARAMS_LIST_END)," (",this.Header(),") =============\n");
  }
//+------------------------------------------------------------------+
No método que registra a descrição dos parâmetros da janela, adicionamos a saída de novos parâmetros e mudamos as constantes para novas:
//+------------------------------------------------------------------+
//| Display the description of the window parameters in the journal  |
//+------------------------------------------------------------------+
void CChartWnd::PrintParameters(const bool dash=false)
  {
   string header=
     (
      this.WindowNum()==0 ? CMessage::Text(MSG_CHART_OBJ_CHART_WINDOW) :
      CMessage::Text(MSG_CHART_OBJ_CHART_SUBWINDOW)+" "+(string)this.WindowNum()
     );
   ::Print((dash ? " " : ""),header,":");
   string pref=(dash ? " - " : "");
   if(this.WindowNum()>0)
      ::Print(pref,GetPropertyDescription(CHART_WINDOW_PROP_YDISTANCE));
   ::Print(pref,GetPropertyDescription(CHART_WINDOW_PROP_HEIGHT_IN_PIXELS));
   ::Print(pref,GetPropertyDescription(CHART_WINDOW_PROP_PRICE_MAX));
   ::Print(pref,GetPropertyDescription(CHART_WINDOW_PROP_PRICE_MIN));
  }
//+------------------------------------------------------------------+
Modificamos o método de atualização dos dados do gráfico. Precisamos adicionar a inicialização de dados de evento (variáveis) e um bloco de código que processa a alteração dos parâmetros de um objeto no caso de não haver outras alterações (outras alterações são a adição à janela ou remoção do indicador da janela).
//+------------------------------------------------------------------+
//| Update data on attached indicators                               |
//+------------------------------------------------------------------+
void CChartWnd::Refresh(void)
  {
   //--- Initialize event data
   this.m_is_event=false;
   this.m_hash_sum=0;
   //--- Calculate the change of the indicator number in the "now and during the previous check" window
   int change=::ChartIndicatorsTotal(this.m_chart_id,this.WindowNum())-this.m_list_ind.Total();
   //--- If there is no change in the number of indicators in the window,
   if(change==0)
     {
      //--- check the change of parameters of all indicators and exit
      this.IndicatorsChangeCheck();
      //--- Update integer properties
      this.SetProperty(CHART_WINDOW_PROP_YDISTANCE,::ChartGetInteger(this.m_chart_id,CHART_WINDOW_YDISTANCE,this.WindowNum()));
      this.SetProperty(CHART_WINDOW_PROP_HEIGHT_IN_PIXELS,::ChartGetInteger(this.m_chart_id,CHART_HEIGHT_IN_PIXELS,this.WindowNum()));
      //--- Update real properties
      this.SetProperty(CHART_WINDOW_PROP_PRICE_MIN,::ChartGetDouble(this.m_chart_id,CHART_PRICE_MIN,this.WindowNum()));
      this.SetProperty(CHART_WINDOW_PROP_PRICE_MAX,::ChartGetDouble(this.m_chart_id,CHART_PRICE_MAX,this.WindowNum()));
      //--- Update string properties
      string symbol=::ChartSymbol(this.m_chart_id);
      if(symbol!=NULL)
         this.SetProperty(CHART_WINDOW_PROP_SYMBOL,symbol);

      //--- Fill in the current symbol data
      for(int i=0;i<CHART_WINDOW_PROP_INTEGER_TOTAL;i++)
         this.m_long_prop_event[i][3]=this.m_long_prop[i];
      for(int i=0;i<CHART_WINDOW_PROP_DOUBLE_TOTAL;i++)
         this.m_double_prop_event[i][3]=this.m_double_prop[i];

      //--- Update the base object data, search for changes and exit
      CBaseObjExt::Refresh();
      this.CheckEvents();
      return;
     }
   //--- If indicators are added
   if(change>0)
     {
      //--- Call the method of adding new indicators to the list
      this.IndicatorsAdd();
      //--- In the loop by the number of indicators added to the window,
      for(int i=0;i<change;i++)
        {
         //--- get the new indicator in the list by the index calculated from the end of the list
         int index=this.m_list_ind.Total()-(1+i);
         //--- and if failed to obtain the object, move on to the next one
         CWndInd *ind=this.m_list_ind.At(index);
         if(ind==NULL)
            continue;
         //--- call the method of sending an event to the control program chart
         this.SendEvent(CHART_OBJ_EVENT_CHART_WND_IND_ADD);
        }
     }
   //--- If there are removed indicators
   if(change<0)
     {
      //--- Call the method of removing unnecessary indicators from the list
      this.IndicatorsDelete();
      //--- In the loop by the number of indicators removed from the window,
      for(int i=0;i<-change;i++)
        {
         //--- get a new removed indicator in the list of removed indicators by index calculated from the end of the list
         int index=this.m_list_ind_del.Total()-(1+i);
         //--- and if failed to obtain the object, move on to the next one
         CWndInd *ind=this.m_list_ind_del.At(index);
         if(ind==NULL)
            continue;
         //--- call the method of sending an event to the control program chart
         this.SendEvent(CHART_OBJ_EVENT_CHART_WND_IND_DEL);
        }
     }
  }
//+------------------------------------------------------------------+
Tudo é descrito aqui nos comentários do bloco do código. Já consideramos isso com mais detalhes na descrição do refinamento do construtor paramétrico - quase a mesma coisa.
Assim concluímos a conversão da classe do objeto da janela do gráfico num objeto de biblioteca completo.
Agora vamos modificar a classe do objeto-gráfico no arquivo \MQL5\Include\DoEasy\Objects\Chart\ChartObj.mqh.
À seção privada da classe adicionamos novas variáveis (para armazenar o símbolo anterior e o período gráfico) e uma variável para armazenar o último evento:
//+------------------------------------------------------------------+
//| Chart object class                                               |
//+------------------------------------------------------------------+
class CChartObj : public CBaseObjExt
  {
private:
   CArrayObj         m_list_wnd;                                  // List of chart window objects
   CArrayObj        *m_list_wnd_del;                              // Pointer to the list of chart window objects
   CArrayObj        *m_list_ind_del;                              // Pointer to the list of indicators removed from the indicator window
   CArrayObj        *m_list_ind_param;                            // Pointer to the list of changed indicators
   long              m_long_prop[CHART_PROP_INTEGER_TOTAL];       // Integer properties
   double            m_double_prop[CHART_PROP_DOUBLE_TOTAL];      // Real properties
   string            m_string_prop[CHART_PROP_STRING_TOTAL];      // String properties
   string            m_symbol_prev;                               // Previous chart symbol
   ENUM_TIMEFRAMES   m_timeframe_prev;                            // Previous timeframe
   int               m_digits;                                    // Symbol's Digits()
   int               m_last_event;                                // The last event
   datetime          m_wnd_time_x;                                // Time for X coordinate on the windowed chart
   double            m_wnd_price_y;                               // Price for Y coordinate on the windowed chart
Precisaremos preencher os dados do gráfico no seu método de atualização. Eles também serão preenchidos no construtor de classe. O objeto de gráfico tem muitas propriedades, por isso, para não escrever o mesmo tipo de código em métodos diferentes, vamos movê-lo para métodos separados e onde for necessário preencher as propriedades do objeto com dados de gráfico, vamos chamar esses métodos . Vamos declará-los na seção privada da classe:
//--- The methods of setting property values
   bool              SetMode(const string source,const ENUM_CHART_MODE mode,const bool redraw=false);
   bool              SetScale(const string source,const int scale,const bool redraw=false);
   bool              SetModeVolume(const string source,const ENUM_CHART_VOLUME_MODE mode,const bool redraw=false);
   void              SetVisibleBars(void);
   void              SetWindowsTotal(void);
   void              SetFirstVisibleBars(void);
   void              SetWidthInBars(void);
   void              SetWidthInPixels(void);
   void              SetMaximizedFlag(void);
   void              SetMinimizedFlag(void);
   void              SetExpertName(void);
   void              SetScriptName(void);

//--- Fill in (1) integer, (2) real and (3) string object properties
   bool              SetIntegerParameters(void);
   void              SetDoubleParameters(void);
   bool              SetStringParameters(void);

//--- (1) Create, (2) check and re-create the chart window list
   void              CreateWindowsList(void);
   void              RecreateWindowsList(const int change);
//--- Add an extension to the screenshot file if it is missing
   string            FileNameWithExtention(const string filename);

public:
All methods returning the flags indicating the object supports a certain property should return true:
//--- Return the indicator by index from the specified chart window
   CWndInd          *GetIndicator(const int win_num,const int ind_index);

//--- Return the flag of the object supporting this property
   virtual bool      SupportProperty(ENUM_CHART_PROP_INTEGER property)           { return true; }
   virtual bool      SupportProperty(ENUM_CHART_PROP_DOUBLE property)            { return true; }
   virtual bool      SupportProperty(ENUM_CHART_PROP_STRING property)            { return true; }

//--- Get description of (1) integer, (2) real and (3) string properties
   string            GetPropertyDescription(ENUM_CHART_PROP_INTEGER property);
   string            GetPropertyDescription(ENUM_CHART_PROP_DOUBLE property);
   string            GetPropertyDescription(ENUM_CHART_PROP_STRING property);
Anteriormente, o método que retornava um sinalizador sobre o suporte de propriedade inteira retornava false se esta propriedade era a distância em pixels entre as bordas das janelas do gráfico.
Vamos escrever três métodos públicos necessários para trabalhar com a funcionalidade de evento da classe pai:
//--- Return (1) the flag event, (2) the last event code and (3) the last event
   bool              IsEvent(void)                                   const { return this.m_is_event;                                      }
   int               GetLastEventsCode(void)                         const { return this.m_event_code;                                    }
   int               GetLastEvent(void)                              const { return this.m_last_event;                                    }

//--- Constructors
                     CChartObj(){;}
                     CChartObj(const long chart_id,CArrayObj *list_wnd_del,CArrayObj *list_ind_del,CArrayObj *list_ind_param);
//+------------------------------------------------------------------+
No bloco de métodos de acesso simplificado às propriedades do objeto escrevemos um método que retorne um sinalizador de que a janela do gráfico está em primeiro plano:
//--- (1) Return, (2) enable, (3) disable docking the chart window
   bool              IsDocked(void)                                  const { return (bool)this.GetProperty(CHART_PROP_IS_DOCKED);         }
   bool              SetDockedON(const bool redraw=false)                  { return this.SetDockedFlag(DFUN,true,redraw); }
   bool              SetDockedOFF(const bool redraw=false)                 { return this.SetDockedFlag(DFUN,false,redraw); }

//--- (1) Return, (2) enable and (3) disable the display of the chart above all others
   bool              IsBringTop(void)                                      { return (bool)this.GetProperty(CHART_PROP_BRING_TO_TOP);      }
   bool              SetBringToTopON(const bool redraw=false)              { return this.SetBringToTopFlag(DFUN,true,redraw);             }
   bool              SetBringToTopOFF(const bool redraw=false)             { return this.SetBringToTopFlag(DFUN,false,redraw);            }

//--- (1) Return, set the chart type (2) bars, (3) candles, (4) line
   ENUM_CHART_MODE   Mode(void)                                      const { return (ENUM_CHART_MODE)this.GetProperty(CHART_PROP_MODE);   }
   bool              SetModeBars(const bool redraw=false)                  { return this.SetMode(DFUN,CHART_BARS,redraw);                 }
   bool              SetModeCandles(const bool redraw=false)               { return this.SetMode(DFUN,CHART_CANDLES,redraw);              }
   bool              SetModeLine(const bool redraw=false)                  { return this.SetMode(DFUN,CHART_LINE,redraw);                 }
O método retorna o sinalizador CHART_BRING_TO_TOP.
É importante ressaltar que a ajuda lista esta propriedade como "somente gravação" (w/o), e o exemplo mostra que só é possível definir o gráfico necessário como ativo, ou seja, não permite ler o seu estado, mas apenas configurá-lo. No entanto, na verdade, essa propriedade também é lida e é através dela que podemos descobrir qual gráfico está ativo no momento. Isso é um erro na ajuda ou é um recurso não documentado (o que é altamente indesejável), mas na verdade ainda funciona. Se esta propriedade do gráfico parar repentinamente de ser lida (ela será exibida de acordo com a ajuda), haverá problemas para obter rapidamente o gráfico ativo no momento e teremos que inventar algo por si mesmos.
No final da lista da classe vamos escrever métodos para definir os valores monitorados das propriedades monitoradas do objeto para a classe pai.
Vamos escrever todas as propriedades - inteiras e reais -, mas não para cada uma delas, vamos escrever métodos para controlar seu estado. Vamos apenas considerar a viabilidade de controlar algumas propriedades do objeto. Em qualquer caso, todas as propriedades são escritas nos comentários e sempre podemos adicionar novas:
//+------------------------------------------------------------------+ //| Get and set the parameters of tracked property changes | //+------------------------------------------------------------------+ //CHART_PROP_ID = 0, // Chart ID //--- Chart timeframe //--- setting the chart timeframe (1) increase, (2) decrease controlled value and (3) reference level //--- getting (4) the chart timeframe change value, //--- getting the chart timeframe change flag increasing the (5) growth and (6) decrease values void SetControlTimeframeInc(const long value) { this.SetControlledValueINC(CHART_PROP_TIMEFRAME,(long)::fabs(value)); } void SetControlTimeframeDec(const long value) { this.SetControlledValueDEC(CHART_PROP_TIMEFRAME,(long)::fabs(value)); } void SetControlTimeframeLevel(const long value) { this.SetControlledValueLEVEL(CHART_PROP_TIMEFRAME,(long)::fabs(value)); } long GetValueChangedTimeframe(void) const { return this.GetPropLongChangedValue(CHART_PROP_TIMEFRAME); } bool IsIncreasedTimeframe(void) const { return (bool)this.GetPropLongFlagINC(CHART_PROP_TIMEFRAME); } bool IsDecreasedTimeframe(void) const { return (bool)this.GetPropLongFlagDEC(CHART_PROP_TIMEFRAME); } //CHART_PROP_SHOW // Price chart drawing //CHART_PROP_IS_OBJECT, // Chart object (OBJ_CHART) identification attribute //CHART_PROP_BRING_TO_TOP, // Show the chart above all others //CHART_PROP_CONTEXT_MENU, // Enable/disable access to the context menu using the right click //CHART_PROP_CROSSHAIR_TOOL, // Enable/disable access to the Crosshair tool using the middle click //CHART_PROP_MOUSE_SCROLL, // Scroll the chart horizontally using the left mouse button //CHART_PROP_EVENT_MOUSE_WHEEL, // Send messages about mouse wheel events (CHARTEVENT_MOUSE_WHEEL) to all MQL5 programs on a chart //CHART_PROP_EVENT_MOUSE_MOVE, // Send messages about mouse button click and movement events (CHARTEVENT_MOUSE_MOVE) to all MQL5 programs on a chart //CHART_PROP_EVENT_OBJECT_CREATE, // Send messages about the graphical object creation event (CHARTEVENT_OBJECT_CREATE) to all MQL5 programs on a chart //CHART_PROP_EVENT_OBJECT_DELETE, // Send messages about the graphical object destruction event (CHARTEVENT_OBJECT_DELETE) to all MQL5 programs on a chart //--- Type of the chart (candlesticks, bars or line (ENUM_CHART_MODE)) //--- setting the chart timeframe (1) increase, (2) decrease controlled value and (3) reference level //--- getting (4) the chart timeframe change value, //--- getting the chart timeframe change flag increasing the (5) growth and (6) decrease values void SetControlChartModeInc(const long value) { this.SetControlledValueINC(CHART_PROP_MODE,(long)::fabs(value)); } void SetControlChartModeDec(const long value) { this.SetControlledValueDEC(CHART_PROP_MODE,(long)::fabs(value)); } void SetControlChartModeLevel(const long value) { this.SetControlledValueLEVEL(CHART_PROP_MODE,(long)::fabs(value)); } long GetValueChangedChartMode(void) const { return this.GetPropLongChangedValue(CHART_PROP_MODE); } bool IsIncreasedChartMode(void) const { return (bool)this.GetPropLongFlagINC(CHART_PROP_MODE); } bool IsDecreasedChartMode(void) const { return (bool)this.GetPropLongFlagDEC(CHART_PROP_MODE); } //CHART_PROP_FOREGROUND, // Price chart in the foreground //CHART_PROP_SHIFT, // Mode of shift of the price chart from the right border //CHART_PROP_AUTOSCROLL, // The mode of automatic shift to the right border of the chart //CHART_PROP_KEYBOARD_CONTROL, // Allow managing the chart using a keyboard //CHART_PROP_QUICK_NAVIGATION, // Allow the chart to intercept Space and Enter key strokes to activate the quick navigation bar //CHART_PROP_SCALE, // Scale //CHART_PROP_SCALEFIX, // Fixed scale mode //CHART_PROP_SCALEFIX_11, // 1:1 scale mode //CHART_PROP_SCALE_PT_PER_BAR, // The mode of specifying the scale in points per bar //CHART_PROP_SHOW_TICKER, // Display a symbol ticker in the upper left corner //CHART_PROP_SHOW_OHLC, // Display OHLC values in the upper left corner //CHART_PROP_SHOW_BID_LINE, // Display Bid value as a horizontal line on the chart //CHART_PROP_SHOW_ASK_LINE, // Display Ask value as a horizontal line on a chart //CHART_PROP_SHOW_LAST_LINE, // Display Last value as a horizontal line on a chart //CHART_PROP_SHOW_PERIOD_SEP, // Display vertical separators between adjacent periods //CHART_PROP_SHOW_GRID, // Display a grid on the chart //CHART_PROP_SHOW_VOLUMES, // Display volumes on a chart //CHART_PROP_SHOW_OBJECT_DESCR, // Display text descriptions of objects //CHART_PROP_VISIBLE_BARS, // Number of bars on a chart that are available for display //CHART_PROP_WINDOWS_TOTAL, // The total number of chart windows including indicator subwindows //CHART_PROP_WINDOW_HANDLE, // Chart window handle //CHART_PROP_WINDOW_YDISTANCE ////--- Distance in Y axis pixels between the upper frame of the indicator subwindow and the upper frame of the chart main window ////--- set the controlled (1) growth, (2) decrease, (3) reference distance level in pixels by the vertical Y axis between the window frames ////--- get (4) the distance change in pixels by the vertical Y axis between the window frames, ////--- get the distance change flag in pixels by the vertical Y axis between the window frames exceeding the (5) growth and (6) decrease values // void SetControlWindowYDistanceInc(const long value) { this.SetControlledValueINC(CHART_PROP_WINDOW_YDISTANCE,(long)::fabs(value)); } // void SetControlWindowYDistanceDec(const long value) { this.SetControlledValueDEC(CHART_PROP_WINDOW_YDISTANCE,(long)::fabs(value)); } // void SetControlWindowYDistanceLevel(const long value) { this.SetControlledValueLEVEL(CHART_PROP_WINDOW_YDISTANCE,(long)::fabs(value)); } // long GetValueChangedWindowYDistance(void) const { return this.GetPropLongChangedValue(CHART_PROP_WINDOW_YDISTANCE); } // bool IsIncreasedWindowYDistance(void) const { return (bool)this.GetPropLongFlagINC(CHART_PROP_WINDOW_YDISTANCE); } // bool IsDecreasedWindowYDistance(void) const { return (bool)this.GetPropLongFlagDEC(CHART_PROP_WINDOW_YDISTANCE); } //CHART_PROP_FIRST_VISIBLE_BAR, // Number of the first visible bar on the chart //--- Width of the chart in bars //--- setting the controlled spread (1) increase, (2) decrease value and (3) reference chart width in bars //--- getting (4) the chart width change value in bars, //--- get the flag of the chart width change in bars exceeding (5) the growth and (6) decrease values void SetControlWidthInBarsInc(const long value) { this.SetControlledValueINC(CHART_PROP_WIDTH_IN_BARS,(long)::fabs(value)); } void SetControlWidthInBarsDec(const long value) { this.SetControlledValueDEC(CHART_PROP_WIDTH_IN_BARS,(long)::fabs(value)); } void SetControlWidthInBarsLevel(const long value) { this.SetControlledValueLEVEL(CHART_PROP_WIDTH_IN_BARS,(long)::fabs(value)); } long GetValueChangedWidthInBars(void) const { return this.GetPropLongChangedValue(CHART_PROP_WIDTH_IN_BARS); } bool IsIncreasedWidthInBars(void) const { return (bool)this.GetPropLongFlagINC(CHART_PROP_WIDTH_IN_BARS); } bool IsDecreasedWidthInBars(void) const { return (bool)this.GetPropLongFlagDEC(CHART_PROP_WIDTH_IN_BARS); } //--- Chart width in pixels //--- setting the controlled spread (1) increase, (2) decrease value and (3) reference chart width in pixels //--- getting (4) the chart width change value in pixels, //--- get the flag of the chart width change in pixels exceeding (5) the growth and (6) decrease values void SetControlWidthInPixelsInc(const long value) { this.SetControlledValueINC(CHART_PROP_WIDTH_IN_PIXELS,(long)::fabs(value)); } void SetControlWidthInPixelsDec(const long value) { this.SetControlledValueDEC(CHART_PROP_WIDTH_IN_PIXELS,(long)::fabs(value)); } void SetControlWidthInPixelsLevel(const long value) { this.SetControlledValueLEVEL(CHART_PROP_WIDTH_IN_PIXELS,(long)::fabs(value)); } long GetValueChangedWidthInPixels(void) const { return this.GetPropLongChangedValue(CHART_PROP_WIDTH_IN_PIXELS); } bool IsIncreasedWidthInPixels(void) const { return (bool)this.GetPropLongFlagINC(CHART_PROP_WIDTH_IN_PIXELS); } bool IsDecreasedWidthInPixels(void) const { return (bool)this.GetPropLongFlagDEC(CHART_PROP_WIDTH_IN_PIXELS); } //--- Chart height in pixels //--- setting the controlled spread (1) increase, (2) decrease value and (3) reference chart height in pixels //--- get (4) the chart height change in pixels, //--- get the flag of the chart height change in pixels exceeding (5) the growth and (6) decrease values void SetControlHeightInPixelsInc(const long value) { this.SetControlledValueINC(CHART_PROP_HEIGHT_IN_PIXELS,(long)::fabs(value)); } void SetControlHeightInPixelsDec(const long value) { this.SetControlledValueDEC(CHART_PROP_HEIGHT_IN_PIXELS,(long)::fabs(value)); } void SetControlHeightInPixelsLevel(const long value) { this.SetControlledValueLEVEL(CHART_PROP_HEIGHT_IN_PIXELS,(long)::fabs(value)); } long GetValueChangedHeightInPixels(void) const { return this.GetPropLongChangedValue(CHART_PROP_HEIGHT_IN_PIXELS); } bool IsIncreasedHeightInPixels(void) const { return (bool)this.GetPropLongFlagINC(CHART_PROP_HEIGHT_IN_PIXELS); } bool IsDecreasedHeightInPixels(void) const { return (bool)this.GetPropLongFlagDEC(CHART_PROP_HEIGHT_IN_PIXELS); } //CHART_PROP_COLOR_BACKGROUND, // Chart background color //CHART_PROP_COLOR_FOREGROUND, // Color of axes, scale and OHLC line //CHART_PROP_COLOR_GRID, // Grid color //CHART_PROP_COLOR_VOLUME, // Color of volumes and position opening levels //CHART_PROP_COLOR_CHART_UP, // Color for the up bar, shadows and body borders of bull candlesticks //CHART_PROP_COLOR_CHART_DOWN, // Color of down bar, its shadow and border of body of the bullish candlestick //CHART_PROP_COLOR_CHART_LINE, // Color of the chart line and the Doji candlesticks //CHART_PROP_COLOR_CANDLE_BULL, // Bullish candlestick body color //CHART_PROP_COLOR_CANDLE_BEAR, // Bearish candlestick body color //CHART_PROP_COLOR_BID, // Color of the Bid price line //CHART_PROP_COLOR_ASK, // Color of the Ask price line //CHART_PROP_COLOR_LAST, // Color of the last performed deal's price line (Last) //CHART_PROP_COLOR_STOP_LEVEL, // Color of stop order levels (Stop Loss and Take Profit) //CHART_PROP_SHOW_TRADE_LEVELS, // Display trade levels on the chart (levels of open positions, Stop Loss, Take Profit and pending orders) //CHART_PROP_DRAG_TRADE_LEVELS, // Enable the ability to drag trading levels on a chart using mouse //CHART_PROP_SHOW_DATE_SCALE, // Display the time scale on a chart //CHART_PROP_SHOW_PRICE_SCALE, // Display a price scale on a chart //CHART_PROP_SHOW_ONE_CLICK, // Display the quick trading panel on the chart //CHART_PROP_IS_MAXIMIZED, // Chart window maximized //CHART_PROP_IS_MINIMIZED, // Chart window minimized //CHART_PROP_IS_DOCKED, // Chart window docked //--- The left coordinate of the undocked chart window relative to the virtual screen //--- setting the controlled spread (1) increase, (2) decrease value and (3) reference level of the left coordinate of the undocked chart relative to the virtual screen //--- getting (4) the change value of the left coordinate of the undocked chart relative to the virtual screen, //--- getting the flag of changing the left coordinate of the undocked chart relative to the virtual screen exceeding the (5) increase and (6) decrease values void SetControlFloatLeftInc(const long value) { this.SetControlledValueINC(CHART_PROP_FLOAT_LEFT,(long)::fabs(value)); } void SetControlFloatLeftDec(const long value) { this.SetControlledValueDEC(CHART_PROP_FLOAT_LEFT,(long)::fabs(value)); } void SetControlFloatLeftLevel(const long value) { this.SetControlledValueLEVEL(CHART_PROP_FLOAT_LEFT,(long)::fabs(value)); } long GetValueChangedFloatLeft(void) const { return this.GetPropLongChangedValue(CHART_PROP_FLOAT_LEFT); } bool IsIncreasedFloatLeft(void) const { return (bool)this.GetPropLongFlagINC(CHART_PROP_FLOAT_LEFT); } bool IsDecreasedFloatLeft(void) const { return (bool)this.GetPropLongFlagDEC(CHART_PROP_FLOAT_LEFT); } //--- Upper coordinate of the undocked chart window relative to the virtual screen //--- setting the controlled spread (1) increase, (2) decrease value and (3) reference level of the upper coordinate of the undocked chart relative to the virtual screen //--- getting (4) the change value of the upper coordinate of the undocked chart relative to the virtual screen, //--- getting the flag of changing the upper coordinate of the undocked chart relative to the virtual screen exceeding the (5) increase and (6) decrease values void SetControlFloatTopInc(const long value) { this.SetControlledValueINC(CHART_PROP_FLOAT_TOP,(long)::fabs(value)); } void SetControlFloatTopDec(const long value) { this.SetControlledValueDEC(CHART_PROP_FLOAT_TOP,(long)::fabs(value)); } void SetControlFloatTopLevel(const long value) { this.SetControlledValueLEVEL(CHART_PROP_FLOAT_TOP,(long)::fabs(value)); } long GetValueChangedFloatTop(void) const { return this.GetPropLongChangedValue(CHART_PROP_FLOAT_TOP); } bool IsIncreasedFloatTop(void) const { return (bool)this.GetPropLongFlagINC(CHART_PROP_FLOAT_TOP); } bool IsDecreasedFloatTop(void) const { return (bool)this.GetPropLongFlagDEC(CHART_PROP_FLOAT_TOP); } //--- The right coordinate of the undocked chart window relative to the virtual screen //--- setting the controlled spread (1) increase, (2) decrease value and (3) reference level of the right coordinate of the undocked chart relative to the virtual screen //--- getting (4) the change value of the right coordinate of the undocked chart relative to the virtual screen, //--- getting the flag of changing the right coordinate of the undocked chart relative to the virtual screen exceeding the (5) increase and (6) decrease values void SetControlFloatRightInc(const long value) { this.SetControlledValueINC(CHART_PROP_FLOAT_RIGHT,(long)::fabs(value)); } void SetControlFloatRightDec(const long value) { this.SetControlledValueDEC(CHART_PROP_FLOAT_RIGHT,(long)::fabs(value)); } void SetControlFloatRightLevel(const long value) { this.SetControlledValueLEVEL(CHART_PROP_FLOAT_RIGHT,(long)::fabs(value)); } long GetValueChangedFloatRight(void) const { return this.GetPropLongChangedValue(CHART_PROP_FLOAT_RIGHT); } bool IsIncreasedFloatRight(void) const { return (bool)this.GetPropLongFlagINC(CHART_PROP_FLOAT_RIGHT); } bool IsDecreasedFloatRight(void) const { return (bool)this.GetPropLongFlagDEC(CHART_PROP_FLOAT_RIGHT); } //--- The bottom coordinate of the undocked chart window relative to the virtual screen //--- setting the controlled spread (1) increase, (2) decrease value and (3) reference level of the lower coordinate of the undocked chart relative to the virtual screen //--- getting (4) the change value of the lower coordinate of the undocked chart relative to the virtual screen, //--- getting the flag of changing the lower coordinate of the undocked chart relative to the virtual screen exceeding the (5) increase and (6) decrease values void SetControlFloatBottomInc(const long value) { this.SetControlledValueINC(CHART_PROP_FLOAT_BOTTOM,(long)::fabs(value)); } void SetControlFloatBottomDec(const long value) { this.SetControlledValueDEC(CHART_PROP_FLOAT_BOTTOM,(long)::fabs(value)); } void SetControlFloatBottomLevel(const long value) { this.SetControlledValueLEVEL(CHART_PROP_FLOAT_BOTTOM,(long)::fabs(value)); } long GetValueChangedFloatBottom(void) const { return this.GetPropLongChangedValue(CHART_PROP_FLOAT_BOTTOM); } bool IsIncreasedFloatBottom(void) const { return (bool)this.GetPropLongFlagINC(CHART_PROP_FLOAT_BOTTOM); } bool IsDecreasedFloatBottom(void) const { return (bool)this.GetPropLongFlagDEC(CHART_PROP_FLOAT_BOTTOM); } //--- Shift size of the zero bar from the right border in % //--- setting (1) increase, (2) decrease and (3) reference level of the shift size of the zero bar from the right border in % //--- getting (4) the change value of the shift of the zero bar from the right border in %, //--- getting the flag of the change value of the shift of the zero bar from the right border in % exceeding (5) the growth and (6) decrease values void SetControlShiftSizeInc(const long value) { this.SetControlledValueINC(CHART_PROP_SHIFT_SIZE,(long)::fabs(value)); } void SetControlShiftSizeDec(const long value) { this.SetControlledValueDEC(CHART_PROP_SHIFT_SIZE,(long)::fabs(value)); } void SetControlShiftSizeLevel(const long value) { this.SetControlledValueLEVEL(CHART_PROP_SHIFT_SIZE,(long)::fabs(value)); } double GetValueChangedShiftSize(void) const { return this.GetPropDoubleChangedValue(CHART_PROP_SHIFT_SIZE); } bool IsIncreasedShiftSize(void) const { return (bool)this.GetPropLongFlagINC(CHART_PROP_SHIFT_SIZE); } bool IsDecreasedShiftSize(void) const { return (bool)this.GetPropLongFlagDEC(CHART_PROP_SHIFT_SIZE); } //--- Chart fixed position from the left border in % //--- setting (1) increase, (2) decrease and (3) reference level of the chart fixed position from the left border in % //--- getting (4) the change value of the chart fixed position from the left border in %, //--- getting the flag of changing the chart fixed position from the left border in % more than by the (5) increase and (6) decrease values void SetControlFixedPositionInc(const long value) { this.SetControlledValueINC(CHART_PROP_FIXED_POSITION,(long)::fabs(value)); } void SetControlFixedPositionDec(const long value) { this.SetControlledValueDEC(CHART_PROP_FIXED_POSITION,(long)::fabs(value)); } void SetControlFixedPositionLevel(const long value) { this.SetControlledValueLEVEL(CHART_PROP_FIXED_POSITION,(long)::fabs(value)); } double GetValueChangedFixedPosition(void) const { return this.GetPropDoubleChangedValue(CHART_PROP_FIXED_POSITION); } bool IsIncreasedFixedPosition(void) const { return (bool)this.GetPropLongFlagINC(CHART_PROP_FIXED_POSITION); } bool IsDecreasedFixedPosition(void) const { return (bool)this.GetPropLongFlagDEC(CHART_PROP_FIXED_POSITION); } //--- Fixed chart maximum //--- setting the fixed chart maximum (1) increase, (2) decrease controlled value and (3) reference level //--- getting (4) the change value of the fixed chart maximum, //--- getting the flag of changing the position of the fixed chart maximum by more than (5) increase and (6) decrease values void SetControlFixedMaxInc(const long value) { this.SetControlledValueINC(CHART_PROP_FIXED_MAX,(long)::fabs(value)); } void SetControlFixedMaxDec(const long value) { this.SetControlledValueDEC(CHART_PROP_FIXED_MAX,(long)::fabs(value)); } void SetControlFixedMaxLevel(const long value) { this.SetControlledValueLEVEL(CHART_PROP_FIXED_MAX,(long)::fabs(value)); } double GetValueChangedFixedMax(void) const { return this.GetPropDoubleChangedValue(CHART_PROP_FIXED_MAX); } bool IsIncreasedFixedMax(void) const { return (bool)this.GetPropLongFlagINC(CHART_PROP_FIXED_MAX); } bool IsDecreasedFixedMax(void) const { return (bool)this.GetPropLongFlagDEC(CHART_PROP_FIXED_MAX); } //--- Fixed chart minimum //--- setting the fixed chart minimum (1) increase, (2) decrease controlled value and (3) reference level //--- getting (4) the change value of the fixed chart minimum, //--- getting the flag of changing the position of the fixed chart minimum by more than (5) increase and (6) decrease values void SetControlFixedMinInc(const long value) { this.SetControlledValueINC(CHART_PROP_FIXED_MIN,(long)::fabs(value)); } void SetControlFixedMinDec(const long value) { this.SetControlledValueDEC(CHART_PROP_FIXED_MIN,(long)::fabs(value)); } void SetControlFixedMinLevel(const long value) { this.SetControlledValueLEVEL(CHART_PROP_FIXED_MIN,(long)::fabs(value)); } double GetValueChangedFixedMin(void) const { return this.GetPropDoubleChangedValue(CHART_PROP_FIXED_MIN); } bool IsIncreasedFixedMin(void) const { return (bool)this.GetPropLongFlagINC(CHART_PROP_FIXED_MIN); } bool IsDecreasedFixedMin(void) const { return (bool)this.GetPropLongFlagDEC(CHART_PROP_FIXED_MIN); } //CHART_PROP_POINTS_PER_BAR, // Scale in points per bar //--- Chart minimum //--- setting the chart minimum (1) increase, (2) decrease controlled value and (3) reference level //--- getting (4) the change value of the chart minimum, //--- getting the flag of changing the position of the chart minimum by more than (5) increase and (6) decrease values void SetControlPriceMinInc(const long value) { this.SetControlledValueINC(CHART_PROP_PRICE_MIN,(long)::fabs(value)); } void SetControlPriceMinDec(const long value) { this.SetControlledValueDEC(CHART_PROP_PRICE_MIN,(long)::fabs(value)); } void SetControlPriceMinLevel(const long value) { this.SetControlledValueLEVEL(CHART_PROP_PRICE_MIN,(long)::fabs(value)); } double GetValueChangedPriceMin(void) const { return this.GetPropDoubleChangedValue(CHART_PROP_PRICE_MIN); } bool IsIncreasedPriceMin(void) const { return (bool)this.GetPropLongFlagINC(CHART_PROP_PRICE_MIN); } bool IsDecreasedPriceMin(void) const { return (bool)this.GetPropLongFlagDEC(CHART_PROP_PRICE_MIN); } //--- Chart maximum //--- setting the chart maximum (1) increase, (2) decrease controlled value and (3) reference level //--- getting (4) the change value of the chart maximum, //--- getting the flag of changing the position of the chart maximum by more than (5) increase and (6) decrease values void SetControlPriceMaxInc(const long value) { this.SetControlledValueINC(CHART_PROP_PRICE_MAX,(long)::fabs(value)); } void SetControlPriceMaxDec(const long value) { this.SetControlledValueDEC(CHART_PROP_PRICE_MAX,(long)::fabs(value)); } void SetControlPriceMaxLevel(const long value) { this.SetControlledValueLEVEL(CHART_PROP_PRICE_MAX,(long)::fabs(value)); } double GetValueChangedPriceMax(void) const { return this.GetPropDoubleChangedValue(CHART_PROP_PRICE_MAX); } bool IsIncreasedPriceMax(void) const { return (bool)this.GetPropLongFlagINC(CHART_PROP_PRICE_MAX); } bool IsDecreasedPriceMax(void) const { return (bool)this.GetPropLongFlagDEC(CHART_PROP_PRICE_MAX); } }; //+------------------------------------------------------------------+
Os métodos permitem definir rapidamente aquelas propriedades do objeto cujo valor deve ser monitorado e enviar eventos para o gráfico do programa de controle quando são excedidos os valores controlados de aumento/diminuição da propriedade.
O construtor da classe foi alterado da mesma forma que na classe discutida anteriormente do objeto-janela do gráfico:
//+------------------------------------------------------------------+
//| Parametric constructor                                           |
//+------------------------------------------------------------------+
CChartObj::CChartObj(const long chart_id,CArrayObj *list_wnd_del,CArrayObj *list_ind_del,CArrayObj *list_ind_param) : m_wnd_time_x(0),m_wnd_price_y(0)
  {
   this.m_list_wnd_del=list_wnd_del;
   this.m_list_ind_del=list_ind_del;
   this.m_list_ind_param=list_ind_param;
//--- Set the chart ID to the base object and set the chart object ID
   CBaseObj::SetChartID(chart_id);
   this.m_type=COLLECTION_CHARTS_ID;

//--- Initialize base object data arrays
   this.SetControlDataArraySizeLong(CHART_PROP_INTEGER_TOTAL);
   this.SetControlDataArraySizeDouble(CHART_PROP_DOUBLE_TOTAL);
   this.ResetChangesParams();
   this.ResetControlsParams();

//--- Chart ID
   this.SetProperty(CHART_PROP_ID,chart_id);
//--- Set integer properties
   this.SetIntegerParameters();
//--- Set real properties
   this.SetDoubleParameters();
//--- Set string properties
   this.SetStringParameters();
//--- Initialize variables and lists
   this.m_digits=(int)::SymbolInfoInteger(this.Symbol(),SYMBOL_DIGITS);
   this.m_list_wnd_del.Sort(SORT_BY_CHART_WINDOW_NUM);
   this.CreateWindowsList();
   this.m_symbol_prev=this.Symbol();
   this.m_timeframe_prev=this.Timeframe();
   this.m_name=this.Header();

//--- Fill in the current chart data
   for(int i=0;i<CHART_PROP_INTEGER_TOTAL;i++)
      this.m_long_prop_event[i][3]=this.m_long_prop[i];
   for(int i=0;i<CHART_PROP_DOUBLE_TOTAL;i++)
      this.m_double_prop_event[i][3]=this.m_double_prop[i];

//--- Update the base object data and search for changes
   CBaseObjExt::Refresh();
  }
//+------------------------------------------------------------------+
Aqui, a escrita dos valores dos parâmetros do gráfico nas propriedades do objeto é realizada por três métodos:
Método que preenche as propriedades inteiras de um objeto:
//+------------------------------------------------------------------+
//| Fill in integer object properties                                |
//+------------------------------------------------------------------+
bool CChartObj::SetIntegerParameters(void)
  {
   ENUM_TIMEFRAMES timeframe=::ChartPeriod(this.ID());
   if(timeframe==0)
      return false;
   this.SetProperty(CHART_PROP_TIMEFRAME,timeframe);                                                     // Chart timeframe
   this.SetProperty(CHART_PROP_SHOW,::ChartGetInteger(this.ID(),CHART_SHOW));                            // Price chart drawing attribute
   this.SetProperty(CHART_PROP_IS_OBJECT,::ChartGetInteger(this.ID(),CHART_IS_OBJECT));                  // Chart object identification attribute
   this.SetProperty(CHART_PROP_BRING_TO_TOP,::ChartGetInteger(this.ID(),CHART_BRING_TO_TOP));            // Show the chart above all others
   this.SetProperty(CHART_PROP_CONTEXT_MENU,::ChartGetInteger(this.ID(),CHART_CONTEXT_MENU));            // Access to the context menu using the right click
   this.SetProperty(CHART_PROP_CROSSHAIR_TOOL,::ChartGetInteger(this.ID(),CHART_CROSSHAIR_TOOL));        // Access the Crosshair tool by pressing the middle mouse button
   this.SetProperty(CHART_PROP_MOUSE_SCROLL,::ChartGetInteger(this.ID(),CHART_MOUSE_SCROLL));            // Scroll the chart horizontally using the left mouse button
   this.SetProperty(CHART_PROP_EVENT_MOUSE_WHEEL,::ChartGetInteger(this.ID(),CHART_EVENT_MOUSE_WHEEL));  // Send messages about mouse wheel events to all MQL5 programs on a chart
   this.SetProperty(CHART_PROP_EVENT_MOUSE_MOVE,::ChartGetInteger(this.ID(),CHART_EVENT_MOUSE_MOVE));    // Send messages about mouse button click and movement events to all MQL5 programs on a chart
   this.SetProperty(CHART_PROP_EVENT_OBJECT_CREATE,::ChartGetInteger(this.ID(),CHART_EVENT_OBJECT_CREATE)); // Send messages about the graphical object creation event to all MQL5 programs on a chart
   this.SetProperty(CHART_PROP_EVENT_OBJECT_DELETE,::ChartGetInteger(this.ID(),CHART_EVENT_OBJECT_DELETE)); // Send messages about the graphical object destruction event to all MQL5 programs on a chart
   this.SetProperty(CHART_PROP_MODE,::ChartGetInteger(this.ID(),CHART_MODE));                            // Type of the chart (candlesticks, bars or line)
   this.SetProperty(CHART_PROP_FOREGROUND,::ChartGetInteger(this.ID(),CHART_FOREGROUND));                // Price chart in the foreground
   this.SetProperty(CHART_PROP_SHIFT,::ChartGetInteger(this.ID(),CHART_SHIFT));                          // Mode of shift of the price chart from the right border
   this.SetProperty(CHART_PROP_AUTOSCROLL,::ChartGetInteger(this.ID(),CHART_AUTOSCROLL));                // The mode of automatic shift to the right border of the chart
   this.SetProperty(CHART_PROP_KEYBOARD_CONTROL,::ChartGetInteger(this.ID(),CHART_KEYBOARD_CONTROL));    // Allow managing the chart using a keyboard
   this.SetProperty(CHART_PROP_QUICK_NAVIGATION,::ChartGetInteger(this.ID(),CHART_QUICK_NAVIGATION));    // Allow the chart to intercept Space and Enter key strokes to activate the quick navigation bar
   this.SetProperty(CHART_PROP_SCALE,::ChartGetInteger(this.ID(),CHART_SCALE));                          // Scale
   this.SetProperty(CHART_PROP_SCALEFIX,::ChartGetInteger(this.ID(),CHART_SCALEFIX));                    // Fixed scale mode
   this.SetProperty(CHART_PROP_SCALEFIX_11,::ChartGetInteger(this.ID(),CHART_SCALEFIX_11));              // 1:1 scale mode
   this.SetProperty(CHART_PROP_SCALE_PT_PER_BAR,::ChartGetInteger(this.ID(),CHART_SCALE_PT_PER_BAR));    // Mode for specifying the scale in points per bar
   this.SetProperty(CHART_PROP_SHOW_TICKER,::ChartGetInteger(this.ID(),CHART_SHOW_TICKER));              // Display a symbol ticker in the upper left corner
   this.SetProperty(CHART_PROP_SHOW_OHLC,::ChartGetInteger(this.ID(),CHART_SHOW_OHLC));                  // Display OHLC values in the upper left corner
   this.SetProperty(CHART_PROP_SHOW_BID_LINE,::ChartGetInteger(this.ID(),CHART_SHOW_BID_LINE));          // Display Bid value as a horizontal line on the chart
   this.SetProperty(CHART_PROP_SHOW_ASK_LINE,::ChartGetInteger(this.ID(),CHART_SHOW_ASK_LINE));          // Display Ask value as a horizontal line on the chart
   this.SetProperty(CHART_PROP_SHOW_LAST_LINE,::ChartGetInteger(this.ID(),CHART_SHOW_LAST_LINE));        // Display Last value as a horizontal line on the chart
   this.SetProperty(CHART_PROP_SHOW_PERIOD_SEP,::ChartGetInteger(this.ID(),CHART_SHOW_PERIOD_SEP));      // Display vertical separators between adjacent periods
   this.SetProperty(CHART_PROP_SHOW_GRID,::ChartGetInteger(this.ID(),CHART_SHOW_GRID));                  // Display the chart grid
   this.SetProperty(CHART_PROP_SHOW_VOLUMES,::ChartGetInteger(this.ID(),CHART_SHOW_VOLUMES));            // Display volumes on the chart
   this.SetProperty(CHART_PROP_SHOW_OBJECT_DESCR,::ChartGetInteger(this.ID(),CHART_SHOW_OBJECT_DESCR));  // Display text descriptions of the objects
   this.SetProperty(CHART_PROP_VISIBLE_BARS,::ChartGetInteger(this.ID(),CHART_VISIBLE_BARS));            // Number of bars on a chart that are available for display
   this.SetProperty(CHART_PROP_WINDOWS_TOTAL,::ChartGetInteger(this.ID(),CHART_WINDOWS_TOTAL));          // The total number of chart windows including indicator subwindows
   this.SetProperty(CHART_PROP_WINDOW_HANDLE,::ChartGetInteger(this.ID(),CHART_WINDOW_HANDLE));          // Chart window handle
   this.SetProperty(CHART_PROP_FIRST_VISIBLE_BAR,::ChartGetInteger(this.ID(),CHART_FIRST_VISIBLE_BAR));  // Number of the first visible bar on the chart
   this.SetProperty(CHART_PROP_WIDTH_IN_BARS,::ChartGetInteger(this.ID(),CHART_WIDTH_IN_BARS));          // Chart width in bars
   this.SetProperty(CHART_PROP_WIDTH_IN_PIXELS,::ChartGetInteger(this.ID(),CHART_WIDTH_IN_PIXELS));      // Chart width in pixels
   this.SetProperty(CHART_PROP_COLOR_BACKGROUND,::ChartGetInteger(this.ID(),CHART_COLOR_BACKGROUND));    // Chart background color
   this.SetProperty(CHART_PROP_COLOR_FOREGROUND,::ChartGetInteger(this.ID(),CHART_COLOR_FOREGROUND));    // Color of axes, scale and OHLC line
   this.SetProperty(CHART_PROP_COLOR_GRID,::ChartGetInteger(this.ID(),CHART_COLOR_GRID));                // Grid color
   this.SetProperty(CHART_PROP_COLOR_VOLUME,::ChartGetInteger(this.ID(),CHART_COLOR_VOLUME));            // Color of volumes and position opening levels
   this.SetProperty(CHART_PROP_COLOR_CHART_UP,::ChartGetInteger(this.ID(),CHART_COLOR_CHART_UP));        // Color for the up bar, shadows and body borders of bullish candlesticks
   this.SetProperty(CHART_PROP_COLOR_CHART_DOWN,::ChartGetInteger(this.ID(),CHART_COLOR_CHART_DOWN));    // Color for the down bar, shadows and body borders of bearish candlesticks
   this.SetProperty(CHART_PROP_COLOR_CHART_LINE,::ChartGetInteger(this.ID(),CHART_COLOR_CHART_LINE));    // Color of the chart line and the Doji candlesticks
   this.SetProperty(CHART_PROP_COLOR_CANDLE_BULL,::ChartGetInteger(this.ID(),CHART_COLOR_CANDLE_BULL));  // Color of the bullish candle body
   this.SetProperty(CHART_PROP_COLOR_CANDLE_BEAR,::ChartGetInteger(this.ID(),CHART_COLOR_CANDLE_BEAR));  // Color of the bearish candle body
   this.SetProperty(CHART_PROP_COLOR_BID,::ChartGetInteger(this.ID(),CHART_COLOR_BID));                  // Bid price line color
   this.SetProperty(CHART_PROP_COLOR_ASK,::ChartGetInteger(this.ID(),CHART_COLOR_ASK));                  // Ask price line color
   this.SetProperty(CHART_PROP_COLOR_LAST,::ChartGetInteger(this.ID(),CHART_COLOR_LAST));                // Color of the last performed deal's price line (Last)
   this.SetProperty(CHART_PROP_COLOR_STOP_LEVEL,::ChartGetInteger(this.ID(),CHART_COLOR_STOP_LEVEL));    // Color of stop order levels (Stop Loss and Take Profit)
   this.SetProperty(CHART_PROP_SHOW_TRADE_LEVELS,::ChartGetInteger(this.ID(),CHART_SHOW_TRADE_LEVELS));  // Display trade levels on the chart (levels of open positions, Stop Loss, Take Profit and pending orders)
   this.SetProperty(CHART_PROP_DRAG_TRADE_LEVELS,::ChartGetInteger(this.ID(),CHART_DRAG_TRADE_LEVELS));  // Enable the ability to drag trading levels on a chart using mouse
   this.SetProperty(CHART_PROP_SHOW_DATE_SCALE,::ChartGetInteger(this.ID(),CHART_SHOW_DATE_SCALE));      // Display the time scale on the chart
   this.SetProperty(CHART_PROP_SHOW_PRICE_SCALE,::ChartGetInteger(this.ID(),CHART_SHOW_PRICE_SCALE));    // Display the price scale on the chart
   this.SetProperty(CHART_PROP_SHOW_ONE_CLICK,::ChartGetInteger(this.ID(),CHART_SHOW_ONE_CLICK));        // Display the quick trading panel on the chart
   this.SetProperty(CHART_PROP_IS_MAXIMIZED,::ChartGetInteger(this.ID(),CHART_IS_MAXIMIZED));            // Chart window maximized
   this.SetProperty(CHART_PROP_IS_MINIMIZED,::ChartGetInteger(this.ID(),CHART_IS_MINIMIZED));            // Chart window minimized
   this.SetProperty(CHART_PROP_IS_DOCKED,::ChartGetInteger(this.ID(),CHART_IS_DOCKED));                  // Chart window docked
   this.SetProperty(CHART_PROP_FLOAT_LEFT,::ChartGetInteger(this.ID(),CHART_FLOAT_LEFT));                // Left coordinate of the undocked chart window relative to the virtual screen
   this.SetProperty(CHART_PROP_FLOAT_TOP,::ChartGetInteger(this.ID(),CHART_FLOAT_TOP));                  // Upper coordinate of the undocked chart window relative to the virtual screen
   this.SetProperty(CHART_PROP_FLOAT_RIGHT,::ChartGetInteger(this.ID(),CHART_FLOAT_RIGHT));              // Right coordinate of the undocked chart window relative to the virtual screen
   this.SetProperty(CHART_PROP_FLOAT_BOTTOM,::ChartGetInteger(this.ID(),CHART_FLOAT_BOTTOM));            // Bottom coordinate of the undocked chart window relative to the virtual screen
   this.SetProperty(CHART_PROP_YDISTANCE,::ChartGetInteger(this.ID(),CHART_WINDOW_YDISTANCE,0));         // Distance in Y axis pixels between the upper frame of the indicator subwindow and the upper frame of the chart main window
   this.SetProperty(CHART_PROP_HEIGHT_IN_PIXELS,::ChartGetInteger(this.ID(),CHART_HEIGHT_IN_PIXELS,0));  // Chart height in pixels
   return true;
  }
//+------------------------------------------------------------------+
Método que preenche as propriedades reais do objeto:
//+------------------------------------------------------------------+
//| Fill in real object properties                                   |
//+------------------------------------------------------------------+
void CChartObj::SetDoubleParameters(void)
  {
   this.SetProperty(CHART_PROP_SHIFT_SIZE,::ChartGetDouble(this.ID(),CHART_SHIFT_SIZE));                 // Shift size of the zero bar from the right border in %
   this.SetProperty(CHART_PROP_FIXED_POSITION,::ChartGetDouble(this.ID(),CHART_FIXED_POSITION));         // Chart fixed position from the left border in %
   this.SetProperty(CHART_PROP_FIXED_MAX,::ChartGetDouble(this.ID(),CHART_FIXED_MAX));                   // Fixed chart maximum
   this.SetProperty(CHART_PROP_FIXED_MIN,::ChartGetDouble(this.ID(),CHART_FIXED_MIN));                   // Fixed chart minimum
   this.SetProperty(CHART_PROP_POINTS_PER_BAR,::ChartGetDouble(this.ID(),CHART_POINTS_PER_BAR));         // Scale in points per bar
   this.SetProperty(CHART_PROP_PRICE_MIN,::ChartGetDouble(this.ID(),CHART_PRICE_MIN));                   // Chart minimum
   this.SetProperty(CHART_PROP_PRICE_MAX,::ChartGetDouble(this.ID(),CHART_PRICE_MAX));                   // Chart maximum
  }
//+------------------------------------------------------------------+
Método que preenche as propriedades de string de um objeto:
//+------------------------------------------------------------------+
//| Fill in string object properties                                 |
//+------------------------------------------------------------------+
bool CChartObj::SetStringParameters(void)
  {
   string symbol=::ChartSymbol(this.ID());
   if(symbol==NULL)
      return false;
   this.SetProperty(CHART_PROP_SYMBOL,symbol);                                                           // Chart symbol
   this.SetProperty(CHART_PROP_COMMENT,::ChartGetString(this.ID(),CHART_COMMENT));                       // Comment text on the chart
   this.SetProperty(CHART_PROP_EXPERT_NAME,::ChartGetString(this.ID(),CHART_EXPERT_NAME));               // name of an EA launched on the chart
   this.SetProperty(CHART_PROP_SCRIPT_NAME,::ChartGetString(this.ID(),CHART_SCRIPT_NAME));               // name of a script launched on the chart
   return true;
  }
//+------------------------------------------------------------------+
Métodos que preenchem propriedades inteiras e strings retornam valores bool porque dentro dos métodos obtemos o período gráfico e o símbolo do gráfico através do identificador usando as funções ChartPeriod() e ChartSymbol(). Essas funções podem retornar zero ou uma string vazia. Nestes casos, os métodos retornarão false.
No método que retorna uma descrição da propriedade inteira de um objeto, nos blocos de código que retornam a distância em pixels entre as bordas das janelas e a altura do gráfico em pixels, vamos retornar a propriedade diretamente desde o gráfico, em vez de desde o objeto:
      property==CHART_PROP_WINDOW_HANDLE  ?  CMessage::Text(MSG_CHART_OBJ_WINDOW_HANDLE)+
         (!this.SupportProperty(property) ?  ": "+CMessage::Text(MSG_LIB_PROP_NOT_SUPPORTED) :
          ": "+(string)this.GetProperty(property)
         )  :
      property==CHART_PROP_YDISTANCE  ?  CMessage::Text(MSG_CHART_OBJ_WINDOW_YDISTANCE)+
         (!this.SupportProperty(property) ?  ": "+CMessage::Text(MSG_LIB_PROP_NOT_SUPPORTED) :
          ": "+(string)::ChartGetInteger(this.m_chart_id,CHART_WINDOW_YDISTANCE,0)
         )  :
      property==CHART_PROP_FIRST_VISIBLE_BAR ?  CMessage::Text(MSG_CHART_OBJ_FIRST_VISIBLE_BAR)+
         (!this.SupportProperty(property) ?  ": "+CMessage::Text(MSG_LIB_PROP_NOT_SUPPORTED) :
          ": "+(string)this.GetProperty(property)
         )  :
      property==CHART_PROP_WIDTH_IN_BARS  ?  CMessage::Text(MSG_CHART_OBJ_WIDTH_IN_BARS)+
         (!this.SupportProperty(property) ?  ": "+CMessage::Text(MSG_LIB_PROP_NOT_SUPPORTED) :
          ": "+(string)this.GetProperty(property)
         )  :
      property==CHART_PROP_WIDTH_IN_PIXELS   ?  CMessage::Text(MSG_CHART_OBJ_WIDTH_IN_PIXELS)+
         (!this.SupportProperty(property) ?  ": "+CMessage::Text(MSG_LIB_PROP_NOT_SUPPORTED) :
          ": "+(string)this.GetProperty(property)
         )  :
      property==CHART_PROP_HEIGHT_IN_PIXELS   ?  CMessage::Text(MSG_CHART_OBJ_HEIGHT_IN_PIXELS)+
         (!this.SupportProperty(property) ?  ": "+CMessage::Text(MSG_LIB_PROP_NOT_SUPPORTED) :
          ": "+(string)::ChartGetInteger(this.m_chart_id,CHART_HEIGHT_IN_PIXELS,0)
         )  :
      property==CHART_PROP_COLOR_BACKGROUND        ?  CMessage::Text(MSG_CHART_OBJ_COLOR_BACKGROUND)+
         (!this.SupportProperty(property) ?  ": "+CMessage::Text(MSG_LIB_PROP_NOT_SUPPORTED) :
          ": "+::ColorToString((color)this.GetProperty(property),true)
         )  :
Simplesmente porque, embora o gráfico tenha essas propriedades, elas pertencem à sua janela (neste caso, ao zero), e não ao gráfico em si, e obtemos essas propriedades desde os objetos-janelas do gráfico.
O método que atualiza o objeto-gráfico e a lista de janelas também sofreu alterações:
//+------------------------------------------------------------------+
//| Update the chart object and its window list                      |
//+------------------------------------------------------------------+
void CChartObj::Refresh(void)
  {
//--- Initialize event data
   this.m_is_event=false;
   this.m_hash_sum=0;
   this.m_list_events.Clear();
   this.m_list_events.Sort();
//--- Update all chart windows
   for(int i=0;i<this.m_list_wnd.Total();i++)
     {
      //--- Get the next chart window object from the list
      CChartWnd *wnd=this.m_list_wnd.At(i);
      if(wnd==NULL)
         continue;
      //--- Update the window and check its event flag
      //--- If the window has no event, move on to the next window
      wnd.Refresh();
      if(!wnd.IsEvent())
         continue;
      //--- Get the list of chart window events
      CArrayObj *list=wnd.GetListEvents();
      if(list==NULL)
         continue;
      //--- Set the chart event flag and get the last event code
      this.m_is_event=true;
      this.m_event_code=wnd.GetEventCode();
      //--- In the loop by the number of chart window events,
      int n=list.Total();
      for(int j=0; j<n; j++)
        {
         //--- get the base event object from the chart window event list
         CEventBaseObj *event=list.At(j);
         if(event==NULL)
            continue;
         //--- Create the chart window event parameters using the base event
         ushort event_id=event.ID();
         this.m_last_event=event_id;
         string sparam=(string)this.GetChartID()+"_"+(string)wnd.WindowNum();
         //--- if the event is on the foreground and the chart window event is added to the chart event list,
         if(::ChartGetInteger(this.ID(),CHART_BRING_TO_TOP) && this.EventAdd((ushort)event.ID(),event.LParam(),event.DParam(),sparam))
           {
            //--- send the newly created chart window event to the control program chart
            ::EventChartCustom(this.m_chart_id_main,(ushort)event_id,event.LParam(),event.DParam(),sparam);
           }
        }
     }

//--- Check changes of a symbol and chart period
   int change=(int)::ChartGetInteger(this.m_chart_id,CHART_WINDOWS_TOTAL)-this.WindowsTotal();
   if(change==0)
     {
      //--- Get a chart symbol and period by its ID
      string symbol=::ChartSymbol(this.ID());
      ENUM_TIMEFRAMES timeframe=::ChartPeriod(this.ID());
      //--- If a symbol and period are received
      if(symbol!=NULL && timeframe!=0)
        {
         //--- create the flags specifying the equality/non-equality of the obtained period symbol with the current ones
         bool symb=symbol!=this.m_symbol_prev;
         bool tf=timeframe!=this.m_timeframe_prev;
         //--- If case of any changes, find out their exact nature:
         if(symb || tf)
           {
            //--- If both a symbol and a timeframe changed
            if(symb && tf)
              {
               //--- Send the CHART_OBJ_EVENT_CHART_SYMB_TF_CHANGE event to the control program chart
               this.SendEvent(CHART_OBJ_EVENT_CHART_SYMB_TF_CHANGE);
               //--- Set a new symbol and a period for the object, and
               this.SetSymbol(symbol);
               this.SetTimeframe(timeframe);
               //--- write the current symbol/period as the previous ones
               this.m_symbol_prev=this.Symbol();
               this.m_timeframe_prev=this.Timeframe();
              }
            //--- If only a chart symbol is changed
            else if(symb)
              {
               //--- Send the CHART_OBJ_EVENT_CHART_SYMB_CHANGE event to the control program chart
               this.SendEvent(CHART_OBJ_EVENT_CHART_SYMB_CHANGE);
               //--- Set a new symbol for the object and write the current symbol as the previous one
               this.SetSymbol(symbol);
               this.m_symbol_prev=this.Symbol();
              }
            //--- If only a chart period is changed
            else if(tf)
              {
               //--- Send the CHART_OBJ_EVENT_CHART_TF_CHANGE event to the control program chart
               this.SendEvent(CHART_OBJ_EVENT_CHART_TF_CHANGE);
               //--- Set a new timeframe for the object and write the current timeframe as the previous one
               this.SetTimeframe(timeframe);
               this.m_timeframe_prev=this.Timeframe();
              }
           }
        }
      //--- Update chart data
      if(this.SetIntegerParameters())
        {
         this.SetDoubleParameters();
         this.SetStringParameters();
        }
      //--- Fill in the current chart data
      for(int i=0;i<CHART_PROP_INTEGER_TOTAL;i++)
         this.m_long_prop_event[i][3]=this.m_long_prop[i];
      for(int i=0;i<CHART_PROP_DOUBLE_TOTAL;i++)
         this.m_double_prop_event[i][3]=this.m_double_prop[i];
      //--- Update the base object data and search for changes
      CBaseObjExt::Refresh();
      this.CheckEvents();
     }
   else
     {
      this.RecreateWindowsList(change);
     }
  }
//+------------------------------------------------------------------+
Na listagem do método, tudo é comentado detalhadamente. In short:
Depois de atualizar os objetos-janelas do gráfico, precisamos verificar o sinalizador de evento de cada janela. Se a janela possuir eventos, cada um deles deve ser enviado para o gráfico do programa de controle. After updating chart windows and checking their events, we need to check a chart symbol and/or period change in case there are no more changes involving the chart.
Ao método para criar e enviar um evento de gráfico para o gráfico do programa de controle adicionamos o processamento do símbolo e/ou evento de mudança de período gráfico:
//+------------------------------------------------------------------+
//| Create and send a chart event                                    |
//| to the control program chart                                     |
//+------------------------------------------------------------------+
void CChartObj::SendEvent(ENUM_CHART_OBJ_EVENT event)
  {
   //--- If a window is added
   if(event==CHART_OBJ_EVENT_CHART_WND_ADD)
     {
      //--- Get the last chart window object added to the list
      CChartWnd *wnd=this.GetLastAddedWindow();
      if(wnd==NULL)
         return;
      //--- Send the CHART_OBJ_EVENT_CHART_WND_ADD event to the control program chart
      //--- pass the chart ID to lparam,
      //--- pass the chart window index to dparam,
      //--- pass the chart symbol to sparam
      ::EventChartCustom(this.m_chart_id_main,(ushort)event,this.m_chart_id,wnd.WindowNum(),this.Symbol());
     }
   //--- If the window is removed
   else if(event==CHART_OBJ_EVENT_CHART_WND_DEL)
     {
      //--- Get the last chart window object added to the list of removed windows
      CChartWnd *wnd=this.GetLastDeletedWindow();
      if(wnd==NULL)
         return;
      //--- Send the CHART_OBJ_EVENT_CHART_WND_DEL event to the control program chart
      //--- pass the chart ID to lparam,
      //--- pass the chart window index to dparam,
      //--- pass the chart symbol to sparam
      ::EventChartCustom(this.m_chart_id_main,(ushort)event,this.m_chart_id,wnd.WindowNum(),this.Symbol());
     }
   //--- If symbol and timeframe changed
   else if(event==CHART_OBJ_EVENT_CHART_SYMB_TF_CHANGE)
     {
      //--- Send the CHART_OBJ_EVENT_CHART_SYMB_TF_CHANGE event to the control program chart
      //--- pass the chart ID to lparam,
      //--- pass the previous timeframe to dparam,
      //--- pass the previous chart symbol to sparam
      ::EventChartCustom(this.m_chart_id_main,(ushort)event,this.m_chart_id,this.m_timeframe_prev,this.m_symbol_prev);
     }
   //--- If a symbol changed
   else if(event==CHART_OBJ_EVENT_CHART_SYMB_CHANGE)
     {
      //--- Send the CHART_OBJ_EVENT_CHART_SYMB_CHANGE event to the control program chart
      //--- pass the chart ID to lparam,
      //--- pass the current timeframe to dparam,
      //--- pass the previous chart symbol to sparam
      ::EventChartCustom(this.m_chart_id_main,(ushort)event,this.m_chart_id,this.Timeframe(),this.m_symbol_prev);
     }
   //--- If a timeframe changed
   else if(event==CHART_OBJ_EVENT_CHART_TF_CHANGE)
     {
      //--- Send the CHART_OBJ_EVENT_CHART_TF_CHANGE event to the control program chart
      //--- pass the chart ID to lparam,
      //--- pass the previous timeframe to dparam,
      //--- pass the current chart symbol to sparam
      ::EventChartCustom(this.m_chart_id_main,(ushort)event,this.m_chart_id,this.m_timeframe_prev,this.Symbol());
     }
  }
//+------------------------------------------------------------------+
Aqui tudo está detalhado nos comentários e espero que não surjam dúvidas. Em qualquer caso, você pode colocar qualquer questão na discussão do artigo.
Agora modificamos a classe-coleção de objetos-gráficos no arquivo \MQL5\Include\DoEasy\Collections\ChartObjCollection.mqh.
Em primeiro lugar, vamos torná-lo herdeiro da classe de objeto base estendido, e à seção privada da classe adicionamos uma variável para armazenar o último evento:
//+------------------------------------------------------------------+
//| MQL5 signal object collection                                    |
//+------------------------------------------------------------------+
class CChartObjCollection : public CBaseObjExt
  {
private:
   CListObj                m_list;                                   // List of chart objects
   CListObj                m_list_del;                               // List of deleted chart objects
   CArrayObj               m_list_wnd_del;                           // List of deleted chart window objects
   CArrayObj               m_list_ind_del;                           // List of indicators removed from the indicator window
   CArrayObj               m_list_ind_param;                         // List of changed indicators
   int                     m_charts_total_prev;                      // Previous number of charts in the terminal
   int                     m_last_event;                             // The last event
   //--- Return the number of charts in the terminal
   int                     ChartsTotal(void) const;
   //--- Return the flag indicating the existence of (1) a chart object and (2) a chart
   bool                    IsPresentChartObj(const long chart_id);
   bool                    IsPresentChart(const long chart_id);
   //--- Create a new chart object and add it to the list
   bool                    CreateNewChartObj(const long chart_id,const string source);
   //--- Find the missing chart object, create it and add it to the collection list
   bool                    FindAndCreateMissingChartObj(void);
   //--- Find a chart object not present in the terminal and remove it from the list
   void                    FindAndDeleteExcessChartObj(void);
public:
Na seção pública da classe vamos escrever três métodos para trabalhar com a funcionalidade de evento do objeto base estendido e declaramos um método que retorna o objeto-janela especificado pelo índice por meio do identificador do gráfico:
//--- Return (1) the flag event, (2) an event of one of the charts and (3) the last event
   bool                    IsEvent(void)                             const { return this.m_is_event;                                   }
   int                     GetLastEventsCode(void)                   const { return this.m_event_code;                                 }
   int                     GetLastEvent(void)                        const { return this.m_last_event;                                 }

//--- Constructor
                           CChartObjCollection();

//--- Return the list of chart objects by (1) symbol and (2) timeframe
   CArrayObj              *GetChartsList(const string symbol)              { return this.GetList(CHART_PROP_SYMBOL,symbol,EQUAL);      }
   CArrayObj              *GetChartsList(const ENUM_TIMEFRAMES timeframe)  { return this.GetList(CHART_PROP_TIMEFRAME,timeframe,EQUAL);}
//--- Return the pointer to the chart object (1) by ID and (2) by an index in the list
   CChartObj              *GetChart(const long id);
   CChartObj              *GetChart(const int index)                       { return this.m_list.At(index);                             }
//--- Return (1) the last added chart and (2) the last removed chart
   CChartObj              *GetLastAddedChart(void)                         { return this.m_list.At(this.m_list.Total()-1);             }
   CChartObj              *GetLastDeletedChart(void)                       { return this.m_list_del.At(this.m_list_del.Total()-1);     }

//--- Return (1) the last added window on the chart by chart ID and (2) the last removed chart window
   CChartWnd              *GetLastAddedChartWindow(const long chart_id);
   CChartWnd              *GetLastDeletedChartWindow(void)                 { return this.m_list_wnd_del.At(this.m_list_wnd_del.Total()-1);}
//--- Return the window object (specified by index) of the chart (specified by ID)
   CChartWnd              *GetChartWindow(const long chart_id,const int wnd_num);
No método que atualiza a lista-coleção de objetos-gráficos, vamos escrever o processamento de eventos de objetos-gráficos:
//+------------------------------------------------------------------+
//| Update the collection list of chart objects                      |
//+------------------------------------------------------------------+
void CChartObjCollection::Refresh(void)
  {
//--- Initialize event data
   this.m_is_event=false;
   this.m_hash_sum=0;
   this.m_list_events.Clear();
   this.m_list_events.Sort();
   //--- In the loop by the number of chart objects in the collection list
   for(int i=0;i<this.m_list.Total();i++)
     {
      //--- get the next chart object and
      CChartObj *chart=this.m_list.At(i);
      if(chart==NULL)
         continue;
      //--- update it
      chart.Refresh();
      //--- If there is no chart event, move on to the next one
      if(!chart.IsEvent())
         continue;
      //--- Get the list of events of a selected chart
      CArrayObj *list=chart.GetListEvents();
      if(list==NULL)
         continue;
      //--- Set the event flag in the chart collection and get the last event code
      this.m_is_event=true;
      this.m_event_code=chart.GetEventCode();
      //--- In the loop by the chart event list,
      int n=list.Total();
      for(int j=0; j<n; j++)
        {
         //--- get the base event object from the chart event list
         CEventBaseObj *event=list.At(j);
         if(event==NULL)
            continue;
         //--- Create the chart event parameters using the base event
         ushort event_id=event.ID();
         this.m_last_event=event_id;
         string sparam=(string)this.GetChartID();
         //--- and, if the chart event is added to the chart event list,
         if(this.EventAdd((ushort)event.ID(),event.LParam(),event.DParam(),sparam))
           {
            //--- send the newly created chart event to the control program chart
            ::EventChartCustom(this.m_chart_id_main,(ushort)event_id,event.LParam(),event.DParam(),sparam);
           }
        }
     }

   //--- Get the number of open charts in the terminal and
   int charts_total=this.ChartsTotal();
   //--- calculate the difference between the number of open charts in the terminal
   //--- and chart objects in the collection list. These values are displayed in the chart comment
   int change=charts_total-this.m_list.Total();
   //--- If there are no changes, leave
   if(change==0)
      return;
   //--- If a chart is added in the terminal
   if(change>0)
     {
      //--- Find the missing chart object, create and add it to the collection list
      this.FindAndCreateMissingChartObj();
      //--- Get the current chart and return to it since
      //--- adding a new chart switches the focus to it
      CChartObj *chart=this.GetChart(GetMainChartID());
      if(chart!=NULL)
         chart.SetBringToTopON(true);
      for(int i=0;i<change;i++)
        {
         chart=m_list.At(m_list.Total()-(1+i));
         if(chart==NULL)
            continue;
         this.SendEvent(CHART_OBJ_EVENT_CHART_OPEN);
        }
     }
   //--- If a chart is removed in the terminal
   else if(change<0)
     {
      //--- Find an extra chart object in the collection list and remove it from the list
      this.FindAndDeleteExcessChartObj();
      for(int i=0;i<-change;i++)
        {
         CChartObj *chart=this.m_list_del.At(this.m_list_del.Total()-(1+i));
         if(chart==NULL)
            continue;
         this.SendEvent(CHART_OBJ_EVENT_CHART_CLOSE);
        }
     }
  }
//+------------------------------------------------------------------+
Aqui é aplicada a mesma lógica que nos métodos de atualização de objetos-gráficos e objetos-janelas do gráfico que vimos anteriormente, e tudo é comentado em detalhes.
Método que retorna o objeto-janela especificado pelo índic por meio do identificador do gráfico:
//+------------------------------------------------------------------+
//| Return the window object (specified by index)                    |
//| of the chart (specified by ID)                                   |
//+------------------------------------------------------------------+
CChartWnd* CChartObjCollection::GetChartWindow(const long chart_id,const int wnd_num)
  {
   CChartObj *chart=this.GetChart(chart_id);
   if(chart==NULL)
      return NULL;
   return chart.GetWindowByNum(wnd_num);
  }
//+------------------------------------------------------------------+
Here we get the chart object by its ID and return the window belonging to the chart obtained by the specified window index.
If any of the objects is not received, the method returns NULL.
Next, add the same method to the CEngine library main class in \MQL5\Include\DoEasy\Engine.mqh:
//--- Return the object (1) of the last added window of the specified chart and (2) the last removed chart window
   CChartWnd           *ChartGetLastAddedChartWindow(const long chart_id)              { return this.m_charts.GetLastAddedChartWindow(chart_id);}
   CChartWnd           *ChartGetLastDeletedChartWindow(void)                           { return this.m_charts.GetLastDeletedChartWindow();   }
//--- Return the window object (specified by index) of the chart (specified by ID)
   CChartWnd           *ChartGetChartWindow(const long chart_id,const int wnd_num)     { return this.m_charts.GetChartWindow(chart_id,wnd_num);}
O método simplesmente retorna o resultado da chamada do método GetChartWindow() da classe-coleção de objetos-gráficos que consideramos acima.
Essas são todas as mudanças e melhorias para hoje. Vamos testar e ver o resultado.
Teste
Para o teste, vamos pegar o Expert Advisor do artigo anterior e o salvamos na nova pasta \MQL5\Experts\TestDoEasy\Part72\ com o novo nome TestDoEasyPart72.mq5.
No Expert Advisor, precisaremos definir algumas propriedades dos objetos-janelas do gráfico para rastrear e adicionar o processamento de todos os novos eventos recebidos desde a coleção de objetos-gráficos.
No final da função OnInitDoEasy() do EA escrevemos um bloco de código para definirmos as propriedades das janelas do gráfico necessárias para o rastreamento (não vou dar o código completo da função, pois é muito grande):
//--- Set controlled values for the current account
   CAccount* account=engine.GetAccountCurrent();
   if(account!=NULL)
     {
      //--- Set control of the profit increase to 10
      account.SetControlledValueINC(ACCOUNT_PROP_PROFIT,10.0);
      //--- Set control of the funds increase to 15
      account.SetControlledValueINC(ACCOUNT_PROP_EQUITY,15.0);
      //--- Set profit control level to 20
      account.SetControlledValueLEVEL(ACCOUNT_PROP_PROFIT,20.0);
     }

//--- Set controlled values for charts
   //--- Get the list of all collection charts
   CArrayObj *list_charts=engine.GetListCharts();
   if(list_charts!=NULL && list_charts.Total()>0)
     {
      //--- In a loop by the list, set the necessary values for tracked chart properties
      //--- By default, the LONG_MAX value is set to all properties, which means "Do not track this property"
      //--- It can be enabled or disabled (by setting the value less than LONG_MAX or vice versa - set the LONG_MAX value) at any time and anywhere in the program
      for(int i=0;i<list_charts.Total();i++)
        {
         CChartObj* chart=list_charts.At(i);
         if(chart==NULL)
            continue;
         //--- Set reference values for the selected chart windows
         int total_wnd=chart.WindowsTotal();
         for(int j=0;j<total_wnd;j++)
           {
            CChartWnd *wnd=engine.ChartGetChartWindow(chart.ID(),j);
            if(wnd==NULL)
               continue;
            //--- Set control of the chart window height increase by 20 pixels
            wnd.SetControlHeightInPixelsInc(20);
            //--- Set control of the chart window height decrease by 20 pixels
            wnd.SetControlHeightInPixelsDec(20);
            //--- Set the control height of the chart window to 50 pixels
            wnd.SetControlledValueLEVEL(CHART_WINDOW_PROP_HEIGHT_IN_PIXELS,50);
           }
        }
     }

//--- Get the end of the library initialization time counting and display it in the journal
   ulong end=GetTickCount();
   Print(TextByLanguage("Время инициализации библиотеки: ","Library initialization time: "),TimeMSCtoString(end-begin,TIME_MINUTES|TIME_SECONDS));
  }
//+------------------------------------------------------------------+
Aqui, definimos os parâmetros:
- Se a altura da janela for aumentada em mais de 20 pixels, será gerado o evento correspondente,
- Se a altura da janela for reduzida em mais de 20 pixels, será gerado o evento correspondente,
- Se a altura da janela se tornou maior, menor ou igual a 50 pixels, será gerado o evento correspondente.
Na função OnDoEasyEvent() do Expert Advisor vamos escrever o processamento de todos os novos eventos da biblioteca (é fornecido apenas o bloco completo de código para o processamento de todos os eventos das coleções-gráficos, incluindo as novas):
//--- Handling timeseries events
   else if(idx>SERIES_EVENTS_NO_EVENT && idx<SERIES_EVENTS_NEXT_CODE)
     {
      //--- "New bar" event
      if(idx==SERIES_EVENTS_NEW_BAR)
        {
         Print(TextByLanguage("Новый бар на ","New Bar on "),sparam," ",TimeframeDescription((ENUM_TIMEFRAMES)dparam),": ",TimeToString(lparam));
        }
     }

//--- Handle chart auto events
//--- Handle chart and window events
   if(source==COLLECTION_CHART_WND_ID)
     {
      int pos=StringFind(sparam,"_");
      long chart_id=StringToInteger(StringSubstr(sparam,0,pos));
      int wnd_num=(int)StringToInteger(StringSubstr(sparam,pos+1));

      CChartObj *chart=engine.ChartGetChartObj(chart_id);
      if(chart==NULL)
         return;
      CSymbol *symbol=engine.GetSymbolObjByName(chart.Symbol());
      if(symbol==NULL)
         return;
      CChartWnd *wnd=chart.GetWindowByNum(wnd_num);
      if(wnd==NULL)
         return;
      //--- Number of decimal places in the event value - in case of a 'long' event, it is 0, otherwise - Digits() of a symbol
      int digits=(idx<CHART_WINDOW_PROP_INTEGER_TOTAL ? 0 : symbol.Digits());
      //--- Event text description
      string id_descr=(idx<CHART_WINDOW_PROP_INTEGER_TOTAL ? wnd.GetPropertyDescription((ENUM_CHART_WINDOW_PROP_INTEGER)idx) : wnd.GetPropertyDescription((ENUM_CHART_WINDOW_PROP_DOUBLE)idx));
      //--- Property change text value
      string value=DoubleToString(dparam,digits);

      //--- Check event reasons and display its description in the journal
      if(reason==BASE_EVENT_REASON_INC)
        {
         Print(wnd.EventDescription(idx,(ENUM_BASE_EVENT_REASON)reason,source,value,id_descr,digits));
        }
      if(reason==BASE_EVENT_REASON_DEC)
        {
         Print(wnd.EventDescription(idx,(ENUM_BASE_EVENT_REASON)reason,source,value,id_descr,digits));
        }
      if(reason==BASE_EVENT_REASON_MORE_THEN)
        {
         Print(wnd.EventDescription(idx,(ENUM_BASE_EVENT_REASON)reason,source,value,id_descr,digits));
        }
      if(reason==BASE_EVENT_REASON_LESS_THEN)
        {
         Print(wnd.EventDescription(idx,(ENUM_BASE_EVENT_REASON)reason,source,value,id_descr,digits));
        }
      if(reason==BASE_EVENT_REASON_EQUALS)
        {
         Print(wnd.EventDescription(idx,(ENUM_BASE_EVENT_REASON)reason,source,value,id_descr,digits));
        }
     }
//--- Handle chart auto events
   if(source==COLLECTION_CHARTS_ID)
     {
      long chart_id=StringToInteger(sparam);

      CChartObj *chart=engine.ChartGetChartObj(chart_id);
      if(chart==NULL)
         return;
      Print(DFUN,"chart_id=",chart_id,", chart.Symbol()=",chart.Symbol());
      //--- Number of decimal places in the event value - in case of a 'long' event, it is 0, otherwise - Digits() of a symbol
      int digits=int(idx<CHART_PROP_INTEGER_TOTAL ? 0 : SymbolInfoInteger(chart.Symbol(),SYMBOL_DIGITS));
      //--- Event text description
      string id_descr=(idx<CHART_PROP_INTEGER_TOTAL ? chart.GetPropertyDescription((ENUM_CHART_PROP_INTEGER)idx) : chart.GetPropertyDescription((ENUM_CHART_PROP_DOUBLE)idx));
      //--- Property change text value
      string value=DoubleToString(dparam,digits);

      //--- Check event reasons and display its description in the journal
      if(reason==BASE_EVENT_REASON_INC)
        {
         Print(chart.EventDescription(idx,(ENUM_BASE_EVENT_REASON)reason,source,value,id_descr,digits));
        }
      if(reason==BASE_EVENT_REASON_DEC)
        {
         Print(chart.EventDescription(idx,(ENUM_BASE_EVENT_REASON)reason,source,value,id_descr,digits));
        }
      if(reason==BASE_EVENT_REASON_MORE_THEN)
        {
         Print(chart.EventDescription(idx,(ENUM_BASE_EVENT_REASON)reason,source,value,id_descr,digits));
        }
      if(reason==BASE_EVENT_REASON_LESS_THEN)
        {
         Print(chart.EventDescription(idx,(ENUM_BASE_EVENT_REASON)reason,source,value,id_descr,digits));
        }
      if(reason==BASE_EVENT_REASON_EQUALS)
        {
         Print(chart.EventDescription(idx,(ENUM_BASE_EVENT_REASON)reason,source,value,id_descr,digits));
        }
     }

//--- Handle non-auto chart events
   else if(idx>CHART_OBJ_EVENT_NO_EVENT && idx<CHART_OBJ_EVENTS_NEXT_CODE)
     {
      //--- "New chart opening" event
      if(idx==CHART_OBJ_EVENT_CHART_OPEN)
        {
         //::EventChartCustom(this.m_chart_id_main,(ushort)event,chart.ID(),chart.Timeframe(),chart.Symbol());
         CChartObj *chart=engine.ChartGetLastOpenedChart();
         if(chart!=NULL)
           {
            string symbol=sparam;
            long chart_id=lparam;
            ENUM_TIMEFRAMES timeframe=(ENUM_TIMEFRAMES)dparam;
            string header=symbol+" "+TimeframeDescription(timeframe)+", ID "+(string)chart_id;
            Print(DFUN,CMessage::Text(MSG_CHART_COLLECTION_CHART_OPENED),": ",header);
           }
        }
      //--- "Chart closure" event
      if(idx==CHART_OBJ_EVENT_CHART_CLOSE)
        {
         //::EventChartCustom(this.m_chart_id_main,(ushort)event,chart.ID(),chart.Timeframe(),chart.Symbol());
         CChartObj *chart=engine.ChartGetLastClosedChart();
         if(chart!=NULL)
           {
            string symbol=sparam;
            long   chart_id=lparam;
            ENUM_TIMEFRAMES timeframe=(ENUM_TIMEFRAMES)dparam;
            string header=symbol+" "+TimeframeDescription(timeframe)+", ID "+(string)chart_id;
            Print(DFUN,CMessage::Text(MSG_CHART_COLLECTION_CHART_CLOSED),": ",header);
           }
        }
      //--- "Chart symbol changed" event
      if(idx==CHART_OBJ_EVENT_CHART_SYMB_CHANGE)
        {
         //::EventChartCustom(this.m_chart_id_main,(ushort)event,this.m_chart_id,this.Timeframe(),this.m_symbol_prev);
         long chart_id=lparam;
         ENUM_TIMEFRAMES timeframe=(ENUM_TIMEFRAMES)dparam;
         string symbol_prev=sparam;
         CChartObj *chart=engine.ChartGetChartObj(chart_id);
         if(chart!=NULL)
           {
            string header=chart.Symbol()+" "+TimeframeDescription(timeframe)+", ID "+(string)chart_id;
            Print(DFUN,CMessage::Text(MSG_CHART_COLLECTION_CHART_SYMB_CHANGED),": ",header,": ",symbol_prev," >>> ",chart.Symbol());
           }
        }
      //--- "Chart timeframe changed" event
      if(idx==CHART_OBJ_EVENT_CHART_TF_CHANGE)
        {
         //::EventChartCustom(this.m_chart_id_main,(ushort)event,this.m_chart_id,this.m_timeframe_prev,this.Symbol());
         long chart_id=lparam;
         ENUM_TIMEFRAMES timeframe_prev=(ENUM_TIMEFRAMES)dparam;
         string symbol=sparam;
         CChartObj *chart=engine.ChartGetChartObj(chart_id);
         if(chart!=NULL)
           {
            string header=chart.Symbol()+" "+TimeframeDescription(chart.Timeframe())+", ID "+(string)chart_id;
            Print
              (
               DFUN,CMessage::Text(MSG_CHART_COLLECTION_CHART_TF_CHANGED),": ",header,": ",
               TimeframeDescription(timeframe_prev)," >>> ",TimeframeDescription(chart.Timeframe())
              );
           }
        }
      //--- "Chart symbol and timeframe changed" event
      if(idx==CHART_OBJ_EVENT_CHART_SYMB_TF_CHANGE)
        {
         //::EventChartCustom(this.m_chart_id_main,(ushort)event,this.m_chart_id,this.m_timeframe_prev,this.m_symbol_prev);
         long chart_id=lparam;
         ENUM_TIMEFRAMES timeframe_prev=(ENUM_TIMEFRAMES)dparam;
         string symbol_prev=sparam;
         CChartObj *chart=engine.ChartGetChartObj(chart_id);
         if(chart!=NULL)
           {
            string header=chart.Symbol()+" "+TimeframeDescription(chart.Timeframe())+", ID "+(string)chart_id;
            Print
              (
               DFUN,CMessage::Text(MSG_CHART_COLLECTION_CHART_SYMB_TF_CHANGED),": ",header,": ",
               symbol_prev," >>> ",chart.Symbol(),", ",TimeframeDescription(timeframe_prev)," >>> ",TimeframeDescription(chart.Timeframe())
              );
           }
        }

      //--- "Adding a new window on the chart" event
      if(idx==CHART_OBJ_EVENT_CHART_WND_ADD)
        {
         //::EventChartCustom(this.m_chart_id_main,(ushort)event,this.m_chart_id,wnd.WindowNum(),this.Symbol());
         ENUM_TIMEFRAMES timeframe=WRONG_VALUE;
         string ind_name="";
         string symbol=sparam;
         long   chart_id=lparam;
         int    win_num=(int)dparam;
         string header=symbol+" "+TimeframeDescription(timeframe)+", ID "+(string)chart_id+": ";

         CChartObj *chart=engine.ChartGetLastOpenedChart();
         if(chart!=NULL)
           {
            timeframe=chart.Timeframe();
            CChartWnd *wnd=engine.ChartGetLastAddedChartWindow(chart.ID());
            if(wnd!=NULL)
              {
               CWndInd *ind=wnd.GetLastAddedIndicator();
               if(ind!=NULL)
                  ind_name=ind.Name();
              }
           }
         Print(DFUN,header,CMessage::Text(MSG_CHART_OBJ_WINDOW_ADDED)," ",(string)win_num," ",ind_name);
        }
      //--- "Removing a window from the chart" event
      if(idx==CHART_OBJ_EVENT_CHART_WND_DEL)
        {
         //::EventChartCustom(this.m_chart_id_main,(ushort)event,this.m_chart_id,wnd.WindowNum(),this.Symbol());
         CChartWnd *wnd=engine.ChartGetLastDeletedChartWindow();
         ENUM_TIMEFRAMES timeframe=WRONG_VALUE;
         string symbol=sparam;
         long   chart_id=lparam;
         int    win_num=(int)dparam;
         string header=symbol+" "+TimeframeDescription(timeframe)+", ID "+(string)chart_id+": ";
         Print(DFUN,header,CMessage::Text(MSG_CHART_OBJ_WINDOW_REMOVED)," ",(string)win_num);
        }
      //--- "Adding a new indicator to the chart window" event
      if(idx==CHART_OBJ_EVENT_CHART_WND_IND_ADD)
        {
         //::EventChartCustom(this.m_chart_id_main,(ushort)event,this.m_chart_id,this.WindowNum(),ind.Name());
         ENUM_TIMEFRAMES timeframe=WRONG_VALUE;
         string ind_name=sparam;
         string symbol=NULL;
         long   chart_id=lparam;
         int    win_num=(int)dparam;
         string header=NULL;

         CWndInd *ind=engine.ChartGetLastAddedIndicator(chart_id,win_num);
         if(ind!=NULL)
           {
            CChartObj *chart=engine.ChartGetChartObj(chart_id);
            if(chart!=NULL)
              {
               symbol=chart.Symbol();
               timeframe=chart.Timeframe();
               CChartWnd *wnd=chart.GetWindowByNum(win_num);
               if(wnd!=NULL)
                  header=wnd.Header();
              }
           }
         Print(DFUN,symbol," ",TimeframeDescription(timeframe),", ID ",chart_id,", ",header,": ",CMessage::Text(MSG_CHART_OBJ_INDICATOR_ADDED)," ",ind_name);
        }
      //--- "Removing an indicator from the chart window" event
      if(idx==CHART_OBJ_EVENT_CHART_WND_IND_DEL)
        {
         //::EventChartCustom(this.m_chart_id_main,(ushort)event,this.m_chart_id,this.WindowNum(),ind.Name());
         ENUM_TIMEFRAMES timeframe=WRONG_VALUE;
         string ind_name=sparam;
         string symbol=NULL;
         long   chart_id=lparam;
         int    win_num=(int)dparam;
         string header=NULL;

         CWndInd *ind=engine.ChartGetLastDeletedIndicator();
         if(ind!=NULL)
           {
            CChartObj *chart=engine.ChartGetChartObj(chart_id);
            if(chart!=NULL)
              {
               symbol=chart.Symbol();
               timeframe=chart.Timeframe();
               CChartWnd *wnd=chart.GetWindowByNum(win_num);
               if(wnd!=NULL)
                  header=wnd.Header();
              }
           }
         Print(DFUN,symbol," ",TimeframeDescription(timeframe),", ID ",chart_id,", ",header,": ",CMessage::Text(MSG_CHART_OBJ_INDICATOR_REMOVED)," ",ind_name);
        }
      //--- "Changing indicator parameters in the chart window" event
      if(idx==CHART_OBJ_EVENT_CHART_WND_IND_CHANGE)
        {
         //::EventChartCustom(this.m_chart_id_main,(ushort)event,this.m_chart_id,this.WindowNum(),ind.Name());
         ENUM_TIMEFRAMES timeframe=WRONG_VALUE;
         string ind_name=sparam;
         string symbol=NULL;
         long   chart_id=lparam;
         int    win_num=(int)dparam;
         string header=NULL;

         CWndInd *ind=NULL;
         CWndInd *ind_changed=engine.ChartGetLastChangedIndicator();
         if(ind_changed!=NULL)
           {
            ind=engine.ChartGetIndicator(chart_id,win_num,ind_changed.Index());
            if(ind!=NULL)
              {
               CChartObj *chart=engine.ChartGetChartObj(chart_id);
               if(chart!=NULL)
                 {
                  symbol=chart.Symbol();
                  timeframe=chart.Timeframe();
                  CChartWnd *wnd=chart.GetWindowByNum(win_num);
                  if(wnd!=NULL)
                     header=wnd.Header();
                 }
              }
           }
         Print(DFUN,symbol," ",TimeframeDescription(timeframe),", ID ",chart_id,", ",header,": ",CMessage::Text(MSG_CHART_OBJ_INDICATOR_CHANGED)," ",ind_name," >>> ",ind.Name());
        }
     }

//--- Handling trading events
Essas são todas as mudanças necessárias para testar a funcionalidade gerada automaticamente.
Vamos compilar o Expert Advisor e iniciá-lo no gráfico EURUSD, tendo previamente definido as configurações para usar dois símbolos EURUSD e GBPUSD, e o período de tempo atual:
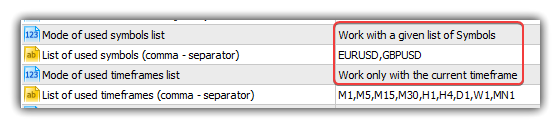
Ambos os gráficos devem ser abertos com antecedência. Vamos iniciar um EA em EURUSD, enquanto GBPUSD deve ter uma subjanela com um indicador-oscilador que será usada para controlar a funcionalidade de evento da classe-coleção de gráficos.
Vamos verificar a operação dos eventos de mudança de período gráfico:
Agora verificamos a mudança do símbolo do gráfico:
Verificamos o controle da mudança na altura dos gráficos (dois gráficos serão alterados - a subjanela e a janela do gráfico principal):

Como podemos ver, vários critérios funcionaram: a altura da janela é igual ao tamanho especificado, a altura da janela é maior/menor que o tamanho especificado e a altura da janela é aumentada/diminuída em mais do que o número especificado de pixels.
O que vem agora?
A partir do próximo artigo, iniciaremos uma nova etapa na criação da biblioteca - objetos gráficos e gráficos personalizados.
Todos os arquivos da versão atual da biblioteca e o arquivo do EA de teste para MQL5 estão anexados abaixo. Você pode baixá-los e testar tudo sozinho.
Se você tiver dúvidas, comentários e sugestões, pode expressá-los nos comentários ao artigo.
*Artigos desta série:
Outras classes na biblioteca DoEasy (Parte 68): classe de objeto-gráfico e classes de objetos-indicadores na janela do gráfico
Outras classes na biblioteca DoEasy (Parte 69): classe-coleção de objetos-gráficos
Outras classes na biblioteca DoEasy (Parte 70): extensão da funcionalidade e atualização automática da coleção de objetos-gráficos
Outras classes na biblioteca DoEasy (Parte 71): eventos da coleção de objetos-gráficos
Traduzido do russo pela MetaQuotes Ltd.
Artigo original: https://www.mql5.com/ru/articles/9385
Aviso: Todos os direitos sobre esses materiais pertencem à MetaQuotes Ltd. É proibida a reimpressão total ou parcial.
Esse artigo foi escrito por um usuário do site e reflete seu ponto de vista pessoal. A MetaQuotes Ltd. não se responsabiliza pela precisão das informações apresentadas nem pelas possíveis consequências decorrentes do uso das soluções, estratégias ou recomendações descritas.

 Conselhos de um programador profissional (Parte II): armazenamento e troca de parâmetros entre um EA, scripts e programas externos
- Aplicativos de negociação gratuitos
- 8 000+ sinais para cópia
- Notícias econômicas para análise dos mercados financeiros
Você concorda com a política do site e com os termos de uso
Artem, li seus artigos até o 34.
Nele você terminou as solicitações pendentes, o vídeo no final mostra que você abre uma ordem e faz uma solicitação pendente para definir o TP SL, após o qual o TP SL é definido, mas o SL é excluído após um segundo.
Poganyal cutucou o painel, não pode usar simultaneamente o pedido pendente tanto em pontos e tempo, quando acionado ou parar é removido ou tomar.
Eu baixei o Expert Advisor do artigo 72, verifiquei-o, o mesmo problema, o primeiro aciona o que eu cliquei no painel por último.
Artem, terminei de ler seus artigos até o 34.
Nele você concluiu as solicitações pendentes, o vídeo no final mostra que você abre uma ordem e faz uma solicitação pendente para definir um TP SL, após o que um TP SL é definido, mas o SL é excluído após um segundo.
Eu dei uma olhada no painel e não consigo usar a solicitação pendente tanto em pips quanto em tempo ao mesmo tempo, ou o stop é excluído ou o takeout é excluído quando acionado.
Baixei o Expert Advisor do artigo 72, verifiquei-o e o problema é o mesmo, o primeiro aciona o que eu cliquei no painel por último.
Obrigado. Terei tempo para dar uma olhada nisso. Muito provavelmente, à primeira vista, quando uma solicitação pendente é acionada, as outras são excluídas. Vou dar uma olhada quando tiver tempo. De qualquer forma, a biblioteca ainda está em fase de refinamento, e esses bugs têm o direito de existir. O principal é que haja feedback dos interessados, e então tudo será corrigido.
Obrigado. Terei que dar uma olhada quando tiver tempo. Provavelmente, à primeira vista, quando uma solicitação pendente é acionada, as outras também são excluídas. Vou dar uma olhada quando tiver tempo. De qualquer forma, a biblioteca ainda está em fase de refinamento, e esses erros têm o direito de existir. O principal é obter feedback dos interessados e, então, tudo será corrigido.
Eu estou interessado ))) Ler e entender ainda acho que algumas semanas apenas em artigos que, pelo menos, entenderiam figurativamente como tudo está organizado e como usá-lo... e não consigo imaginar o quanto na prática ainda ).
Estou esperando há muito tempo quando haverá artigos competentes e, o mais importante, uma biblioteca OOP completa com trabalho na Bolsa de Valores de Moscou. No ano passado, eu estava fora de mim e não visitei o recurso, mas aqui cheguei e fiquei horrorizado com as toneladas de material de primeira linha.
Agradeço pelo trabalho realizado e, sinceramente, estou encantado com a forma como o cérebro das pessoas pode trabalhar nesse plano
Estou interessado )) Acho que vou ler e entender por algumas semanas apenas os artigos para, pelo menos, entender figurativamente como tudo funciona e como usá-los... e não sei quanto mais na prática).
Estou esperando há muito tempo quando haverá artigos competentes e, o mais importante, uma biblioteca OOP completa que funcione na Bolsa de Valores de Moscou. No ano passado, eu estava fora da vida e não visitei o recurso, mas aqui cheguei e fiquei horrorizado com as toneladas de material de primeira linha.
Agradeço pelo trabalho realizado e, sinceramente, estou encantado com a forma como o cérebro das pessoas pode trabalhar nesse plano
Obrigado pela avaliação. Na verdade, é apenas rotina.
Quanto à Bolsa de Valores de Moscou, tudo aqui precisa ser exaustivamente testado e os erros identificados. Assim como no Forex.
Obrigado pela avaliação. É realmente apenas uma rotina.
Quanto à Bolsa de Moscou, tudo aqui precisa ser exaustivamente testado e os erros identificados. Assim como no forex.
Vou terminar de ler até este ponto, verei o que já foi feito aqui, só tenho todas as estratégias na pilha, preciso de seus volumes, acumulações, etc. Se a biblioteca permitir que você trabalhe totalmente com a pilha, seus índices - preços - volumes, então reconstruirei meu robô em sua biblioteca e já o testarei.
Isso pode revelar algumas falhas.
O principal é não desistir, pois o conteúdo é excelente.