
DoEasyライブラリでのその他のクラス(第72部): コレクション内のチャートオブジェクトパラメータの追跡と記録

内容
概念
本稿では、チャートオブジェクトクラスとそのコレクションについて説明します。クライアントターミナルで開かれたすべてのチャート、およびそれらのサブウィンドウと指標は、すでにチャートコレクションに保存されています。チャートのプロパティに変更があった場合、一部のイベントはすでに処理されており、適切なカスタムイベントが制御プログラムチャートに送信されます。ただし、チャートオブジェクトまたはウィンドウのプロパティは変更できるので、変更されたプロパティの新しい値を変更されたオブジェクトパラメータに設定する必要があります。
幸い、すべての子孫にイベント機能を付与するオブジェクト(すべてのライブラリオブジェクトの拡張基本オブジェクト)はすでに存在します。チャートオブジェクトとチャートウィンドウのクラスは、すでにオブジェクトの子孫なので、子孫オブジェクトのプロパティの変更の標準処理を追加するだけで済みます。指定されたプロパティが変更された場合、クラスでその子孫のすべてのプロパティを自動的に更新し、その子孫オブジェクトに対して発生したイベントのリストを作成します。
プログラムで管理するすべての追跡プロパティをオブジェクトに指定して、オブジェクトで発生するイベントが作成され、制御プログラムチャートに送信されるようにする必要があります。拡張基本オブジェクトを使用すると、指定されたプロパティの変更値を設定したり、追跡されたプロパティまたは追跡されたプロパティの変更の組み合わせに対して指定された閾値を超えたりすることができます。
オブジェクトプロパティに実装されたすべての変更は、自動的にそのパラメータに設定されます。特定のオブジェクトプロパティの追跡が有効になっている場合、これらのプロパティは、追跡するコミットされた変更について「通知」します。
ほとんどすべてのライブラリオブジェクトは同様の構造を持っています。一連のプロパティ(整数、実数、文字列のもの)、個々のオブジェクトのプロパティにのみ対応するオブジェクトの並べ替え基準、並べ替えられたリストでそのようなオブジェクトを見つけて並べ替えるためのいくつかのメソッド、オブジェクトプロパティを記述するためのメソッドと、指定されたプロパティでオブジェクトリストを検索し、必要なプロパティの最大値または最小値を含むリスト内のオブジェクトインデックスを返すことができるクラスです。
オブジェクト自体にされて密接にリンクされているオブジェクトプロパティの長い説明によってオブジェクト自体の作成はわずかに複雑になりますが、オブジェクトのさらなる使用は大幅に簡素化されます。これは、チャートウィンドウオブジェクトクラスにも当てはまります。最初は(すべてのメインライブラリオブジェクトのように)不完全であることが判明しましたが、すべてのプロパティを個別に記述せずに、ウィンドウが属するチャートオブジェクトのプロパティに配置するようにタスクを簡略化しました。
チャートオブジェクトとそのサブウィンドウのプロパティの自動更新を実装する場合、親クラスのメソッドを使用してチャートウィンドウオブジェクトのプロパティの以前の状態を保存すると、大きな問題が発生します。したがって、チャートウィンドウオブジェクトを本格的なライブラリオブジェクトにして、追跡されたイベントの検索による自動更新の実装を大幅に簡素化することにしました。これは、親クラス(すべてのライブラリオブジェクトの拡張オブジェクト)を作成するときに、これまでずっとやってきました。
ライブラリクラスの改善
\MQL5\Include\DoEasy\Data.mqhに、ライブラリの新しいメッセージインデックスを追加します。
   MSG_LIB_TEXT_SYMBOL,                               // symbol:
   MSG_LIB_TEXT_ACCOUNT,                              // account:
   MSG_LIB_TEXT_CHART,                                // chart:
   MSG_LIB_TEXT_CHART_WND,                            // chart window:
   MSG_LIB_TEXT_PROP_VALUE,                           // Property value
...
   MSG_CHART_COLLECTION_CHART_OPENED,                 // Chart opened
   MSG_CHART_COLLECTION_CHART_CLOSED,                 // Chart closed

   MSG_CHART_COLLECTION_CHART_SYMB_CHANGED,           // Chart symbol changed
   MSG_CHART_COLLECTION_CHART_TF_CHANGED,             // Chart timeframe changed
   MSG_CHART_COLLECTION_CHART_SYMB_TF_CHANGED,        // Chart symbol and timeframe changed

  };
//+------------------------------------------------------------------+
また、新しく追加したインデックスに対応するメッセージテキストも追加します。
   {"символа: ","symbol property: "},
   {"аккаунта: ","account property: "},
   {"чарта: ","chart property: "},
   {"окна чарта: ","chart window property: "},
   {"Значение свойства ","Value of the "},
...
   {"Открыт график","Open chart"},
   {"Закрыт график","Closed chart"},

   {"Изменён символ графика","Changed chart symbol"},
   {"Изменён таймфрейм графика","Changed chart timeframe"},
   {"Изменён символ и таймфрейм графика","Changed the symbol and timeframe of the chart"},

  };
//+---------------------------------------------------------------------+
\MQL5\Include\DoEasy\Defines.mqhファイルのコレクションリストIDセクションで、新しいチャートウィンドウリストIDを追加します。
//--- Collection list IDs
#define COLLECTION_HISTORY_ID          (0x777A)                   // Historical collection list ID
#define COLLECTION_MARKET_ID           (0x777B)                   // Market collection list ID
#define COLLECTION_EVENTS_ID           (0x777C)                   // Event collection list ID
#define COLLECTION_ACCOUNT_ID          (0x777D)                   // Account collection list ID
#define COLLECTION_SYMBOLS_ID          (0x777E)                   // Symbol collection list ID
#define COLLECTION_SERIES_ID           (0x777F)                   // Timeseries collection list ID
#define COLLECTION_BUFFERS_ID          (0x7780)                   // Indicator buffer collection list ID
#define COLLECTION_INDICATORS_ID       (0x7781)                   // Indicator collection list ID
#define COLLECTION_INDICATORS_DATA_ID  (0x7782)                   // Indicator data collection list ID
#define COLLECTION_TICKSERIES_ID       (0x7783)                   // Tick series collection list ID
#define COLLECTION_MBOOKSERIES_ID      (0x7784)                   // DOM series collection list ID
#define COLLECTION_MQL5_SIGNALS_ID     (0x7785)                   // MQL5 signals collection list ID
#define COLLECTION_CHARTS_ID           (0x7786)                   // Chart collection list ID
#define COLLECTION_CHART_WND_ID        (0x7787)                   // Chart window list ID
//--- Pending request type IDs
これらのIDを使用すると、特定のオブジェクトが属するコレクションまたはリストを定義できます。この場合、IDを使用すると、イベントの到着元のオブジェクトを定義し、イベントの説明を作成できます。これはすべて、すべてのライブラリオブジェクトの拡張基本オブジェクトのクラスで行われます。
前回の記事では、いくつかのチャートイベントの処理を実装しました。今日は、銘柄の変更と時間枠を追加します。
これを行うには、同じファイル内の可能なチャートイベントの列挙で 3つの定数を追加します。
//+------------------------------------------------------------------+
//| Data for working with charts                                     |
//+------------------------------------------------------------------+
//+------------------------------------------------------------------+
//| List of possible chart events                                    |
//+------------------------------------------------------------------+
enum ENUM_CHART_OBJ_EVENT
  {
   CHART_OBJ_EVENT_NO_EVENT = SIGNAL_MQL5_EVENTS_NEXT_CODE, // No event
   CHART_OBJ_EVENT_CHART_OPEN,                        // "New chart opening" event
   CHART_OBJ_EVENT_CHART_CLOSE,                       // "Chart closure" event
   CHART_OBJ_EVENT_CHART_SYMB_CHANGE,                 // "Chart symbol changed" event
   CHART_OBJ_EVENT_CHART_SYMB_TF_CHANGE,              // "Chart symbol and timeframe changed" event
   CHART_OBJ_EVENT_CHART_TF_CHANGE,                   // "Chart timeframe changed" event
   CHART_OBJ_EVENT_CHART_WND_ADD,                     // "Adding a new window on the chart" event
   CHART_OBJ_EVENT_CHART_WND_DEL,                     // "Removing a window from the chart" event
   CHART_OBJ_EVENT_CHART_WND_IND_ADD,                 // "Adding a new indicator to the chart window" event
   CHART_OBJ_EVENT_CHART_WND_IND_DEL,                 // "Removing an indicator from the chart window" event
   CHART_OBJ_EVENT_CHART_WND_IND_CHANGE,              // "Changing indicator parameters in the chart window" event
  };
#define CHART_OBJ_EVENTS_NEXT_CODE  (CHART_OBJ_EVENT_CHART_WND_IND_CHANGE+1)  // The code of the next event after the last chart event code
//+------------------------------------------------------------------+
整数プロパティの列挙からチャートウィンドウインデックスを削除します。
   CHART_PROP_WINDOW_NUM,                             // Chart window index
  };
このプロパティはチャートウィンドウオブジェクトに属しています。チャートとそのウィンドウの両方のいくつかの共通プロパティを列挙定数リストの最後に移動します。
//+------------------------------------------------------------------+
//| Chart integer property                                           |
//+------------------------------------------------------------------+
enum ENUM_CHART_PROP_INTEGER
  {
   CHART_PROP_ID = 0,                                 // Chart ID
   CHART_PROP_TIMEFRAME,                              // Chart timeframe
   CHART_PROP_SHOW,                                   // Price chart drawing
   CHART_PROP_IS_OBJECT,                              // Chart object (OBJ_CHART) identification attribute
   CHART_PROP_BRING_TO_TOP,                           // Show chart above all others
   CHART_PROP_CONTEXT_MENU,                           // Enable/disable access to the context menu using the right click
   CHART_PROP_CROSSHAIR_TOOL,                         // Enable/disable access to the Crosshair tool using the middle click
   CHART_PROP_MOUSE_SCROLL,                           // Scroll the chart horizontally using the left mouse button
   CHART_PROP_EVENT_MOUSE_WHEEL,                      // Send messages about mouse wheel events (CHARTEVENT_MOUSE_WHEEL) to all MQL5 programs on a chart
   CHART_PROP_EVENT_MOUSE_MOVE,                       // Send messages about mouse button click and movement events (CHARTEVENT_MOUSE_MOVE) to all MQL5 programs on a chart
   CHART_PROP_EVENT_OBJECT_CREATE,                    // Send messages about the graphical object creation event (CHARTEVENT_OBJECT_CREATE) to all MQL5 programs on a chart
   CHART_PROP_EVENT_OBJECT_DELETE,                    // Send messages about the graphical object destruction event (CHARTEVENT_OBJECT_DELETE) to all MQL5 programs on a chart
   CHART_PROP_MODE,                                   // Type of the chart (candlesticks, bars or line (ENUM_CHART_MODE))
   CHART_PROP_FOREGROUND,                             // Price chart in the foreground
   CHART_PROP_SHIFT,                                  // Mode of shift of the price chart from the right border
   CHART_PROP_AUTOSCROLL,                             // The mode of automatic shift to the right border of the chart
   CHART_PROP_KEYBOARD_CONTROL,                       // Allow managing the chart using a keyboard
   CHART_PROP_QUICK_NAVIGATION,                       // Allow the chart to intercept Space and Enter key strokes to activate the quick navigation bar
   CHART_PROP_SCALE,                                  // Scale
   CHART_PROP_SCALEFIX,                               // Fixed scale mode
   CHART_PROP_SCALEFIX_11,                            // 1:1 scale mode
   CHART_PROP_SCALE_PT_PER_BAR,                       // The mode of specifying the scale in points per bar
   CHART_PROP_SHOW_TICKER,                            // Display a symbol ticker in the upper left corner
   CHART_PROP_SHOW_OHLC,                              // Display OHLC values in the upper left corner
   CHART_PROP_SHOW_BID_LINE,                          // Display Bid value as a horizontal line on the chart
   CHART_PROP_SHOW_ASK_LINE,                          // Display Ask value as a horizontal line on a chart
   CHART_PROP_SHOW_LAST_LINE,                         // Display Last value as a horizontal line on a chart
   CHART_PROP_SHOW_PERIOD_SEP,                        // Display vertical separators between adjacent periods
   CHART_PROP_SHOW_GRID,                              // Display a grid on the chart
   CHART_PROP_SHOW_VOLUMES,                           // Display volumes on a chart
   CHART_PROP_SHOW_OBJECT_DESCR,                      // Display text descriptions of objects
   CHART_PROP_VISIBLE_BARS,                           // Number of bars on a chart that are available for display
   CHART_PROP_WINDOWS_TOTAL,                          // The total number of chart windows including indicator subwindows
   CHART_PROP_WINDOW_HANDLE,                          // Chart window handle
   CHART_PROP_FIRST_VISIBLE_BAR,                      // Number of the first visible bar on the chart
   CHART_PROP_WIDTH_IN_BARS,                          // Width of the chart in bars
   CHART_PROP_WIDTH_IN_PIXELS,                        // Width of the chart in pixels
   CHART_PROP_COLOR_BACKGROUND,                       // Color of background of the chart
   CHART_PROP_COLOR_FOREGROUND,                       // Color of axes, scale and OHLC line
   CHART_PROP_COLOR_GRID,                             // Grid color
   CHART_PROP_COLOR_VOLUME,                           // Color of volumes and position opening levels
   CHART_PROP_COLOR_CHART_UP,                         // Color for the up bar, shadows and body borders of bull candlesticks
   CHART_PROP_COLOR_CHART_DOWN,                       // Color of down bar, its shadow and border of body of the bullish candlestick
   CHART_PROP_COLOR_CHART_LINE,                       // Color of the chart line and the Doji candlesticks
   CHART_PROP_COLOR_CANDLE_BULL,                      // Color of body of a bullish candlestick
   CHART_PROP_COLOR_CANDLE_BEAR,                      // Color of body of a bearish candlestick
   CHART_PROP_COLOR_BID,                              // Color of the Bid price line
   CHART_PROP_COLOR_ASK,                              // Color of the Ask price line
   CHART_PROP_COLOR_LAST,                             // Color of the last performed deal's price line (Last)
   CHART_PROP_COLOR_STOP_LEVEL,                       // Color of stop order levels (Stop Loss and Take Profit)
   CHART_PROP_SHOW_TRADE_LEVELS,                      // Display trade levels on the chart (levels of open positions, Stop Loss, Take Profit and pending orders)
   CHART_PROP_DRAG_TRADE_LEVELS,                      // Enable the ability to drag trading levels on a chart using mouse
   CHART_PROP_SHOW_DATE_SCALE,                        // Display the time scale on a chart
   CHART_PROP_SHOW_PRICE_SCALE,                       // Display a price scale on a chart
   CHART_PROP_SHOW_ONE_CLICK,                         // Display the quick trading panel on the chart
   CHART_PROP_IS_MAXIMIZED,                           // Chart window maximized
   CHART_PROP_IS_MINIMIZED,                           // Chart window minimized
   CHART_PROP_IS_DOCKED,                              // Chart window docked
   CHART_PROP_FLOAT_LEFT,                             // Left coordinate of the undocked chart window relative to the virtual screen
   CHART_PROP_FLOAT_TOP,                              // Upper coordinate of the undocked chart window relative to the virtual screen
   CHART_PROP_FLOAT_RIGHT,                            // Right coordinate of the undocked chart window relative to the virtual screen
   CHART_PROP_FLOAT_BOTTOM,                           // Bottom coordinate of the undocked chart window relative to the virtual screen
   CHART_PROP_YDISTANCE,                              // Distance in Y axis pixels between the upper frame of the indicator subwindow and the upper frame of the chart main window
   CHART_PROP_HEIGHT_IN_PIXELS,                       // Height of the chart in pixels
   CHART_PROP_WINDOW_IND_HANDLE,                      // Indicator handle on the chart
   CHART_PROP_WINDOW_IND_INDEX,                       // Indicator index on the chart
  };
#define CHART_PROP_INTEGER_TOTAL (66)                 // Total number of integer properties
#define CHART_PROP_INTEGER_SKIP  (2)                  // Number of integer properties not used in sorting
//+------------------------------------------------------------------+
チャートの整数プロパティの数が1つ減少しました。67ではなく66を設定し、最後の2つのプロパティが検索と並べ替えに参加すべきでないことを指定します。これらは、チャートのプロパティには表示されません。これらの定数は、チャートウィンドウの指標オブジェクトクラスに必要です(簡略化されたバージョンでも作成されています)。
チャートプロパティの列挙に実装された変更は、チャートオブジェクトの並べ替え基準の列挙の変更に対応している必要があります。
//+------------------------------------------------------------------+
//| Possible chart sorting criteria                                  |
//+------------------------------------------------------------------+
#define FIRST_CHART_DBL_PROP  (CHART_PROP_INTEGER_TOTAL-CHART_PROP_INTEGER_SKIP)
#define FIRST_CHART_STR_PROP  (CHART_PROP_INTEGER_TOTAL-CHART_PROP_INTEGER_SKIP+CHART_PROP_DOUBLE_TOTAL-CHART_PROP_DOUBLE_SKIP)
enum ENUM_SORT_CHART_MODE
  {
//--- Sort by integer properties
   SORT_BY_CHART_ID = 0,                              // Sort by chart ID
   SORT_BY_CHART_TIMEFRAME,                           // Sort by chart timeframe
   SORT_BY_CHART_SHOW,                                // Sort by the price chart drawing attribute
   SORT_BY_CHART_IS_OBJECT,                           // Sort by chart object (OBJ_CHART) identification attribute
   SORT_BY_CHART_BRING_TO_TOP,                        // Sort by the flag of displaying a chart above all others
   SORT_BY_CHART_CONTEXT_MENU,                        // Sort by the flag of enabling/disabling access to the context menu using the right click
   SORT_BY_CHART_CROSSHAIR_TOO,                       // Sort by the flag of enabling/disabling access to the Crosshair tool using the middle click
   SORT_BY_CHART_MOUSE_SCROLL,                        // Sort by the flag of scrolling the chart horizontally using the left mouse button
   SORT_BY_CHART_EVENT_MOUSE_WHEEL,                   // Sort by the flag of sending messages about mouse wheel events to all MQL5 programs on a chart
   SORT_BY_CHART_EVENT_MOUSE_MOVE,                    // Sort by the flag of sending messages about mouse button click and movement events to all MQL5 programs on a chart
   SORT_BY_CHART_EVENT_OBJECT_CREATE,                 // Sort by the flag of sending messages about the graphical object creation event to all MQL5 programs on a chart
   SORT_BY_CHART_EVENT_OBJECT_DELETE,                 // Sort by the flag of sending messages about the graphical object destruction event to all MQL5 programs on a chart
   SORT_BY_CHART_MODE,                                // Sort by chart type
   SORT_BY_CHART_FOREGROUND,                          // Sort by the "Price chart in the foreground" flag
   SORT_BY_CHART_SHIFT,                               // Sort by the "Mode of shift of the price chart from the right border" flag
   SORT_BY_CHART_AUTOSCROLL,                          // Sort by the "The mode of automatic shift to the right border of the chart" flag
   SORT_BY_CHART_KEYBOARD_CONTROL,                    // Sort by the flag allowing the chart management using a keyboard
   SORT_BY_CHART_QUICK_NAVIGATION,                    // Sort by the flag allowing the chart to intercept Space and Enter key strokes to activate the quick navigation bar
   SORT_BY_CHART_SCALE,                               // Sort by scale
   SORT_BY_CHART_SCALEFIX,                            // Sort by the fixed scale flag
   SORT_BY_CHART_SCALEFIX_11,                         // Sort by the 1:1 scale flag
   SORT_BY_CHART_SCALE_PT_PER_BAR,                    // Sort by the flag of specifying the scale in points per bar
   SORT_BY_CHART_SHOW_TICKER,                         // Sort by the flag displaying a symbol ticker in the upper left corner
   SORT_BY_CHART_SHOW_OHLC,                           // Sort by the flag displaying OHLC values in the upper left corner
   SORT_BY_CHART_SHOW_BID_LINE,                       // Sort by the flag displaying Bid value as a horizontal line on the chart
   SORT_BY_CHART_SHOW_ASK_LINE,                       // Sort by the flag displaying Ask value as a horizontal line on the chart
   SORT_BY_CHART_SHOW_LAST_LINE,                      // Sort by the flag displaying Last value as a horizontal line on the chart
   SORT_BY_CHART_SHOW_PERIOD_SEP,                     // Sort by the flag displaying vertical separators between adjacent periods
   SORT_BY_CHART_SHOW_GRID,                           // Sort by the flag of displaying a grid on the chart
   SORT_BY_CHART_SHOW_VOLUMES,                        // Sort by the mode of displaying volumes on a chart
   SORT_BY_CHART_SHOW_OBJECT_DESCR,                   // Sort by the flag of displaying object text descriptions
   SORT_BY_CHART_VISIBLE_BARS,                        // Sort by the number of bars on a chart that are available for display
   SORT_BY_CHART_WINDOWS_TOTAL,                       // Sort by the total number of chart windows including indicator subwindows
   SORT_BY_CHART_WINDOW_HANDLE,                       // Sort by the chart handle
   SORT_BY_CHART_FIRST_VISIBLE_BAR,                   // Sort by the number of the first visible bar on the chart
   SORT_BY_CHART_WIDTH_IN_BARS,                       // Sort by the width of the chart in bars
   SORT_BY_CHART_WIDTH_IN_PIXELS,                     // Sort by the width of the chart in pixels
   SORT_BY_CHART_COLOR_BACKGROUND,                    // Sort by the color of the chart background
   SORT_BY_CHART_COLOR_FOREGROUND,                    // Sort by color of axes, scale and OHLC line
   SORT_BY_CHART_COLOR_GRID,                          // Sort by grid color
   SORT_BY_CHART_COLOR_VOLUME,                        // Sort by the color of volumes and position opening levels
   SORT_BY_CHART_COLOR_CHART_UP,                      // Sort by the color for the up bar, shadows and body borders of bull candlesticks
   SORT_BY_CHART_COLOR_CHART_DOWN,                    // Sort by the color of down bar, its shadow and border of body of the bullish candlestick
   SORT_BY_CHART_COLOR_CHART_LINE,                    // Sort by the color of the chart line and the Doji candlesticks
   SORT_BY_CHART_COLOR_CANDLE_BULL,                   // Sort by the color of a bullish candlestick body
   SORT_BY_CHART_COLOR_CANDLE_BEAR,                   // Sort by the color of a bearish candlestick body
   SORT_BY_CHART_COLOR_BID,                           // Sort by the color of the Bid price line
   SORT_BY_CHART_COLOR_ASK,                           // Sort by the color of the Ask price line
   SORT_BY_CHART_COLOR_LAST,                          // Sort by the color of the last performed deal's price line (Last)
   SORT_BY_CHART_COLOR_STOP_LEVEL,                    // Sort by the color of stop order levels (Stop Loss and Take Profit)
   SORT_BY_CHART_SHOW_TRADE_LEVELS,                   // Sort by the flag of displaying trading levels on the chart
   SORT_BY_CHART_DRAG_TRADE_LEVELS,                   // Sort by the flag enabling the ability to drag trading levels on a chart using mouse
   SORT_BY_CHART_SHOW_DATE_SCALE,                     // Sort by the flag of displaying the time scale on the chart
   SORT_BY_CHART_SHOW_PRICE_SCALE,                    // Sort by the flag of displaying the price scale on the chart
   SORT_BY_CHART_SHOW_ONE_CLICK,                      // Sort by the flag of displaying the quick trading panel on the chart
   SORT_BY_CHART_IS_MAXIMIZED,                        // Sort by the "Chart window maximized" flag
   SORT_BY_CHART_IS_MINIMIZED,                        // Sort by the "Chart window minimized" flag
   SORT_BY_CHART_IS_DOCKED,                           // Sort by the "Chart window docked" flag
   SORT_BY_CHART_FLOAT_LEFT,                          // Sort by the left coordinate of the undocked chart window relative to the virtual screen
   SORT_BY_CHART_FLOAT_TOP,                           // Sort by the upper coordinate of the undocked chart window relative to the virtual screen
   SORT_BY_CHART_FLOAT_RIGHT,                         // Sort by the right coordinate of the undocked chart window relative to the virtual screen
   SORT_BY_CHART_FLOAT_BOTTOM,                        // Sort by the bottom coordinate of the undocked chart window relative to the virtual screen
   SORT_BY_CHART_YDISTANCE,                           // Sort by the distance in Y axis pixels between the upper frame of the indicator subwindow and the upper frame of the chart main window
   SORT_BY_CHART_HEIGHT_IN_PIXELS,                    // Sort by the height of the chart in pixels
//--- Sort by real properties
   SORT_BY_CHART_SHIFT_SIZE = FIRST_CHART_DBL_PROP,   // Sort by the shift size of the zero bar from the right border in %
   SORT_BY_CHART_FIXED_POSITION,                      // Sort by the chart fixed position from the left border in %
   SORT_BY_CHART_FIXED_MAX,                           // Sort by the fixed chart maximum
   SORT_BY_CHART_FIXED_MIN,                           // Sort by the fixed chart minimum
   SORT_BY_CHART_POINTS_PER_BAR,                      // Sort by the scale value in points per bar
   SORT_BY_CHART_PRICE_MIN,                           // Sort by the chart minimum
   SORT_BY_CHART_PRICE_MAX,                           // Sort by the chart maximum
//--- Sort by string properties
   SORT_BY_CHART_COMMENT = FIRST_CHART_STR_PROP,      // Sort by a comment text on the chart
   SORT_BY_CHART_EXPERT_NAME,                         // Sort by a name of an EA launched on the chart
   SORT_BY_CHART_SCRIPT_NAME,                         // Sort by a name of a script launched on the chart
   SORT_BY_CHART_INDICATOR_NAME,                      // Sort by a name of an indicator launched in the chart window
   SORT_BY_CHART_SYMBOL,                              // Sort by chart symbol
  };
//+------------------------------------------------------------------+
整数プロパティによる並べ替えの基準を詳しく見ると、並べ替えに使用されなくなった最後の2つのプロパティが欠落していることがわかります。したがって、これらはここでは設定しません。各並べ替え基準は、特定のプロパティによるオブジェクトプロパティの列挙から定数の数値に厳密に対応しています。
チャートオブジェクトが本格的に作成されたので、その整数、実数、文字列プロパティの列挙を設定します。
//+------------------------------------------------------------------+
//| Data for handling chart windows                                  |
//+------------------------------------------------------------------+
//+------------------------------------------------------------------+
//| Chart window integer properties                                  |
//+------------------------------------------------------------------+
enum ENUM_CHART_WINDOW_PROP_INTEGER
  {
   CHART_WINDOW_PROP_ID = 0,                          // Chart ID
   CHART_WINDOW_PROP_WINDOW_NUM,                      // Chart window index
   CHART_WINDOW_PROP_YDISTANCE,                       // Distance in Y axis pixels between the upper frame of the indicator subwindow and the upper frame of the chart main window
   CHART_WINDOW_PROP_HEIGHT_IN_PIXELS,                // Height of the chart in pixels
   //--- for CWndInd
   CHART_WINDOW_PROP_WINDOW_IND_HANDLE,               // Indicator handle in the chart window
   CHART_WINDOW_PROP_WINDOW_IND_INDEX,                // Indicator index in the chart window
  };
#define CHART_WINDOW_PROP_INTEGER_TOTAL (6)           // Total number of integer properties
#define CHART_WINDOW_PROP_INTEGER_SKIP  (0)           // Number of integer DOM properties not used in sorting
//+------------------------------------------------------------------+
//| Chart window real properties                                     |
//+------------------------------------------------------------------+
enum ENUM_CHART_WINDOW_PROP_DOUBLE
  {
   CHART_WINDOW_PROP_PRICE_MIN = CHART_WINDOW_PROP_INTEGER_TOTAL, // Chart minimum
   CHART_WINDOW_PROP_PRICE_MAX,                       // Chart maximum
  };
#define CHART_WINDOW_PROP_DOUBLE_TOTAL  (2)           // Total number of real properties
#define CHART_WINDOW_PROP_DOUBLE_SKIP   (0)           // Number of real properties not used in sorting
//+------------------------------------------------------------------+
//| Chart window string properties                                   |
//+------------------------------------------------------------------+
enum ENUM_CHART_WINDOW_PROP_STRING
  {
   CHART_WINDOW_PROP_IND_NAME = (CHART_WINDOW_PROP_INTEGER_TOTAL+CHART_WINDOW_PROP_DOUBLE_TOTAL), // Name of the indicator launched in the window
   CHART_WINDOW_PROP_SYMBOL,                          // Chart symbol
  };
#define CHART_WINDOW_PROP_STRING_TOTAL  (2)           // Total number of string properties
//+------------------------------------------------------------------+
最後に、チャートウィンドウオブジェクトを並べ替える可能性のある基準の列挙を追加する必要があります。
//+------------------------------------------------------------------+
//| Possible criteria of sorting chart windows                       |
//+------------------------------------------------------------------+
#define FIRST_CHART_WINDOW_DBL_PROP  (CHART_WINDOW_PROP_INTEGER_TOTAL-CHART_WINDOW_PROP_INTEGER_SKIP)
#define FIRST_CHART_WINDOW_STR_PROP  (CHART_WINDOW_PROP_INTEGER_TOTAL-CHART_WINDOW_PROP_INTEGER_SKIP+CHART_WINDOW_PROP_DOUBLE_TOTAL-CHART_WINDOW_PROP_DOUBLE_SKIP)
enum ENUM_SORT_CHART_WINDOW_MODE
  {
//--- Sort by integer properties
   SORT_BY_CHART_WINDOW_ID = 0,                       // Sort by chart ID
   SORT_BY_CHART_WINDOW_NUM,                          // Sort by chart window index
   SORT_BY_CHART_WINDOW_YDISTANCE,                    // Sort by the distance in Y axis pixels between the upper frame of the indicator subwindow and the upper frame of the chart main window
   SORT_BY_CHART_WINDOW_HEIGHT_IN_PIXELS,             // Sort by the height of the chart in pixels
   SORT_BY_CHART_WINDOW_IND_HANDLE,                   // Sort by the indicator handle in the chart window
   SORT_BY_CHART_WINDOW_IND_INDEX,                    // Sort by the indicator index in the chart window
//--- Sort by real properties
   SORT_BY_CHART_WINDOW_PRICE_MIN = FIRST_CHART_WINDOW_DBL_PROP,  // Sort by chart window minimum
   SORT_BY_CHART_WINDOW_PRICE_MAX,                    // Sort by chart window maximum
//--- Sort by string properties
   SORT_BY_CHART_WINDOW_IND_NAME = FIRST_CHART_WINDOW_STR_PROP,   // Sort by name of an indicator launched in the window
   SORT_BY_CHART_WINDOW_SYMBOL,                       // Sort by chart symbol
  };
//+------------------------------------------------------------------+
ここで、チャートウィンドウのオブジェクトリストIDに戻りましょう。覚えているかもしれませんが、\MQL5\Include\DoEasy\Objects\BaseObj.mqh基本オブジェクトクラスファイルにクラスが設定されているCBaseObjExt基本拡張オブジェクトを改善する必要があります。
その中で行う必要があるのは、EventDescription()メソッドに2つの新しいリストの処理を追加することだけです。クラスの子孫となるオブジェクト(チャートオブジェクトおよびチャートウィンドウオブジェクト)はこれらのリストに属します。
//+------------------------------------------------------------------+
//| Return an object event description                               |
//+------------------------------------------------------------------+
string CBaseObjExt::EventDescription(const int property,
                                  const ENUM_BASE_EVENT_REASON reason,
                                  const int source,
                                  const string value,
                                  const string property_descr,
                                  const int digits)
  {
//--- Depending on the collection ID, create th object type description
   string type=
     (
      this.Type()==COLLECTION_SYMBOLS_ID     ? CMessage::Text(MSG_LIB_TEXT_SYMBOL)     :
      this.Type()==COLLECTION_ACCOUNT_ID     ?  CMessage::Text(MSG_LIB_TEXT_ACCOUNT)   :
      this.Type()==COLLECTION_CHARTS_ID      ?  CMessage::Text(MSG_LIB_TEXT_CHART)     :
      this.Type()==COLLECTION_CHART_WND_ID   ?  CMessage::Text(MSG_LIB_TEXT_CHART_WND) :
      ""
     );
//--- Depending on the property type, create the property change value description
   string level=
     (
      property<this.m_long_prop_total ?
      ::DoubleToString(this.GetControlledLongValueLEVEL(property),digits) :
      ::DoubleToString(this.GetControlledDoubleValueLEVEL(property),digits)
     );
//--- Depending on the event reason, create the event description text
   string res=
     (
      reason==BASE_EVENT_REASON_INC       ?  CMessage::Text(MSG_LIB_TEXT_PROP_VALUE)+type+property_descr+CMessage::Text(MSG_LIB_TEXT_INC_BY)+value    :
      reason==BASE_EVENT_REASON_DEC       ?  CMessage::Text(MSG_LIB_TEXT_PROP_VALUE)+type+property_descr+CMessage::Text(MSG_LIB_TEXT_DEC_BY)+value    :
      reason==BASE_EVENT_REASON_MORE_THEN ?  CMessage::Text(MSG_LIB_TEXT_PROP_VALUE)+type+property_descr+CMessage::Text(MSG_LIB_TEXT_MORE_THEN)+level :
      reason==BASE_EVENT_REASON_LESS_THEN ?  CMessage::Text(MSG_LIB_TEXT_PROP_VALUE)+type+property_descr+CMessage::Text(MSG_LIB_TEXT_LESS_THEN)+level :
      reason==BASE_EVENT_REASON_EQUALS    ?  CMessage::Text(MSG_LIB_TEXT_PROP_VALUE)+type+property_descr+CMessage::Text(MSG_LIB_TEXT_EQUAL)+level     :
      CMessage::Text(MSG_LIB_TEXT_BASE_OBJ_UNKNOWN_EVENT)+type
     );
//--- Return the object name+created event description text
   return this.m_name+": "+res;
  }
//+------------------------------------------------------------------+
クラスの詳細については、第37部をご覧ください。
ここで、開発中に気付かなかった欠点を修正します。チャートウィンドウオブジェクトクラスを改善して、メインライブラリオブジェクトのクラスのような本格的なクラスにします。オブジェクトのプロパティを格納するための配列、そのプロパティを設定して返すためのメソッド(既製のメソッドが再実行されます)、およびオブジェクトのプロパティにデータを表示するためのメソッドを追加する必要があります。
\MQL5\Include\DoEasy\Objects\Chart\ChartWnd.mqh ファイルを開き、必要な修正を行います。このファイルには、ウィンドウ内の指標オブジェクトの補助クラスも含まれています。これらのオブジェクトのいくつかのプロパティを変更したので新しい列挙の定数をCWndIndクラスのCompare()メソッドに追加します。
//+------------------------------------------------------------------+
//| Compare CWndInd objects with each other by the specified property|
//+------------------------------------------------------------------+
int CWndInd::Compare(const CObject *node,const int mode=0) const
  {
   const CWndInd *obj_compared=node;
   if(mode==CHART_WINDOW_PROP_WINDOW_IND_HANDLE) return(this.Handle()>obj_compared.Handle() ? 1 : this.Handle()<obj_compared.Handle() ? -1 : 0);
   else if(mode==CHART_WINDOW_PROP_WINDOW_IND_INDEX) return(this.Index()>obj_compared.Index() ? 1 : this.Index()<obj_compared.Index() ? -1 : 0);
   return(this.Name()==obj_compared.Name() ? 0 : this.Name()<obj_compared.Name() ? -1 : 1);
  }
//+------------------------------------------------------------------+
以前は、これらはCHART_PROP_WINDOW_IND_HANDLEおよびCHART_PROP_WINDOW_IND_INDEX列挙から削除された定数でした。
クラスのprivateセクションで、チャート銘柄のDigits()を格納するためのm_digits変数、整数、実数、文字列プロパティを格納するための配列、実数と文字列プロパティの適切な配列での実際のインデックスを返すメソッドを追加します。
//+------------------------------------------------------------------+
//| Chart window object class                                        |
//+------------------------------------------------------------------+
class CChartWnd : public CBaseObjExt
  {
private:
   CArrayObj         m_list_ind;                                        // Indicator list
   CArrayObj        *m_list_ind_del;                                    // Pointer to the list of indicators removed from the indicator window
   CArrayObj        *m_list_ind_param;                                  // Pointer to the list of changed indicators
   long              m_long_prop[CHART_WINDOW_PROP_INTEGER_TOTAL];      // Integer properties
   double            m_double_prop[CHART_WINDOW_PROP_DOUBLE_TOTAL];     // Real properties
   string            m_string_prop[CHART_WINDOW_PROP_STRING_TOTAL];     // String properties
   int               m_digits;                                          // Symbol's Digits()
   int               m_wnd_coord_x;                                     // The X coordinate for the time on the chart in the window
   int               m_wnd_coord_y;                                     // The Y coordinate for the price on the chart in the window
//--- Return the index of the array the (1) double and (2) string properties are actually located at
   int               IndexProp(ENUM_CHART_WINDOW_PROP_DOUBLE property)  const { return(int)property-CHART_WINDOW_PROP_INTEGER_TOTAL;                                 }
   int               IndexProp(ENUM_CHART_WINDOW_PROP_STRING property)  const { return(int)property-CHART_WINDOW_PROP_INTEGER_TOTAL-CHART_WINDOW_PROP_DOUBLE_TOTAL;  }
クラスのpublicセクションで、指定されたオブジェクトプロパティを設定するメソッドと返すメソッドを設定します。
public:
//--- Set object's (1) integer, (2) real and (3) string properties
   void              SetProperty(ENUM_CHART_WINDOW_PROP_INTEGER property,long value)   { this.m_long_prop[property]=value;                      }
   void              SetProperty(ENUM_CHART_WINDOW_PROP_DOUBLE property,double value)  { this.m_double_prop[this.IndexProp(property)]=value;    }
   void              SetProperty(ENUM_CHART_WINDOW_PROP_STRING property,string value)  { this.m_string_prop[this.IndexProp(property)]=value;    }
//--- Return object’s (1) integer, (2) real and (3) string property from the properties array
   long              GetProperty(ENUM_CHART_WINDOW_PROP_INTEGER property)        const { return this.m_long_prop[property];                     }
   double            GetProperty(ENUM_CHART_WINDOW_PROP_DOUBLE property)         const { return this.m_double_prop[this.IndexProp(property)];   }
   string            GetProperty(ENUM_CHART_WINDOW_PROP_STRING property)         const { return this.m_string_prop[this.IndexProp(property)];   }
//--- Return itself
   CChartWnd        *GetObject(void)                                                   { return &this;   }
指定された整数、実数、文字列のプロパティをサポートするオブジェクトのフラグを返すすべてのメソッドはtrueを返します。各プロパティはサポートされています。< s3>オブジェクトプロパティの説明を返すメソッドはここでは単に宣言され、クラス本体の外で実装されます (現在、実数プロパティの説明を返すメソッドは「プロパティがサポートされていません」というメッセージを返します。他の2つはすでに記述されているため、その実装はクラス本体の外に移動されます)。
//--- Return itself
   CChartWnd        *GetObject(void)                                                   { return &this;   }

//--- Return the flag of the object supporting this property
   virtual bool      SupportProperty(ENUM_CHART_WINDOW_PROP_INTEGER property)          { return true;    }
   virtual bool      SupportProperty(ENUM_CHART_WINDOW_PROP_DOUBLE property)           { return true;    }
   virtual bool      SupportProperty(ENUM_CHART_WINDOW_PROP_STRING property)           { return true;    }

//--- Get description of (1) integer, (2) real and (3) string properties
   string            GetPropertyDescription(ENUM_CHART_WINDOW_PROP_INTEGER property);
   string            GetPropertyDescription(ENUM_CHART_WINDOW_PROP_DOUBLE property);
   string            GetPropertyDescription(ENUM_CHART_WINDOW_PROP_STRING property);
すべての「this.m_window_num」文字列インスタンスを「this.WindowNum()」(もちろん鍵括弧なし)で置き換えます。m_window_num変数を削除し、ウィンドウインデックスがオブジェクトプロパティに配置されたので、プロパティ値を返すにはWindowNum()メソッドが使用されます。
WindowNum()メソッドは以前にはm_window_num変数値を返していました。
int WindowNum(void) const { return this.m_window_num; }
これが、オブジェクトプロパティを返すようになります。
int WindowNum(void) const { return (int)this.GetProperty(CHART_WINDOW_PROP_WINDOW_NUM); }
実数プロパティを返すための2つのメソッドを追加し、変数ではなく適切なオブジェクトプロパティを返す/設定するように既存のメソッドを修正します。
//--- Return (1) the subwindow index, (2) the number of indicators attached to the window, (3) the name of a symbol chart, as well as (4) the highest and (5) lowest prices
   int               WindowNum(void)                              const { return (int)this.GetProperty(CHART_WINDOW_PROP_WINDOW_NUM);     }
   int               IndicatorsTotal(void)                        const { return this.m_list_ind.Total();                                 }
   string            Symbol(void)                                 const { return this.GetProperty(CHART_WINDOW_PROP_SYMBOL);              }
   double            PriceMax(void)                               const { return this.GetProperty(CHART_WINDOW_PROP_PRICE_MAX);           }
   double            PriceMin(void)                               const { return this.GetProperty(CHART_WINDOW_PROP_PRICE_MIN);           }
//--- Set (1) the subwindow index and (2) the chart symbol
   void              SetWindowNum(const int num)                        { this.SetProperty(CHART_WINDOW_PROP_WINDOW_NUM,num);             }
   void              SetSymbol(const string symbol)                     { this.SetProperty(CHART_WINDOW_PROP_SYMBOL,symbol);              }
編集されたクラスの親であるCBaseObjExtクラスによって提供されるオブジェクトのプロパティの自動更新を実装するには、Refresh()メソッドにいくつかの修正を加える必要があります。イベント機能を調整するには、追跡対象オブジェクトのプロパティと制御されたプロパティの値を設定するメソッドを追加して、指定された追跡対象の値が管理するオブジェクトのプロパティの値と交差する瞬間を検索するとよいでしょう。
CBaseObjExtクラスはすでに参照値を設定してプロパティを追跡する機能を備えているため、これらのメソッドは実装しなくてもすみます。ただし、クラスの用途が非常に広くそのメソッドは非常に抽象的であるので、プロパティの管理に必要な定数の名前を覚えておく必要があります。これは不便です。したがって、CBaseObjExt拡張オブジェクトクラスに基づくクラスは、オブジェクトに正確に設定されているものを明示的に示すメソッドを受け取ります。
したがって、クラス本体リストの最後に、追跡されるプロパティをウィンドウフレーム間のピクセル単位の距離とチャートウィンドウの高さ(ピクセル単位)に設定するための2つのコードブロックを記述します。
//+------------------------------------------------------------------+
//| Get and set the parameters of tracked property changes           |
//+------------------------------------------------------------------+
//--- Distance in Y axis pixels between the upper frame of the indicator subwindow and the upper frame of the chart main window
//--- set the controlled (1) growth, (2) decrease, (3) reference distance level in pixels by the vertical Y axis between the window frames
//--- get (4) the distance change in pixels by the vertical Y axis between the window frames,
//--- get the distance change flag in pixels by the vertical Y axis between the window frames exceeding the (5) growth and (6) decrease values
   void              SetControlWindowYDistanceInc(const long value)        { this.SetControlledValueINC(CHART_WINDOW_PROP_YDISTANCE,(long)::fabs(value));         }
   void              SetControlWindowYDistanceDec(const long value)        { this.SetControlledValueDEC(CHART_WINDOW_PROP_YDISTANCE,(long)::fabs(value));         }
   void              SetControlWindowYDistanceLevel(const long value)      { this.SetControlledValueLEVEL(CHART_WINDOW_PROP_YDISTANCE,(long)::fabs(value));       }
   long              GetValueChangedWindowYDistance(void)            const { return this.GetPropLongChangedValue(CHART_WINDOW_PROP_YDISTANCE);                    }
   bool              IsIncreasedWindowYDistance(void)                const { return (bool)this.GetPropLongFlagINC(CHART_WINDOW_PROP_YDISTANCE);                   }
   bool              IsDecreasedWindowYDistance(void)                const { return (bool)this.GetPropLongFlagDEC(CHART_WINDOW_PROP_YDISTANCE);                   }

//--- Height of the chart in pixels
//--- setting the controlled spread (1) increase, (2) decrease value and (3) reference chart height in pixels
//--- get (4) the chart height change in pixels,
//--- get the flag of the chart height change in pixels exceeding (5) the growth and (6) decrease values
   void              SetControlHeightInPixelsInc(const long value)         { this.SetControlledValueINC(CHART_WINDOW_PROP_HEIGHT_IN_PIXELS,(long)::fabs(value));   }
   void              SetControlHeightInPixelsDec(const long value)         { this.SetControlledValueDEC(CHART_WINDOW_PROP_HEIGHT_IN_PIXELS,(long)::fabs(value));   }
   void              SetControlHeightInPixelsLevel(const long value)       { this.SetControlledValueLEVEL(CHART_WINDOW_PROP_HEIGHT_IN_PIXELS,(long)::fabs(value)); }
   long              GetValueChangedHeightInPixels(void)             const { return this.GetPropLongChangedValue(CHART_WINDOW_PROP_HEIGHT_IN_PIXELS);              }
   bool              IsIncreasedHeightInPixels(void)                 const { return (bool)this.GetPropLongFlagINC(CHART_WINDOW_PROP_HEIGHT_IN_PIXELS);             }
   bool              IsDecreasedHeightInPixels(void)                 const { return (bool)this.GetPropLongFlagDEC(CHART_WINDOW_PROP_HEIGHT_IN_PIXELS);             }

  };
//+------------------------------------------------------------------+
これで、これらのプロパティに必要な追跡値を設定できるようになりました。ライブラリはそれらを自動的に追跡し、これらのプロパティで発生したイベントを処理のために制御プログラムチャートに送信します。これらすべては、すべてのライブラリオブジェクトの基本拡張オブジェクトを作成するときに詳細に考慮されました。
クラスのパラメトリックコンストラクタに変更が加えられました。
//+------------------------------------------------------------------+
//| Parametric constructor                                           |
//+------------------------------------------------------------------+
CChartWnd::CChartWnd(const long chart_id,const int wnd_num,const string symbol,CArrayObj *list_ind_del,CArrayObj *list_ind_param) : m_wnd_coord_x(0),m_wnd_coord_y(0)
  {
   this.m_digits=(int)::SymbolInfoInteger(symbol,SYMBOL_DIGITS);
   this.m_list_ind_del=list_ind_del;
   this.m_list_ind_param=list_ind_param;
   CBaseObj::SetChartID(chart_id);
   this.m_type=COLLECTION_CHART_WND_ID;

//--- Initialize base object data arrays
   this.SetControlDataArraySizeLong(CHART_WINDOW_PROP_INTEGER_TOTAL);
   this.SetControlDataArraySizeDouble(CHART_WINDOW_PROP_DOUBLE_TOTAL);
   this.ResetChangesParams();
   this.ResetControlsParams();

//--- Set object properties
   this.SetProperty(CHART_WINDOW_PROP_WINDOW_NUM,wnd_num);
   this.SetProperty(CHART_WINDOW_PROP_SYMBOL,symbol);
   this.SetProperty(CHART_WINDOW_PROP_ID,chart_id);
   this.SetProperty(CHART_WINDOW_PROP_YDISTANCE,::ChartGetInteger(chart_id,CHART_WINDOW_YDISTANCE,wnd_num));
   this.SetProperty(CHART_WINDOW_PROP_HEIGHT_IN_PIXELS,::ChartGetInteger(chart_id,CHART_HEIGHT_IN_PIXELS,wnd_num));
   this.SetProperty(CHART_WINDOW_PROP_PRICE_MIN,::ChartGetDouble(chart_id,CHART_PRICE_MIN,wnd_num));
   this.SetProperty(CHART_WINDOW_PROP_PRICE_MAX,::ChartGetDouble(chart_id,CHART_PRICE_MAX,wnd_num));
   this.m_name=this.Header();

//--- Fill in the symbol current data
   for(int i=0;i<CHART_WINDOW_PROP_INTEGER_TOTAL;i++)
      this.m_long_prop_event[i][3]=this.m_long_prop[i];
   for(int i=0;i<CHART_WINDOW_PROP_DOUBLE_TOTAL;i++)
      this.m_double_prop_event[i][3]=this.m_double_prop[i];
//--- Update the base object data and search for changes
   CBaseObjExt::Refresh();

//--- Create the indicator list
   this.IndicatorsListCreate();
  }
//+------------------------------------------------------------------+
ここでは、チャート銘柄のDigits()を取得(データを表示するため)し、チャートウィンドウのオブジェクトリストIDと同じにオブジェクトタイプを設定します。
基本オブジェクトデータの配列を初期化するブロックで、基本オブジェクト配列の現在のオブジェクト配列のサイズを設定し(最後のチェック中にオブジェクトデータを保存します)、すべての値をゼロにリセットします。
オブジェクトプロパティを設定するブロックで、必要なすべてのチャートデータをオブジェクトパラメータに書き込みます。
現在の銘柄データを入力するブロックで、オブジェクトプロパティのすべてのデータセットを基本オブジェクト配列に書き込みます。
基本オブジェクトのデータを更新して変更を検索するブロックで、基本オブジェクトの配列に現在のオブジェクトデータを入力し、前の状態と比較します。プロパティ追跡フラグが設定されている場合は、これが管理可能な状況であるかどうかを確認します。そうである場合は、基本イベントを作成して基本オブジェクトイベントのリストに配置します。
2つのチャートウィンドウオブジェクトを比較するメソッドで、削除されたすべての列挙定数を新しいものに置き換えます。
//+------------------------------------------------------------------+
//| Compare CChartWnd objects with each other by a specified property|
//+------------------------------------------------------------------+
int CChartWnd::Compare(const CObject *node,const int mode=0) const
  {
   const CChartWnd *obj_compared=node;
   if(mode==CHART_WINDOW_PROP_YDISTANCE)
      return(this.YDistance()>obj_compared.YDistance() ? 1 : this.YDistance()<obj_compared.YDistance() ? -1 : 0);
   else if(mode==CHART_WINDOW_PROP_HEIGHT_IN_PIXELS)
      return(this.HeightInPixels()>obj_compared.HeightInPixels() ? 1 : this.HeightInPixels()<obj_compared.HeightInPixels() ? -1 : 0);
   else if(mode==CHART_WINDOW_PROP_WINDOW_NUM)
      return(this.WindowNum()>obj_compared.WindowNum() ? 1 : this.WindowNum()<obj_compared.WindowNum() ? -1 : 0);
   else if(mode==CHART_WINDOW_PROP_SYMBOL)
      return(this.Symbol()==obj_compared.Symbol() ? 0 : this.Symbol()>obj_compared.Symbol() ? 1 : -1);
   return -1;
  }
//+------------------------------------------------------------------+
オブジェクト整数プロパティの説明を返すメソッドで、列挙定数を新しいものに置き換え、新しいプロパティの説明を返すようにします。
//+------------------------------------------------------------------+
//| Return description of object's integer property                  |
//+------------------------------------------------------------------+
string CChartWnd::GetPropertyDescription(ENUM_CHART_WINDOW_PROP_INTEGER property)
  {
   return
     (
      property==CHART_WINDOW_PROP_ID  ?  CMessage::Text(MSG_CHART_OBJ_ID)+
         (!this.SupportProperty(property) ?  ": "+CMessage::Text(MSG_LIB_PROP_NOT_SUPPORTED) :
          ": "+(string)CBaseObj::GetChartID()
         )  :
      property==CHART_WINDOW_PROP_WINDOW_NUM  ?  CMessage::Text(MSG_CHART_OBJ_WINDOW_N)+
         (!this.SupportProperty(property) ?  ": "+CMessage::Text(MSG_LIB_PROP_NOT_SUPPORTED) :
          ": "+(string)this.WindowNum()
         )  :
      property==CHART_WINDOW_PROP_YDISTANCE  ?  CMessage::Text(MSG_CHART_OBJ_WINDOW_YDISTANCE)+
         (!this.SupportProperty(property) ?  ": "+CMessage::Text(MSG_LIB_PROP_NOT_SUPPORTED) :
          ": "+(string)this.YDistance()
         )  :
      property==CHART_WINDOW_PROP_HEIGHT_IN_PIXELS  ?  CMessage::Text(MSG_CHART_OBJ_HEIGHT_IN_PIXELS)+
         (!this.SupportProperty(property) ?  ": "+CMessage::Text(MSG_LIB_PROP_NOT_SUPPORTED) :
          ": "+(string)this.HeightInPixels()
         )  :
      ""
     );
  }
//+------------------------------------------------------------------+
オブジェクトの実数プロパティの説明を返すメソッドを実装します。
//+------------------------------------------------------------------+
//| Return description of object's real property                     |
//+------------------------------------------------------------------+
string CChartWnd::GetPropertyDescription(ENUM_CHART_WINDOW_PROP_DOUBLE property)
  {
   return
     (
      property==CHART_WINDOW_PROP_PRICE_MIN  ?  CMessage::Text(MSG_CHART_OBJ_PRICE_MIN)+
         (!this.SupportProperty(property) ?  ": "+CMessage::Text(MSG_LIB_PROP_NOT_SUPPORTED) :
          ": "+::DoubleToString(this.PriceMin(),this.m_digits)
         )  :
      property==CHART_WINDOW_PROP_PRICE_MAX  ?  CMessage::Text(MSG_CHART_OBJ_PRICE_MAX)+
         (!this.SupportProperty(property) ?  ": "+CMessage::Text(MSG_LIB_PROP_NOT_SUPPORTED) :
          ": "+::DoubleToString(this.PriceMax(),this.m_digits)
         )  :
      ""
     );
  }
//+------------------------------------------------------------------+
オブジェクト文字列プロパティの説明を返すメソッドで、列挙定数を新しいものに置き換えます。
//+------------------------------------------------------------------+
//| Return description of object's string property                   |
//+------------------------------------------------------------------+
string CChartWnd::GetPropertyDescription(ENUM_CHART_WINDOW_PROP_STRING property)
  {
   return
     (
      property==CHART_WINDOW_PROP_SYMBOL  ?  CMessage::Text(MSG_LIB_PROP_SYMBOL)+
         (!this.SupportProperty(property) ?  ": "+CMessage::Text(MSG_LIB_PROP_NOT_SUPPORTED) :
          ": "+this.Symbol()
         )  :
      ""
     );
  }
//+------------------------------------------------------------------+
オブジェクトプロパティの操作ログを表示するメソッドでも列挙定数が変更されますが、オブジェクトの実数プロパティの表示を担当するコードブロックはコメントでなくなっています(以前は、ループ内のコードブロックはコメントアウトされていましたが、メソッドから削除されていませんでした)。
//+------------------------------------------------------------------+
//| Display object properties in the journal                         |
//+------------------------------------------------------------------+
void CChartWnd::Print(const bool full_prop=false)
  {
   ::Print("============= ",CMessage::Text(MSG_LIB_PARAMS_LIST_BEG)," (",this.Header(),") =============");
   int beg=0, end=CHART_WINDOW_PROP_INTEGER_TOTAL;
   for(int i=beg; i<end; i++)
     {
      ENUM_CHART_WINDOW_PROP_INTEGER prop=(ENUM_CHART_WINDOW_PROP_INTEGER)i;
      if(prop==CHART_WINDOW_PROP_WINDOW_IND_HANDLE || prop==CHART_WINDOW_PROP_WINDOW_IND_INDEX) continue;
      if(!full_prop && !this.SupportProperty(prop)) continue;
      ::Print(this.GetPropertyDescription(prop));
     }
   ::Print("------");
   beg=end; end+=CHART_WINDOW_PROP_DOUBLE_TOTAL;
   for(int i=beg; i<end; i++)
     {
      ENUM_CHART_WINDOW_PROP_DOUBLE prop=(ENUM_CHART_WINDOW_PROP_DOUBLE)i;
      if(!full_prop && !this.SupportProperty(prop)) continue;
      ::Print(this.GetPropertyDescription(prop));
     }
   beg=end; end+=CHART_WINDOW_PROP_STRING_TOTAL;
   for(int i=beg; i<end; i++)
     {
      ENUM_CHART_WINDOW_PROP_STRING prop=(ENUM_CHART_WINDOW_PROP_STRING)i;
      if(prop==CHART_WINDOW_PROP_IND_NAME)
        {
         this.PrintIndicators();
         continue;
        }
      if(!full_prop && !this.SupportProperty(prop)) continue;
      ::Print(this.GetPropertyDescription(prop));
     }
   ::Print("============= ",CMessage::Text(MSG_LIB_PARAMS_LIST_END)," (",this.Header(),") =============\n");
  }
//+------------------------------------------------------------------+
操作ログにウィンドウパラメータの説明を表示するメソッドで、新しいパラメータの表示を追加し、定数を新しいものに変更します。
//+------------------------------------------------------------------+
//| Display the description of the window parameters in the journal  |
//+------------------------------------------------------------------+
void CChartWnd::PrintParameters(const bool dash=false)
  {
   string header=
     (
      this.WindowNum()==0 ? CMessage::Text(MSG_CHART_OBJ_CHART_WINDOW) :
      CMessage::Text(MSG_CHART_OBJ_CHART_SUBWINDOW)+" "+(string)this.WindowNum()
     );
   ::Print((dash ? " " : ""),header,":");
   string pref=(dash ? " - " : "");
   if(this.WindowNum()>0)
      ::Print(pref,GetPropertyDescription(CHART_WINDOW_PROP_YDISTANCE));
   ::Print(pref,GetPropertyDescription(CHART_WINDOW_PROP_HEIGHT_IN_PIXELS));
   ::Print(pref,GetPropertyDescription(CHART_WINDOW_PROP_PRICE_MAX));
   ::Print(pref,GetPropertyDescription(CHART_WINDOW_PROP_PRICE_MIN));
  }
//+------------------------------------------------------------------+
チャートウィンドウデータを更新するメソッドを改善します。イベントデータの初期化(変数)と、他に変更がなかった場合(指標をウィンドウに追加するまたはウィンドウから削除)にオブジェクトパラメータの変更を処理するコードブロックを追加する必要があります。
//+------------------------------------------------------------------+
//| Update data on attached indicators                               |
//+------------------------------------------------------------------+
void CChartWnd::Refresh(void)
  {
   //--- Initialize event data
   this.m_is_event=false;
   this.m_hash_sum=0;
   //--- Calculate the change of the indicator number in the "now and during the previous check" window
   int change=::ChartIndicatorsTotal(this.m_chart_id,this.WindowNum())-this.m_list_ind.Total();
   //--- If there is no change in the number of indicators in the window,
   if(change==0)
     {
      //--- check the change of parameters of all indicators and exit
      this.IndicatorsChangeCheck();
      //--- Update integer properties
      this.SetProperty(CHART_WINDOW_PROP_YDISTANCE,::ChartGetInteger(this.m_chart_id,CHART_WINDOW_YDISTANCE,this.WindowNum()));
      this.SetProperty(CHART_WINDOW_PROP_HEIGHT_IN_PIXELS,::ChartGetInteger(this.m_chart_id,CHART_HEIGHT_IN_PIXELS,this.WindowNum()));
      //--- Update real properties
      this.SetProperty(CHART_WINDOW_PROP_PRICE_MIN,::ChartGetDouble(this.m_chart_id,CHART_PRICE_MIN,this.WindowNum()));
      this.SetProperty(CHART_WINDOW_PROP_PRICE_MAX,::ChartGetDouble(this.m_chart_id,CHART_PRICE_MAX,this.WindowNum()));
      //--- Update string properties
      string symbol=::ChartSymbol(this.m_chart_id);
      if(symbol!=NULL)
         this.SetProperty(CHART_WINDOW_PROP_SYMBOL,symbol);

      //--- Fill in the current symbol data
      for(int i=0;i<CHART_WINDOW_PROP_INTEGER_TOTAL;i++)
         this.m_long_prop_event[i][3]=this.m_long_prop[i];
      for(int i=0;i<CHART_WINDOW_PROP_DOUBLE_TOTAL;i++)
         this.m_double_prop_event[i][3]=this.m_double_prop[i];

      //--- Update the base object data, search for changes and exit
      CBaseObjExt::Refresh();
      this.CheckEvents();
      return;
     }
   //--- If indicators are added
   if(change>0)
     {
      //--- Call the method of adding new indicators to the list
      this.IndicatorsAdd();
      //--- In the loop by the number of indicators added to the window,
      for(int i=0;i<change;i++)
        {
         //--- get the new indicator in the list by the index calculated from the end of the list
         int index=this.m_list_ind.Total()-(1+i);
         //--- and if failed to obtain the object, move on to the next one
         CWndInd *ind=this.m_list_ind.At(index);
         if(ind==NULL)
            continue;
         //--- call the method of sending an event to the control program chart
         this.SendEvent(CHART_OBJ_EVENT_CHART_WND_IND_ADD);
        }
     }
   //--- If there are removed indicators
   if(change<0)
     {
      //--- Call the method of removing unnecessary indicators from the list
      this.IndicatorsDelete();
      //--- In the loop by the number of indicators removed from the window,
      for(int i=0;i<-change;i++)
        {
         //--- get a new removed indicator in the list of removed indicators by index calculated from the end of the list
         int index=this.m_list_ind_del.Total()-(1+i);
         //--- and if failed to obtain the object, move on to the next one
         CWndInd *ind=this.m_list_ind_del.At(index);
         if(ind==NULL)
            continue;
         //--- call the method of sending an event to the control program chart
         this.SendEvent(CHART_OBJ_EVENT_CHART_WND_IND_DEL);
        }
     }
  }
//+------------------------------------------------------------------+
ここでは、すべてがコードブロックのコメントで説明されています。パラメトリックコンストラクタの改善を説明する際に、詳細を説明しましたが、これはほとんど同じことです。
チャートウィンドウオブジェクトクラスの本格的なライブラリオブジェクトへの変換はこれで完了です。
次に、\MQL5\Include\DoEasy\Objects\Chart\ChartObj.mqhのチャートオブジェクトクラスを改善しましょう。
クラスのprivateセクションで、前の銘柄とチャートの時間枠を格納するための新しい変数、および最後のイベントを格納するための変数を追加します。
//+------------------------------------------------------------------+
//| Chart object class                                               |
//+------------------------------------------------------------------+
class CChartObj : public CBaseObjExt
  {
private:
   CArrayObj         m_list_wnd;                                  // List of chart window objects
   CArrayObj        *m_list_wnd_del;                              // Pointer to the list of chart window objects
   CArrayObj        *m_list_ind_del;                              // Pointer to the list of indicators removed from the indicator window
   CArrayObj        *m_list_ind_param;                            // Pointer to the list of changed indicators
   long              m_long_prop[CHART_PROP_INTEGER_TOTAL];       // Integer properties
   double            m_double_prop[CHART_PROP_DOUBLE_TOTAL];      // Real properties
   string            m_string_prop[CHART_PROP_STRING_TOTAL];      // String properties
   string            m_symbol_prev;                               // Previous chart symbol
   ENUM_TIMEFRAMES   m_timeframe_prev;                            // Previous timeframe
   int               m_digits;                                    // Symbol's Digits()
   int               m_last_event;                                // The last event
   datetime          m_wnd_time_x;                                // Time for X coordinate on the windowed chart
   double            m_wnd_price_y;                               // Price for Y coordinate on the windowed chart
チャートの更新メソッドにチャートデータを入力する必要があります。また、クラスコンストラクターにも入力します。チャートオブジェクトには複数のプロパティがあります。異なるメソッドに同じタイプのコードがないようにするには、コードを別のメソッドに移動し、オブジェクトのプロパティにチャートデータを入力する必要がある場所でそのメソッドを呼び出します。privateクラスセクションで宣言します。
//--- The methods of setting property values
   bool              SetMode(const string source,const ENUM_CHART_MODE mode,const bool redraw=false);
   bool              SetScale(const string source,const int scale,const bool redraw=false);
   bool              SetModeVolume(const string source,const ENUM_CHART_VOLUME_MODE mode,const bool redraw=false);
   void              SetVisibleBars(void);
   void              SetWindowsTotal(void);
   void              SetFirstVisibleBars(void);
   void              SetWidthInBars(void);
   void              SetWidthInPixels(void);
   void              SetMaximizedFlag(void);
   void              SetMinimizedFlag(void);
   void              SetExpertName(void);
   void              SetScriptName(void);

//--- Fill in (1) integer, (2) real and (3) string object properties
   bool              SetIntegerParameters(void);
   void              SetDoubleParameters(void);
   bool              SetStringParameters(void);

//--- (1) Create, (2) check and re-create the chart window list
   void              CreateWindowsList(void);
   void              RecreateWindowsList(const int change);
//--- Add an extension to the screenshot file if it is missing
   string            FileNameWithExtention(const string filename);

public:
オブジェクトが特定のプロパティをサポートしていることを示すフラグを返すすべてのメソッドはtrueを返します。
//--- Return the indicator by index from the specified chart window
   CWndInd          *GetIndicator(const int win_num,const int ind_index);

//--- Return the flag of the object supporting this property
   virtual bool      SupportProperty(ENUM_CHART_PROP_INTEGER property)           { return true; }
   virtual bool      SupportProperty(ENUM_CHART_PROP_DOUBLE property)            { return true; }
   virtual bool      SupportProperty(ENUM_CHART_PROP_STRING property)            { return true; }

//--- Get description of (1) integer, (2) real and (3) string properties
   string            GetPropertyDescription(ENUM_CHART_PROP_INTEGER property);
   string            GetPropertyDescription(ENUM_CHART_PROP_DOUBLE property);
   string            GetPropertyDescription(ENUM_CHART_PROP_STRING property);
以前は、整数プロパティを示すフラグを返すメソッドは、プロパティがピクセル単位のチャートウィンドウフレーム間の距離である場合、falseを返していました。
親クラスのイベント機能を使用するために必要な3つのpublicメソッドを追加します。
//--- Return (1) the flag event, (2) the last event code and (3) the last event
   bool              IsEvent(void)                                   const { return this.m_is_event;                                      }
   int               GetLastEventsCode(void)                         const { return this.m_event_code;                                    }
   int               GetLastEvent(void)                              const { return this.m_last_event;                                    }

//--- Constructors
                     CChartObj(){;}
                     CChartObj(const long chart_id,CArrayObj *list_wnd_del,CArrayObj *list_ind_del,CArrayObj *list_ind_param);
//+------------------------------------------------------------------+
オブジェクトプロパティへの簡単なアクセスのためのメソッドのブロックに、チャートウィンドウがフォアグラウンドにあることを示すフラグを返すメソッドを追加します。
//--- (1) Return, (2) enable, (3) disable docking the chart window
   bool              IsDocked(void)                                  const { return (bool)this.GetProperty(CHART_PROP_IS_DOCKED);         }
   bool              SetDockedON(const bool redraw=false)                  { return this.SetDockedFlag(DFUN,true,redraw); }
   bool              SetDockedOFF(const bool redraw=false)                 { return this.SetDockedFlag(DFUN,false,redraw); }

//--- (1) Return, (2) enable and (3) disable the display of the chart above all others
   bool              IsBringTop(void)                                      { return (bool)this.GetProperty(CHART_PROP_BRING_TO_TOP);      }
   bool              SetBringToTopON(const bool redraw=false)              { return this.SetBringToTopFlag(DFUN,true,redraw);             }
   bool              SetBringToTopOFF(const bool redraw=false)             { return this.SetBringToTopFlag(DFUN,false,redraw);            }

//--- (1) Return, set the chart type (2) bars, (3) candles, (4) line
   ENUM_CHART_MODE   Mode(void)                                      const { return (ENUM_CHART_MODE)this.GetProperty(CHART_PROP_MODE);   }
   bool              SetModeBars(const bool redraw=false)                  { return this.SetMode(DFUN,CHART_BARS,redraw);                 }
   bool              SetModeCandles(const bool redraw=false)               { return this.SetMode(DFUN,CHART_CANDLES,redraw);              }
   bool              SetModeLine(const bool redraw=false)                  { return this.SetMode(DFUN,CHART_LINE,redraw);                 }
このメソッドは、CHART_BRING_TO_TOPフラグを返します。
ヘルプでは、このプロパティは「書き込み専用」(w/o)としてマークされていますが、例はステータスの読み取りを許可せずに必要なチャートをアクティブに設定できることを示しています。ただし、実際には、このプロパティを読み取ることで、現在アクティブなチャートを見つけることもできます。これはヘルプの間違いであるか、文書化されていない機能(非常に望ましくない)ですが、実際に機能します。(ヘルプに従って)チャートプロパティを読み取ることが突然できなくなった場合、現在アクティブなチャートをすばやく取得することはより困難になります。カスタムソリューションが必要になります。
クラスリストの最後に、親クラスのオブジェクト監視プロパティの追跡値を設定するためのメソッドを記述します。
すべてのプロパティ(整数と実数の両方)を記述します。ただし、すべてにステータス制御メソッドがあるわけではありません。一部のオブジェクトプロパティを実際に制御する必要があるかどうかを検討します。とにかく、すべてのプロパティはコメントで設定され、いつでも新しいプロパティを追加できます。
//+------------------------------------------------------------------+ //| Get and set the parameters of tracked property changes | //+------------------------------------------------------------------+ //CHART_PROP_ID = 0, // Chart ID //--- Chart timeframe //--- setting the chart timeframe (1) increase, (2) decrease controlled value and (3) reference level //--- getting (4) the chart timeframe change value, //--- getting the chart timeframe change flag increasing the (5) growth and (6) decrease values void SetControlTimeframeInc(const long value) { this.SetControlledValueINC(CHART_PROP_TIMEFRAME,(long)::fabs(value)); } void SetControlTimeframeDec(const long value) { this.SetControlledValueDEC(CHART_PROP_TIMEFRAME,(long)::fabs(value)); } void SetControlTimeframeLevel(const long value) { this.SetControlledValueLEVEL(CHART_PROP_TIMEFRAME,(long)::fabs(value)); } long GetValueChangedTimeframe(void) const { return this.GetPropLongChangedValue(CHART_PROP_TIMEFRAME); } bool IsIncreasedTimeframe(void) const { return (bool)this.GetPropLongFlagINC(CHART_PROP_TIMEFRAME); } bool IsDecreasedTimeframe(void) const { return (bool)this.GetPropLongFlagDEC(CHART_PROP_TIMEFRAME); } //CHART_PROP_SHOW // Price chart drawing //CHART_PROP_IS_OBJECT, // Chart object (OBJ_CHART) identification attribute //CHART_PROP_BRING_TO_TOP, // Show the chart above all others //CHART_PROP_CONTEXT_MENU, // Enable/disable access to the context menu using the right click //CHART_PROP_CROSSHAIR_TOOL, // Enable/disable access to the Crosshair tool using the middle click //CHART_PROP_MOUSE_SCROLL, // Scroll the chart horizontally using the left mouse button //CHART_PROP_EVENT_MOUSE_WHEEL, // Send messages about mouse wheel events (CHARTEVENT_MOUSE_WHEEL) to all MQL5 programs on a chart //CHART_PROP_EVENT_MOUSE_MOVE, // Send messages about mouse button click and movement events (CHARTEVENT_MOUSE_MOVE) to all MQL5 programs on a chart //CHART_PROP_EVENT_OBJECT_CREATE, // Send messages about the graphical object creation event (CHARTEVENT_OBJECT_CREATE) to all MQL5 programs on a chart //CHART_PROP_EVENT_OBJECT_DELETE, // Send messages about the graphical object destruction event (CHARTEVENT_OBJECT_DELETE) to all MQL5 programs on a chart //--- Type of the chart (candlesticks, bars or line (ENUM_CHART_MODE)) //--- setting the chart timeframe (1) increase, (2) decrease controlled value and (3) reference level //--- getting (4) the chart timeframe change value, //--- getting the chart timeframe change flag increasing the (5) growth and (6) decrease values void SetControlChartModeInc(const long value) { this.SetControlledValueINC(CHART_PROP_MODE,(long)::fabs(value)); } void SetControlChartModeDec(const long value) { this.SetControlledValueDEC(CHART_PROP_MODE,(long)::fabs(value)); } void SetControlChartModeLevel(const long value) { this.SetControlledValueLEVEL(CHART_PROP_MODE,(long)::fabs(value)); } long GetValueChangedChartMode(void) const { return this.GetPropLongChangedValue(CHART_PROP_MODE); } bool IsIncreasedChartMode(void) const { return (bool)this.GetPropLongFlagINC(CHART_PROP_MODE); } bool IsDecreasedChartMode(void) const { return (bool)this.GetPropLongFlagDEC(CHART_PROP_MODE); } //CHART_PROP_FOREGROUND, // Price chart in the foreground //CHART_PROP_SHIFT, // Mode of shift of the price chart from the right border //CHART_PROP_AUTOSCROLL, // The mode of automatic shift to the right border of the chart //CHART_PROP_KEYBOARD_CONTROL, // Allow managing the chart using a keyboard //CHART_PROP_QUICK_NAVIGATION, // Allow the chart to intercept Space and Enter key strokes to activate the quick navigation bar //CHART_PROP_SCALE, // Scale //CHART_PROP_SCALEFIX, // Fixed scale mode //CHART_PROP_SCALEFIX_11, // 1:1 scale mode //CHART_PROP_SCALE_PT_PER_BAR, // The mode of specifying the scale in points per bar //CHART_PROP_SHOW_TICKER, // Display a symbol ticker in the upper left corner //CHART_PROP_SHOW_OHLC, // Display OHLC values in the upper left corner //CHART_PROP_SHOW_BID_LINE, // Display Bid value as a horizontal line on the chart //CHART_PROP_SHOW_ASK_LINE, // Display Ask value as a horizontal line on a chart //CHART_PROP_SHOW_LAST_LINE, // Display Last value as a horizontal line on a chart //CHART_PROP_SHOW_PERIOD_SEP, // Display vertical separators between adjacent periods //CHART_PROP_SHOW_GRID, // Display a grid on the chart //CHART_PROP_SHOW_VOLUMES, // Display volumes on a chart //CHART_PROP_SHOW_OBJECT_DESCR, // Display text descriptions of objects //CHART_PROP_VISIBLE_BARS, // Number of bars on a chart that are available for display //CHART_PROP_WINDOWS_TOTAL, // The total number of chart windows including indicator subwindows //CHART_PROP_WINDOW_HANDLE, // Chart window handle //CHART_PROP_WINDOW_YDISTANCE ////--- Distance in Y axis pixels between the upper frame of the indicator subwindow and the upper frame of the chart main window ////--- set the controlled (1) growth, (2) decrease, (3) reference distance level in pixels by the vertical Y axis between the window frames ////--- get (4) the distance change in pixels by the vertical Y axis between the window frames, ////--- get the distance change flag in pixels by the vertical Y axis between the window frames exceeding the (5) growth and (6) decrease values // void SetControlWindowYDistanceInc(const long value) { this.SetControlledValueINC(CHART_PROP_WINDOW_YDISTANCE,(long)::fabs(value)); } // void SetControlWindowYDistanceDec(const long value) { this.SetControlledValueDEC(CHART_PROP_WINDOW_YDISTANCE,(long)::fabs(value)); } // void SetControlWindowYDistanceLevel(const long value) { this.SetControlledValueLEVEL(CHART_PROP_WINDOW_YDISTANCE,(long)::fabs(value)); } // long GetValueChangedWindowYDistance(void) const { return this.GetPropLongChangedValue(CHART_PROP_WINDOW_YDISTANCE); } // bool IsIncreasedWindowYDistance(void) const { return (bool)this.GetPropLongFlagINC(CHART_PROP_WINDOW_YDISTANCE); } // bool IsDecreasedWindowYDistance(void) const { return (bool)this.GetPropLongFlagDEC(CHART_PROP_WINDOW_YDISTANCE); } //CHART_PROP_FIRST_VISIBLE_BAR, // Number of the first visible bar on the chart //--- Width of the chart in bars //--- setting the controlled spread (1) increase, (2) decrease value and (3) reference chart width in bars //--- getting (4) the chart width change value in bars, //--- get the flag of the chart width change in bars exceeding (5) the growth and (6) decrease values void SetControlWidthInBarsInc(const long value) { this.SetControlledValueINC(CHART_PROP_WIDTH_IN_BARS,(long)::fabs(value)); } void SetControlWidthInBarsDec(const long value) { this.SetControlledValueDEC(CHART_PROP_WIDTH_IN_BARS,(long)::fabs(value)); } void SetControlWidthInBarsLevel(const long value) { this.SetControlledValueLEVEL(CHART_PROP_WIDTH_IN_BARS,(long)::fabs(value)); } long GetValueChangedWidthInBars(void) const { return this.GetPropLongChangedValue(CHART_PROP_WIDTH_IN_BARS); } bool IsIncreasedWidthInBars(void) const { return (bool)this.GetPropLongFlagINC(CHART_PROP_WIDTH_IN_BARS); } bool IsDecreasedWidthInBars(void) const { return (bool)this.GetPropLongFlagDEC(CHART_PROP_WIDTH_IN_BARS); } //--- Chart width in pixels //--- setting the controlled spread (1) increase, (2) decrease value and (3) reference chart width in pixels //--- getting (4) the chart width change value in pixels, //--- get the flag of the chart width change in pixels exceeding (5) the growth and (6) decrease values void SetControlWidthInPixelsInc(const long value) { this.SetControlledValueINC(CHART_PROP_WIDTH_IN_PIXELS,(long)::fabs(value)); } void SetControlWidthInPixelsDec(const long value) { this.SetControlledValueDEC(CHART_PROP_WIDTH_IN_PIXELS,(long)::fabs(value)); } void SetControlWidthInPixelsLevel(const long value) { this.SetControlledValueLEVEL(CHART_PROP_WIDTH_IN_PIXELS,(long)::fabs(value)); } long GetValueChangedWidthInPixels(void) const { return this.GetPropLongChangedValue(CHART_PROP_WIDTH_IN_PIXELS); } bool IsIncreasedWidthInPixels(void) const { return (bool)this.GetPropLongFlagINC(CHART_PROP_WIDTH_IN_PIXELS); } bool IsDecreasedWidthInPixels(void) const { return (bool)this.GetPropLongFlagDEC(CHART_PROP_WIDTH_IN_PIXELS); } //--- Chart height in pixels //--- setting the controlled spread (1) increase, (2) decrease value and (3) reference chart height in pixels //--- get (4) the chart height change in pixels, //--- get the flag of the chart height change in pixels exceeding (5) the growth and (6) decrease values void SetControlHeightInPixelsInc(const long value) { this.SetControlledValueINC(CHART_PROP_HEIGHT_IN_PIXELS,(long)::fabs(value)); } void SetControlHeightInPixelsDec(const long value) { this.SetControlledValueDEC(CHART_PROP_HEIGHT_IN_PIXELS,(long)::fabs(value)); } void SetControlHeightInPixelsLevel(const long value) { this.SetControlledValueLEVEL(CHART_PROP_HEIGHT_IN_PIXELS,(long)::fabs(value)); } long GetValueChangedHeightInPixels(void) const { return this.GetPropLongChangedValue(CHART_PROP_HEIGHT_IN_PIXELS); } bool IsIncreasedHeightInPixels(void) const { return (bool)this.GetPropLongFlagINC(CHART_PROP_HEIGHT_IN_PIXELS); } bool IsDecreasedHeightInPixels(void) const { return (bool)this.GetPropLongFlagDEC(CHART_PROP_HEIGHT_IN_PIXELS); } //CHART_PROP_COLOR_BACKGROUND, // Chart background color //CHART_PROP_COLOR_FOREGROUND, // Color of axes, scale and OHLC line //CHART_PROP_COLOR_GRID, // Grid color //CHART_PROP_COLOR_VOLUME, // Color of volumes and position opening levels //CHART_PROP_COLOR_CHART_UP, // Color for the up bar, shadows and body borders of bull candlesticks //CHART_PROP_COLOR_CHART_DOWN, // Color of down bar, its shadow and border of body of the bullish candlestick //CHART_PROP_COLOR_CHART_LINE, // Color of the chart line and the Doji candlesticks //CHART_PROP_COLOR_CANDLE_BULL, // Bullish candlestick body color //CHART_PROP_COLOR_CANDLE_BEAR, // Bearish candlestick body color //CHART_PROP_COLOR_BID, // Color of the Bid price line //CHART_PROP_COLOR_ASK, // Color of the Ask price line //CHART_PROP_COLOR_LAST, // Color of the last performed deal's price line (Last) //CHART_PROP_COLOR_STOP_LEVEL, // Color of stop order levels (Stop Loss and Take Profit) //CHART_PROP_SHOW_TRADE_LEVELS, // Display trade levels on the chart (levels of open positions, Stop Loss, Take Profit and pending orders) //CHART_PROP_DRAG_TRADE_LEVELS, // Enable the ability to drag trading levels on a chart using mouse //CHART_PROP_SHOW_DATE_SCALE, // Display the time scale on a chart //CHART_PROP_SHOW_PRICE_SCALE, // Display a price scale on a chart //CHART_PROP_SHOW_ONE_CLICK, // Display the quick trading panel on the chart //CHART_PROP_IS_MAXIMIZED, // Chart window maximized //CHART_PROP_IS_MINIMIZED, // Chart window minimized //CHART_PROP_IS_DOCKED, // Chart window docked //--- The left coordinate of the undocked chart window relative to the virtual screen //--- setting the controlled spread (1) increase, (2) decrease value and (3) reference level of the left coordinate of the undocked chart relative to the virtual screen //--- getting (4) the change value of the left coordinate of the undocked chart relative to the virtual screen, //--- getting the flag of changing the left coordinate of the undocked chart relative to the virtual screen exceeding the (5) increase and (6) decrease values void SetControlFloatLeftInc(const long value) { this.SetControlledValueINC(CHART_PROP_FLOAT_LEFT,(long)::fabs(value)); } void SetControlFloatLeftDec(const long value) { this.SetControlledValueDEC(CHART_PROP_FLOAT_LEFT,(long)::fabs(value)); } void SetControlFloatLeftLevel(const long value) { this.SetControlledValueLEVEL(CHART_PROP_FLOAT_LEFT,(long)::fabs(value)); } long GetValueChangedFloatLeft(void) const { return this.GetPropLongChangedValue(CHART_PROP_FLOAT_LEFT); } bool IsIncreasedFloatLeft(void) const { return (bool)this.GetPropLongFlagINC(CHART_PROP_FLOAT_LEFT); } bool IsDecreasedFloatLeft(void) const { return (bool)this.GetPropLongFlagDEC(CHART_PROP_FLOAT_LEFT); } //--- Upper coordinate of the undocked chart window relative to the virtual screen //--- setting the controlled spread (1) increase, (2) decrease value and (3) reference level of the upper coordinate of the undocked chart relative to the virtual screen //--- getting (4) the change value of the upper coordinate of the undocked chart relative to the virtual screen, //--- getting the flag of changing the upper coordinate of the undocked chart relative to the virtual screen exceeding the (5) increase and (6) decrease values void SetControlFloatTopInc(const long value) { this.SetControlledValueINC(CHART_PROP_FLOAT_TOP,(long)::fabs(value)); } void SetControlFloatTopDec(const long value) { this.SetControlledValueDEC(CHART_PROP_FLOAT_TOP,(long)::fabs(value)); } void SetControlFloatTopLevel(const long value) { this.SetControlledValueLEVEL(CHART_PROP_FLOAT_TOP,(long)::fabs(value)); } long GetValueChangedFloatTop(void) const { return this.GetPropLongChangedValue(CHART_PROP_FLOAT_TOP); } bool IsIncreasedFloatTop(void) const { return (bool)this.GetPropLongFlagINC(CHART_PROP_FLOAT_TOP); } bool IsDecreasedFloatTop(void) const { return (bool)this.GetPropLongFlagDEC(CHART_PROP_FLOAT_TOP); } //--- The right coordinate of the undocked chart window relative to the virtual screen //--- setting the controlled spread (1) increase, (2) decrease value and (3) reference level of the right coordinate of the undocked chart relative to the virtual screen //--- getting (4) the change value of the right coordinate of the undocked chart relative to the virtual screen, //--- getting the flag of changing the right coordinate of the undocked chart relative to the virtual screen exceeding the (5) increase and (6) decrease values void SetControlFloatRightInc(const long value) { this.SetControlledValueINC(CHART_PROP_FLOAT_RIGHT,(long)::fabs(value)); } void SetControlFloatRightDec(const long value) { this.SetControlledValueDEC(CHART_PROP_FLOAT_RIGHT,(long)::fabs(value)); } void SetControlFloatRightLevel(const long value) { this.SetControlledValueLEVEL(CHART_PROP_FLOAT_RIGHT,(long)::fabs(value)); } long GetValueChangedFloatRight(void) const { return this.GetPropLongChangedValue(CHART_PROP_FLOAT_RIGHT); } bool IsIncreasedFloatRight(void) const { return (bool)this.GetPropLongFlagINC(CHART_PROP_FLOAT_RIGHT); } bool IsDecreasedFloatRight(void) const { return (bool)this.GetPropLongFlagDEC(CHART_PROP_FLOAT_RIGHT); } //--- The bottom coordinate of the undocked chart window relative to the virtual screen //--- setting the controlled spread (1) increase, (2) decrease value and (3) reference level of the lower coordinate of the undocked chart relative to the virtual screen //--- getting (4) the change value of the lower coordinate of the undocked chart relative to the virtual screen, //--- getting the flag of changing the lower coordinate of the undocked chart relative to the virtual screen exceeding the (5) increase and (6) decrease values void SetControlFloatBottomInc(const long value) { this.SetControlledValueINC(CHART_PROP_FLOAT_BOTTOM,(long)::fabs(value)); } void SetControlFloatBottomDec(const long value) { this.SetControlledValueDEC(CHART_PROP_FLOAT_BOTTOM,(long)::fabs(value)); } void SetControlFloatBottomLevel(const long value) { this.SetControlledValueLEVEL(CHART_PROP_FLOAT_BOTTOM,(long)::fabs(value)); } long GetValueChangedFloatBottom(void) const { return this.GetPropLongChangedValue(CHART_PROP_FLOAT_BOTTOM); } bool IsIncreasedFloatBottom(void) const { return (bool)this.GetPropLongFlagINC(CHART_PROP_FLOAT_BOTTOM); } bool IsDecreasedFloatBottom(void) const { return (bool)this.GetPropLongFlagDEC(CHART_PROP_FLOAT_BOTTOM); } //--- Shift size of the zero bar from the right border in % //--- setting (1) increase, (2) decrease and (3) reference level of the shift size of the zero bar from the right border in % //--- getting (4) the change value of the shift of the zero bar from the right border in %, //--- getting the flag of the change value of the shift of the zero bar from the right border in % exceeding (5) the growth and (6) decrease values void SetControlShiftSizeInc(const long value) { this.SetControlledValueINC(CHART_PROP_SHIFT_SIZE,(long)::fabs(value)); } void SetControlShiftSizeDec(const long value) { this.SetControlledValueDEC(CHART_PROP_SHIFT_SIZE,(long)::fabs(value)); } void SetControlShiftSizeLevel(const long value) { this.SetControlledValueLEVEL(CHART_PROP_SHIFT_SIZE,(long)::fabs(value)); } double GetValueChangedShiftSize(void) const { return this.GetPropDoubleChangedValue(CHART_PROP_SHIFT_SIZE); } bool IsIncreasedShiftSize(void) const { return (bool)this.GetPropLongFlagINC(CHART_PROP_SHIFT_SIZE); } bool IsDecreasedShiftSize(void) const { return (bool)this.GetPropLongFlagDEC(CHART_PROP_SHIFT_SIZE); } //--- Chart fixed position from the left border in % //--- setting (1) increase, (2) decrease and (3) reference level of the chart fixed position from the left border in % //--- getting (4) the change value of the chart fixed position from the left border in %, //--- getting the flag of changing the chart fixed position from the left border in % more than by the (5) increase and (6) decrease values void SetControlFixedPositionInc(const long value) { this.SetControlledValueINC(CHART_PROP_FIXED_POSITION,(long)::fabs(value)); } void SetControlFixedPositionDec(const long value) { this.SetControlledValueDEC(CHART_PROP_FIXED_POSITION,(long)::fabs(value)); } void SetControlFixedPositionLevel(const long value) { this.SetControlledValueLEVEL(CHART_PROP_FIXED_POSITION,(long)::fabs(value)); } double GetValueChangedFixedPosition(void) const { return this.GetPropDoubleChangedValue(CHART_PROP_FIXED_POSITION); } bool IsIncreasedFixedPosition(void) const { return (bool)this.GetPropLongFlagINC(CHART_PROP_FIXED_POSITION); } bool IsDecreasedFixedPosition(void) const { return (bool)this.GetPropLongFlagDEC(CHART_PROP_FIXED_POSITION); } //--- Fixed chart maximum //--- setting the fixed chart maximum (1) increase, (2) decrease controlled value and (3) reference level //--- getting (4) the change value of the fixed chart maximum, //--- getting the flag of changing the position of the fixed chart maximum by more than (5) increase and (6) decrease values void SetControlFixedMaxInc(const long value) { this.SetControlledValueINC(CHART_PROP_FIXED_MAX,(long)::fabs(value)); } void SetControlFixedMaxDec(const long value) { this.SetControlledValueDEC(CHART_PROP_FIXED_MAX,(long)::fabs(value)); } void SetControlFixedMaxLevel(const long value) { this.SetControlledValueLEVEL(CHART_PROP_FIXED_MAX,(long)::fabs(value)); } double GetValueChangedFixedMax(void) const { return this.GetPropDoubleChangedValue(CHART_PROP_FIXED_MAX); } bool IsIncreasedFixedMax(void) const { return (bool)this.GetPropLongFlagINC(CHART_PROP_FIXED_MAX); } bool IsDecreasedFixedMax(void) const { return (bool)this.GetPropLongFlagDEC(CHART_PROP_FIXED_MAX); } //--- Fixed chart minimum //--- setting the fixed chart minimum (1) increase, (2) decrease controlled value and (3) reference level //--- getting (4) the change value of the fixed chart minimum, //--- getting the flag of changing the position of the fixed chart minimum by more than (5) increase and (6) decrease values void SetControlFixedMinInc(const long value) { this.SetControlledValueINC(CHART_PROP_FIXED_MIN,(long)::fabs(value)); } void SetControlFixedMinDec(const long value) { this.SetControlledValueDEC(CHART_PROP_FIXED_MIN,(long)::fabs(value)); } void SetControlFixedMinLevel(const long value) { this.SetControlledValueLEVEL(CHART_PROP_FIXED_MIN,(long)::fabs(value)); } double GetValueChangedFixedMin(void) const { return this.GetPropDoubleChangedValue(CHART_PROP_FIXED_MIN); } bool IsIncreasedFixedMin(void) const { return (bool)this.GetPropLongFlagINC(CHART_PROP_FIXED_MIN); } bool IsDecreasedFixedMin(void) const { return (bool)this.GetPropLongFlagDEC(CHART_PROP_FIXED_MIN); } //CHART_PROP_POINTS_PER_BAR, // Scale in points per bar //--- Chart minimum //--- setting the chart minimum (1) increase, (2) decrease controlled value and (3) reference level //--- getting (4) the change value of the chart minimum, //--- getting the flag of changing the position of the chart minimum by more than (5) increase and (6) decrease values void SetControlPriceMinInc(const long value) { this.SetControlledValueINC(CHART_PROP_PRICE_MIN,(long)::fabs(value)); } void SetControlPriceMinDec(const long value) { this.SetControlledValueDEC(CHART_PROP_PRICE_MIN,(long)::fabs(value)); } void SetControlPriceMinLevel(const long value) { this.SetControlledValueLEVEL(CHART_PROP_PRICE_MIN,(long)::fabs(value)); } double GetValueChangedPriceMin(void) const { return this.GetPropDoubleChangedValue(CHART_PROP_PRICE_MIN); } bool IsIncreasedPriceMin(void) const { return (bool)this.GetPropLongFlagINC(CHART_PROP_PRICE_MIN); } bool IsDecreasedPriceMin(void) const { return (bool)this.GetPropLongFlagDEC(CHART_PROP_PRICE_MIN); } //--- Chart maximum //--- setting the chart maximum (1) increase, (2) decrease controlled value and (3) reference level //--- getting (4) the change value of the chart maximum, //--- getting the flag of changing the position of the chart maximum by more than (5) increase and (6) decrease values void SetControlPriceMaxInc(const long value) { this.SetControlledValueINC(CHART_PROP_PRICE_MAX,(long)::fabs(value)); } void SetControlPriceMaxDec(const long value) { this.SetControlledValueDEC(CHART_PROP_PRICE_MAX,(long)::fabs(value)); } void SetControlPriceMaxLevel(const long value) { this.SetControlledValueLEVEL(CHART_PROP_PRICE_MAX,(long)::fabs(value)); } double GetValueChangedPriceMax(void) const { return this.GetPropDoubleChangedValue(CHART_PROP_PRICE_MAX); } bool IsIncreasedPriceMax(void) const { return (bool)this.GetPropLongFlagINC(CHART_PROP_PRICE_MAX); } bool IsDecreasedPriceMax(void) const { return (bool)this.GetPropLongFlagDEC(CHART_PROP_PRICE_MAX); } }; //+------------------------------------------------------------------+
このメソッドを使用すると、値を制御する必要があるオブジェクトプロパティをすばやく設定でき、プロパティ値が増加/減少して制御された値を超えたときにイベントが制御プログラムチャートに送信されます。
クラスコンストラクタは、以前に検討されたチャートウィンドウオブジェクトクラスと同じ方法で変更されました。
//+------------------------------------------------------------------+
//| Parametric constructor                                           |
//+------------------------------------------------------------------+
CChartObj::CChartObj(const long chart_id,CArrayObj *list_wnd_del,CArrayObj *list_ind_del,CArrayObj *list_ind_param) : m_wnd_time_x(0),m_wnd_price_y(0)
  {
   this.m_list_wnd_del=list_wnd_del;
   this.m_list_ind_del=list_ind_del;
   this.m_list_ind_param=list_ind_param;
//--- Set the chart ID to the base object and set the chart object ID
   CBaseObj::SetChartID(chart_id);
   this.m_type=COLLECTION_CHARTS_ID;

//--- Initialize base object data arrays
   this.SetControlDataArraySizeLong(CHART_PROP_INTEGER_TOTAL);
   this.SetControlDataArraySizeDouble(CHART_PROP_DOUBLE_TOTAL);
   this.ResetChangesParams();
   this.ResetControlsParams();

//--- Chart ID
   this.SetProperty(CHART_PROP_ID,chart_id);
//--- Set integer properties
   this.SetIntegerParameters();
//--- Set real properties
   this.SetDoubleParameters();
//--- Set string properties
   this.SetStringParameters();
//--- Initialize variables and lists
   this.m_digits=(int)::SymbolInfoInteger(this.Symbol(),SYMBOL_DIGITS);
   this.m_list_wnd_del.Sort(SORT_BY_CHART_WINDOW_NUM);
   this.CreateWindowsList();
   this.m_symbol_prev=this.Symbol();
   this.m_timeframe_prev=this.Timeframe();
   this.m_name=this.Header();

//--- Fill in the current chart data
   for(int i=0;i<CHART_PROP_INTEGER_TOTAL;i++)
      this.m_long_prop_event[i][3]=this.m_long_prop[i];
   for(int i=0;i<CHART_PROP_DOUBLE_TOTAL;i++)
      this.m_double_prop_event[i][3]=this.m_double_prop[i];

//--- Update the base object data and search for changes
   CBaseObjExt::Refresh();
  }
//+------------------------------------------------------------------+
ここで、チャートのパラメータ値は、次の3つの特別なメソッドを使用してオブジェクトプロパティに設定されます。
以下は、オブジェクトの整数プロパティを入力するメソッドです。
//+------------------------------------------------------------------+
//| Fill in integer object properties                                |
//+------------------------------------------------------------------+
bool CChartObj::SetIntegerParameters(void)
  {
   ENUM_TIMEFRAMES timeframe=::ChartPeriod(this.ID());
   if(timeframe==0)
      return false;
   this.SetProperty(CHART_PROP_TIMEFRAME,timeframe);                                                     // Chart timeframe
   this.SetProperty(CHART_PROP_SHOW,::ChartGetInteger(this.ID(),CHART_SHOW));                            // Price chart drawing attribute
   this.SetProperty(CHART_PROP_IS_OBJECT,::ChartGetInteger(this.ID(),CHART_IS_OBJECT));                  // Chart object identification attribute
   this.SetProperty(CHART_PROP_BRING_TO_TOP,::ChartGetInteger(this.ID(),CHART_BRING_TO_TOP));            // Show the chart above all others
   this.SetProperty(CHART_PROP_CONTEXT_MENU,::ChartGetInteger(this.ID(),CHART_CONTEXT_MENU));            // Access to the context menu using the right click
   this.SetProperty(CHART_PROP_CROSSHAIR_TOOL,::ChartGetInteger(this.ID(),CHART_CROSSHAIR_TOOL));        // Access the Crosshair tool by pressing the middle mouse button
   this.SetProperty(CHART_PROP_MOUSE_SCROLL,::ChartGetInteger(this.ID(),CHART_MOUSE_SCROLL));            // Scroll the chart horizontally using the left mouse button
   this.SetProperty(CHART_PROP_EVENT_MOUSE_WHEEL,::ChartGetInteger(this.ID(),CHART_EVENT_MOUSE_WHEEL));  // Send messages about mouse wheel events to all MQL5 programs on a chart
   this.SetProperty(CHART_PROP_EVENT_MOUSE_MOVE,::ChartGetInteger(this.ID(),CHART_EVENT_MOUSE_MOVE));    // Send messages about mouse button click and movement events to all MQL5 programs on a chart
   this.SetProperty(CHART_PROP_EVENT_OBJECT_CREATE,::ChartGetInteger(this.ID(),CHART_EVENT_OBJECT_CREATE)); // Send messages about the graphical object creation event to all MQL5 programs on a chart
   this.SetProperty(CHART_PROP_EVENT_OBJECT_DELETE,::ChartGetInteger(this.ID(),CHART_EVENT_OBJECT_DELETE)); // Send messages about the graphical object destruction event to all MQL5 programs on a chart
   this.SetProperty(CHART_PROP_MODE,::ChartGetInteger(this.ID(),CHART_MODE));                            // Type of the chart (candlesticks, bars or line)
   this.SetProperty(CHART_PROP_FOREGROUND,::ChartGetInteger(this.ID(),CHART_FOREGROUND));                // Price chart in the foreground
   this.SetProperty(CHART_PROP_SHIFT,::ChartGetInteger(this.ID(),CHART_SHIFT));                          // Mode of shift of the price chart from the right border
   this.SetProperty(CHART_PROP_AUTOSCROLL,::ChartGetInteger(this.ID(),CHART_AUTOSCROLL));                // The mode of automatic shift to the right border of the chart
   this.SetProperty(CHART_PROP_KEYBOARD_CONTROL,::ChartGetInteger(this.ID(),CHART_KEYBOARD_CONTROL));    // Allow managing the chart using a keyboard
   this.SetProperty(CHART_PROP_QUICK_NAVIGATION,::ChartGetInteger(this.ID(),CHART_QUICK_NAVIGATION));    // Allow the chart to intercept Space and Enter key strokes to activate the quick navigation bar
   this.SetProperty(CHART_PROP_SCALE,::ChartGetInteger(this.ID(),CHART_SCALE));                          // Scale
   this.SetProperty(CHART_PROP_SCALEFIX,::ChartGetInteger(this.ID(),CHART_SCALEFIX));                    // Fixed scale mode
   this.SetProperty(CHART_PROP_SCALEFIX_11,::ChartGetInteger(this.ID(),CHART_SCALEFIX_11));              // 1:1 scale mode
   this.SetProperty(CHART_PROP_SCALE_PT_PER_BAR,::ChartGetInteger(this.ID(),CHART_SCALE_PT_PER_BAR));    // Mode for specifying the scale in points per bar
   this.SetProperty(CHART_PROP_SHOW_TICKER,::ChartGetInteger(this.ID(),CHART_SHOW_TICKER));              // Display a symbol ticker in the upper left corner
   this.SetProperty(CHART_PROP_SHOW_OHLC,::ChartGetInteger(this.ID(),CHART_SHOW_OHLC));                  // Display OHLC values in the upper left corner
   this.SetProperty(CHART_PROP_SHOW_BID_LINE,::ChartGetInteger(this.ID(),CHART_SHOW_BID_LINE));          // Display Bid value as a horizontal line on the chart
   this.SetProperty(CHART_PROP_SHOW_ASK_LINE,::ChartGetInteger(this.ID(),CHART_SHOW_ASK_LINE));          // Display Ask value as a horizontal line on the chart
   this.SetProperty(CHART_PROP_SHOW_LAST_LINE,::ChartGetInteger(this.ID(),CHART_SHOW_LAST_LINE));        // Display Last value as a horizontal line on the chart
   this.SetProperty(CHART_PROP_SHOW_PERIOD_SEP,::ChartGetInteger(this.ID(),CHART_SHOW_PERIOD_SEP));      // Display vertical separators between adjacent periods
   this.SetProperty(CHART_PROP_SHOW_GRID,::ChartGetInteger(this.ID(),CHART_SHOW_GRID));                  // Display the chart grid
   this.SetProperty(CHART_PROP_SHOW_VOLUMES,::ChartGetInteger(this.ID(),CHART_SHOW_VOLUMES));            // Display volumes on the chart
   this.SetProperty(CHART_PROP_SHOW_OBJECT_DESCR,::ChartGetInteger(this.ID(),CHART_SHOW_OBJECT_DESCR));  // Display text descriptions of the objects
   this.SetProperty(CHART_PROP_VISIBLE_BARS,::ChartGetInteger(this.ID(),CHART_VISIBLE_BARS));            // Number of bars on a chart that are available for display
   this.SetProperty(CHART_PROP_WINDOWS_TOTAL,::ChartGetInteger(this.ID(),CHART_WINDOWS_TOTAL));          // The total number of chart windows including indicator subwindows
   this.SetProperty(CHART_PROP_WINDOW_HANDLE,::ChartGetInteger(this.ID(),CHART_WINDOW_HANDLE));          // Chart window handle
   this.SetProperty(CHART_PROP_FIRST_VISIBLE_BAR,::ChartGetInteger(this.ID(),CHART_FIRST_VISIBLE_BAR));  // Number of the first visible bar on the chart
   this.SetProperty(CHART_PROP_WIDTH_IN_BARS,::ChartGetInteger(this.ID(),CHART_WIDTH_IN_BARS));          // Chart width in bars
   this.SetProperty(CHART_PROP_WIDTH_IN_PIXELS,::ChartGetInteger(this.ID(),CHART_WIDTH_IN_PIXELS));      // Chart width in pixels
   this.SetProperty(CHART_PROP_COLOR_BACKGROUND,::ChartGetInteger(this.ID(),CHART_COLOR_BACKGROUND));    // Chart background color
   this.SetProperty(CHART_PROP_COLOR_FOREGROUND,::ChartGetInteger(this.ID(),CHART_COLOR_FOREGROUND));    // Color of axes, scale and OHLC line
   this.SetProperty(CHART_PROP_COLOR_GRID,::ChartGetInteger(this.ID(),CHART_COLOR_GRID));                // Grid color
   this.SetProperty(CHART_PROP_COLOR_VOLUME,::ChartGetInteger(this.ID(),CHART_COLOR_VOLUME));            // Color of volumes and position opening levels
   this.SetProperty(CHART_PROP_COLOR_CHART_UP,::ChartGetInteger(this.ID(),CHART_COLOR_CHART_UP));        // Color for the up bar, shadows and body borders of bullish candlesticks
   this.SetProperty(CHART_PROP_COLOR_CHART_DOWN,::ChartGetInteger(this.ID(),CHART_COLOR_CHART_DOWN));    // Color for the down bar, shadows and body borders of bearish candlesticks
   this.SetProperty(CHART_PROP_COLOR_CHART_LINE,::ChartGetInteger(this.ID(),CHART_COLOR_CHART_LINE));    // Color of the chart line and the Doji candlesticks
   this.SetProperty(CHART_PROP_COLOR_CANDLE_BULL,::ChartGetInteger(this.ID(),CHART_COLOR_CANDLE_BULL));  // Color of the bullish candle body
   this.SetProperty(CHART_PROP_COLOR_CANDLE_BEAR,::ChartGetInteger(this.ID(),CHART_COLOR_CANDLE_BEAR));  // Color of the bearish candle body
   this.SetProperty(CHART_PROP_COLOR_BID,::ChartGetInteger(this.ID(),CHART_COLOR_BID));                  // Bid price line color
   this.SetProperty(CHART_PROP_COLOR_ASK,::ChartGetInteger(this.ID(),CHART_COLOR_ASK));                  // Ask price line color
   this.SetProperty(CHART_PROP_COLOR_LAST,::ChartGetInteger(this.ID(),CHART_COLOR_LAST));                // Color of the last performed deal's price line (Last)
   this.SetProperty(CHART_PROP_COLOR_STOP_LEVEL,::ChartGetInteger(this.ID(),CHART_COLOR_STOP_LEVEL));    // Color of stop order levels (Stop Loss and Take Profit)
   this.SetProperty(CHART_PROP_SHOW_TRADE_LEVELS,::ChartGetInteger(this.ID(),CHART_SHOW_TRADE_LEVELS));  // Display trade levels on the chart (levels of open positions, Stop Loss, Take Profit and pending orders)
   this.SetProperty(CHART_PROP_DRAG_TRADE_LEVELS,::ChartGetInteger(this.ID(),CHART_DRAG_TRADE_LEVELS));  // Enable the ability to drag trading levels on a chart using mouse
   this.SetProperty(CHART_PROP_SHOW_DATE_SCALE,::ChartGetInteger(this.ID(),CHART_SHOW_DATE_SCALE));      // Display the time scale on the chart
   this.SetProperty(CHART_PROP_SHOW_PRICE_SCALE,::ChartGetInteger(this.ID(),CHART_SHOW_PRICE_SCALE));    // Display the price scale on the chart
   this.SetProperty(CHART_PROP_SHOW_ONE_CLICK,::ChartGetInteger(this.ID(),CHART_SHOW_ONE_CLICK));        // Display the quick trading panel on the chart
   this.SetProperty(CHART_PROP_IS_MAXIMIZED,::ChartGetInteger(this.ID(),CHART_IS_MAXIMIZED));            // Chart window maximized
   this.SetProperty(CHART_PROP_IS_MINIMIZED,::ChartGetInteger(this.ID(),CHART_IS_MINIMIZED));            // Chart window minimized
   this.SetProperty(CHART_PROP_IS_DOCKED,::ChartGetInteger(this.ID(),CHART_IS_DOCKED));                  // Chart window docked
   this.SetProperty(CHART_PROP_FLOAT_LEFT,::ChartGetInteger(this.ID(),CHART_FLOAT_LEFT));                // Left coordinate of the undocked chart window relative to the virtual screen
   this.SetProperty(CHART_PROP_FLOAT_TOP,::ChartGetInteger(this.ID(),CHART_FLOAT_TOP));                  // Upper coordinate of the undocked chart window relative to the virtual screen
   this.SetProperty(CHART_PROP_FLOAT_RIGHT,::ChartGetInteger(this.ID(),CHART_FLOAT_RIGHT));              // Right coordinate of the undocked chart window relative to the virtual screen
   this.SetProperty(CHART_PROP_FLOAT_BOTTOM,::ChartGetInteger(this.ID(),CHART_FLOAT_BOTTOM));            // Bottom coordinate of the undocked chart window relative to the virtual screen
   this.SetProperty(CHART_PROP_YDISTANCE,::ChartGetInteger(this.ID(),CHART_WINDOW_YDISTANCE,0));         // Distance in Y axis pixels between the upper frame of the indicator subwindow and the upper frame of the chart main window
   this.SetProperty(CHART_PROP_HEIGHT_IN_PIXELS,::ChartGetInteger(this.ID(),CHART_HEIGHT_IN_PIXELS,0));  // Chart height in pixels
   return true;
  }
//+------------------------------------------------------------------+
以下は、オブジェクトの実数プロパティを入力するメソッドです。
//+------------------------------------------------------------------+
//| Fill in real object properties                                   |
//+------------------------------------------------------------------+
void CChartObj::SetDoubleParameters(void)
  {
   this.SetProperty(CHART_PROP_SHIFT_SIZE,::ChartGetDouble(this.ID(),CHART_SHIFT_SIZE));                 // Shift size of the zero bar from the right border in %
   this.SetProperty(CHART_PROP_FIXED_POSITION,::ChartGetDouble(this.ID(),CHART_FIXED_POSITION));         // Chart fixed position from the left border in %
   this.SetProperty(CHART_PROP_FIXED_MAX,::ChartGetDouble(this.ID(),CHART_FIXED_MAX));                   // Fixed chart maximum
   this.SetProperty(CHART_PROP_FIXED_MIN,::ChartGetDouble(this.ID(),CHART_FIXED_MIN));                   // Fixed chart minimum
   this.SetProperty(CHART_PROP_POINTS_PER_BAR,::ChartGetDouble(this.ID(),CHART_POINTS_PER_BAR));         // Scale in points per bar
   this.SetProperty(CHART_PROP_PRICE_MIN,::ChartGetDouble(this.ID(),CHART_PRICE_MIN));                   // Chart minimum
   this.SetProperty(CHART_PROP_PRICE_MAX,::ChartGetDouble(this.ID(),CHART_PRICE_MAX));                   // Chart maximum
  }
//+------------------------------------------------------------------+
以下は、オブジェクトの文字列プロパティを入力するメソッドです。
//+------------------------------------------------------------------+
//| Fill in string object properties                                 |
//+------------------------------------------------------------------+
bool CChartObj::SetStringParameters(void)
  {
   string symbol=::ChartSymbol(this.ID());
   if(symbol==NULL)
      return false;
   this.SetProperty(CHART_PROP_SYMBOL,symbol);                                                           // Chart symbol
   this.SetProperty(CHART_PROP_COMMENT,::ChartGetString(this.ID(),CHART_COMMENT));                       // Comment text on the chart
   this.SetProperty(CHART_PROP_EXPERT_NAME,::ChartGetString(this.ID(),CHART_EXPERT_NAME));               // name of an EA launched on the chart
   this.SetProperty(CHART_PROP_SCRIPT_NAME,::ChartGetString(this.ID(),CHART_SCRIPT_NAME));               // name of a script launched on the chart
   return true;
  }
//+------------------------------------------------------------------+
メソッド内で、ChartPeriod()とChartSymbol()関数を使用してチャートIDによってチャートの期間と銘柄を取得するため、整数プロパティと文字列プロパティを入力するメソッドはbool値を返します。これらの関数は、ゼロまたは空の文字列を返すことができます。この場合、メソッドはfalseを返します。
オブジェクトの整数プロパティの説明を返すメソッド(つまり、ウィンドウフレーム間の距離とチャートの高さ(ピクセル単位)を返すコードブロック内)で、オブジェクトではなくプロパティをチャートから直接返します。
      property==CHART_PROP_WINDOW_HANDLE  ?  CMessage::Text(MSG_CHART_OBJ_WINDOW_HANDLE)+
         (!this.SupportProperty(property) ?  ": "+CMessage::Text(MSG_LIB_PROP_NOT_SUPPORTED) :
          ": "+(string)this.GetProperty(property)
         )  :
      property==CHART_PROP_YDISTANCE  ?  CMessage::Text(MSG_CHART_OBJ_WINDOW_YDISTANCE)+
         (!this.SupportProperty(property) ?  ": "+CMessage::Text(MSG_LIB_PROP_NOT_SUPPORTED) :
          ": "+(string)::ChartGetInteger(this.m_chart_id,CHART_WINDOW_YDISTANCE,0)
         )  :
      property==CHART_PROP_FIRST_VISIBLE_BAR ?  CMessage::Text(MSG_CHART_OBJ_FIRST_VISIBLE_BAR)+
         (!this.SupportProperty(property) ?  ": "+CMessage::Text(MSG_LIB_PROP_NOT_SUPPORTED) :
          ": "+(string)this.GetProperty(property)
         )  :
      property==CHART_PROP_WIDTH_IN_BARS  ?  CMessage::Text(MSG_CHART_OBJ_WIDTH_IN_BARS)+
         (!this.SupportProperty(property) ?  ": "+CMessage::Text(MSG_LIB_PROP_NOT_SUPPORTED) :
          ": "+(string)this.GetProperty(property)
         )  :
      property==CHART_PROP_WIDTH_IN_PIXELS   ?  CMessage::Text(MSG_CHART_OBJ_WIDTH_IN_PIXELS)+
         (!this.SupportProperty(property) ?  ": "+CMessage::Text(MSG_LIB_PROP_NOT_SUPPORTED) :
          ": "+(string)this.GetProperty(property)
         )  :
      property==CHART_PROP_HEIGHT_IN_PIXELS   ?  CMessage::Text(MSG_CHART_OBJ_HEIGHT_IN_PIXELS)+
         (!this.SupportProperty(property) ?  ": "+CMessage::Text(MSG_LIB_PROP_NOT_SUPPORTED) :
          ": "+(string)::ChartGetInteger(this.m_chart_id,CHART_HEIGHT_IN_PIXELS,0)
         )  :
      property==CHART_PROP_COLOR_BACKGROUND        ?  CMessage::Text(MSG_CHART_OBJ_COLOR_BACKGROUND)+
         (!this.SupportProperty(property) ?  ": "+CMessage::Text(MSG_LIB_PROP_NOT_SUPPORTED) :
          ": "+::ColorToString((color)this.GetProperty(property),true)
         )  :
チャートにはそのようなプロパティがありますが、それらはチャート自体ではなくウィンドウ(この場合は0ウィンドウ)に属すため、これらのプロパティはチャートウィンドウオブジェクトから取得します。
チャートオブジェクトとそのウィンドウのリストを更新するメソッドも変更されました。
//+------------------------------------------------------------------+
//| Update the chart object and its window list                      |
//+------------------------------------------------------------------+
void CChartObj::Refresh(void)
  {
//--- Initialize event data
   this.m_is_event=false;
   this.m_hash_sum=0;
   this.m_list_events.Clear();
   this.m_list_events.Sort();
//--- Update all chart windows
   for(int i=0;i<this.m_list_wnd.Total();i++)
     {
      //--- Get the next chart window object from the list
      CChartWnd *wnd=this.m_list_wnd.At(i);
      if(wnd==NULL)
         continue;
      //--- Update the window and check its event flag
      //--- If the window has no event, move on to the next window
      wnd.Refresh();
      if(!wnd.IsEvent())
         continue;
      //--- Get the list of chart window events
      CArrayObj *list=wnd.GetListEvents();
      if(list==NULL)
         continue;
      //--- Set the chart event flag and get the last event code
      this.m_is_event=true;
      this.m_event_code=wnd.GetEventCode();
      //--- In the loop by the number of chart window events,
      int n=list.Total();
      for(int j=0; j<n; j++)
        {
         //--- get the base event object from the chart window event list
         CEventBaseObj *event=list.At(j);
         if(event==NULL)
            continue;
         //--- Create the chart window event parameters using the base event
         ushort event_id=event.ID();
         this.m_last_event=event_id;
         string sparam=(string)this.GetChartID()+"_"+(string)wnd.WindowNum();
         //--- if the event is on the foreground and the chart window event is added to the chart event list,
         if(::ChartGetInteger(this.ID(),CHART_BRING_TO_TOP) && this.EventAdd((ushort)event.ID(),event.LParam(),event.DParam(),sparam))
           {
            //--- send the newly created chart window event to the control program chart
            ::EventChartCustom(this.m_chart_id_main,(ushort)event_id,event.LParam(),event.DParam(),sparam);
           }
        }
     }

//--- Check changes of a symbol and chart period
   int change=(int)::ChartGetInteger(this.m_chart_id,CHART_WINDOWS_TOTAL)-this.WindowsTotal();
   if(change==0)
     {
      //--- Get a chart symbol and period by its ID
      string symbol=::ChartSymbol(this.ID());
      ENUM_TIMEFRAMES timeframe=::ChartPeriod(this.ID());
      //--- If a symbol and period are received
      if(symbol!=NULL && timeframe!=0)
        {
         //--- create the flags specifying the equality/non-equality of the obtained period symbol with the current ones
         bool symb=symbol!=this.m_symbol_prev;
         bool tf=timeframe!=this.m_timeframe_prev;
         //--- If case of any changes, find out their exact nature:
         if(symb || tf)
           {
            //--- If both a symbol and a timeframe changed
            if(symb && tf)
              {
               //--- Send the CHART_OBJ_EVENT_CHART_SYMB_TF_CHANGE event to the control program chart
               this.SendEvent(CHART_OBJ_EVENT_CHART_SYMB_TF_CHANGE);
               //--- Set a new symbol and a period for the object, and
               this.SetSymbol(symbol);
               this.SetTimeframe(timeframe);
               //--- write the current symbol/period as the previous ones
               this.m_symbol_prev=this.Symbol();
               this.m_timeframe_prev=this.Timeframe();
              }
            //--- If only a chart symbol is changed
            else if(symb)
              {
               //--- Send the CHART_OBJ_EVENT_CHART_SYMB_CHANGE event to the control program chart
               this.SendEvent(CHART_OBJ_EVENT_CHART_SYMB_CHANGE);
               //--- Set a new symbol for the object and write the current symbol as the previous one
               this.SetSymbol(symbol);
               this.m_symbol_prev=this.Symbol();
              }
            //--- If only a chart period is changed
            else if(tf)
              {
               //--- Send the CHART_OBJ_EVENT_CHART_TF_CHANGE event to the control program chart
               this.SendEvent(CHART_OBJ_EVENT_CHART_TF_CHANGE);
               //--- Set a new timeframe for the object and write the current timeframe as the previous one
               this.SetTimeframe(timeframe);
               this.m_timeframe_prev=this.Timeframe();
              }
           }
        }
      //--- Update chart data
      if(this.SetIntegerParameters())
        {
         this.SetDoubleParameters();
         this.SetStringParameters();
        }
      //--- Fill in the current chart data
      for(int i=0;i<CHART_PROP_INTEGER_TOTAL;i++)
         this.m_long_prop_event[i][3]=this.m_long_prop[i];
      for(int i=0;i<CHART_PROP_DOUBLE_TOTAL;i++)
         this.m_double_prop_event[i][3]=this.m_double_prop[i];
      //--- Update the base object data and search for changes
      CBaseObjExt::Refresh();
      this.CheckEvents();
     }
   else
     {
      this.RecreateWindowsList(change);
     }
  }
//+------------------------------------------------------------------+
メソッドは詳細にコメントされています。つまり、チャートウィンドウオブジェクトを更新した後で、各ウィンドウイベントのフラグを確認する必要があります。ウィンドウにイベントがある場合は、各イベントを制御プログラムチャートに送信する必要があります。チャートウィンドウを更新してそのイベントを確認した後、チャートに関連する変更がない場合は、チャート銘柄や期間の変更を確認します。
チャートイベントを作成して制御プログラムチャートに送信するメソッドで、チャート銘柄や期間変更イベントの処理を追加します。
//+------------------------------------------------------------------+
//| Create and send a chart event                                    |
//| to the control program chart                                     |
//+------------------------------------------------------------------+
void CChartObj::SendEvent(ENUM_CHART_OBJ_EVENT event)
  {
   //--- If a window is added
   if(event==CHART_OBJ_EVENT_CHART_WND_ADD)
     {
      //--- Get the last chart window object added to the list
      CChartWnd *wnd=this.GetLastAddedWindow();
      if(wnd==NULL)
         return;
      //--- Send the CHART_OBJ_EVENT_CHART_WND_ADD event to the control program chart
      //--- pass the chart ID to lparam,
      //--- pass the chart window index to dparam,
      //--- pass the chart symbol to sparam
      ::EventChartCustom(this.m_chart_id_main,(ushort)event,this.m_chart_id,wnd.WindowNum(),this.Symbol());
     }
   //--- If the window is removed
   else if(event==CHART_OBJ_EVENT_CHART_WND_DEL)
     {
      //--- Get the last chart window object added to the list of removed windows
      CChartWnd *wnd=this.GetLastDeletedWindow();
      if(wnd==NULL)
         return;
      //--- Send the CHART_OBJ_EVENT_CHART_WND_DEL event to the control program chart
      //--- pass the chart ID to lparam,
      //--- pass the chart window index to dparam,
      //--- pass the chart symbol to sparam
      ::EventChartCustom(this.m_chart_id_main,(ushort)event,this.m_chart_id,wnd.WindowNum(),this.Symbol());
     }
   //--- If symbol and timeframe changed
   else if(event==CHART_OBJ_EVENT_CHART_SYMB_TF_CHANGE)
     {
      //--- Send the CHART_OBJ_EVENT_CHART_SYMB_TF_CHANGE event to the control program chart
      //--- pass the chart ID to lparam,
      //--- pass the previous timeframe to dparam,
      //--- pass the previous chart symbol to sparam
      ::EventChartCustom(this.m_chart_id_main,(ushort)event,this.m_chart_id,this.m_timeframe_prev,this.m_symbol_prev);
     }
   //--- If a symbol changed
   else if(event==CHART_OBJ_EVENT_CHART_SYMB_CHANGE)
     {
      //--- Send the CHART_OBJ_EVENT_CHART_SYMB_CHANGE event to the control program chart
      //--- pass the chart ID to lparam,
      //--- pass the current timeframe to dparam,
      //--- pass the previous chart symbol to sparam
      ::EventChartCustom(this.m_chart_id_main,(ushort)event,this.m_chart_id,this.Timeframe(),this.m_symbol_prev);
     }
   //--- If a timeframe changed
   else if(event==CHART_OBJ_EVENT_CHART_TF_CHANGE)
     {
      //--- Send the CHART_OBJ_EVENT_CHART_TF_CHANGE event to the control program chart
      //--- pass the chart ID to lparam,
      //--- pass the previous timeframe to dparam,
      //--- pass the current chart symbol to sparam
      ::EventChartCustom(this.m_chart_id_main,(ushort)event,this.m_chart_id,this.m_timeframe_prev,this.Symbol());
     }
  }
//+------------------------------------------------------------------+
コードのコメントにはすべての詳細が含まれています。ご質問がある場合は、下のコメント欄でお気軽にお問い合わせください。
次に、\MQL5\Include\DoEasy\Collections\ChartObjCollection.mqhのチャートオブジェクトコレクションクラスを改善しましょう。
まず、このクラスを基本的な拡張オブジェクトクラスの子孫にし、最後のイベントを格納するための変数をクラスのprivateセクションに追加します。
//+------------------------------------------------------------------+
//| MQL5 signal object collection                                    |
//+------------------------------------------------------------------+
class CChartObjCollection : public CBaseObjExt
  {
private:
   CListObj                m_list;                                   // List of chart objects
   CListObj                m_list_del;                               // List of deleted chart objects
   CArrayObj               m_list_wnd_del;                           // List of deleted chart window objects
   CArrayObj               m_list_ind_del;                           // List of indicators removed from the indicator window
   CArrayObj               m_list_ind_param;                         // List of changed indicators
   int                     m_charts_total_prev;                      // Previous number of charts in the terminal
   int                     m_last_event;                             // The last event
   //--- Return the number of charts in the terminal
   int                     ChartsTotal(void) const;
   //--- Return the flag indicating the existence of (1) a chart object and (2) a chart
   bool                    IsPresentChartObj(const long chart_id);
   bool                    IsPresentChart(const long chart_id);
   //--- Create a new chart object and add it to the list
   bool                    CreateNewChartObj(const long chart_id,const string source);
   //--- Find the missing chart object, create it and add it to the collection list
   bool                    FindAndCreateMissingChartObj(void);
   //--- Find a chart object not present in the terminal and remove it from the list
   void                    FindAndDeleteExcessChartObj(void);
public:
クラスのpublicセクションで、基本的な拡張オブジェクトのイベント機能を使用するための3つのメソッドを追加し、チャート(IDで指定)のウィンドウオブジェクト(インデックスで指定)を示すメソッドを宣言します。
//--- Return (1) the flag event, (2) an event of one of the charts and (3) the last event
   bool                    IsEvent(void)                             const { return this.m_is_event;                                   }
   int                     GetLastEventsCode(void)                   const { return this.m_event_code;                                 }
   int                     GetLastEvent(void)                        const { return this.m_last_event;                                 }

//--- Constructor
                           CChartObjCollection();

//--- Return the list of chart objects by (1) symbol and (2) timeframe
   CArrayObj              *GetChartsList(const string symbol)              { return this.GetList(CHART_PROP_SYMBOL,symbol,EQUAL);      }
   CArrayObj              *GetChartsList(const ENUM_TIMEFRAMES timeframe)  { return this.GetList(CHART_PROP_TIMEFRAME,timeframe,EQUAL);}
//--- Return the pointer to the chart object (1) by ID and (2) by an index in the list
   CChartObj              *GetChart(const long id);
   CChartObj              *GetChart(const int index)                       { return this.m_list.At(index);                             }
//--- Return (1) the last added chart and (2) the last removed chart
   CChartObj              *GetLastAddedChart(void)                         { return this.m_list.At(this.m_list.Total()-1);             }
   CChartObj              *GetLastDeletedChart(void)                       { return this.m_list_del.At(this.m_list_del.Total()-1);     }

//--- Return (1) the last added window on the chart by chart ID and (2) the last removed chart window
   CChartWnd              *GetLastAddedChartWindow(const long chart_id);
   CChartWnd              *GetLastDeletedChartWindow(void)                 { return this.m_list_wnd_del.At(this.m_list_wnd_del.Total()-1);}
//--- Return the window object (specified by index) of the chart (specified by ID)
   CChartWnd              *GetChartWindow(const long chart_id,const int wnd_num);
チャートオブジェクトコレクションリストを更新するメソッドはチャートオブジェクトイベントの処理を受信します。
//+------------------------------------------------------------------+
//| Update the collection list of chart objects                      |
//+------------------------------------------------------------------+
void CChartObjCollection::Refresh(void)
  {
//--- Initialize event data
   this.m_is_event=false;
   this.m_hash_sum=0;
   this.m_list_events.Clear();
   this.m_list_events.Sort();
   //--- In the loop by the number of chart objects in the collection list
   for(int i=0;i<this.m_list.Total();i++)
     {
      //--- get the next chart object and
      CChartObj *chart=this.m_list.At(i);
      if(chart==NULL)
         continue;
      //--- update it
      chart.Refresh();
      //--- If there is no chart event, move on to the next one
      if(!chart.IsEvent())
         continue;
      //--- Get the list of events of a selected chart
      CArrayObj *list=chart.GetListEvents();
      if(list==NULL)
         continue;
      //--- Set the event flag in the chart collection and get the last event code
      this.m_is_event=true;
      this.m_event_code=chart.GetEventCode();
      //--- In the loop by the chart event list,
      int n=list.Total();
      for(int j=0; j<n; j++)
        {
         //--- get the base event object from the chart event list
         CEventBaseObj *event=list.At(j);
         if(event==NULL)
            continue;
         //--- Create the chart event parameters using the base event
         ushort event_id=event.ID();
         this.m_last_event=event_id;
         string sparam=(string)this.GetChartID();
         //--- and, if the chart event is added to the chart event list,
         if(this.EventAdd((ushort)event.ID(),event.LParam(),event.DParam(),sparam))
           {
            //--- send the newly created chart event to the control program chart
            ::EventChartCustom(this.m_chart_id_main,(ushort)event_id,event.LParam(),event.DParam(),sparam);
           }
        }
     }

   //--- Get the number of open charts in the terminal and
   int charts_total=this.ChartsTotal();
   //--- calculate the difference between the number of open charts in the terminal
   //--- and chart objects in the collection list. These values are displayed in the chart comment
   int change=charts_total-this.m_list.Total();
   //--- If there are no changes, leave
   if(change==0)
      return;
   //--- If a chart is added in the terminal
   if(change>0)
     {
      //--- Find the missing chart object, create and add it to the collection list
      this.FindAndCreateMissingChartObj();
      //--- Get the current chart and return to it since
      //--- adding a new chart switches the focus to it
      CChartObj *chart=this.GetChart(GetMainChartID());
      if(chart!=NULL)
         chart.SetBringToTopON(true);
      for(int i=0;i<change;i++)
        {
         chart=m_list.At(m_list.Total()-(1+i));
         if(chart==NULL)
            continue;
         this.SendEvent(CHART_OBJ_EVENT_CHART_OPEN);
        }
     }
   //--- If a chart is removed in the terminal
   else if(change<0)
     {
      //--- Find an extra chart object in the collection list and remove it from the list
      this.FindAndDeleteExcessChartObj();
      for(int i=0;i<-change;i++)
        {
         CChartObj *chart=this.m_list_del.At(this.m_list_del.Total()-(1+i));
         if(chart==NULL)
            continue;
         this.SendEvent(CHART_OBJ_EVENT_CHART_CLOSE);
        }
     }
  }
//+------------------------------------------------------------------+
ここでのロジックは、以前に検討されたチャートオブジェクトとチャートウィンドウオブジェクトの更新メソッドの1つに似ています。すべてはここで詳細にコメントされています。
以下は、チャート(IDで指定)のウィンドウオブジェクト(インデックスで指定)を返すメソッドです。
//+------------------------------------------------------------------+
//| Return the window object (specified by index)                    |
//| of the chart (specified by ID)                                   |
//+------------------------------------------------------------------+
CChartWnd* CChartObjCollection::GetChartWindow(const long chart_id,const int wnd_num)
  {
   CChartObj *chart=this.GetChart(chart_id);
   if(chart==NULL)
      return NULL;
   return chart.GetWindowByNum(wnd_num);
  }
//+------------------------------------------------------------------+
ここでは、 IDでチャートオブジェクトを取得し、指定されたウィンドウインデックスで取得したチャートに属するウィンドウを返します。
オブジェクトのいずれかが受信されない場合、メソッドはNULLを返します。
次に、同じメソッドを\MQL5\Include\DoEasy\Engine.mqhのCEngineライブラリメインクラスに追加します。
//--- Return the object (1) of the last added window of the specified chart and (2) the last removed chart window
   CChartWnd           *ChartGetLastAddedChartWindow(const long chart_id)              { return this.m_charts.GetLastAddedChartWindow(chart_id);}
   CChartWnd           *ChartGetLastDeletedChartWindow(void)                           { return this.m_charts.GetLastDeletedChartWindow();   }
//--- Return the window object (specified by index) of the chart (specified by ID)
   CChartWnd           *ChartGetChartWindow(const long chart_id,const int wnd_num)     { return this.m_charts.GetChartWindow(chart_id,wnd_num);}
このメソッドは、上記で検討したチャートオブジェクトコレクションクラスのGetChartWindow()メソッドを呼び出した結果を返すだけです。
これですべての変更と改善が完了しました。テストを実行してみましょう。
検証
テストを実行するには、前の記事のEAを\MQL5\Experts\TestDoEasy\Part72\でTestDoEasyPart72.mq5として保存します。
いくつかのチャートウィンドウオブジェクトのプロパティを追跡し、チャートオブジェクトコレクションから受信するすべての新しいイベントの処理を追加する必要があります。
EAのOnInitDoEasy()関数の最後に、追跡するチャートウィンドウのプロパティを設定するためのコードブロックを追加します(関数コード全体は非常に大きいため、 ここでは提示しません)。
//--- Set controlled values for the current account
   CAccount* account=engine.GetAccountCurrent();
   if(account!=NULL)
     {
      //--- Set control of the profit increase to 10
      account.SetControlledValueINC(ACCOUNT_PROP_PROFIT,10.0);
      //--- Set control of the funds increase to 15
      account.SetControlledValueINC(ACCOUNT_PROP_EQUITY,15.0);
      //--- Set profit control level to 20
      account.SetControlledValueLEVEL(ACCOUNT_PROP_PROFIT,20.0);
     }

//--- Set controlled values for charts
   //--- Get the list of all collection charts
   CArrayObj *list_charts=engine.GetListCharts();
   if(list_charts!=NULL && list_charts.Total()>0)
     {
      //--- In a loop by the list, set the necessary values for tracked chart properties
      //--- By default, the LONG_MAX value is set to all properties, which means "Do not track this property"
      //--- It can be enabled or disabled (by setting the value less than LONG_MAX or vice versa - set the LONG_MAX value) at any time and anywhere in the program
      for(int i=0;i<list_charts.Total();i++)
        {
         CChartObj* chart=list_charts.At(i);
         if(chart==NULL)
            continue;
         //--- Set reference values for the selected chart windows
         int total_wnd=chart.WindowsTotal();
         for(int j=0;j<total_wnd;j++)
           {
            CChartWnd *wnd=engine.ChartGetChartWindow(chart.ID(),j);
            if(wnd==NULL)
               continue;
            //--- Set control of the chart window height increase by 20 pixels
            wnd.SetControlHeightInPixelsInc(20);
            //--- Set control of the chart window height decrease by 20 pixels
            wnd.SetControlHeightInPixelsDec(20);
            //--- Set the control height of the chart window to 50 pixels
            wnd.SetControlledValueLEVEL(CHART_WINDOW_PROP_HEIGHT_IN_PIXELS,50);
           }
        }
     }

//--- Get the end of the library initialization time counting and display it in the journal
   ulong end=GetTickCount();
   Print(TextByLanguage("Время инициализации библиотеки: ","Library initialization time: "),TimeMSCtoString(end-begin,TIME_MINUTES|TIME_SECONDS));
  }
//+------------------------------------------------------------------+
ここでは、次のパラメータを設定します。
- ウィンドウの高さが20ピクセルを超えて増加すると、適切なイベントが生成されます。
- ウィンドウの高さが20ピクセルを超えて減少すると、適切なイベントが生成されます。
- ウィンドウの高さが50ピクセルに等しくなるまたは50ピクセル以上/以下になると、対応するイベントが生成されます。
EAのOnDoEasyEvent()関数は、すべての新しいライブラリイベントの処理を受け取ります(新しいイベントを含むすべてのチャートコレクションイベントを処理するコードブロック全体がここに提供されます)。
//--- Handling timeseries events
   else if(idx>SERIES_EVENTS_NO_EVENT && idx<SERIES_EVENTS_NEXT_CODE)
     {
      //--- "New bar" event
      if(idx==SERIES_EVENTS_NEW_BAR)
        {
         Print(TextByLanguage("Новый бар на ","New Bar on "),sparam," ",TimeframeDescription((ENUM_TIMEFRAMES)dparam),": ",TimeToString(lparam));
        }
     }

//--- Handle chart auto events
//--- Handle chart and window events
   if(source==COLLECTION_CHART_WND_ID)
     {
      int pos=StringFind(sparam,"_");
      long chart_id=StringToInteger(StringSubstr(sparam,0,pos));
      int wnd_num=(int)StringToInteger(StringSubstr(sparam,pos+1));

      CChartObj *chart=engine.ChartGetChartObj(chart_id);
      if(chart==NULL)
         return;
      CSymbol *symbol=engine.GetSymbolObjByName(chart.Symbol());
      if(symbol==NULL)
         return;
      CChartWnd *wnd=chart.GetWindowByNum(wnd_num);
      if(wnd==NULL)
         return;
      //--- Number of decimal places in the event value - in case of a 'long' event, it is 0, otherwise - Digits() of a symbol
      int digits=(idx<CHART_WINDOW_PROP_INTEGER_TOTAL ? 0 : symbol.Digits());
      //--- Event text description
      string id_descr=(idx<CHART_WINDOW_PROP_INTEGER_TOTAL ? wnd.GetPropertyDescription((ENUM_CHART_WINDOW_PROP_INTEGER)idx) : wnd.GetPropertyDescription((ENUM_CHART_WINDOW_PROP_DOUBLE)idx));
      //--- Property change text value
      string value=DoubleToString(dparam,digits);

      //--- Check event reasons and display its description in the journal
      if(reason==BASE_EVENT_REASON_INC)
        {
         Print(wnd.EventDescription(idx,(ENUM_BASE_EVENT_REASON)reason,source,value,id_descr,digits));
        }
      if(reason==BASE_EVENT_REASON_DEC)
        {
         Print(wnd.EventDescription(idx,(ENUM_BASE_EVENT_REASON)reason,source,value,id_descr,digits));
        }
      if(reason==BASE_EVENT_REASON_MORE_THEN)
        {
         Print(wnd.EventDescription(idx,(ENUM_BASE_EVENT_REASON)reason,source,value,id_descr,digits));
        }
      if(reason==BASE_EVENT_REASON_LESS_THEN)
        {
         Print(wnd.EventDescription(idx,(ENUM_BASE_EVENT_REASON)reason,source,value,id_descr,digits));
        }
      if(reason==BASE_EVENT_REASON_EQUALS)
        {
         Print(wnd.EventDescription(idx,(ENUM_BASE_EVENT_REASON)reason,source,value,id_descr,digits));
        }
     }
//--- Handle chart auto events
   if(source==COLLECTION_CHARTS_ID)
     {
      long chart_id=StringToInteger(sparam);

      CChartObj *chart=engine.ChartGetChartObj(chart_id);
      if(chart==NULL)
         return;
      Print(DFUN,"chart_id=",chart_id,", chart.Symbol()=",chart.Symbol());
      //--- Number of decimal places in the event value - in case of a 'long' event, it is 0, otherwise - Digits() of a symbol
      int digits=int(idx<CHART_PROP_INTEGER_TOTAL ? 0 : SymbolInfoInteger(chart.Symbol(),SYMBOL_DIGITS));
      //--- Event text description
      string id_descr=(idx<CHART_PROP_INTEGER_TOTAL ? chart.GetPropertyDescription((ENUM_CHART_PROP_INTEGER)idx) : chart.GetPropertyDescription((ENUM_CHART_PROP_DOUBLE)idx));
      //--- Property change text value
      string value=DoubleToString(dparam,digits);

      //--- Check event reasons and display its description in the journal
      if(reason==BASE_EVENT_REASON_INC)
        {
         Print(chart.EventDescription(idx,(ENUM_BASE_EVENT_REASON)reason,source,value,id_descr,digits));
        }
      if(reason==BASE_EVENT_REASON_DEC)
        {
         Print(chart.EventDescription(idx,(ENUM_BASE_EVENT_REASON)reason,source,value,id_descr,digits));
        }
      if(reason==BASE_EVENT_REASON_MORE_THEN)
        {
         Print(chart.EventDescription(idx,(ENUM_BASE_EVENT_REASON)reason,source,value,id_descr,digits));
        }
      if(reason==BASE_EVENT_REASON_LESS_THEN)
        {
         Print(chart.EventDescription(idx,(ENUM_BASE_EVENT_REASON)reason,source,value,id_descr,digits));
        }
      if(reason==BASE_EVENT_REASON_EQUALS)
        {
         Print(chart.EventDescription(idx,(ENUM_BASE_EVENT_REASON)reason,source,value,id_descr,digits));
        }
     }

//--- Handle non-auto chart events
   else if(idx>CHART_OBJ_EVENT_NO_EVENT && idx<CHART_OBJ_EVENTS_NEXT_CODE)
     {
      //--- "New chart opening" event
      if(idx==CHART_OBJ_EVENT_CHART_OPEN)
        {
         //::EventChartCustom(this.m_chart_id_main,(ushort)event,chart.ID(),chart.Timeframe(),chart.Symbol());
         CChartObj *chart=engine.ChartGetLastOpenedChart();
         if(chart!=NULL)
           {
            string symbol=sparam;
            long chart_id=lparam;
            ENUM_TIMEFRAMES timeframe=(ENUM_TIMEFRAMES)dparam;
            string header=symbol+" "+TimeframeDescription(timeframe)+", ID "+(string)chart_id;
            Print(DFUN,CMessage::Text(MSG_CHART_COLLECTION_CHART_OPENED),": ",header);
           }
        }
      //--- "Chart closure" event
      if(idx==CHART_OBJ_EVENT_CHART_CLOSE)
        {
         //::EventChartCustom(this.m_chart_id_main,(ushort)event,chart.ID(),chart.Timeframe(),chart.Symbol());
         CChartObj *chart=engine.ChartGetLastClosedChart();
         if(chart!=NULL)
           {
            string symbol=sparam;
            long   chart_id=lparam;
            ENUM_TIMEFRAMES timeframe=(ENUM_TIMEFRAMES)dparam;
            string header=symbol+" "+TimeframeDescription(timeframe)+", ID "+(string)chart_id;
            Print(DFUN,CMessage::Text(MSG_CHART_COLLECTION_CHART_CLOSED),": ",header);
           }
        }
      //--- "Chart symbol changed" event
      if(idx==CHART_OBJ_EVENT_CHART_SYMB_CHANGE)
        {
         //::EventChartCustom(this.m_chart_id_main,(ushort)event,this.m_chart_id,this.Timeframe(),this.m_symbol_prev);
         long chart_id=lparam;
         ENUM_TIMEFRAMES timeframe=(ENUM_TIMEFRAMES)dparam;
         string symbol_prev=sparam;
         CChartObj *chart=engine.ChartGetChartObj(chart_id);
         if(chart!=NULL)
           {
            string header=chart.Symbol()+" "+TimeframeDescription(timeframe)+", ID "+(string)chart_id;
            Print(DFUN,CMessage::Text(MSG_CHART_COLLECTION_CHART_SYMB_CHANGED),": ",header,": ",symbol_prev," >>> ",chart.Symbol());
           }
        }
      //--- "Chart timeframe changed" event
      if(idx==CHART_OBJ_EVENT_CHART_TF_CHANGE)
        {
         //::EventChartCustom(this.m_chart_id_main,(ushort)event,this.m_chart_id,this.m_timeframe_prev,this.Symbol());
         long chart_id=lparam;
         ENUM_TIMEFRAMES timeframe_prev=(ENUM_TIMEFRAMES)dparam;
         string symbol=sparam;
         CChartObj *chart=engine.ChartGetChartObj(chart_id);
         if(chart!=NULL)
           {
            string header=chart.Symbol()+" "+TimeframeDescription(chart.Timeframe())+", ID "+(string)chart_id;
            Print
              (
               DFUN,CMessage::Text(MSG_CHART_COLLECTION_CHART_TF_CHANGED),": ",header,": ",
               TimeframeDescription(timeframe_prev)," >>> ",TimeframeDescription(chart.Timeframe())
              );
           }
        }
      //--- "Chart symbol and timeframe changed" event
      if(idx==CHART_OBJ_EVENT_CHART_SYMB_TF_CHANGE)
        {
         //::EventChartCustom(this.m_chart_id_main,(ushort)event,this.m_chart_id,this.m_timeframe_prev,this.m_symbol_prev);
         long chart_id=lparam;
         ENUM_TIMEFRAMES timeframe_prev=(ENUM_TIMEFRAMES)dparam;
         string symbol_prev=sparam;
         CChartObj *chart=engine.ChartGetChartObj(chart_id);
         if(chart!=NULL)
           {
            string header=chart.Symbol()+" "+TimeframeDescription(chart.Timeframe())+", ID "+(string)chart_id;
            Print
              (
               DFUN,CMessage::Text(MSG_CHART_COLLECTION_CHART_SYMB_TF_CHANGED),": ",header,": ",
               symbol_prev," >>> ",chart.Symbol(),", ",TimeframeDescription(timeframe_prev)," >>> ",TimeframeDescription(chart.Timeframe())
              );
           }
        }

      //--- "Adding a new window on the chart" event
      if(idx==CHART_OBJ_EVENT_CHART_WND_ADD)
        {
         //::EventChartCustom(this.m_chart_id_main,(ushort)event,this.m_chart_id,wnd.WindowNum(),this.Symbol());
         ENUM_TIMEFRAMES timeframe=WRONG_VALUE;
         string ind_name="";
         string symbol=sparam;
         long   chart_id=lparam;
         int    win_num=(int)dparam;
         string header=symbol+" "+TimeframeDescription(timeframe)+", ID "+(string)chart_id+": ";

         CChartObj *chart=engine.ChartGetLastOpenedChart();
         if(chart!=NULL)
           {
            timeframe=chart.Timeframe();
            CChartWnd *wnd=engine.ChartGetLastAddedChartWindow(chart.ID());
            if(wnd!=NULL)
              {
               CWndInd *ind=wnd.GetLastAddedIndicator();
               if(ind!=NULL)
                  ind_name=ind.Name();
              }
           }
         Print(DFUN,header,CMessage::Text(MSG_CHART_OBJ_WINDOW_ADDED)," ",(string)win_num," ",ind_name);
        }
      //--- "Removing a window from the chart" event
      if(idx==CHART_OBJ_EVENT_CHART_WND_DEL)
        {
         //::EventChartCustom(this.m_chart_id_main,(ushort)event,this.m_chart_id,wnd.WindowNum(),this.Symbol());
         CChartWnd *wnd=engine.ChartGetLastDeletedChartWindow();
         ENUM_TIMEFRAMES timeframe=WRONG_VALUE;
         string symbol=sparam;
         long   chart_id=lparam;
         int    win_num=(int)dparam;
         string header=symbol+" "+TimeframeDescription(timeframe)+", ID "+(string)chart_id+": ";
         Print(DFUN,header,CMessage::Text(MSG_CHART_OBJ_WINDOW_REMOVED)," ",(string)win_num);
        }
      //--- "Adding a new indicator to the chart window" event
      if(idx==CHART_OBJ_EVENT_CHART_WND_IND_ADD)
        {
         //::EventChartCustom(this.m_chart_id_main,(ushort)event,this.m_chart_id,this.WindowNum(),ind.Name());
         ENUM_TIMEFRAMES timeframe=WRONG_VALUE;
         string ind_name=sparam;
         string symbol=NULL;
         long   chart_id=lparam;
         int    win_num=(int)dparam;
         string header=NULL;

         CWndInd *ind=engine.ChartGetLastAddedIndicator(chart_id,win_num);
         if(ind!=NULL)
           {
            CChartObj *chart=engine.ChartGetChartObj(chart_id);
            if(chart!=NULL)
              {
               symbol=chart.Symbol();
               timeframe=chart.Timeframe();
               CChartWnd *wnd=chart.GetWindowByNum(win_num);
               if(wnd!=NULL)
                  header=wnd.Header();
              }
           }
         Print(DFUN,symbol," ",TimeframeDescription(timeframe),", ID ",chart_id,", ",header,": ",CMessage::Text(MSG_CHART_OBJ_INDICATOR_ADDED)," ",ind_name);
        }
      //--- "Removing an indicator from the chart window" event
      if(idx==CHART_OBJ_EVENT_CHART_WND_IND_DEL)
        {
         //::EventChartCustom(this.m_chart_id_main,(ushort)event,this.m_chart_id,this.WindowNum(),ind.Name());
         ENUM_TIMEFRAMES timeframe=WRONG_VALUE;
         string ind_name=sparam;
         string symbol=NULL;
         long   chart_id=lparam;
         int    win_num=(int)dparam;
         string header=NULL;

         CWndInd *ind=engine.ChartGetLastDeletedIndicator();
         if(ind!=NULL)
           {
            CChartObj *chart=engine.ChartGetChartObj(chart_id);
            if(chart!=NULL)
              {
               symbol=chart.Symbol();
               timeframe=chart.Timeframe();
               CChartWnd *wnd=chart.GetWindowByNum(win_num);
               if(wnd!=NULL)
                  header=wnd.Header();
              }
           }
         Print(DFUN,symbol," ",TimeframeDescription(timeframe),", ID ",chart_id,", ",header,": ",CMessage::Text(MSG_CHART_OBJ_INDICATOR_REMOVED)," ",ind_name);
        }
      //--- "Changing indicator parameters in the chart window" event
      if(idx==CHART_OBJ_EVENT_CHART_WND_IND_CHANGE)
        {
         //::EventChartCustom(this.m_chart_id_main,(ushort)event,this.m_chart_id,this.WindowNum(),ind.Name());
         ENUM_TIMEFRAMES timeframe=WRONG_VALUE;
         string ind_name=sparam;
         string symbol=NULL;
         long   chart_id=lparam;
         int    win_num=(int)dparam;
         string header=NULL;

         CWndInd *ind=NULL;
         CWndInd *ind_changed=engine.ChartGetLastChangedIndicator();
         if(ind_changed!=NULL)
           {
            ind=engine.ChartGetIndicator(chart_id,win_num,ind_changed.Index());
            if(ind!=NULL)
              {
               CChartObj *chart=engine.ChartGetChartObj(chart_id);
               if(chart!=NULL)
                 {
                  symbol=chart.Symbol();
                  timeframe=chart.Timeframe();
                  CChartWnd *wnd=chart.GetWindowByNum(win_num);
                  if(wnd!=NULL)
                     header=wnd.Header();
                 }
              }
           }
         Print(DFUN,symbol," ",TimeframeDescription(timeframe),", ID ",chart_id,", ",header,": ",CMessage::Text(MSG_CHART_OBJ_INDICATOR_CHANGED)," ",ind_name," >>> ",ind.Name());
        }
     }

//--- Handling trading events
新しく作成されたチャートコレクションの自動イベント機能をテストし、指定されたコレクションオブジェクトパラメータの変更をテストするために必要な変更は、これですべてです。
EAをコンパイルし、EURUSD、GBPUSD、現在の時間枠の使用を設定した後でEURUSDで起動します。
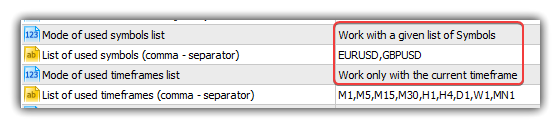
両方のチャートを事前に開いておく必要があります。EAをEURUSDで起動しますが、GBPUSDにはオシレータを備えた単一のサブウィンドウが必要です。サブウィンドウを使用して、チャートコレクションクラスのイベント機能を管理します。
チャートの時間枠変更イベントを確認しましょう。
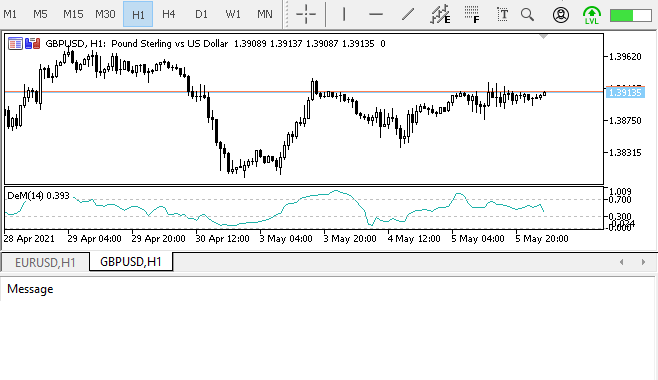
次に、チャート銘柄を変更しましょう。
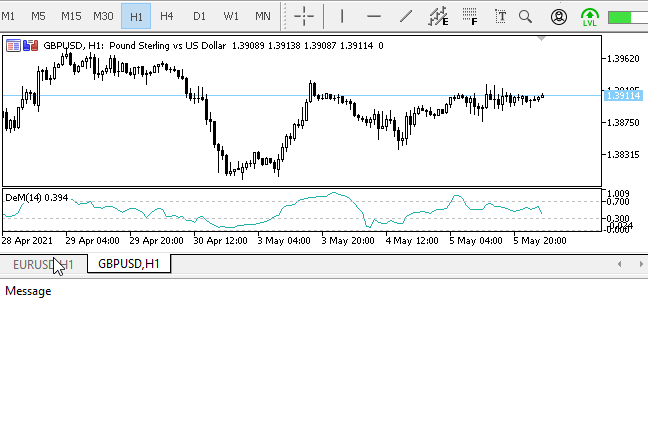
また、チャートの高さの変更の管理を確認します(変更はメインチャートウィンドウとサブウィンドウの2つのチャートに適用されます)。

ご覧のとおり、ここではウィンドウの高さが指定されたサイズに等しい、ウィンドウの高さが指定されたサイズよりも高い/低い、ウィンドウの高さが指定されたピクセル数を超えて増減すると、いくつかの基準が関係しています。
次の段階
次の記事では、ライブラリ開発の新しい段階、つまりグラフィカルオブジェクトとカスタムグラフィックの使用を開始します。
ライブラリの現在のバージョンのすべてのファイルは、テストおよびダウンロードできるように、MQL5のテストEAファイルと一緒に以下に添付されています。
質問や提案はコメント欄にお願いします。
**連載のこれまでの記事:
DoEasyライブラリでのその他のクラス(第67部): チャットオブジェクトクラス
DoEasyライブラリでのその他のクラス(第68部): チャットウィンドウオブジェクトクラスとチャートでの指標オブジェクトクラス
DoEasyライブラリでのその他のクラス(第69部): チャットオブジェクトコレクションクラス
DoEasyライブラリでのその他のクラス(第70部): チャットオブジェクトコレクショの機能拡張と自動更新
DoEasyライブラリでのその他のクラス(第71部): チャットオブジェクトコレクションイベント
MetaQuotes Ltdによってロシア語から翻訳されました。
元の記事: https://www.mql5.com/ru/articles/9385
警告: これらの資料についてのすべての権利はMetaQuotes Ltd.が保有しています。これらの資料の全部または一部の複製や再プリントは禁じられています。
この記事はサイトのユーザーによって執筆されたものであり、著者の個人的な見解を反映しています。MetaQuotes Ltdは、提示された情報の正確性や、記載されているソリューション、戦略、または推奨事項の使用によって生じたいかなる結果についても責任を負いません。

 パターンと例(第I部): マルチトップ
 プロのプログラマーからのヒント(第2部): パラメータの保存とエキスパートアドバイザー、スクリプト、外部プログラム間での交換
- 無料取引アプリ
- 8千を超えるシグナルをコピー
- 金融ニュースで金融マーケットを探索
Artemさん、34までの記事を読みました。
その中で、あなたは保留要求を終了している、最後のビデオでは、注文を開き、TP SLを設定するために保留要求を行うことを示している、その後にTP SLが設定されますが、SLは秒後に削除されます。
Poganyalはパネルを突き、トリガーまたはストップが削除されるか、または取るときに、同時にポイントと時間の両方で保留中の要求を使用することはできません。
私は記事72からExpert Advisorをダウンロードし、それをチェックし、同じ問題は、最初のトリガーは、私が最後にパネルをクリックしたもの。
アルテム、あなたの記事を34まで読み終えたよ。
最後のビデオでは、注文をオープンし、TP SLを設定するためにペンディングリクエストを行い、その後TP SLが設定されますが、SLは1秒後に削除されます。
パネルの周りをうろうろしてみましたが、pipsと時間の両方で同時にpending requestを使うことはできず、トリガー時にストップが削除されるか、テイクアウトが削除されます。
72の記事からExpert Advisorをダウンロードして確認しましたが、同じ問題で、パネルで最後にクリックしたものが最初にトリガーされました。
ありがとう。時間があれば調べてみます。おそらく、一見すると、1つの保留中の要求がトリガーされると、他の要求が削除されます。時間があるときに調べてみます。いずれにせよ、ライブラリーはまだ改良の段階であり、このようなバグは存在する権利がある。重要なのは、関心のある人たちからのフィードバックがあることで、そうすればすべてが修正されるでしょう。
ありがとう。時間があるときに見てみます。おそらく、一見したところ、保留中のリクエストが1つトリガーされると、他のリクエストも削除されるのだと思います。時間があるときに見てみます。いずれにせよ、ライブラリーはまだ改良の段階であり、このようなバグは存在する権利がある。主なことは、関心のある人たちからフィードバックを得ることであり、そうすればすべてが修正されるだろう。
私は興味があります )))少なくとも、比喩的に、すべてがどのように整理され、それを使用する方法を理解するであろう記事でのみ数週間を読んで理解する...と私はまだ実際にどのくらい想像することはできません)。
私は長い間、モスクワの取引所で働く有能な記事と最も重要な本格的なOOPライブラリが出るのを待っていた。昨年、私は生活に追われていて、このリソースを訪問していませんでしたが、ここに来て、トップ素材のトンにぞっとしました。
この計画で人々の頭脳がどのように働くことができるのか、正直言って喜んでいます。
興味はあります)。少なくとも、すべての仕組みと使い方を比喩的に理解するために、2、3週間は記事だけを読んで理解しようと思う...そして、実際にはどれくらいかわからない)。
私は長い間、モスクワの取引所で働く有能な記事と最も重要な本格的なOOPライブラリが出るのを待っていました。昨年、私は生活に追われていて、このリソースを訪れませんでしたが、ここに来て、大量のトップ資料にぞっとしました。
この計画で人々の頭脳がどのように働くことができるのか、正直言って喜んでいます。
評価をありがとう。実は、これは日常的なことなんだ。
モスクワ取引所に関しては、ここでのすべてを徹底的にテストし、バグを特定する必要がある。FXのようにね。
鑑定ありがとう。本当にただの日常です。
モスクワ取引所に関しては、ここでのすべてを徹底的にテストし、バグを特定する必要がある。FXのようにね。
私はここまで読み終えて、ここですでに何が行われているかを確認します。私はスタック内のすべての戦略を持っているだけで、そのボリューム、アキュムレーションなどが必要です。もしライブラリがスタック、そのインデックス、価格、ボリュームを完全に扱うことを可能にするなら、私はあなたのライブラリ上で私のロボットを再構築し、すでにそれをテストします。
欠陥が見つかるかもしれない。
主なものは、あきらめないことです、コンテンツは素晴らしいです。