
Other classes in DoEasy library (Part 72): Tracking and recording chart object parameters in the collection

Contents
Concept
This article completes the description of chart object classes and their collection. All charts opened in the client terminal, as well as their subwindows and indicators, are already stored in the chart collection. In case of any changes in the chart properties, some events are already handled, while an appropriate custom event is sent to the control program chart. However, we are able to change the chart object or window properties and we need to set the new values of changed properties to the changed object parameters.
Fortunately, we already have the object endowing all its descendants with event functionality (the extended base object of all library objects). Our classes of chart objects and chart windows are already the object descendants. We only need to add the standard handling of changes of descendant object properties. The class will automatically update all properties of its descendant and create the list of events occurred to its descendant object in case the specified properties are changed.
All tracked properties we want to manage in our program should be specified for the object, so that events occurring in the object are created and sent to the control program chart. The extended base object allows setting the change value of the specified property or exceeding the specified threshold value for a tracked property or the combination of changes of tracked properties.
All changes implemented to the object properties are automatically set to its parameters. If tracking certain object properties is enabled, these properties will "signal" about the committed changes we want to track.
Almost all library objects have similar structure — a set of properties (integer, real and string ones), object sorting criteria that correspond exclusively to the properties of each individual object, some methods for finding and sorting such objects in the lists they are sorted in, the methods for describing object properties and the class that allows searching in the object list by the specified property and returning the object index in the list with the maximum or minimum value of the required property.
All these long descriptions of object properties, attached to the object itself and inextricably linked to it, slightly complicate the creation of the object itself but greatly simplify further work with it. This has turned out to be the case with the chart window object class as well. It has turned out initially incomplete (like all the main library objects), while I have simplified my task in order not to write all its properties separately, but place them in the properties of the chart object the window belongs to.
Now, when implementing an auto update of the properties of chart objects and their subwindows, we will encounter a big complication when saving the previous state of the properties of the chart window object using the methods of its parent class. Therefore, I have decided to make the chart window object a full-fledged library object greatly simplifying the implementation of its auto update with the search for tracked events (I have already done all this long ago when creating the parent class — the extended object of all library objects).
Improving library classes
In \MQL5\Include\DoEasy\Data.mqh, add the library's new message indices:
   MSG_LIB_TEXT_SYMBOL,                               // symbol:
   MSG_LIB_TEXT_ACCOUNT,                              // account:
   MSG_LIB_TEXT_CHART,                                // chart:
   MSG_LIB_TEXT_CHART_WND,                            // chart window:
   MSG_LIB_TEXT_PROP_VALUE,                           // Property value
...
   MSG_CHART_COLLECTION_CHART_OPENED,                 // Chart opened
   MSG_CHART_COLLECTION_CHART_CLOSED,                 // Chart closed

   MSG_CHART_COLLECTION_CHART_SYMB_CHANGED,           // Chart symbol changed
   MSG_CHART_COLLECTION_CHART_TF_CHANGED,             // Chart timeframe changed
   MSG_CHART_COLLECTION_CHART_SYMB_TF_CHANGED,        // Chart symbol and timeframe changed

  };
//+------------------------------------------------------------------+
and message texts corresponding to newly added indices:
   {"символа: ","symbol property: "},
   {"аккаунта: ","account property: "},
   {"чарта: ","chart property: "},
   {"окна чарта: ","chart window property: "},
   {"Значение свойства ","Value of the "},
...
   {"Открыт график","Open chart"},
   {"Закрыт график","Closed chart"},

   {"Изменён символ графика","Changed chart symbol"},
   {"Изменён таймфрейм графика","Changed chart timeframe"},
   {"Изменён символ и таймфрейм графика","Changed the symbol and timeframe of the chart"},

  };
//+---------------------------------------------------------------------+
In the collection list ID section of the \MQL5\Include\DoEasy\Defines.mqh file, add a new chart window list ID:
//--- Collection list IDs
#define COLLECTION_HISTORY_ID          (0x777A)                   // Historical collection list ID
#define COLLECTION_MARKET_ID           (0x777B)                   // Market collection list ID
#define COLLECTION_EVENTS_ID           (0x777C)                   // Event collection list ID
#define COLLECTION_ACCOUNT_ID          (0x777D)                   // Account collection list ID
#define COLLECTION_SYMBOLS_ID          (0x777E)                   // Symbol collection list ID
#define COLLECTION_SERIES_ID           (0x777F)                   // Timeseries collection list ID
#define COLLECTION_BUFFERS_ID          (0x7780)                   // Indicator buffer collection list ID
#define COLLECTION_INDICATORS_ID       (0x7781)                   // Indicator collection list ID
#define COLLECTION_INDICATORS_DATA_ID  (0x7782)                   // Indicator data collection list ID
#define COLLECTION_TICKSERIES_ID       (0x7783)                   // Tick series collection list ID
#define COLLECTION_MBOOKSERIES_ID      (0x7784)                   // DOM series collection list ID
#define COLLECTION_MQL5_SIGNALS_ID     (0x7785)                   // MQL5 signals collection list ID
#define COLLECTION_CHARTS_ID           (0x7786)                   // Chart collection list ID
#define COLLECTION_CHART_WND_ID        (0x7787)                   // Chart window list ID
//--- Pending request type IDs
These IDs allow us to define the collection or the list a certain object belongs to. In this case, the ID allows us to define the object an event has arrived from and create the event description. All this is done in the class of the extended base object of all library objects.
In the previous article, I have implemented handling some chart events. Today, I will add a change of a symbol and a timeframe to them.
To do this, set three additional constants in the enumeration of possible chart events in the same file:
//+------------------------------------------------------------------+
//| Data for working with charts                                     |
//+------------------------------------------------------------------+
//+------------------------------------------------------------------+
//| List of possible chart events                                    |
//+------------------------------------------------------------------+
enum ENUM_CHART_OBJ_EVENT
  {
   CHART_OBJ_EVENT_NO_EVENT = SIGNAL_MQL5_EVENTS_NEXT_CODE, // No event
   CHART_OBJ_EVENT_CHART_OPEN,                        // "New chart opening" event
   CHART_OBJ_EVENT_CHART_CLOSE,                       // "Chart closure" event
   CHART_OBJ_EVENT_CHART_SYMB_CHANGE,                 // "Chart symbol changed" event
   CHART_OBJ_EVENT_CHART_SYMB_TF_CHANGE,              // "Chart symbol and timeframe changed" event
   CHART_OBJ_EVENT_CHART_TF_CHANGE,                   // "Chart timeframe changed" event
   CHART_OBJ_EVENT_CHART_WND_ADD,                     // "Adding a new window on the chart" event
   CHART_OBJ_EVENT_CHART_WND_DEL,                     // "Removing a window from the chart" event
   CHART_OBJ_EVENT_CHART_WND_IND_ADD,                 // "Adding a new indicator to the chart window" event
   CHART_OBJ_EVENT_CHART_WND_IND_DEL,                 // "Removing an indicator from the chart window" event
   CHART_OBJ_EVENT_CHART_WND_IND_CHANGE,              // "Changing indicator parameters in the chart window" event
  };
#define CHART_OBJ_EVENTS_NEXT_CODE  (CHART_OBJ_EVENT_CHART_WND_IND_CHANGE+1)  // The code of the next event after the last chart event code
//+------------------------------------------------------------------+
Remove the chart window index from the enumeration of integer properties:
   CHART_PROP_WINDOW_NUM,                             // Chart window index
  };
this property belongs to the chart window object. Move some common properties of both the chart and its window to the end of the enumeration constant list:
//+------------------------------------------------------------------+
//| Chart integer property                                           |
//+------------------------------------------------------------------+
enum ENUM_CHART_PROP_INTEGER
  {
   CHART_PROP_ID = 0,                                 // Chart ID
   CHART_PROP_TIMEFRAME,                              // Chart timeframe
   CHART_PROP_SHOW,                                   // Price chart drawing
   CHART_PROP_IS_OBJECT,                              // Chart object (OBJ_CHART) identification attribute
   CHART_PROP_BRING_TO_TOP,                           // Show chart above all others
   CHART_PROP_CONTEXT_MENU,                           // Enable/disable access to the context menu using the right click
   CHART_PROP_CROSSHAIR_TOOL,                         // Enable/disable access to the Crosshair tool using the middle click
   CHART_PROP_MOUSE_SCROLL,                           // Scroll the chart horizontally using the left mouse button
   CHART_PROP_EVENT_MOUSE_WHEEL,                      // Send messages about mouse wheel events (CHARTEVENT_MOUSE_WHEEL) to all MQL5 programs on a chart
   CHART_PROP_EVENT_MOUSE_MOVE,                       // Send messages about mouse button click and movement events (CHARTEVENT_MOUSE_MOVE) to all MQL5 programs on a chart
   CHART_PROP_EVENT_OBJECT_CREATE,                    // Send messages about the graphical object creation event (CHARTEVENT_OBJECT_CREATE) to all MQL5 programs on a chart
   CHART_PROP_EVENT_OBJECT_DELETE,                    // Send messages about the graphical object destruction event (CHARTEVENT_OBJECT_DELETE) to all MQL5 programs on a chart
   CHART_PROP_MODE,                                   // Type of the chart (candlesticks, bars or line (ENUM_CHART_MODE))
   CHART_PROP_FOREGROUND,                             // Price chart in the foreground
   CHART_PROP_SHIFT,                                  // Mode of shift of the price chart from the right border
   CHART_PROP_AUTOSCROLL,                             // The mode of automatic shift to the right border of the chart
   CHART_PROP_KEYBOARD_CONTROL,                       // Allow managing the chart using a keyboard
   CHART_PROP_QUICK_NAVIGATION,                       // Allow the chart to intercept Space and Enter key strokes to activate the quick navigation bar
   CHART_PROP_SCALE,                                  // Scale
   CHART_PROP_SCALEFIX,                               // Fixed scale mode
   CHART_PROP_SCALEFIX_11,                            // 1:1 scale mode
   CHART_PROP_SCALE_PT_PER_BAR,                       // The mode of specifying the scale in points per bar
   CHART_PROP_SHOW_TICKER,                            // Display a symbol ticker in the upper left corner
   CHART_PROP_SHOW_OHLC,                              // Display OHLC values in the upper left corner
   CHART_PROP_SHOW_BID_LINE,                          // Display Bid value as a horizontal line on the chart
   CHART_PROP_SHOW_ASK_LINE,                          // Display Ask value as a horizontal line on a chart
   CHART_PROP_SHOW_LAST_LINE,                         // Display Last value as a horizontal line on a chart
   CHART_PROP_SHOW_PERIOD_SEP,                        // Display vertical separators between adjacent periods
   CHART_PROP_SHOW_GRID,                              // Display a grid on the chart
   CHART_PROP_SHOW_VOLUMES,                           // Display volumes on a chart
   CHART_PROP_SHOW_OBJECT_DESCR,                      // Display text descriptions of objects
   CHART_PROP_VISIBLE_BARS,                           // Number of bars on a chart that are available for display
   CHART_PROP_WINDOWS_TOTAL,                          // The total number of chart windows including indicator subwindows
   CHART_PROP_WINDOW_HANDLE,                          // Chart window handle
   CHART_PROP_FIRST_VISIBLE_BAR,                      // Number of the first visible bar on the chart
   CHART_PROP_WIDTH_IN_BARS,                          // Width of the chart in bars
   CHART_PROP_WIDTH_IN_PIXELS,                        // Width of the chart in pixels
   CHART_PROP_COLOR_BACKGROUND,                       // Color of background of the chart
   CHART_PROP_COLOR_FOREGROUND,                       // Color of axes, scale and OHLC line
   CHART_PROP_COLOR_GRID,                             // Grid color
   CHART_PROP_COLOR_VOLUME,                           // Color of volumes and position opening levels
   CHART_PROP_COLOR_CHART_UP,                         // Color for the up bar, shadows and body borders of bull candlesticks
   CHART_PROP_COLOR_CHART_DOWN,                       // Color of down bar, its shadow and border of body of the bullish candlestick
   CHART_PROP_COLOR_CHART_LINE,                       // Color of the chart line and the Doji candlesticks
   CHART_PROP_COLOR_CANDLE_BULL,                      // Color of body of a bullish candlestick
   CHART_PROP_COLOR_CANDLE_BEAR,                      // Color of body of a bearish candlestick
   CHART_PROP_COLOR_BID,                              // Color of the Bid price line
   CHART_PROP_COLOR_ASK,                              // Color of the Ask price line
   CHART_PROP_COLOR_LAST,                             // Color of the last performed deal's price line (Last)
   CHART_PROP_COLOR_STOP_LEVEL,                       // Color of stop order levels (Stop Loss and Take Profit)
   CHART_PROP_SHOW_TRADE_LEVELS,                      // Display trade levels on the chart (levels of open positions, Stop Loss, Take Profit and pending orders)
   CHART_PROP_DRAG_TRADE_LEVELS,                      // Enable the ability to drag trading levels on a chart using mouse
   CHART_PROP_SHOW_DATE_SCALE,                        // Display the time scale on a chart
   CHART_PROP_SHOW_PRICE_SCALE,                       // Display a price scale on a chart
   CHART_PROP_SHOW_ONE_CLICK,                         // Display the quick trading panel on the chart
   CHART_PROP_IS_MAXIMIZED,                           // Chart window maximized
   CHART_PROP_IS_MINIMIZED,                           // Chart window minimized
   CHART_PROP_IS_DOCKED,                              // Chart window docked
   CHART_PROP_FLOAT_LEFT,                             // Left coordinate of the undocked chart window relative to the virtual screen
   CHART_PROP_FLOAT_TOP,                              // Upper coordinate of the undocked chart window relative to the virtual screen
   CHART_PROP_FLOAT_RIGHT,                            // Right coordinate of the undocked chart window relative to the virtual screen
   CHART_PROP_FLOAT_BOTTOM,                           // Bottom coordinate of the undocked chart window relative to the virtual screen
   CHART_PROP_YDISTANCE,                              // Distance in Y axis pixels between the upper frame of the indicator subwindow and the upper frame of the chart main window
   CHART_PROP_HEIGHT_IN_PIXELS,                       // Height of the chart in pixels
   CHART_PROP_WINDOW_IND_HANDLE,                      // Indicator handle on the chart
   CHART_PROP_WINDOW_IND_INDEX,                       // Indicator index on the chart
  };
#define CHART_PROP_INTEGER_TOTAL (66)                 // Total number of integer properties
#define CHART_PROP_INTEGER_SKIP  (2)                  // Number of integer properties not used in sorting
//+------------------------------------------------------------------+
The number of the chart integer properties has decreased by 1 — set 66 instead of 67 and specify that the two last properties should not participate in search and sorting and, therefore, they are not displayed in the chart properties. These constants are necessary for the indicator object class in the chart window (it is also made in a simplified version).
The changes implemented into the chart property enumerations should correspond to the changes in the enumeration of the chart object sorting criteria:
//+------------------------------------------------------------------+
//| Possible chart sorting criteria                                  |
//+------------------------------------------------------------------+
#define FIRST_CHART_DBL_PROP  (CHART_PROP_INTEGER_TOTAL-CHART_PROP_INTEGER_SKIP)
#define FIRST_CHART_STR_PROP  (CHART_PROP_INTEGER_TOTAL-CHART_PROP_INTEGER_SKIP+CHART_PROP_DOUBLE_TOTAL-CHART_PROP_DOUBLE_SKIP)
enum ENUM_SORT_CHART_MODE
  {
//--- Sort by integer properties
   SORT_BY_CHART_ID = 0,                              // Sort by chart ID
   SORT_BY_CHART_TIMEFRAME,                           // Sort by chart timeframe
   SORT_BY_CHART_SHOW,                                // Sort by the price chart drawing attribute
   SORT_BY_CHART_IS_OBJECT,                           // Sort by chart object (OBJ_CHART) identification attribute
   SORT_BY_CHART_BRING_TO_TOP,                        // Sort by the flag of displaying a chart above all others
   SORT_BY_CHART_CONTEXT_MENU,                        // Sort by the flag of enabling/disabling access to the context menu using the right click
   SORT_BY_CHART_CROSSHAIR_TOO,                       // Sort by the flag of enabling/disabling access to the Crosshair tool using the middle click
   SORT_BY_CHART_MOUSE_SCROLL,                        // Sort by the flag of scrolling the chart horizontally using the left mouse button
   SORT_BY_CHART_EVENT_MOUSE_WHEEL,                   // Sort by the flag of sending messages about mouse wheel events to all MQL5 programs on a chart
   SORT_BY_CHART_EVENT_MOUSE_MOVE,                    // Sort by the flag of sending messages about mouse button click and movement events to all MQL5 programs on a chart
   SORT_BY_CHART_EVENT_OBJECT_CREATE,                 // Sort by the flag of sending messages about the graphical object creation event to all MQL5 programs on a chart
   SORT_BY_CHART_EVENT_OBJECT_DELETE,                 // Sort by the flag of sending messages about the graphical object destruction event to all MQL5 programs on a chart
   SORT_BY_CHART_MODE,                                // Sort by chart type
   SORT_BY_CHART_FOREGROUND,                          // Sort by the "Price chart in the foreground" flag
   SORT_BY_CHART_SHIFT,                               // Sort by the "Mode of shift of the price chart from the right border" flag
   SORT_BY_CHART_AUTOSCROLL,                          // Sort by the "The mode of automatic shift to the right border of the chart" flag
   SORT_BY_CHART_KEYBOARD_CONTROL,                    // Sort by the flag allowing the chart management using a keyboard
   SORT_BY_CHART_QUICK_NAVIGATION,                    // Sort by the flag allowing the chart to intercept Space and Enter key strokes to activate the quick navigation bar
   SORT_BY_CHART_SCALE,                               // Sort by scale
   SORT_BY_CHART_SCALEFIX,                            // Sort by the fixed scale flag
   SORT_BY_CHART_SCALEFIX_11,                         // Sort by the 1:1 scale flag
   SORT_BY_CHART_SCALE_PT_PER_BAR,                    // Sort by the flag of specifying the scale in points per bar
   SORT_BY_CHART_SHOW_TICKER,                         // Sort by the flag displaying a symbol ticker in the upper left corner
   SORT_BY_CHART_SHOW_OHLC,                           // Sort by the flag displaying OHLC values in the upper left corner
   SORT_BY_CHART_SHOW_BID_LINE,                       // Sort by the flag displaying Bid value as a horizontal line on the chart
   SORT_BY_CHART_SHOW_ASK_LINE,                       // Sort by the flag displaying Ask value as a horizontal line on the chart
   SORT_BY_CHART_SHOW_LAST_LINE,                      // Sort by the flag displaying Last value as a horizontal line on the chart
   SORT_BY_CHART_SHOW_PERIOD_SEP,                     // Sort by the flag displaying vertical separators between adjacent periods
   SORT_BY_CHART_SHOW_GRID,                           // Sort by the flag of displaying a grid on the chart
   SORT_BY_CHART_SHOW_VOLUMES,                        // Sort by the mode of displaying volumes on a chart
   SORT_BY_CHART_SHOW_OBJECT_DESCR,                   // Sort by the flag of displaying object text descriptions
   SORT_BY_CHART_VISIBLE_BARS,                        // Sort by the number of bars on a chart that are available for display
   SORT_BY_CHART_WINDOWS_TOTAL,                       // Sort by the total number of chart windows including indicator subwindows
   SORT_BY_CHART_WINDOW_HANDLE,                       // Sort by the chart handle
   SORT_BY_CHART_FIRST_VISIBLE_BAR,                   // Sort by the number of the first visible bar on the chart
   SORT_BY_CHART_WIDTH_IN_BARS,                       // Sort by the width of the chart in bars
   SORT_BY_CHART_WIDTH_IN_PIXELS,                     // Sort by the width of the chart in pixels
   SORT_BY_CHART_COLOR_BACKGROUND,                    // Sort by the color of the chart background
   SORT_BY_CHART_COLOR_FOREGROUND,                    // Sort by color of axes, scale and OHLC line
   SORT_BY_CHART_COLOR_GRID,                          // Sort by grid color
   SORT_BY_CHART_COLOR_VOLUME,                        // Sort by the color of volumes and position opening levels
   SORT_BY_CHART_COLOR_CHART_UP,                      // Sort by the color for the up bar, shadows and body borders of bull candlesticks
   SORT_BY_CHART_COLOR_CHART_DOWN,                    // Sort by the color of down bar, its shadow and border of body of the bullish candlestick
   SORT_BY_CHART_COLOR_CHART_LINE,                    // Sort by the color of the chart line and the Doji candlesticks
   SORT_BY_CHART_COLOR_CANDLE_BULL,                   // Sort by the color of a bullish candlestick body
   SORT_BY_CHART_COLOR_CANDLE_BEAR,                   // Sort by the color of a bearish candlestick body
   SORT_BY_CHART_COLOR_BID,                           // Sort by the color of the Bid price line
   SORT_BY_CHART_COLOR_ASK,                           // Sort by the color of the Ask price line
   SORT_BY_CHART_COLOR_LAST,                          // Sort by the color of the last performed deal's price line (Last)
   SORT_BY_CHART_COLOR_STOP_LEVEL,                    // Sort by the color of stop order levels (Stop Loss and Take Profit)
   SORT_BY_CHART_SHOW_TRADE_LEVELS,                   // Sort by the flag of displaying trading levels on the chart
   SORT_BY_CHART_DRAG_TRADE_LEVELS,                   // Sort by the flag enabling the ability to drag trading levels on a chart using mouse
   SORT_BY_CHART_SHOW_DATE_SCALE,                     // Sort by the flag of displaying the time scale on the chart
   SORT_BY_CHART_SHOW_PRICE_SCALE,                    // Sort by the flag of displaying the price scale on the chart
   SORT_BY_CHART_SHOW_ONE_CLICK,                      // Sort by the flag of displaying the quick trading panel on the chart
   SORT_BY_CHART_IS_MAXIMIZED,                        // Sort by the "Chart window maximized" flag
   SORT_BY_CHART_IS_MINIMIZED,                        // Sort by the "Chart window minimized" flag
   SORT_BY_CHART_IS_DOCKED,                           // Sort by the "Chart window docked" flag
   SORT_BY_CHART_FLOAT_LEFT,                          // Sort by the left coordinate of the undocked chart window relative to the virtual screen
   SORT_BY_CHART_FLOAT_TOP,                           // Sort by the upper coordinate of the undocked chart window relative to the virtual screen
   SORT_BY_CHART_FLOAT_RIGHT,                         // Sort by the right coordinate of the undocked chart window relative to the virtual screen
   SORT_BY_CHART_FLOAT_BOTTOM,                        // Sort by the bottom coordinate of the undocked chart window relative to the virtual screen
   SORT_BY_CHART_YDISTANCE,                           // Sort by the distance in Y axis pixels between the upper frame of the indicator subwindow and the upper frame of the chart main window
   SORT_BY_CHART_HEIGHT_IN_PIXELS,                    // Sort by the height of the chart in pixels
//--- Sort by real properties
   SORT_BY_CHART_SHIFT_SIZE = FIRST_CHART_DBL_PROP,   // Sort by the shift size of the zero bar from the right border in %
   SORT_BY_CHART_FIXED_POSITION,                      // Sort by the chart fixed position from the left border in %
   SORT_BY_CHART_FIXED_MAX,                           // Sort by the fixed chart maximum
   SORT_BY_CHART_FIXED_MIN,                           // Sort by the fixed chart minimum
   SORT_BY_CHART_POINTS_PER_BAR,                      // Sort by the scale value in points per bar
   SORT_BY_CHART_PRICE_MIN,                           // Sort by the chart minimum
   SORT_BY_CHART_PRICE_MAX,                           // Sort by the chart maximum
//--- Sort by string properties
   SORT_BY_CHART_COMMENT = FIRST_CHART_STR_PROP,      // Sort by a comment text on the chart
   SORT_BY_CHART_EXPERT_NAME,                         // Sort by a name of an EA launched on the chart
   SORT_BY_CHART_SCRIPT_NAME,                         // Sort by a name of a script launched on the chart
   SORT_BY_CHART_INDICATOR_NAME,                      // Sort by a name of an indicator launched in the chart window
   SORT_BY_CHART_SYMBOL,                              // Sort by chart symbol
  };
//+------------------------------------------------------------------+
If we look closely at the criteria of sorting by integer properties, we will see that two last properties are missing because they are made unusable in sorting, so they should not be set here — each sorting criterion strictly corresponds to the numeric value of the constant from the enumeration of object properties by a certain property.
Since the chart object is now made full-fledged, the enumerations of its integer, real and string properties should be set for it:
//+------------------------------------------------------------------+
//| Data for handling chart windows                                  |
//+------------------------------------------------------------------+
//+------------------------------------------------------------------+
//| Chart window integer properties                                  |
//+------------------------------------------------------------------+
enum ENUM_CHART_WINDOW_PROP_INTEGER
  {
   CHART_WINDOW_PROP_ID = 0,                          // Chart ID
   CHART_WINDOW_PROP_WINDOW_NUM,                      // Chart window index
   CHART_WINDOW_PROP_YDISTANCE,                       // Distance in Y axis pixels between the upper frame of the indicator subwindow and the upper frame of the chart main window
   CHART_WINDOW_PROP_HEIGHT_IN_PIXELS,                // Height of the chart in pixels
   //--- for CWndInd
   CHART_WINDOW_PROP_WINDOW_IND_HANDLE,               // Indicator handle in the chart window
   CHART_WINDOW_PROP_WINDOW_IND_INDEX,                // Indicator index in the chart window
  };
#define CHART_WINDOW_PROP_INTEGER_TOTAL (6)           // Total number of integer properties
#define CHART_WINDOW_PROP_INTEGER_SKIP  (0)           // Number of integer DOM properties not used in sorting
//+------------------------------------------------------------------+
//| Chart window real properties                                     |
//+------------------------------------------------------------------+
enum ENUM_CHART_WINDOW_PROP_DOUBLE
  {
   CHART_WINDOW_PROP_PRICE_MIN = CHART_WINDOW_PROP_INTEGER_TOTAL, // Chart minimum
   CHART_WINDOW_PROP_PRICE_MAX,                       // Chart maximum
  };
#define CHART_WINDOW_PROP_DOUBLE_TOTAL  (2)           // Total number of real properties
#define CHART_WINDOW_PROP_DOUBLE_SKIP   (0)           // Number of real properties not used in sorting
//+------------------------------------------------------------------+
//| Chart window string properties                                   |
//+------------------------------------------------------------------+
enum ENUM_CHART_WINDOW_PROP_STRING
  {
   CHART_WINDOW_PROP_IND_NAME = (CHART_WINDOW_PROP_INTEGER_TOTAL+CHART_WINDOW_PROP_DOUBLE_TOTAL), // Name of the indicator launched in the window
   CHART_WINDOW_PROP_SYMBOL,                          // Chart symbol
  };
#define CHART_WINDOW_PROP_STRING_TOTAL  (2)           // Total number of string properties
//+------------------------------------------------------------------+
Finally, we need to add the enumeration of possible criteria of sorting chart window objects:
//+------------------------------------------------------------------+
//| Possible criteria of sorting chart windows                       |
//+------------------------------------------------------------------+
#define FIRST_CHART_WINDOW_DBL_PROP  (CHART_WINDOW_PROP_INTEGER_TOTAL-CHART_WINDOW_PROP_INTEGER_SKIP)
#define FIRST_CHART_WINDOW_STR_PROP  (CHART_WINDOW_PROP_INTEGER_TOTAL-CHART_WINDOW_PROP_INTEGER_SKIP+CHART_WINDOW_PROP_DOUBLE_TOTAL-CHART_WINDOW_PROP_DOUBLE_SKIP)
enum ENUM_SORT_CHART_WINDOW_MODE
  {
//--- Sort by integer properties
   SORT_BY_CHART_WINDOW_ID = 0,                       // Sort by chart ID
   SORT_BY_CHART_WINDOW_NUM,                          // Sort by chart window index
   SORT_BY_CHART_WINDOW_YDISTANCE,                    // Sort by the distance in Y axis pixels between the upper frame of the indicator subwindow and the upper frame of the chart main window
   SORT_BY_CHART_WINDOW_HEIGHT_IN_PIXELS,             // Sort by the height of the chart in pixels
   SORT_BY_CHART_WINDOW_IND_HANDLE,                   // Sort by the indicator handle in the chart window
   SORT_BY_CHART_WINDOW_IND_INDEX,                    // Sort by the indicator index in the chart window
//--- Sort by real properties
   SORT_BY_CHART_WINDOW_PRICE_MIN = FIRST_CHART_WINDOW_DBL_PROP,  // Sort by chart window minimum
   SORT_BY_CHART_WINDOW_PRICE_MAX,                    // Sort by chart window maximum
//--- Sort by string properties
   SORT_BY_CHART_WINDOW_IND_NAME = FIRST_CHART_WINDOW_STR_PROP,   // Sort by name of an indicator launched in the window
   SORT_BY_CHART_WINDOW_SYMBOL,                       // Sort by chart symbol
  };
//+------------------------------------------------------------------+
Now let's get back to the chart window object list ID. As you may remember, we need to improve the CBaseObjExt base extended object whose class has been set in the \MQL5\Include\DoEasy\Objects\BaseObj.mqh base object class file.
All we need to do in it is add handling two new lists in its EventDescription() method. The objects that are to be the descendants of the class (chart object and chart window object) belong to these lists:
//+------------------------------------------------------------------+
//| Return an object event description                               |
//+------------------------------------------------------------------+
string CBaseObjExt::EventDescription(const int property,
                                  const ENUM_BASE_EVENT_REASON reason,
                                  const int source,
                                  const string value,
                                  const string property_descr,
                                  const int digits)
  {
//--- Depending on the collection ID, create th object type description
   string type=
     (
      this.Type()==COLLECTION_SYMBOLS_ID     ? CMessage::Text(MSG_LIB_TEXT_SYMBOL)     :
      this.Type()==COLLECTION_ACCOUNT_ID     ?  CMessage::Text(MSG_LIB_TEXT_ACCOUNT)   :
      this.Type()==COLLECTION_CHARTS_ID      ?  CMessage::Text(MSG_LIB_TEXT_CHART)     :
      this.Type()==COLLECTION_CHART_WND_ID   ?  CMessage::Text(MSG_LIB_TEXT_CHART_WND) :
      ""
     );
//--- Depending on the property type, create the property change value description
   string level=
     (
      property<this.m_long_prop_total ?
      ::DoubleToString(this.GetControlledLongValueLEVEL(property),digits) :
      ::DoubleToString(this.GetControlledDoubleValueLEVEL(property),digits)
     );
//--- Depending on the event reason, create the event description text
   string res=
     (
      reason==BASE_EVENT_REASON_INC       ?  CMessage::Text(MSG_LIB_TEXT_PROP_VALUE)+type+property_descr+CMessage::Text(MSG_LIB_TEXT_INC_BY)+value    :
      reason==BASE_EVENT_REASON_DEC       ?  CMessage::Text(MSG_LIB_TEXT_PROP_VALUE)+type+property_descr+CMessage::Text(MSG_LIB_TEXT_DEC_BY)+value    :
      reason==BASE_EVENT_REASON_MORE_THEN ?  CMessage::Text(MSG_LIB_TEXT_PROP_VALUE)+type+property_descr+CMessage::Text(MSG_LIB_TEXT_MORE_THEN)+level :
      reason==BASE_EVENT_REASON_LESS_THEN ?  CMessage::Text(MSG_LIB_TEXT_PROP_VALUE)+type+property_descr+CMessage::Text(MSG_LIB_TEXT_LESS_THEN)+level :
      reason==BASE_EVENT_REASON_EQUALS    ?  CMessage::Text(MSG_LIB_TEXT_PROP_VALUE)+type+property_descr+CMessage::Text(MSG_LIB_TEXT_EQUAL)+level     :
      CMessage::Text(MSG_LIB_TEXT_BASE_OBJ_UNKNOWN_EVENT)+type
     );
//--- Return the object name+created event description text
   return this.m_name+": "+res;
  }
//+------------------------------------------------------------------+
Find out more about the class in the article 37.
I will now fix a drawback that went unnoticed during the development — I will improve the chart window object class making it a full-fledged class, like the classes of the main library objects. I need to add the arrays for storing the object properties, the methods for setting and returning its properties (the ready-made methods will be redone) and the methods for displaying data on object properties.
Open the \MQL5\Include\DoEasy\Objects\Chart\ChartWnd.mqh file and make the necessary corrections. The file also features the auxiliary class of the indicator object in the window. Since I have changed some properties of these objects, add the constants of new enumerations to the Compare() method of the CWndInd class:
//+------------------------------------------------------------------+
//| Compare CWndInd objects with each other by the specified property|
//+------------------------------------------------------------------+
int CWndInd::Compare(const CObject *node,const int mode=0) const
  {
   const CWndInd *obj_compared=node;
   if(mode==CHART_WINDOW_PROP_WINDOW_IND_HANDLE) return(this.Handle()>obj_compared.Handle() ? 1 : this.Handle()<obj_compared.Handle() ? -1 : 0);
   else if(mode==CHART_WINDOW_PROP_WINDOW_IND_INDEX) return(this.Index()>obj_compared.Index() ? 1 : this.Index()<obj_compared.Index() ? -1 : 0);
   return(this.Name()==obj_compared.Name() ? 0 : this.Name()<obj_compared.Name() ? -1 : 1);
  }
//+------------------------------------------------------------------+
Previously, these were the removed constants from the CHART_PROP_WINDOW_IND_HANDLE and CHART_PROP_WINDOW_IND_INDEX enumerations.
In the private section of the class, add the m_digits variable for storing Digits() of the chart symbol, arrays for storing integer, real and string properties, as well as the methods for returning the real index of the real and string properties in an appropriate array:
//+------------------------------------------------------------------+
//| Chart window object class                                        |
//+------------------------------------------------------------------+
class CChartWnd : public CBaseObjExt
  {
private:
   CArrayObj         m_list_ind;                                        // Indicator list
   CArrayObj        *m_list_ind_del;                                    // Pointer to the list of indicators removed from the indicator window
   CArrayObj        *m_list_ind_param;                                  // Pointer to the list of changed indicators
   long              m_long_prop[CHART_WINDOW_PROP_INTEGER_TOTAL];      // Integer properties
   double            m_double_prop[CHART_WINDOW_PROP_DOUBLE_TOTAL];     // Real properties
   string            m_string_prop[CHART_WINDOW_PROP_STRING_TOTAL];     // String properties
   int               m_digits;                                          // Symbol's Digits()
   int               m_wnd_coord_x;                                     // The X coordinate for the time on the chart in the window
   int               m_wnd_coord_y;                                     // The Y coordinate for the price on the chart in the window
//--- Return the index of the array the (1) double and (2) string properties are actually located at
   int               IndexProp(ENUM_CHART_WINDOW_PROP_DOUBLE property)  const { return(int)property-CHART_WINDOW_PROP_INTEGER_TOTAL;                                 }
   int               IndexProp(ENUM_CHART_WINDOW_PROP_STRING property)  const { return(int)property-CHART_WINDOW_PROP_INTEGER_TOTAL-CHART_WINDOW_PROP_DOUBLE_TOTAL;  }
In the public section of the class, set the methods for setting and returning the specified object properties:
public:
//--- Set object's (1) integer, (2) real and (3) string properties
   void              SetProperty(ENUM_CHART_WINDOW_PROP_INTEGER property,long value)   { this.m_long_prop[property]=value;                      }
   void              SetProperty(ENUM_CHART_WINDOW_PROP_DOUBLE property,double value)  { this.m_double_prop[this.IndexProp(property)]=value;    }
   void              SetProperty(ENUM_CHART_WINDOW_PROP_STRING property,string value)  { this.m_string_prop[this.IndexProp(property)]=value;    }
//--- Return object’s (1) integer, (2) real and (3) string property from the properties array
   long              GetProperty(ENUM_CHART_WINDOW_PROP_INTEGER property)        const { return this.m_long_prop[property];                     }
   double            GetProperty(ENUM_CHART_WINDOW_PROP_DOUBLE property)         const { return this.m_double_prop[this.IndexProp(property)];   }
   string            GetProperty(ENUM_CHART_WINDOW_PROP_STRING property)         const { return this.m_string_prop[this.IndexProp(property)];   }
//--- Return itself
   CChartWnd        *GetObject(void)                                                   { return &this;   }
All methods returning the flags of an object supporting the specified integer, real or string property return true — each of the properties is supported, while the methods returning the object property descriptions are simply declared here, while their implementation is set outside the class body (currently, the method returning the description of the real property return the "property not supported message" — its implementation will be moved outside the class body, since the other two have already been written):
//--- Return itself
   CChartWnd        *GetObject(void)                                                   { return &this;   }

//--- Return the flag of the object supporting this property
   virtual bool      SupportProperty(ENUM_CHART_WINDOW_PROP_INTEGER property)          { return true;    }
   virtual bool      SupportProperty(ENUM_CHART_WINDOW_PROP_DOUBLE property)           { return true;    }
   virtual bool      SupportProperty(ENUM_CHART_WINDOW_PROP_STRING property)           { return true;    }

//--- Get description of (1) integer, (2) real and (3) string properties
   string            GetPropertyDescription(ENUM_CHART_WINDOW_PROP_INTEGER property);
   string            GetPropertyDescription(ENUM_CHART_WINDOW_PROP_DOUBLE property);
   string            GetPropertyDescription(ENUM_CHART_WINDOW_PROP_STRING property);
Replace all "this.m_window_num" string instances with "this.WindowNum()" (without quotes, of course), since I have removed the m_window_num variable and the window index is now located in the object properties, we will return the property value using the WindowNum() method.
The WindowNum() method previously returned the m_window_num variable value:
int WindowNum(void) const { return this.m_window_num; }
Now the method will return the object property:
int WindowNum(void) const { return (int)this.GetProperty(CHART_WINDOW_PROP_WINDOW_NUM); }
Add two methods for returning real properties and fix the already existing ones for returning and setting the appropriate object properties rather than variables:
//--- Return (1) the subwindow index, (2) the number of indicators attached to the window, (3) the name of a symbol chart, as well as (4) the highest and (5) lowest prices
   int               WindowNum(void)                              const { return (int)this.GetProperty(CHART_WINDOW_PROP_WINDOW_NUM);     }
   int               IndicatorsTotal(void)                        const { return this.m_list_ind.Total();                                 }
   string            Symbol(void)                                 const { return this.GetProperty(CHART_WINDOW_PROP_SYMBOL);              }
   double            PriceMax(void)                               const { return this.GetProperty(CHART_WINDOW_PROP_PRICE_MAX);           }
   double            PriceMin(void)                               const { return this.GetProperty(CHART_WINDOW_PROP_PRICE_MIN);           }
//--- Set (1) the subwindow index and (2) the chart symbol
   void              SetWindowNum(const int num)                        { this.SetProperty(CHART_WINDOW_PROP_WINDOW_NUM,num);             }
   void              SetSymbol(const string symbol)                     { this.SetProperty(CHART_WINDOW_PROP_SYMBOL,symbol);              }
To implement the auto update of the properties of the object provided by the CBaseObjExt class, which is a parent one for the edited class, I need to make some fixes in its Refresh() methods. To arrange the event functionality, it would be good to add the methods for setting the values of tracked object properties and controlled property values to search for the moments of intersection of the specified tracked values by the values of object properties we manage.
It is possible not to implement these methods since the CBaseObjExt class already provides the ability to set the reference values and track properties. However, since the class is pretty versatile, its methods are quite abstract and we need to remember the names of the constants required to manage the properties. This is inconvenient. Therefore, the classes based on the CBaseObjExt extended object class receive the methods that explicitly indicate what exactly is set to the object.
So, at the very end of the class body listing, write the two code blocks for setting the tracked properties for the distance in pixels between window frames and for the chart window height in pixels:
//+------------------------------------------------------------------+
//| Get and set the parameters of tracked property changes           |
//+------------------------------------------------------------------+
//--- Distance in Y axis pixels between the upper frame of the indicator subwindow and the upper frame of the chart main window
//--- set the controlled (1) growth, (2) decrease, (3) reference distance level in pixels by the vertical Y axis between the window frames
//--- get (4) the distance change in pixels by the vertical Y axis between the window frames,
//--- get the distance change flag in pixels by the vertical Y axis between the window frames exceeding the (5) growth and (6) decrease values
   void              SetControlWindowYDistanceInc(const long value)        { this.SetControlledValueINC(CHART_WINDOW_PROP_YDISTANCE,(long)::fabs(value));         }
   void              SetControlWindowYDistanceDec(const long value)        { this.SetControlledValueDEC(CHART_WINDOW_PROP_YDISTANCE,(long)::fabs(value));         }
   void              SetControlWindowYDistanceLevel(const long value)      { this.SetControlledValueLEVEL(CHART_WINDOW_PROP_YDISTANCE,(long)::fabs(value));       }
   long              GetValueChangedWindowYDistance(void)            const { return this.GetPropLongChangedValue(CHART_WINDOW_PROP_YDISTANCE);                    }
   bool              IsIncreasedWindowYDistance(void)                const { return (bool)this.GetPropLongFlagINC(CHART_WINDOW_PROP_YDISTANCE);                   }
   bool              IsDecreasedWindowYDistance(void)                const { return (bool)this.GetPropLongFlagDEC(CHART_WINDOW_PROP_YDISTANCE);                   }

//--- Height of the chart in pixels
//--- setting the controlled spread (1) increase, (2) decrease value and (3) reference chart height in pixels
//--- get (4) the chart height change in pixels,
//--- get the flag of the chart height change in pixels exceeding (5) the growth and (6) decrease values
   void              SetControlHeightInPixelsInc(const long value)         { this.SetControlledValueINC(CHART_WINDOW_PROP_HEIGHT_IN_PIXELS,(long)::fabs(value));   }
   void              SetControlHeightInPixelsDec(const long value)         { this.SetControlledValueDEC(CHART_WINDOW_PROP_HEIGHT_IN_PIXELS,(long)::fabs(value));   }
   void              SetControlHeightInPixelsLevel(const long value)       { this.SetControlledValueLEVEL(CHART_WINDOW_PROP_HEIGHT_IN_PIXELS,(long)::fabs(value)); }
   long              GetValueChangedHeightInPixels(void)             const { return this.GetPropLongChangedValue(CHART_WINDOW_PROP_HEIGHT_IN_PIXELS);              }
   bool              IsIncreasedHeightInPixels(void)                 const { return (bool)this.GetPropLongFlagINC(CHART_WINDOW_PROP_HEIGHT_IN_PIXELS);             }
   bool              IsDecreasedHeightInPixels(void)                 const { return (bool)this.GetPropLongFlagDEC(CHART_WINDOW_PROP_HEIGHT_IN_PIXELS);             }

  };
//+------------------------------------------------------------------+
Now we are able to set the necessary tracked values for these properties, and the library will automatically track them and send events occurred to these properties to the control program chart where we can handle them. All that was considered in detail when creating the base extended object of all library objects.
The parametric constructor of the class has undergone changes:
//+------------------------------------------------------------------+
//| Parametric constructor                                           |
//+------------------------------------------------------------------+
CChartWnd::CChartWnd(const long chart_id,const int wnd_num,const string symbol,CArrayObj *list_ind_del,CArrayObj *list_ind_param) : m_wnd_coord_x(0),m_wnd_coord_y(0)
  {
   this.m_digits=(int)::SymbolInfoInteger(symbol,SYMBOL_DIGITS);
   this.m_list_ind_del=list_ind_del;
   this.m_list_ind_param=list_ind_param;
   CBaseObj::SetChartID(chart_id);
   this.m_type=COLLECTION_CHART_WND_ID;

//--- Initialize base object data arrays
   this.SetControlDataArraySizeLong(CHART_WINDOW_PROP_INTEGER_TOTAL);
   this.SetControlDataArraySizeDouble(CHART_WINDOW_PROP_DOUBLE_TOTAL);
   this.ResetChangesParams();
   this.ResetControlsParams();

//--- Set object properties
   this.SetProperty(CHART_WINDOW_PROP_WINDOW_NUM,wnd_num);
   this.SetProperty(CHART_WINDOW_PROP_SYMBOL,symbol);
   this.SetProperty(CHART_WINDOW_PROP_ID,chart_id);
   this.SetProperty(CHART_WINDOW_PROP_YDISTANCE,::ChartGetInteger(chart_id,CHART_WINDOW_YDISTANCE,wnd_num));
   this.SetProperty(CHART_WINDOW_PROP_HEIGHT_IN_PIXELS,::ChartGetInteger(chart_id,CHART_HEIGHT_IN_PIXELS,wnd_num));
   this.SetProperty(CHART_WINDOW_PROP_PRICE_MIN,::ChartGetDouble(chart_id,CHART_PRICE_MIN,wnd_num));
   this.SetProperty(CHART_WINDOW_PROP_PRICE_MAX,::ChartGetDouble(chart_id,CHART_PRICE_MAX,wnd_num));
   this.m_name=this.Header();

//--- Fill in the symbol current data
   for(int i=0;i<CHART_WINDOW_PROP_INTEGER_TOTAL;i++)
      this.m_long_prop_event[i][3]=this.m_long_prop[i];
   for(int i=0;i<CHART_WINDOW_PROP_DOUBLE_TOTAL;i++)
      this.m_double_prop_event[i][3]=this.m_double_prop[i];
//--- Update the base object data and search for changes
   CBaseObjExt::Refresh();

//--- Create the indicator list
   this.IndicatorsListCreate();
  }
//+------------------------------------------------------------------+
Here we get Digits() of the chart symbol (for displaying the data) and set the object type equal to the chart window object list ID.
In the block of initializing the arrays of the base object data, set the size of the current object arrays (storing the object data during the last check) for the base object arrays and reset all values to zero.
In the block setting the object properties, write all the necessary chart data to the object parameters.
In the block of filling in the current symbol data, write all the data set in the object properties to the base object arrays.
In the block of updating data in the base object and searching for changes, fill in the base object arrays with the current object data and compare them with the previous state. If the property tracking flags are set, check if this is a manageable situation. If the check is positive, create a basic event and place it to the list of base object events.
In the method of comparing two chart window objects, replace all removed enumeration constants with new ones:
//+------------------------------------------------------------------+
//| Compare CChartWnd objects with each other by a specified property|
//+------------------------------------------------------------------+
int CChartWnd::Compare(const CObject *node,const int mode=0) const
  {
   const CChartWnd *obj_compared=node;
   if(mode==CHART_WINDOW_PROP_YDISTANCE)
      return(this.YDistance()>obj_compared.YDistance() ? 1 : this.YDistance()<obj_compared.YDistance() ? -1 : 0);
   else if(mode==CHART_WINDOW_PROP_HEIGHT_IN_PIXELS)
      return(this.HeightInPixels()>obj_compared.HeightInPixels() ? 1 : this.HeightInPixels()<obj_compared.HeightInPixels() ? -1 : 0);
   else if(mode==CHART_WINDOW_PROP_WINDOW_NUM)
      return(this.WindowNum()>obj_compared.WindowNum() ? 1 : this.WindowNum()<obj_compared.WindowNum() ? -1 : 0);
   else if(mode==CHART_WINDOW_PROP_SYMBOL)
      return(this.Symbol()==obj_compared.Symbol() ? 0 : this.Symbol()>obj_compared.Symbol() ? 1 : -1);
   return -1;
  }
//+------------------------------------------------------------------+
In the method returning the description of the object integer property, replace the enumeration constants with new ones and add returning the description of new properties:
//+------------------------------------------------------------------+
//| Return description of object's integer property                  |
//+------------------------------------------------------------------+
string CChartWnd::GetPropertyDescription(ENUM_CHART_WINDOW_PROP_INTEGER property)
  {
   return
     (
      property==CHART_WINDOW_PROP_ID  ?  CMessage::Text(MSG_CHART_OBJ_ID)+
         (!this.SupportProperty(property) ?  ": "+CMessage::Text(MSG_LIB_PROP_NOT_SUPPORTED) :
          ": "+(string)CBaseObj::GetChartID()
         )  :
      property==CHART_WINDOW_PROP_WINDOW_NUM  ?  CMessage::Text(MSG_CHART_OBJ_WINDOW_N)+
         (!this.SupportProperty(property) ?  ": "+CMessage::Text(MSG_LIB_PROP_NOT_SUPPORTED) :
          ": "+(string)this.WindowNum()
         )  :
      property==CHART_WINDOW_PROP_YDISTANCE  ?  CMessage::Text(MSG_CHART_OBJ_WINDOW_YDISTANCE)+
         (!this.SupportProperty(property) ?  ": "+CMessage::Text(MSG_LIB_PROP_NOT_SUPPORTED) :
          ": "+(string)this.YDistance()
         )  :
      property==CHART_WINDOW_PROP_HEIGHT_IN_PIXELS  ?  CMessage::Text(MSG_CHART_OBJ_HEIGHT_IN_PIXELS)+
         (!this.SupportProperty(property) ?  ": "+CMessage::Text(MSG_LIB_PROP_NOT_SUPPORTED) :
          ": "+(string)this.HeightInPixels()
         )  :
      ""
     );
  }
//+------------------------------------------------------------------+
Implement the method returning the description of the object real property:
//+------------------------------------------------------------------+
//| Return description of object's real property                     |
//+------------------------------------------------------------------+
string CChartWnd::GetPropertyDescription(ENUM_CHART_WINDOW_PROP_DOUBLE property)
  {
   return
     (
      property==CHART_WINDOW_PROP_PRICE_MIN  ?  CMessage::Text(MSG_CHART_OBJ_PRICE_MIN)+
         (!this.SupportProperty(property) ?  ": "+CMessage::Text(MSG_LIB_PROP_NOT_SUPPORTED) :
          ": "+::DoubleToString(this.PriceMin(),this.m_digits)
         )  :
      property==CHART_WINDOW_PROP_PRICE_MAX  ?  CMessage::Text(MSG_CHART_OBJ_PRICE_MAX)+
         (!this.SupportProperty(property) ?  ": "+CMessage::Text(MSG_LIB_PROP_NOT_SUPPORTED) :
          ": "+::DoubleToString(this.PriceMax(),this.m_digits)
         )  :
      ""
     );
  }
//+------------------------------------------------------------------+
In the method returning the description of the object string property, replace the enumeration constants with new ones:
//+------------------------------------------------------------------+
//| Return description of object's string property                   |
//+------------------------------------------------------------------+
string CChartWnd::GetPropertyDescription(ENUM_CHART_WINDOW_PROP_STRING property)
  {
   return
     (
      property==CHART_WINDOW_PROP_SYMBOL  ?  CMessage::Text(MSG_LIB_PROP_SYMBOL)+
         (!this.SupportProperty(property) ?  ": "+CMessage::Text(MSG_LIB_PROP_NOT_SUPPORTED) :
          ": "+this.Symbol()
         )  :
      ""
     );
  }
//+------------------------------------------------------------------+
The method displaying the journal of object properties also features changes in the enumeration constants, while the code block responsible for displaying the object real properties has been uncommented (previously, the code block inside the loop was commented out but not removed from the method):
//+------------------------------------------------------------------+
//| Display object properties in the journal                         |
//+------------------------------------------------------------------+
void CChartWnd::Print(const bool full_prop=false)
  {
   ::Print("============= ",CMessage::Text(MSG_LIB_PARAMS_LIST_BEG)," (",this.Header(),") =============");
   int beg=0, end=CHART_WINDOW_PROP_INTEGER_TOTAL;
   for(int i=beg; i<end; i++)
     {
      ENUM_CHART_WINDOW_PROP_INTEGER prop=(ENUM_CHART_WINDOW_PROP_INTEGER)i;
      if(prop==CHART_WINDOW_PROP_WINDOW_IND_HANDLE || prop==CHART_WINDOW_PROP_WINDOW_IND_INDEX) continue;
      if(!full_prop && !this.SupportProperty(prop)) continue;
      ::Print(this.GetPropertyDescription(prop));
     }
   ::Print("------");
   beg=end; end+=CHART_WINDOW_PROP_DOUBLE_TOTAL;
   for(int i=beg; i<end; i++)
     {
      ENUM_CHART_WINDOW_PROP_DOUBLE prop=(ENUM_CHART_WINDOW_PROP_DOUBLE)i;
      if(!full_prop && !this.SupportProperty(prop)) continue;
      ::Print(this.GetPropertyDescription(prop));
     }
   beg=end; end+=CHART_WINDOW_PROP_STRING_TOTAL;
   for(int i=beg; i<end; i++)
     {
      ENUM_CHART_WINDOW_PROP_STRING prop=(ENUM_CHART_WINDOW_PROP_STRING)i;
      if(prop==CHART_WINDOW_PROP_IND_NAME)
        {
         this.PrintIndicators();
         continue;
        }
      if(!full_prop && !this.SupportProperty(prop)) continue;
      ::Print(this.GetPropertyDescription(prop));
     }
   ::Print("============= ",CMessage::Text(MSG_LIB_PARAMS_LIST_END)," (",this.Header(),") =============\n");
  }
//+------------------------------------------------------------------+
In the method displaying the description of window parameters in the journal, add displaying the new parameters and change the constants with new ones:
//+------------------------------------------------------------------+
//| Display the description of the window parameters in the journal  |
//+------------------------------------------------------------------+
void CChartWnd::PrintParameters(const bool dash=false)
  {
   string header=
     (
      this.WindowNum()==0 ? CMessage::Text(MSG_CHART_OBJ_CHART_WINDOW) :
      CMessage::Text(MSG_CHART_OBJ_CHART_SUBWINDOW)+" "+(string)this.WindowNum()
     );
   ::Print((dash ? " " : ""),header,":");
   string pref=(dash ? " - " : "");
   if(this.WindowNum()>0)
      ::Print(pref,GetPropertyDescription(CHART_WINDOW_PROP_YDISTANCE));
   ::Print(pref,GetPropertyDescription(CHART_WINDOW_PROP_HEIGHT_IN_PIXELS));
   ::Print(pref,GetPropertyDescription(CHART_WINDOW_PROP_PRICE_MAX));
   ::Print(pref,GetPropertyDescription(CHART_WINDOW_PROP_PRICE_MIN));
  }
//+------------------------------------------------------------------+
Improve the method of updating the chart window data. We need to add the initialization of event data (variables) and the code block handling the change of object parameters in case there were no other changes (adding to the window or removing the indicator from the window).
//+------------------------------------------------------------------+
//| Update data on attached indicators                               |
//+------------------------------------------------------------------+
void CChartWnd::Refresh(void)
  {
   //--- Initialize event data
   this.m_is_event=false;
   this.m_hash_sum=0;
   //--- Calculate the change of the indicator number in the "now and during the previous check" window
   int change=::ChartIndicatorsTotal(this.m_chart_id,this.WindowNum())-this.m_list_ind.Total();
   //--- If there is no change in the number of indicators in the window,
   if(change==0)
     {
      //--- check the change of parameters of all indicators and exit
      this.IndicatorsChangeCheck();
      //--- Update integer properties
      this.SetProperty(CHART_WINDOW_PROP_YDISTANCE,::ChartGetInteger(this.m_chart_id,CHART_WINDOW_YDISTANCE,this.WindowNum()));
      this.SetProperty(CHART_WINDOW_PROP_HEIGHT_IN_PIXELS,::ChartGetInteger(this.m_chart_id,CHART_HEIGHT_IN_PIXELS,this.WindowNum()));
      //--- Update real properties
      this.SetProperty(CHART_WINDOW_PROP_PRICE_MIN,::ChartGetDouble(this.m_chart_id,CHART_PRICE_MIN,this.WindowNum()));
      this.SetProperty(CHART_WINDOW_PROP_PRICE_MAX,::ChartGetDouble(this.m_chart_id,CHART_PRICE_MAX,this.WindowNum()));
      //--- Update string properties
      string symbol=::ChartSymbol(this.m_chart_id);
      if(symbol!=NULL)
         this.SetProperty(CHART_WINDOW_PROP_SYMBOL,symbol);

      //--- Fill in the current symbol data
      for(int i=0;i<CHART_WINDOW_PROP_INTEGER_TOTAL;i++)
         this.m_long_prop_event[i][3]=this.m_long_prop[i];
      for(int i=0;i<CHART_WINDOW_PROP_DOUBLE_TOTAL;i++)
         this.m_double_prop_event[i][3]=this.m_double_prop[i];

      //--- Update the base object data, search for changes and exit
      CBaseObjExt::Refresh();
      this.CheckEvents();
      return;
     }
   //--- If indicators are added
   if(change>0)
     {
      //--- Call the method of adding new indicators to the list
      this.IndicatorsAdd();
      //--- In the loop by the number of indicators added to the window,
      for(int i=0;i<change;i++)
        {
         //--- get the new indicator in the list by the index calculated from the end of the list
         int index=this.m_list_ind.Total()-(1+i);
         //--- and if failed to obtain the object, move on to the next one
         CWndInd *ind=this.m_list_ind.At(index);
         if(ind==NULL)
            continue;
         //--- call the method of sending an event to the control program chart
         this.SendEvent(CHART_OBJ_EVENT_CHART_WND_IND_ADD);
        }
     }
   //--- If there are removed indicators
   if(change<0)
     {
      //--- Call the method of removing unnecessary indicators from the list
      this.IndicatorsDelete();
      //--- In the loop by the number of indicators removed from the window,
      for(int i=0;i<-change;i++)
        {
         //--- get a new removed indicator in the list of removed indicators by index calculated from the end of the list
         int index=this.m_list_ind_del.Total()-(1+i);
         //--- and if failed to obtain the object, move on to the next one
         CWndInd *ind=this.m_list_ind_del.At(index);
         if(ind==NULL)
            continue;
         //--- call the method of sending an event to the control program chart
         this.SendEvent(CHART_OBJ_EVENT_CHART_WND_IND_DEL);
        }
     }
  }
//+------------------------------------------------------------------+
Here all is described in the code block comments. The details were considered when describing the improvement of the parametric constructor. This is almost the same thing.
This concludes the conversion of the chart window object class into a full-fledged library object.
Now let's improve the chart object class in \MQL5\Include\DoEasy\Objects\Chart\ChartObj.mqh.
In the private section of the class, add new variables for storing the previous symbol and the chart timeframe, as well as the variable for storing the last event:
//+------------------------------------------------------------------+
//| Chart object class                                               |
//+------------------------------------------------------------------+
class CChartObj : public CBaseObjExt
  {
private:
   CArrayObj         m_list_wnd;                                  // List of chart window objects
   CArrayObj        *m_list_wnd_del;                              // Pointer to the list of chart window objects
   CArrayObj        *m_list_ind_del;                              // Pointer to the list of indicators removed from the indicator window
   CArrayObj        *m_list_ind_param;                            // Pointer to the list of changed indicators
   long              m_long_prop[CHART_PROP_INTEGER_TOTAL];       // Integer properties
   double            m_double_prop[CHART_PROP_DOUBLE_TOTAL];      // Real properties
   string            m_string_prop[CHART_PROP_STRING_TOTAL];      // String properties
   string            m_symbol_prev;                               // Previous chart symbol
   ENUM_TIMEFRAMES   m_timeframe_prev;                            // Previous timeframe
   int               m_digits;                                    // Symbol's Digits()
   int               m_last_event;                                // The last event
   datetime          m_wnd_time_x;                                // Time for X coordinate on the windowed chart
   double            m_wnd_price_y;                               // Price for Y coordinate on the windowed chart
We need to fill in the chart data in the chart update method, and they are also filled in in the class constructor. The chart object has multiple properties. To avoid the same type of code in different methods, move it to separate methods and call the methods where the object properties should be filled in with the chart data. Declare them in the private class section:
//--- The methods of setting property values
   bool              SetMode(const string source,const ENUM_CHART_MODE mode,const bool redraw=false);
   bool              SetScale(const string source,const int scale,const bool redraw=false);
   bool              SetModeVolume(const string source,const ENUM_CHART_VOLUME_MODE mode,const bool redraw=false);
   void              SetVisibleBars(void);
   void              SetWindowsTotal(void);
   void              SetFirstVisibleBars(void);
   void              SetWidthInBars(void);
   void              SetWidthInPixels(void);
   void              SetMaximizedFlag(void);
   void              SetMinimizedFlag(void);
   void              SetExpertName(void);
   void              SetScriptName(void);

//--- Fill in (1) integer, (2) real and (3) string object properties
   bool              SetIntegerParameters(void);
   void              SetDoubleParameters(void);
   bool              SetStringParameters(void);

//--- (1) Create, (2) check and re-create the chart window list
   void              CreateWindowsList(void);
   void              RecreateWindowsList(const int change);
//--- Add an extension to the screenshot file if it is missing
   string            FileNameWithExtention(const string filename);

public:
All methods returning the flags indicating the object supports a certain property should return true:
//--- Return the indicator by index from the specified chart window
   CWndInd          *GetIndicator(const int win_num,const int ind_index);

//--- Return the flag of the object supporting this property
   virtual bool      SupportProperty(ENUM_CHART_PROP_INTEGER property)           { return true; }
   virtual bool      SupportProperty(ENUM_CHART_PROP_DOUBLE property)            { return true; }
   virtual bool      SupportProperty(ENUM_CHART_PROP_STRING property)            { return true; }

//--- Get description of (1) integer, (2) real and (3) string properties
   string            GetPropertyDescription(ENUM_CHART_PROP_INTEGER property);
   string            GetPropertyDescription(ENUM_CHART_PROP_DOUBLE property);
   string            GetPropertyDescription(ENUM_CHART_PROP_STRING property);
Previously, the method, returning the flag indicating an integer property, returned false in case the property is a distance between chart window frames in pixels.
Add three public methods that are necessary for working with the parent class event functionality:
//--- Return (1) the flag event, (2) the last event code and (3) the last event
   bool              IsEvent(void)                                   const { return this.m_is_event;                                      }
   int               GetLastEventsCode(void)                         const { return this.m_event_code;                                    }
   int               GetLastEvent(void)                              const { return this.m_last_event;                                    }

//--- Constructors
                     CChartObj(){;}
                     CChartObj(const long chart_id,CArrayObj *list_wnd_del,CArrayObj *list_ind_del,CArrayObj *list_ind_param);
//+------------------------------------------------------------------+
In the block of methods for a simplified access to the object properties, add the method returning the flag indicating that the chart window is in the foreground:
//--- (1) Return, (2) enable, (3) disable docking the chart window
   bool              IsDocked(void)                                  const { return (bool)this.GetProperty(CHART_PROP_IS_DOCKED);         }
   bool              SetDockedON(const bool redraw=false)                  { return this.SetDockedFlag(DFUN,true,redraw); }
   bool              SetDockedOFF(const bool redraw=false)                 { return this.SetDockedFlag(DFUN,false,redraw); }

//--- (1) Return, (2) enable and (3) disable the display of the chart above all others
   bool              IsBringTop(void)                                      { return (bool)this.GetProperty(CHART_PROP_BRING_TO_TOP);      }
   bool              SetBringToTopON(const bool redraw=false)              { return this.SetBringToTopFlag(DFUN,true,redraw);             }
   bool              SetBringToTopOFF(const bool redraw=false)             { return this.SetBringToTopFlag(DFUN,false,redraw);            }

//--- (1) Return, set the chart type (2) bars, (3) candles, (4) line
   ENUM_CHART_MODE   Mode(void)                                      const { return (ENUM_CHART_MODE)this.GetProperty(CHART_PROP_MODE);   }
   bool              SetModeBars(const bool redraw=false)                  { return this.SetMode(DFUN,CHART_BARS,redraw);                 }
   bool              SetModeCandles(const bool redraw=false)               { return this.SetMode(DFUN,CHART_CANDLES,redraw);              }
   bool              SetModeLine(const bool redraw=false)                  { return this.SetMode(DFUN,CHART_LINE,redraw);                 }
The method returns the CHART_BRING_TO_TOP flag.
In the help, this property is marked as "write-only" (w/o), while the example shows that it is possible to set the necessary chart as active without permitting to read its status. However, in reality, this property can also be read allowing us to find out which chart is currently active. Either this is a mistake in the help, or it is an undocumented feature (which is highly undesirable), but in fact it still works. If it suddenly becomes impossible to read the chart property (in accordance with the help), it will be more difficult to quickly get the currently active chart. A custom solution will be necessary.
At the very end of the class listing, write the methods for setting tracked values of the object monitored properties for the parent class.
Write all the properties (both integer and real ones). However, not all of them will have the status control methods. I will consider if some object properties should really be controlled. Anyway, all properties are set in the comments and it is always possible to add new ones:
//+------------------------------------------------------------------+ //| Get and set the parameters of tracked property changes | //+------------------------------------------------------------------+ //CHART_PROP_ID = 0, // Chart ID //--- Chart timeframe //--- setting the chart timeframe (1) increase, (2) decrease controlled value and (3) reference level //--- getting (4) the chart timeframe change value, //--- getting the chart timeframe change flag increasing the (5) growth and (6) decrease values void SetControlTimeframeInc(const long value) { this.SetControlledValueINC(CHART_PROP_TIMEFRAME,(long)::fabs(value)); } void SetControlTimeframeDec(const long value) { this.SetControlledValueDEC(CHART_PROP_TIMEFRAME,(long)::fabs(value)); } void SetControlTimeframeLevel(const long value) { this.SetControlledValueLEVEL(CHART_PROP_TIMEFRAME,(long)::fabs(value)); } long GetValueChangedTimeframe(void) const { return this.GetPropLongChangedValue(CHART_PROP_TIMEFRAME); } bool IsIncreasedTimeframe(void) const { return (bool)this.GetPropLongFlagINC(CHART_PROP_TIMEFRAME); } bool IsDecreasedTimeframe(void) const { return (bool)this.GetPropLongFlagDEC(CHART_PROP_TIMEFRAME); } //CHART_PROP_SHOW // Price chart drawing //CHART_PROP_IS_OBJECT, // Chart object (OBJ_CHART) identification attribute //CHART_PROP_BRING_TO_TOP, // Show the chart above all others //CHART_PROP_CONTEXT_MENU, // Enable/disable access to the context menu using the right click //CHART_PROP_CROSSHAIR_TOOL, // Enable/disable access to the Crosshair tool using the middle click //CHART_PROP_MOUSE_SCROLL, // Scroll the chart horizontally using the left mouse button //CHART_PROP_EVENT_MOUSE_WHEEL, // Send messages about mouse wheel events (CHARTEVENT_MOUSE_WHEEL) to all MQL5 programs on a chart //CHART_PROP_EVENT_MOUSE_MOVE, // Send messages about mouse button click and movement events (CHARTEVENT_MOUSE_MOVE) to all MQL5 programs on a chart //CHART_PROP_EVENT_OBJECT_CREATE, // Send messages about the graphical object creation event (CHARTEVENT_OBJECT_CREATE) to all MQL5 programs on a chart //CHART_PROP_EVENT_OBJECT_DELETE, // Send messages about the graphical object destruction event (CHARTEVENT_OBJECT_DELETE) to all MQL5 programs on a chart //--- Type of the chart (candlesticks, bars or line (ENUM_CHART_MODE)) //--- setting the chart timeframe (1) increase, (2) decrease controlled value and (3) reference level //--- getting (4) the chart timeframe change value, //--- getting the chart timeframe change flag increasing the (5) growth and (6) decrease values void SetControlChartModeInc(const long value) { this.SetControlledValueINC(CHART_PROP_MODE,(long)::fabs(value)); } void SetControlChartModeDec(const long value) { this.SetControlledValueDEC(CHART_PROP_MODE,(long)::fabs(value)); } void SetControlChartModeLevel(const long value) { this.SetControlledValueLEVEL(CHART_PROP_MODE,(long)::fabs(value)); } long GetValueChangedChartMode(void) const { return this.GetPropLongChangedValue(CHART_PROP_MODE); } bool IsIncreasedChartMode(void) const { return (bool)this.GetPropLongFlagINC(CHART_PROP_MODE); } bool IsDecreasedChartMode(void) const { return (bool)this.GetPropLongFlagDEC(CHART_PROP_MODE); } //CHART_PROP_FOREGROUND, // Price chart in the foreground //CHART_PROP_SHIFT, // Mode of shift of the price chart from the right border //CHART_PROP_AUTOSCROLL, // The mode of automatic shift to the right border of the chart //CHART_PROP_KEYBOARD_CONTROL, // Allow managing the chart using a keyboard //CHART_PROP_QUICK_NAVIGATION, // Allow the chart to intercept Space and Enter key strokes to activate the quick navigation bar //CHART_PROP_SCALE, // Scale //CHART_PROP_SCALEFIX, // Fixed scale mode //CHART_PROP_SCALEFIX_11, // 1:1 scale mode //CHART_PROP_SCALE_PT_PER_BAR, // The mode of specifying the scale in points per bar //CHART_PROP_SHOW_TICKER, // Display a symbol ticker in the upper left corner //CHART_PROP_SHOW_OHLC, // Display OHLC values in the upper left corner //CHART_PROP_SHOW_BID_LINE, // Display Bid value as a horizontal line on the chart //CHART_PROP_SHOW_ASK_LINE, // Display Ask value as a horizontal line on a chart //CHART_PROP_SHOW_LAST_LINE, // Display Last value as a horizontal line on a chart //CHART_PROP_SHOW_PERIOD_SEP, // Display vertical separators between adjacent periods //CHART_PROP_SHOW_GRID, // Display a grid on the chart //CHART_PROP_SHOW_VOLUMES, // Display volumes on a chart //CHART_PROP_SHOW_OBJECT_DESCR, // Display text descriptions of objects //CHART_PROP_VISIBLE_BARS, // Number of bars on a chart that are available for display //CHART_PROP_WINDOWS_TOTAL, // The total number of chart windows including indicator subwindows //CHART_PROP_WINDOW_HANDLE, // Chart window handle //CHART_PROP_WINDOW_YDISTANCE ////--- Distance in Y axis pixels between the upper frame of the indicator subwindow and the upper frame of the chart main window ////--- set the controlled (1) growth, (2) decrease, (3) reference distance level in pixels by the vertical Y axis between the window frames ////--- get (4) the distance change in pixels by the vertical Y axis between the window frames, ////--- get the distance change flag in pixels by the vertical Y axis between the window frames exceeding the (5) growth and (6) decrease values // void SetControlWindowYDistanceInc(const long value) { this.SetControlledValueINC(CHART_PROP_WINDOW_YDISTANCE,(long)::fabs(value)); } // void SetControlWindowYDistanceDec(const long value) { this.SetControlledValueDEC(CHART_PROP_WINDOW_YDISTANCE,(long)::fabs(value)); } // void SetControlWindowYDistanceLevel(const long value) { this.SetControlledValueLEVEL(CHART_PROP_WINDOW_YDISTANCE,(long)::fabs(value)); } // long GetValueChangedWindowYDistance(void) const { return this.GetPropLongChangedValue(CHART_PROP_WINDOW_YDISTANCE); } // bool IsIncreasedWindowYDistance(void) const { return (bool)this.GetPropLongFlagINC(CHART_PROP_WINDOW_YDISTANCE); } // bool IsDecreasedWindowYDistance(void) const { return (bool)this.GetPropLongFlagDEC(CHART_PROP_WINDOW_YDISTANCE); } //CHART_PROP_FIRST_VISIBLE_BAR, // Number of the first visible bar on the chart //--- Width of the chart in bars //--- setting the controlled spread (1) increase, (2) decrease value and (3) reference chart width in bars //--- getting (4) the chart width change value in bars, //--- get the flag of the chart width change in bars exceeding (5) the growth and (6) decrease values void SetControlWidthInBarsInc(const long value) { this.SetControlledValueINC(CHART_PROP_WIDTH_IN_BARS,(long)::fabs(value)); } void SetControlWidthInBarsDec(const long value) { this.SetControlledValueDEC(CHART_PROP_WIDTH_IN_BARS,(long)::fabs(value)); } void SetControlWidthInBarsLevel(const long value) { this.SetControlledValueLEVEL(CHART_PROP_WIDTH_IN_BARS,(long)::fabs(value)); } long GetValueChangedWidthInBars(void) const { return this.GetPropLongChangedValue(CHART_PROP_WIDTH_IN_BARS); } bool IsIncreasedWidthInBars(void) const { return (bool)this.GetPropLongFlagINC(CHART_PROP_WIDTH_IN_BARS); } bool IsDecreasedWidthInBars(void) const { return (bool)this.GetPropLongFlagDEC(CHART_PROP_WIDTH_IN_BARS); } //--- Chart width in pixels //--- setting the controlled spread (1) increase, (2) decrease value and (3) reference chart width in pixels //--- getting (4) the chart width change value in pixels, //--- get the flag of the chart width change in pixels exceeding (5) the growth and (6) decrease values void SetControlWidthInPixelsInc(const long value) { this.SetControlledValueINC(CHART_PROP_WIDTH_IN_PIXELS,(long)::fabs(value)); } void SetControlWidthInPixelsDec(const long value) { this.SetControlledValueDEC(CHART_PROP_WIDTH_IN_PIXELS,(long)::fabs(value)); } void SetControlWidthInPixelsLevel(const long value) { this.SetControlledValueLEVEL(CHART_PROP_WIDTH_IN_PIXELS,(long)::fabs(value)); } long GetValueChangedWidthInPixels(void) const { return this.GetPropLongChangedValue(CHART_PROP_WIDTH_IN_PIXELS); } bool IsIncreasedWidthInPixels(void) const { return (bool)this.GetPropLongFlagINC(CHART_PROP_WIDTH_IN_PIXELS); } bool IsDecreasedWidthInPixels(void) const { return (bool)this.GetPropLongFlagDEC(CHART_PROP_WIDTH_IN_PIXELS); } //--- Chart height in pixels //--- setting the controlled spread (1) increase, (2) decrease value and (3) reference chart height in pixels //--- get (4) the chart height change in pixels, //--- get the flag of the chart height change in pixels exceeding (5) the growth and (6) decrease values void SetControlHeightInPixelsInc(const long value) { this.SetControlledValueINC(CHART_PROP_HEIGHT_IN_PIXELS,(long)::fabs(value)); } void SetControlHeightInPixelsDec(const long value) { this.SetControlledValueDEC(CHART_PROP_HEIGHT_IN_PIXELS,(long)::fabs(value)); } void SetControlHeightInPixelsLevel(const long value) { this.SetControlledValueLEVEL(CHART_PROP_HEIGHT_IN_PIXELS,(long)::fabs(value)); } long GetValueChangedHeightInPixels(void) const { return this.GetPropLongChangedValue(CHART_PROP_HEIGHT_IN_PIXELS); } bool IsIncreasedHeightInPixels(void) const { return (bool)this.GetPropLongFlagINC(CHART_PROP_HEIGHT_IN_PIXELS); } bool IsDecreasedHeightInPixels(void) const { return (bool)this.GetPropLongFlagDEC(CHART_PROP_HEIGHT_IN_PIXELS); } //CHART_PROP_COLOR_BACKGROUND, // Chart background color //CHART_PROP_COLOR_FOREGROUND, // Color of axes, scale and OHLC line //CHART_PROP_COLOR_GRID, // Grid color //CHART_PROP_COLOR_VOLUME, // Color of volumes and position opening levels //CHART_PROP_COLOR_CHART_UP, // Color for the up bar, shadows and body borders of bull candlesticks //CHART_PROP_COLOR_CHART_DOWN, // Color of down bar, its shadow and border of body of the bullish candlestick //CHART_PROP_COLOR_CHART_LINE, // Color of the chart line and the Doji candlesticks //CHART_PROP_COLOR_CANDLE_BULL, // Bullish candlestick body color //CHART_PROP_COLOR_CANDLE_BEAR, // Bearish candlestick body color //CHART_PROP_COLOR_BID, // Color of the Bid price line //CHART_PROP_COLOR_ASK, // Color of the Ask price line //CHART_PROP_COLOR_LAST, // Color of the last performed deal's price line (Last) //CHART_PROP_COLOR_STOP_LEVEL, // Color of stop order levels (Stop Loss and Take Profit) //CHART_PROP_SHOW_TRADE_LEVELS, // Display trade levels on the chart (levels of open positions, Stop Loss, Take Profit and pending orders) //CHART_PROP_DRAG_TRADE_LEVELS, // Enable the ability to drag trading levels on a chart using mouse //CHART_PROP_SHOW_DATE_SCALE, // Display the time scale on a chart //CHART_PROP_SHOW_PRICE_SCALE, // Display a price scale on a chart //CHART_PROP_SHOW_ONE_CLICK, // Display the quick trading panel on the chart //CHART_PROP_IS_MAXIMIZED, // Chart window maximized //CHART_PROP_IS_MINIMIZED, // Chart window minimized //CHART_PROP_IS_DOCKED, // Chart window docked //--- The left coordinate of the undocked chart window relative to the virtual screen //--- setting the controlled spread (1) increase, (2) decrease value and (3) reference level of the left coordinate of the undocked chart relative to the virtual screen //--- getting (4) the change value of the left coordinate of the undocked chart relative to the virtual screen, //--- getting the flag of changing the left coordinate of the undocked chart relative to the virtual screen exceeding the (5) increase and (6) decrease values void SetControlFloatLeftInc(const long value) { this.SetControlledValueINC(CHART_PROP_FLOAT_LEFT,(long)::fabs(value)); } void SetControlFloatLeftDec(const long value) { this.SetControlledValueDEC(CHART_PROP_FLOAT_LEFT,(long)::fabs(value)); } void SetControlFloatLeftLevel(const long value) { this.SetControlledValueLEVEL(CHART_PROP_FLOAT_LEFT,(long)::fabs(value)); } long GetValueChangedFloatLeft(void) const { return this.GetPropLongChangedValue(CHART_PROP_FLOAT_LEFT); } bool IsIncreasedFloatLeft(void) const { return (bool)this.GetPropLongFlagINC(CHART_PROP_FLOAT_LEFT); } bool IsDecreasedFloatLeft(void) const { return (bool)this.GetPropLongFlagDEC(CHART_PROP_FLOAT_LEFT); } //--- Upper coordinate of the undocked chart window relative to the virtual screen //--- setting the controlled spread (1) increase, (2) decrease value and (3) reference level of the upper coordinate of the undocked chart relative to the virtual screen //--- getting (4) the change value of the upper coordinate of the undocked chart relative to the virtual screen, //--- getting the flag of changing the upper coordinate of the undocked chart relative to the virtual screen exceeding the (5) increase and (6) decrease values void SetControlFloatTopInc(const long value) { this.SetControlledValueINC(CHART_PROP_FLOAT_TOP,(long)::fabs(value)); } void SetControlFloatTopDec(const long value) { this.SetControlledValueDEC(CHART_PROP_FLOAT_TOP,(long)::fabs(value)); } void SetControlFloatTopLevel(const long value) { this.SetControlledValueLEVEL(CHART_PROP_FLOAT_TOP,(long)::fabs(value)); } long GetValueChangedFloatTop(void) const { return this.GetPropLongChangedValue(CHART_PROP_FLOAT_TOP); } bool IsIncreasedFloatTop(void) const { return (bool)this.GetPropLongFlagINC(CHART_PROP_FLOAT_TOP); } bool IsDecreasedFloatTop(void) const { return (bool)this.GetPropLongFlagDEC(CHART_PROP_FLOAT_TOP); } //--- The right coordinate of the undocked chart window relative to the virtual screen //--- setting the controlled spread (1) increase, (2) decrease value and (3) reference level of the right coordinate of the undocked chart relative to the virtual screen //--- getting (4) the change value of the right coordinate of the undocked chart relative to the virtual screen, //--- getting the flag of changing the right coordinate of the undocked chart relative to the virtual screen exceeding the (5) increase and (6) decrease values void SetControlFloatRightInc(const long value) { this.SetControlledValueINC(CHART_PROP_FLOAT_RIGHT,(long)::fabs(value)); } void SetControlFloatRightDec(const long value) { this.SetControlledValueDEC(CHART_PROP_FLOAT_RIGHT,(long)::fabs(value)); } void SetControlFloatRightLevel(const long value) { this.SetControlledValueLEVEL(CHART_PROP_FLOAT_RIGHT,(long)::fabs(value)); } long GetValueChangedFloatRight(void) const { return this.GetPropLongChangedValue(CHART_PROP_FLOAT_RIGHT); } bool IsIncreasedFloatRight(void) const { return (bool)this.GetPropLongFlagINC(CHART_PROP_FLOAT_RIGHT); } bool IsDecreasedFloatRight(void) const { return (bool)this.GetPropLongFlagDEC(CHART_PROP_FLOAT_RIGHT); } //--- The bottom coordinate of the undocked chart window relative to the virtual screen //--- setting the controlled spread (1) increase, (2) decrease value and (3) reference level of the lower coordinate of the undocked chart relative to the virtual screen //--- getting (4) the change value of the lower coordinate of the undocked chart relative to the virtual screen, //--- getting the flag of changing the lower coordinate of the undocked chart relative to the virtual screen exceeding the (5) increase and (6) decrease values void SetControlFloatBottomInc(const long value) { this.SetControlledValueINC(CHART_PROP_FLOAT_BOTTOM,(long)::fabs(value)); } void SetControlFloatBottomDec(const long value) { this.SetControlledValueDEC(CHART_PROP_FLOAT_BOTTOM,(long)::fabs(value)); } void SetControlFloatBottomLevel(const long value) { this.SetControlledValueLEVEL(CHART_PROP_FLOAT_BOTTOM,(long)::fabs(value)); } long GetValueChangedFloatBottom(void) const { return this.GetPropLongChangedValue(CHART_PROP_FLOAT_BOTTOM); } bool IsIncreasedFloatBottom(void) const { return (bool)this.GetPropLongFlagINC(CHART_PROP_FLOAT_BOTTOM); } bool IsDecreasedFloatBottom(void) const { return (bool)this.GetPropLongFlagDEC(CHART_PROP_FLOAT_BOTTOM); } //--- Shift size of the zero bar from the right border in % //--- setting (1) increase, (2) decrease and (3) reference level of the shift size of the zero bar from the right border in % //--- getting (4) the change value of the shift of the zero bar from the right border in %, //--- getting the flag of the change value of the shift of the zero bar from the right border in % exceeding (5) the growth and (6) decrease values void SetControlShiftSizeInc(const long value) { this.SetControlledValueINC(CHART_PROP_SHIFT_SIZE,(long)::fabs(value)); } void SetControlShiftSizeDec(const long value) { this.SetControlledValueDEC(CHART_PROP_SHIFT_SIZE,(long)::fabs(value)); } void SetControlShiftSizeLevel(const long value) { this.SetControlledValueLEVEL(CHART_PROP_SHIFT_SIZE,(long)::fabs(value)); } double GetValueChangedShiftSize(void) const { return this.GetPropDoubleChangedValue(CHART_PROP_SHIFT_SIZE); } bool IsIncreasedShiftSize(void) const { return (bool)this.GetPropLongFlagINC(CHART_PROP_SHIFT_SIZE); } bool IsDecreasedShiftSize(void) const { return (bool)this.GetPropLongFlagDEC(CHART_PROP_SHIFT_SIZE); } //--- Chart fixed position from the left border in % //--- setting (1) increase, (2) decrease and (3) reference level of the chart fixed position from the left border in % //--- getting (4) the change value of the chart fixed position from the left border in %, //--- getting the flag of changing the chart fixed position from the left border in % more than by the (5) increase and (6) decrease values void SetControlFixedPositionInc(const long value) { this.SetControlledValueINC(CHART_PROP_FIXED_POSITION,(long)::fabs(value)); } void SetControlFixedPositionDec(const long value) { this.SetControlledValueDEC(CHART_PROP_FIXED_POSITION,(long)::fabs(value)); } void SetControlFixedPositionLevel(const long value) { this.SetControlledValueLEVEL(CHART_PROP_FIXED_POSITION,(long)::fabs(value)); } double GetValueChangedFixedPosition(void) const { return this.GetPropDoubleChangedValue(CHART_PROP_FIXED_POSITION); } bool IsIncreasedFixedPosition(void) const { return (bool)this.GetPropLongFlagINC(CHART_PROP_FIXED_POSITION); } bool IsDecreasedFixedPosition(void) const { return (bool)this.GetPropLongFlagDEC(CHART_PROP_FIXED_POSITION); } //--- Fixed chart maximum //--- setting the fixed chart maximum (1) increase, (2) decrease controlled value and (3) reference level //--- getting (4) the change value of the fixed chart maximum, //--- getting the flag of changing the position of the fixed chart maximum by more than (5) increase and (6) decrease values void SetControlFixedMaxInc(const long value) { this.SetControlledValueINC(CHART_PROP_FIXED_MAX,(long)::fabs(value)); } void SetControlFixedMaxDec(const long value) { this.SetControlledValueDEC(CHART_PROP_FIXED_MAX,(long)::fabs(value)); } void SetControlFixedMaxLevel(const long value) { this.SetControlledValueLEVEL(CHART_PROP_FIXED_MAX,(long)::fabs(value)); } double GetValueChangedFixedMax(void) const { return this.GetPropDoubleChangedValue(CHART_PROP_FIXED_MAX); } bool IsIncreasedFixedMax(void) const { return (bool)this.GetPropLongFlagINC(CHART_PROP_FIXED_MAX); } bool IsDecreasedFixedMax(void) const { return (bool)this.GetPropLongFlagDEC(CHART_PROP_FIXED_MAX); } //--- Fixed chart minimum //--- setting the fixed chart minimum (1) increase, (2) decrease controlled value and (3) reference level //--- getting (4) the change value of the fixed chart minimum, //--- getting the flag of changing the position of the fixed chart minimum by more than (5) increase and (6) decrease values void SetControlFixedMinInc(const long value) { this.SetControlledValueINC(CHART_PROP_FIXED_MIN,(long)::fabs(value)); } void SetControlFixedMinDec(const long value) { this.SetControlledValueDEC(CHART_PROP_FIXED_MIN,(long)::fabs(value)); } void SetControlFixedMinLevel(const long value) { this.SetControlledValueLEVEL(CHART_PROP_FIXED_MIN,(long)::fabs(value)); } double GetValueChangedFixedMin(void) const { return this.GetPropDoubleChangedValue(CHART_PROP_FIXED_MIN); } bool IsIncreasedFixedMin(void) const { return (bool)this.GetPropLongFlagINC(CHART_PROP_FIXED_MIN); } bool IsDecreasedFixedMin(void) const { return (bool)this.GetPropLongFlagDEC(CHART_PROP_FIXED_MIN); } //CHART_PROP_POINTS_PER_BAR, // Scale in points per bar //--- Chart minimum //--- setting the chart minimum (1) increase, (2) decrease controlled value and (3) reference level //--- getting (4) the change value of the chart minimum, //--- getting the flag of changing the position of the chart minimum by more than (5) increase and (6) decrease values void SetControlPriceMinInc(const long value) { this.SetControlledValueINC(CHART_PROP_PRICE_MIN,(long)::fabs(value)); } void SetControlPriceMinDec(const long value) { this.SetControlledValueDEC(CHART_PROP_PRICE_MIN,(long)::fabs(value)); } void SetControlPriceMinLevel(const long value) { this.SetControlledValueLEVEL(CHART_PROP_PRICE_MIN,(long)::fabs(value)); } double GetValueChangedPriceMin(void) const { return this.GetPropDoubleChangedValue(CHART_PROP_PRICE_MIN); } bool IsIncreasedPriceMin(void) const { return (bool)this.GetPropLongFlagINC(CHART_PROP_PRICE_MIN); } bool IsDecreasedPriceMin(void) const { return (bool)this.GetPropLongFlagDEC(CHART_PROP_PRICE_MIN); } //--- Chart maximum //--- setting the chart maximum (1) increase, (2) decrease controlled value and (3) reference level //--- getting (4) the change value of the chart maximum, //--- getting the flag of changing the position of the chart maximum by more than (5) increase and (6) decrease values void SetControlPriceMaxInc(const long value) { this.SetControlledValueINC(CHART_PROP_PRICE_MAX,(long)::fabs(value)); } void SetControlPriceMaxDec(const long value) { this.SetControlledValueDEC(CHART_PROP_PRICE_MAX,(long)::fabs(value)); } void SetControlPriceMaxLevel(const long value) { this.SetControlledValueLEVEL(CHART_PROP_PRICE_MAX,(long)::fabs(value)); } double GetValueChangedPriceMax(void) const { return this.GetPropDoubleChangedValue(CHART_PROP_PRICE_MAX); } bool IsIncreasedPriceMax(void) const { return (bool)this.GetPropLongFlagINC(CHART_PROP_PRICE_MAX); } bool IsDecreasedPriceMax(void) const { return (bool)this.GetPropLongFlagDEC(CHART_PROP_PRICE_MAX); } }; //+------------------------------------------------------------------+
The methods allow you to quickly set the object properties whose values should be controlled and the events should be sent to the control program chart when exceeding controlled increase/decrease property values.
The class constructor was changed in the same way as in the previously considered chart window object class:
//+------------------------------------------------------------------+
//| Parametric constructor                                           |
//+------------------------------------------------------------------+
CChartObj::CChartObj(const long chart_id,CArrayObj *list_wnd_del,CArrayObj *list_ind_del,CArrayObj *list_ind_param) : m_wnd_time_x(0),m_wnd_price_y(0)
  {
   this.m_list_wnd_del=list_wnd_del;
   this.m_list_ind_del=list_ind_del;
   this.m_list_ind_param=list_ind_param;
//--- Set the chart ID to the base object and set the chart object ID
   CBaseObj::SetChartID(chart_id);
   this.m_type=COLLECTION_CHARTS_ID;

//--- Initialize base object data arrays
   this.SetControlDataArraySizeLong(CHART_PROP_INTEGER_TOTAL);
   this.SetControlDataArraySizeDouble(CHART_PROP_DOUBLE_TOTAL);
   this.ResetChangesParams();
   this.ResetControlsParams();

//--- Chart ID
   this.SetProperty(CHART_PROP_ID,chart_id);
//--- Set integer properties
   this.SetIntegerParameters();
//--- Set real properties
   this.SetDoubleParameters();
//--- Set string properties
   this.SetStringParameters();
//--- Initialize variables and lists
   this.m_digits=(int)::SymbolInfoInteger(this.Symbol(),SYMBOL_DIGITS);
   this.m_list_wnd_del.Sort(SORT_BY_CHART_WINDOW_NUM);
   this.CreateWindowsList();
   this.m_symbol_prev=this.Symbol();
   this.m_timeframe_prev=this.Timeframe();
   this.m_name=this.Header();

//--- Fill in the current chart data
   for(int i=0;i<CHART_PROP_INTEGER_TOTAL;i++)
      this.m_long_prop_event[i][3]=this.m_long_prop[i];
   for(int i=0;i<CHART_PROP_DOUBLE_TOTAL;i++)
      this.m_double_prop_event[i][3]=this.m_double_prop[i];

//--- Update the base object data and search for changes
   CBaseObjExt::Refresh();
  }
//+------------------------------------------------------------------+
Here the chart parameter values are set in the object properties using three special methods:
The method filling in integer object properties:
//+------------------------------------------------------------------+
//| Fill in integer object properties                                |
//+------------------------------------------------------------------+
bool CChartObj::SetIntegerParameters(void)
  {
   ENUM_TIMEFRAMES timeframe=::ChartPeriod(this.ID());
   if(timeframe==0)
      return false;
   this.SetProperty(CHART_PROP_TIMEFRAME,timeframe);                                                     // Chart timeframe
   this.SetProperty(CHART_PROP_SHOW,::ChartGetInteger(this.ID(),CHART_SHOW));                            // Price chart drawing attribute
   this.SetProperty(CHART_PROP_IS_OBJECT,::ChartGetInteger(this.ID(),CHART_IS_OBJECT));                  // Chart object identification attribute
   this.SetProperty(CHART_PROP_BRING_TO_TOP,::ChartGetInteger(this.ID(),CHART_BRING_TO_TOP));            // Show the chart above all others
   this.SetProperty(CHART_PROP_CONTEXT_MENU,::ChartGetInteger(this.ID(),CHART_CONTEXT_MENU));            // Access to the context menu using the right click
   this.SetProperty(CHART_PROP_CROSSHAIR_TOOL,::ChartGetInteger(this.ID(),CHART_CROSSHAIR_TOOL));        // Access the Crosshair tool by pressing the middle mouse button
   this.SetProperty(CHART_PROP_MOUSE_SCROLL,::ChartGetInteger(this.ID(),CHART_MOUSE_SCROLL));            // Scroll the chart horizontally using the left mouse button
   this.SetProperty(CHART_PROP_EVENT_MOUSE_WHEEL,::ChartGetInteger(this.ID(),CHART_EVENT_MOUSE_WHEEL));  // Send messages about mouse wheel events to all MQL5 programs on a chart
   this.SetProperty(CHART_PROP_EVENT_MOUSE_MOVE,::ChartGetInteger(this.ID(),CHART_EVENT_MOUSE_MOVE));    // Send messages about mouse button click and movement events to all MQL5 programs on a chart
   this.SetProperty(CHART_PROP_EVENT_OBJECT_CREATE,::ChartGetInteger(this.ID(),CHART_EVENT_OBJECT_CREATE)); // Send messages about the graphical object creation event to all MQL5 programs on a chart
   this.SetProperty(CHART_PROP_EVENT_OBJECT_DELETE,::ChartGetInteger(this.ID(),CHART_EVENT_OBJECT_DELETE)); // Send messages about the graphical object destruction event to all MQL5 programs on a chart
   this.SetProperty(CHART_PROP_MODE,::ChartGetInteger(this.ID(),CHART_MODE));                            // Type of the chart (candlesticks, bars or line)
   this.SetProperty(CHART_PROP_FOREGROUND,::ChartGetInteger(this.ID(),CHART_FOREGROUND));                // Price chart in the foreground
   this.SetProperty(CHART_PROP_SHIFT,::ChartGetInteger(this.ID(),CHART_SHIFT));                          // Mode of shift of the price chart from the right border
   this.SetProperty(CHART_PROP_AUTOSCROLL,::ChartGetInteger(this.ID(),CHART_AUTOSCROLL));                // The mode of automatic shift to the right border of the chart
   this.SetProperty(CHART_PROP_KEYBOARD_CONTROL,::ChartGetInteger(this.ID(),CHART_KEYBOARD_CONTROL));    // Allow managing the chart using a keyboard
   this.SetProperty(CHART_PROP_QUICK_NAVIGATION,::ChartGetInteger(this.ID(),CHART_QUICK_NAVIGATION));    // Allow the chart to intercept Space and Enter key strokes to activate the quick navigation bar
   this.SetProperty(CHART_PROP_SCALE,::ChartGetInteger(this.ID(),CHART_SCALE));                          // Scale
   this.SetProperty(CHART_PROP_SCALEFIX,::ChartGetInteger(this.ID(),CHART_SCALEFIX));                    // Fixed scale mode
   this.SetProperty(CHART_PROP_SCALEFIX_11,::ChartGetInteger(this.ID(),CHART_SCALEFIX_11));              // 1:1 scale mode
   this.SetProperty(CHART_PROP_SCALE_PT_PER_BAR,::ChartGetInteger(this.ID(),CHART_SCALE_PT_PER_BAR));    // Mode for specifying the scale in points per bar
   this.SetProperty(CHART_PROP_SHOW_TICKER,::ChartGetInteger(this.ID(),CHART_SHOW_TICKER));              // Display a symbol ticker in the upper left corner
   this.SetProperty(CHART_PROP_SHOW_OHLC,::ChartGetInteger(this.ID(),CHART_SHOW_OHLC));                  // Display OHLC values in the upper left corner
   this.SetProperty(CHART_PROP_SHOW_BID_LINE,::ChartGetInteger(this.ID(),CHART_SHOW_BID_LINE));          // Display Bid value as a horizontal line on the chart
   this.SetProperty(CHART_PROP_SHOW_ASK_LINE,::ChartGetInteger(this.ID(),CHART_SHOW_ASK_LINE));          // Display Ask value as a horizontal line on the chart
   this.SetProperty(CHART_PROP_SHOW_LAST_LINE,::ChartGetInteger(this.ID(),CHART_SHOW_LAST_LINE));        // Display Last value as a horizontal line on the chart
   this.SetProperty(CHART_PROP_SHOW_PERIOD_SEP,::ChartGetInteger(this.ID(),CHART_SHOW_PERIOD_SEP));      // Display vertical separators between adjacent periods
   this.SetProperty(CHART_PROP_SHOW_GRID,::ChartGetInteger(this.ID(),CHART_SHOW_GRID));                  // Display the chart grid
   this.SetProperty(CHART_PROP_SHOW_VOLUMES,::ChartGetInteger(this.ID(),CHART_SHOW_VOLUMES));            // Display volumes on the chart
   this.SetProperty(CHART_PROP_SHOW_OBJECT_DESCR,::ChartGetInteger(this.ID(),CHART_SHOW_OBJECT_DESCR));  // Display text descriptions of the objects
   this.SetProperty(CHART_PROP_VISIBLE_BARS,::ChartGetInteger(this.ID(),CHART_VISIBLE_BARS));            // Number of bars on a chart that are available for display
   this.SetProperty(CHART_PROP_WINDOWS_TOTAL,::ChartGetInteger(this.ID(),CHART_WINDOWS_TOTAL));          // The total number of chart windows including indicator subwindows
   this.SetProperty(CHART_PROP_WINDOW_HANDLE,::ChartGetInteger(this.ID(),CHART_WINDOW_HANDLE));          // Chart window handle
   this.SetProperty(CHART_PROP_FIRST_VISIBLE_BAR,::ChartGetInteger(this.ID(),CHART_FIRST_VISIBLE_BAR));  // Number of the first visible bar on the chart
   this.SetProperty(CHART_PROP_WIDTH_IN_BARS,::ChartGetInteger(this.ID(),CHART_WIDTH_IN_BARS));          // Chart width in bars
   this.SetProperty(CHART_PROP_WIDTH_IN_PIXELS,::ChartGetInteger(this.ID(),CHART_WIDTH_IN_PIXELS));      // Chart width in pixels
   this.SetProperty(CHART_PROP_COLOR_BACKGROUND,::ChartGetInteger(this.ID(),CHART_COLOR_BACKGROUND));    // Chart background color
   this.SetProperty(CHART_PROP_COLOR_FOREGROUND,::ChartGetInteger(this.ID(),CHART_COLOR_FOREGROUND));    // Color of axes, scale and OHLC line
   this.SetProperty(CHART_PROP_COLOR_GRID,::ChartGetInteger(this.ID(),CHART_COLOR_GRID));                // Grid color
   this.SetProperty(CHART_PROP_COLOR_VOLUME,::ChartGetInteger(this.ID(),CHART_COLOR_VOLUME));            // Color of volumes and position opening levels
   this.SetProperty(CHART_PROP_COLOR_CHART_UP,::ChartGetInteger(this.ID(),CHART_COLOR_CHART_UP));        // Color for the up bar, shadows and body borders of bullish candlesticks
   this.SetProperty(CHART_PROP_COLOR_CHART_DOWN,::ChartGetInteger(this.ID(),CHART_COLOR_CHART_DOWN));    // Color for the down bar, shadows and body borders of bearish candlesticks
   this.SetProperty(CHART_PROP_COLOR_CHART_LINE,::ChartGetInteger(this.ID(),CHART_COLOR_CHART_LINE));    // Color of the chart line and the Doji candlesticks
   this.SetProperty(CHART_PROP_COLOR_CANDLE_BULL,::ChartGetInteger(this.ID(),CHART_COLOR_CANDLE_BULL));  // Color of the bullish candle body
   this.SetProperty(CHART_PROP_COLOR_CANDLE_BEAR,::ChartGetInteger(this.ID(),CHART_COLOR_CANDLE_BEAR));  // Color of the bearish candle body
   this.SetProperty(CHART_PROP_COLOR_BID,::ChartGetInteger(this.ID(),CHART_COLOR_BID));                  // Bid price line color
   this.SetProperty(CHART_PROP_COLOR_ASK,::ChartGetInteger(this.ID(),CHART_COLOR_ASK));                  // Ask price line color
   this.SetProperty(CHART_PROP_COLOR_LAST,::ChartGetInteger(this.ID(),CHART_COLOR_LAST));                // Color of the last performed deal's price line (Last)
   this.SetProperty(CHART_PROP_COLOR_STOP_LEVEL,::ChartGetInteger(this.ID(),CHART_COLOR_STOP_LEVEL));    // Color of stop order levels (Stop Loss and Take Profit)
   this.SetProperty(CHART_PROP_SHOW_TRADE_LEVELS,::ChartGetInteger(this.ID(),CHART_SHOW_TRADE_LEVELS));  // Display trade levels on the chart (levels of open positions, Stop Loss, Take Profit and pending orders)
   this.SetProperty(CHART_PROP_DRAG_TRADE_LEVELS,::ChartGetInteger(this.ID(),CHART_DRAG_TRADE_LEVELS));  // Enable the ability to drag trading levels on a chart using mouse
   this.SetProperty(CHART_PROP_SHOW_DATE_SCALE,::ChartGetInteger(this.ID(),CHART_SHOW_DATE_SCALE));      // Display the time scale on the chart
   this.SetProperty(CHART_PROP_SHOW_PRICE_SCALE,::ChartGetInteger(this.ID(),CHART_SHOW_PRICE_SCALE));    // Display the price scale on the chart
   this.SetProperty(CHART_PROP_SHOW_ONE_CLICK,::ChartGetInteger(this.ID(),CHART_SHOW_ONE_CLICK));        // Display the quick trading panel on the chart
   this.SetProperty(CHART_PROP_IS_MAXIMIZED,::ChartGetInteger(this.ID(),CHART_IS_MAXIMIZED));            // Chart window maximized
   this.SetProperty(CHART_PROP_IS_MINIMIZED,::ChartGetInteger(this.ID(),CHART_IS_MINIMIZED));            // Chart window minimized
   this.SetProperty(CHART_PROP_IS_DOCKED,::ChartGetInteger(this.ID(),CHART_IS_DOCKED));                  // Chart window docked
   this.SetProperty(CHART_PROP_FLOAT_LEFT,::ChartGetInteger(this.ID(),CHART_FLOAT_LEFT));                // Left coordinate of the undocked chart window relative to the virtual screen
   this.SetProperty(CHART_PROP_FLOAT_TOP,::ChartGetInteger(this.ID(),CHART_FLOAT_TOP));                  // Upper coordinate of the undocked chart window relative to the virtual screen
   this.SetProperty(CHART_PROP_FLOAT_RIGHT,::ChartGetInteger(this.ID(),CHART_FLOAT_RIGHT));              // Right coordinate of the undocked chart window relative to the virtual screen
   this.SetProperty(CHART_PROP_FLOAT_BOTTOM,::ChartGetInteger(this.ID(),CHART_FLOAT_BOTTOM));            // Bottom coordinate of the undocked chart window relative to the virtual screen
   this.SetProperty(CHART_PROP_YDISTANCE,::ChartGetInteger(this.ID(),CHART_WINDOW_YDISTANCE,0));         // Distance in Y axis pixels between the upper frame of the indicator subwindow and the upper frame of the chart main window
   this.SetProperty(CHART_PROP_HEIGHT_IN_PIXELS,::ChartGetInteger(this.ID(),CHART_HEIGHT_IN_PIXELS,0));  // Chart height in pixels
   return true;
  }
//+------------------------------------------------------------------+
The method filling in real object properties:
//+------------------------------------------------------------------+
//| Fill in real object properties                                   |
//+------------------------------------------------------------------+
void CChartObj::SetDoubleParameters(void)
  {
   this.SetProperty(CHART_PROP_SHIFT_SIZE,::ChartGetDouble(this.ID(),CHART_SHIFT_SIZE));                 // Shift size of the zero bar from the right border in %
   this.SetProperty(CHART_PROP_FIXED_POSITION,::ChartGetDouble(this.ID(),CHART_FIXED_POSITION));         // Chart fixed position from the left border in %
   this.SetProperty(CHART_PROP_FIXED_MAX,::ChartGetDouble(this.ID(),CHART_FIXED_MAX));                   // Fixed chart maximum
   this.SetProperty(CHART_PROP_FIXED_MIN,::ChartGetDouble(this.ID(),CHART_FIXED_MIN));                   // Fixed chart minimum
   this.SetProperty(CHART_PROP_POINTS_PER_BAR,::ChartGetDouble(this.ID(),CHART_POINTS_PER_BAR));         // Scale in points per bar
   this.SetProperty(CHART_PROP_PRICE_MIN,::ChartGetDouble(this.ID(),CHART_PRICE_MIN));                   // Chart minimum
   this.SetProperty(CHART_PROP_PRICE_MAX,::ChartGetDouble(this.ID(),CHART_PRICE_MAX));                   // Chart maximum
  }
//+------------------------------------------------------------------+
The method filling in string object properties:
//+------------------------------------------------------------------+
//| Fill in string object properties                                 |
//+------------------------------------------------------------------+
bool CChartObj::SetStringParameters(void)
  {
   string symbol=::ChartSymbol(this.ID());
   if(symbol==NULL)
      return false;
   this.SetProperty(CHART_PROP_SYMBOL,symbol);                                                           // Chart symbol
   this.SetProperty(CHART_PROP_COMMENT,::ChartGetString(this.ID(),CHART_COMMENT));                       // Comment text on the chart
   this.SetProperty(CHART_PROP_EXPERT_NAME,::ChartGetString(this.ID(),CHART_EXPERT_NAME));               // name of an EA launched on the chart
   this.SetProperty(CHART_PROP_SCRIPT_NAME,::ChartGetString(this.ID(),CHART_SCRIPT_NAME));               // name of a script launched on the chart
   return true;
  }
//+------------------------------------------------------------------+
The methods filling in integer and string properties return bool values because, inside the method, we get the chart period and symbol by chart ID using the ChartPeriod() and ChartSymbol() functions. These functions can return either zero or an empty string. In this cases, the methods return false.
In the method returning the description of the object integer property (namely in the code blocks returning the distance between the window frames and the chart height in pixels, return the property directly from the chart rather than the object:
      property==CHART_PROP_WINDOW_HANDLE  ?  CMessage::Text(MSG_CHART_OBJ_WINDOW_HANDLE)+
         (!this.SupportProperty(property) ?  ": "+CMessage::Text(MSG_LIB_PROP_NOT_SUPPORTED) :
          ": "+(string)this.GetProperty(property)
         )  :
      property==CHART_PROP_YDISTANCE  ?  CMessage::Text(MSG_CHART_OBJ_WINDOW_YDISTANCE)+
         (!this.SupportProperty(property) ?  ": "+CMessage::Text(MSG_LIB_PROP_NOT_SUPPORTED) :
          ": "+(string)::ChartGetInteger(this.m_chart_id,CHART_WINDOW_YDISTANCE,0)
         )  :
      property==CHART_PROP_FIRST_VISIBLE_BAR ?  CMessage::Text(MSG_CHART_OBJ_FIRST_VISIBLE_BAR)+
         (!this.SupportProperty(property) ?  ": "+CMessage::Text(MSG_LIB_PROP_NOT_SUPPORTED) :
          ": "+(string)this.GetProperty(property)
         )  :
      property==CHART_PROP_WIDTH_IN_BARS  ?  CMessage::Text(MSG_CHART_OBJ_WIDTH_IN_BARS)+
         (!this.SupportProperty(property) ?  ": "+CMessage::Text(MSG_LIB_PROP_NOT_SUPPORTED) :
          ": "+(string)this.GetProperty(property)
         )  :
      property==CHART_PROP_WIDTH_IN_PIXELS   ?  CMessage::Text(MSG_CHART_OBJ_WIDTH_IN_PIXELS)+
         (!this.SupportProperty(property) ?  ": "+CMessage::Text(MSG_LIB_PROP_NOT_SUPPORTED) :
          ": "+(string)this.GetProperty(property)
         )  :
      property==CHART_PROP_HEIGHT_IN_PIXELS   ?  CMessage::Text(MSG_CHART_OBJ_HEIGHT_IN_PIXELS)+
         (!this.SupportProperty(property) ?  ": "+CMessage::Text(MSG_LIB_PROP_NOT_SUPPORTED) :
          ": "+(string)::ChartGetInteger(this.m_chart_id,CHART_HEIGHT_IN_PIXELS,0)
         )  :
      property==CHART_PROP_COLOR_BACKGROUND        ?  CMessage::Text(MSG_CHART_OBJ_COLOR_BACKGROUND)+
         (!this.SupportProperty(property) ?  ": "+CMessage::Text(MSG_LIB_PROP_NOT_SUPPORTED) :
          ": "+::ColorToString((color)this.GetProperty(property),true)
         )  :
Although the chart has such properties, they belong to its window (which is the zero one in this case) rather than the chart itself, and we get these properties from the chart window objects.
The method updating the chart object and the list of its windows has undergone changes as well:
//+------------------------------------------------------------------+
//| Update the chart object and its window list                      |
//+------------------------------------------------------------------+
void CChartObj::Refresh(void)
  {
//--- Initialize event data
   this.m_is_event=false;
   this.m_hash_sum=0;
   this.m_list_events.Clear();
   this.m_list_events.Sort();
//--- Update all chart windows
   for(int i=0;i<this.m_list_wnd.Total();i++)
     {
      //--- Get the next chart window object from the list
      CChartWnd *wnd=this.m_list_wnd.At(i);
      if(wnd==NULL)
         continue;
      //--- Update the window and check its event flag
      //--- If the window has no event, move on to the next window
      wnd.Refresh();
      if(!wnd.IsEvent())
         continue;
      //--- Get the list of chart window events
      CArrayObj *list=wnd.GetListEvents();
      if(list==NULL)
         continue;
      //--- Set the chart event flag and get the last event code
      this.m_is_event=true;
      this.m_event_code=wnd.GetEventCode();
      //--- In the loop by the number of chart window events,
      int n=list.Total();
      for(int j=0; j<n; j++)
        {
         //--- get the base event object from the chart window event list
         CEventBaseObj *event=list.At(j);
         if(event==NULL)
            continue;
         //--- Create the chart window event parameters using the base event
         ushort event_id=event.ID();
         this.m_last_event=event_id;
         string sparam=(string)this.GetChartID()+"_"+(string)wnd.WindowNum();
         //--- if the event is on the foreground and the chart window event is added to the chart event list,
         if(::ChartGetInteger(this.ID(),CHART_BRING_TO_TOP) && this.EventAdd((ushort)event.ID(),event.LParam(),event.DParam(),sparam))
           {
            //--- send the newly created chart window event to the control program chart
            ::EventChartCustom(this.m_chart_id_main,(ushort)event_id,event.LParam(),event.DParam(),sparam);
           }
        }
     }

//--- Check changes of a symbol and chart period
   int change=(int)::ChartGetInteger(this.m_chart_id,CHART_WINDOWS_TOTAL)-this.WindowsTotal();
   if(change==0)
     {
      //--- Get a chart symbol and period by its ID
      string symbol=::ChartSymbol(this.ID());
      ENUM_TIMEFRAMES timeframe=::ChartPeriod(this.ID());
      //--- If a symbol and period are received
      if(symbol!=NULL && timeframe!=0)
        {
         //--- create the flags specifying the equality/non-equality of the obtained period symbol with the current ones
         bool symb=symbol!=this.m_symbol_prev;
         bool tf=timeframe!=this.m_timeframe_prev;
         //--- If case of any changes, find out their exact nature:
         if(symb || tf)
           {
            //--- If both a symbol and a timeframe changed
            if(symb && tf)
              {
               //--- Send the CHART_OBJ_EVENT_CHART_SYMB_TF_CHANGE event to the control program chart
               this.SendEvent(CHART_OBJ_EVENT_CHART_SYMB_TF_CHANGE);
               //--- Set a new symbol and a period for the object, and
               this.SetSymbol(symbol);
               this.SetTimeframe(timeframe);
               //--- write the current symbol/period as the previous ones
               this.m_symbol_prev=this.Symbol();
               this.m_timeframe_prev=this.Timeframe();
              }
            //--- If only a chart symbol is changed
            else if(symb)
              {
               //--- Send the CHART_OBJ_EVENT_CHART_SYMB_CHANGE event to the control program chart
               this.SendEvent(CHART_OBJ_EVENT_CHART_SYMB_CHANGE);
               //--- Set a new symbol for the object and write the current symbol as the previous one
               this.SetSymbol(symbol);
               this.m_symbol_prev=this.Symbol();
              }
            //--- If only a chart period is changed
            else if(tf)
              {
               //--- Send the CHART_OBJ_EVENT_CHART_TF_CHANGE event to the control program chart
               this.SendEvent(CHART_OBJ_EVENT_CHART_TF_CHANGE);
               //--- Set a new timeframe for the object and write the current timeframe as the previous one
               this.SetTimeframe(timeframe);
               this.m_timeframe_prev=this.Timeframe();
              }
           }
        }
      //--- Update chart data
      if(this.SetIntegerParameters())
        {
         this.SetDoubleParameters();
         this.SetStringParameters();
        }
      //--- Fill in the current chart data
      for(int i=0;i<CHART_PROP_INTEGER_TOTAL;i++)
         this.m_long_prop_event[i][3]=this.m_long_prop[i];
      for(int i=0;i<CHART_PROP_DOUBLE_TOTAL;i++)
         this.m_double_prop_event[i][3]=this.m_double_prop[i];
      //--- Update the base object data and search for changes
      CBaseObjExt::Refresh();
      this.CheckEvents();
     }
   else
     {
      this.RecreateWindowsList(change);
     }
  }
//+------------------------------------------------------------------+
The method listing features detailed comments. In short: After updating chart window objects, we need to check the flag of each window event. If the window features events, each of them should be sent to the control program chart. After updating chart windows and checking their events, we need to check a chart symbol and/or period change in case there are no more changes involving the chart.
In the method of creating and sending a chart event to the control program chart, add handling a chart symbol and/or period change event:
//+------------------------------------------------------------------+
//| Create and send a chart event                                    |
//| to the control program chart                                     |
//+------------------------------------------------------------------+
void CChartObj::SendEvent(ENUM_CHART_OBJ_EVENT event)
  {
   //--- If a window is added
   if(event==CHART_OBJ_EVENT_CHART_WND_ADD)
     {
      //--- Get the last chart window object added to the list
      CChartWnd *wnd=this.GetLastAddedWindow();
      if(wnd==NULL)
         return;
      //--- Send the CHART_OBJ_EVENT_CHART_WND_ADD event to the control program chart
      //--- pass the chart ID to lparam,
      //--- pass the chart window index to dparam,
      //--- pass the chart symbol to sparam
      ::EventChartCustom(this.m_chart_id_main,(ushort)event,this.m_chart_id,wnd.WindowNum(),this.Symbol());
     }
   //--- If the window is removed
   else if(event==CHART_OBJ_EVENT_CHART_WND_DEL)
     {
      //--- Get the last chart window object added to the list of removed windows
      CChartWnd *wnd=this.GetLastDeletedWindow();
      if(wnd==NULL)
         return;
      //--- Send the CHART_OBJ_EVENT_CHART_WND_DEL event to the control program chart
      //--- pass the chart ID to lparam,
      //--- pass the chart window index to dparam,
      //--- pass the chart symbol to sparam
      ::EventChartCustom(this.m_chart_id_main,(ushort)event,this.m_chart_id,wnd.WindowNum(),this.Symbol());
     }
   //--- If symbol and timeframe changed
   else if(event==CHART_OBJ_EVENT_CHART_SYMB_TF_CHANGE)
     {
      //--- Send the CHART_OBJ_EVENT_CHART_SYMB_TF_CHANGE event to the control program chart
      //--- pass the chart ID to lparam,
      //--- pass the previous timeframe to dparam,
      //--- pass the previous chart symbol to sparam
      ::EventChartCustom(this.m_chart_id_main,(ushort)event,this.m_chart_id,this.m_timeframe_prev,this.m_symbol_prev);
     }
   //--- If a symbol changed
   else if(event==CHART_OBJ_EVENT_CHART_SYMB_CHANGE)
     {
      //--- Send the CHART_OBJ_EVENT_CHART_SYMB_CHANGE event to the control program chart
      //--- pass the chart ID to lparam,
      //--- pass the current timeframe to dparam,
      //--- pass the previous chart symbol to sparam
      ::EventChartCustom(this.m_chart_id_main,(ushort)event,this.m_chart_id,this.Timeframe(),this.m_symbol_prev);
     }
   //--- If a timeframe changed
   else if(event==CHART_OBJ_EVENT_CHART_TF_CHANGE)
     {
      //--- Send the CHART_OBJ_EVENT_CHART_TF_CHANGE event to the control program chart
      //--- pass the chart ID to lparam,
      //--- pass the previous timeframe to dparam,
      //--- pass the current chart symbol to sparam
      ::EventChartCustom(this.m_chart_id_main,(ushort)event,this.m_chart_id,this.m_timeframe_prev,this.Symbol());
     }
  }
//+------------------------------------------------------------------+
The code comments contain all the details. If you have any questions, feel free to ask them in the comments below.
Now let's improve the chart object collection class in \MQL5\Include\DoEasy\Collections\ChartObjCollection.mqh.
First, make it a descendant of the basic extended object class and add the variable for storing the last event to the private section of the class:
//+------------------------------------------------------------------+
//| MQL5 signal object collection                                    |
//+------------------------------------------------------------------+
class CChartObjCollection : public CBaseObjExt
  {
private:
   CListObj                m_list;                                   // List of chart objects
   CListObj                m_list_del;                               // List of deleted chart objects
   CArrayObj               m_list_wnd_del;                           // List of deleted chart window objects
   CArrayObj               m_list_ind_del;                           // List of indicators removed from the indicator window
   CArrayObj               m_list_ind_param;                         // List of changed indicators
   int                     m_charts_total_prev;                      // Previous number of charts in the terminal
   int                     m_last_event;                             // The last event
   //--- Return the number of charts in the terminal
   int                     ChartsTotal(void) const;
   //--- Return the flag indicating the existence of (1) a chart object and (2) a chart
   bool                    IsPresentChartObj(const long chart_id);
   bool                    IsPresentChart(const long chart_id);
   //--- Create a new chart object and add it to the list
   bool                    CreateNewChartObj(const long chart_id,const string source);
   //--- Find the missing chart object, create it and add it to the collection list
   bool                    FindAndCreateMissingChartObj(void);
   //--- Find a chart object not present in the terminal and remove it from the list
   void                    FindAndDeleteExcessChartObj(void);
public:
In the public section of the class, add three methods for working with the event functionality of the basic extended object and declare the method indicating the window object (specified by index) of the chart (specified by ID):
//--- Return (1) the flag event, (2) an event of one of the charts and (3) the last event
   bool                    IsEvent(void)                             const { return this.m_is_event;                                   }
   int                     GetLastEventsCode(void)                   const { return this.m_event_code;                                 }
   int                     GetLastEvent(void)                        const { return this.m_last_event;                                 }

//--- Constructor
                           CChartObjCollection();

//--- Return the list of chart objects by (1) symbol and (2) timeframe
   CArrayObj              *GetChartsList(const string symbol)              { return this.GetList(CHART_PROP_SYMBOL,symbol,EQUAL);      }
   CArrayObj              *GetChartsList(const ENUM_TIMEFRAMES timeframe)  { return this.GetList(CHART_PROP_TIMEFRAME,timeframe,EQUAL);}
//--- Return the pointer to the chart object (1) by ID and (2) by an index in the list
   CChartObj              *GetChart(const long id);
   CChartObj              *GetChart(const int index)                       { return this.m_list.At(index);                             }
//--- Return (1) the last added chart and (2) the last removed chart
   CChartObj              *GetLastAddedChart(void)                         { return this.m_list.At(this.m_list.Total()-1);             }
   CChartObj              *GetLastDeletedChart(void)                       { return this.m_list_del.At(this.m_list_del.Total()-1);     }

//--- Return (1) the last added window on the chart by chart ID and (2) the last removed chart window
   CChartWnd              *GetLastAddedChartWindow(const long chart_id);
   CChartWnd              *GetLastDeletedChartWindow(void)                 { return this.m_list_wnd_del.At(this.m_list_wnd_del.Total()-1);}
//--- Return the window object (specified by index) of the chart (specified by ID)
   CChartWnd              *GetChartWindow(const long chart_id,const int wnd_num);
The method updating the chart object collection list receives handling chart object events:
//+------------------------------------------------------------------+
//| Update the collection list of chart objects                      |
//+------------------------------------------------------------------+
void CChartObjCollection::Refresh(void)
  {
//--- Initialize event data
   this.m_is_event=false;
   this.m_hash_sum=0;
   this.m_list_events.Clear();
   this.m_list_events.Sort();
   //--- In the loop by the number of chart objects in the collection list
   for(int i=0;i<this.m_list.Total();i++)
     {
      //--- get the next chart object and
      CChartObj *chart=this.m_list.At(i);
      if(chart==NULL)
         continue;
      //--- update it
      chart.Refresh();
      //--- If there is no chart event, move on to the next one
      if(!chart.IsEvent())
         continue;
      //--- Get the list of events of a selected chart
      CArrayObj *list=chart.GetListEvents();
      if(list==NULL)
         continue;
      //--- Set the event flag in the chart collection and get the last event code
      this.m_is_event=true;
      this.m_event_code=chart.GetEventCode();
      //--- In the loop by the chart event list,
      int n=list.Total();
      for(int j=0; j<n; j++)
        {
         //--- get the base event object from the chart event list
         CEventBaseObj *event=list.At(j);
         if(event==NULL)
            continue;
         //--- Create the chart event parameters using the base event
         ushort event_id=event.ID();
         this.m_last_event=event_id;
         string sparam=(string)this.GetChartID();
         //--- and, if the chart event is added to the chart event list,
         if(this.EventAdd((ushort)event.ID(),event.LParam(),event.DParam(),sparam))
           {
            //--- send the newly created chart event to the control program chart
            ::EventChartCustom(this.m_chart_id_main,(ushort)event_id,event.LParam(),event.DParam(),sparam);
           }
        }
     }

   //--- Get the number of open charts in the terminal and
   int charts_total=this.ChartsTotal();
   //--- calculate the difference between the number of open charts in the terminal
   //--- and chart objects in the collection list. These values are displayed in the chart comment
   int change=charts_total-this.m_list.Total();
   //--- If there are no changes, leave
   if(change==0)
      return;
   //--- If a chart is added in the terminal
   if(change>0)
     {
      //--- Find the missing chart object, create and add it to the collection list
      this.FindAndCreateMissingChartObj();
      //--- Get the current chart and return to it since
      //--- adding a new chart switches the focus to it
      CChartObj *chart=this.GetChart(GetMainChartID());
      if(chart!=NULL)
         chart.SetBringToTopON(true);
      for(int i=0;i<change;i++)
        {
         chart=m_list.At(m_list.Total()-(1+i));
         if(chart==NULL)
            continue;
         this.SendEvent(CHART_OBJ_EVENT_CHART_OPEN);
        }
     }
   //--- If a chart is removed in the terminal
   else if(change<0)
     {
      //--- Find an extra chart object in the collection list and remove it from the list
      this.FindAndDeleteExcessChartObj();
      for(int i=0;i<-change;i++)
        {
         CChartObj *chart=this.m_list_del.At(this.m_list_del.Total()-(1+i));
         if(chart==NULL)
            continue;
         this.SendEvent(CHART_OBJ_EVENT_CHART_CLOSE);
        }
     }
  }
//+------------------------------------------------------------------+
Here, the logic is similar to the one of the previously considered chart object update methods and chart window objects. All is commented in detail here.
The method returning the window object (specified by index) of the chart (specified by ID):
//+------------------------------------------------------------------+
//| Return the window object (specified by index)                    |
//| of the chart (specified by ID)                                   |
//+------------------------------------------------------------------+
CChartWnd* CChartObjCollection::GetChartWindow(const long chart_id,const int wnd_num)
  {
   CChartObj *chart=this.GetChart(chart_id);
   if(chart==NULL)
      return NULL;
   return chart.GetWindowByNum(wnd_num);
  }
//+------------------------------------------------------------------+
Here we get the chart object by its ID and return the window belonging to the chart obtained by the specified window index.
If any of the objects is not received, the method returns NULL.
Next, add the same method to the CEngine library main class in \MQL5\Include\DoEasy\Engine.mqh:
//--- Return the object (1) of the last added window of the specified chart and (2) the last removed chart window
   CChartWnd           *ChartGetLastAddedChartWindow(const long chart_id)              { return this.m_charts.GetLastAddedChartWindow(chart_id);}
   CChartWnd           *ChartGetLastDeletedChartWindow(void)                           { return this.m_charts.GetLastDeletedChartWindow();   }
//--- Return the window object (specified by index) of the chart (specified by ID)
   CChartWnd           *ChartGetChartWindow(const long chart_id,const int wnd_num)     { return this.m_charts.GetChartWindow(chart_id,wnd_num);}
The method simply returns the result of calling the GetChartWindow() method of the chart object collection class considered above.
This completes all the changes and improvements. Let's perform a test.
Test
To perform the test, I will use the EA from the previous article and save it in \MQL5\Experts\TestDoEasy\Part72\ as TestDoEasyPart72.mq5.
We will need to track a few chart window object properties and add handling all incoming new events from the chart object collection.
At the very end of the EA OnInitDoEasy() function, add the code block for setting the chart window properties to be tracked (the entire function code is quite large, so I will not provide it here):
//--- Set controlled values for the current account
   CAccount* account=engine.GetAccountCurrent();
   if(account!=NULL)
     {
      //--- Set control of the profit increase to 10
      account.SetControlledValueINC(ACCOUNT_PROP_PROFIT,10.0);
      //--- Set control of the funds increase to 15
      account.SetControlledValueINC(ACCOUNT_PROP_EQUITY,15.0);
      //--- Set profit control level to 20
      account.SetControlledValueLEVEL(ACCOUNT_PROP_PROFIT,20.0);
     }

//--- Set controlled values for charts
   //--- Get the list of all collection charts
   CArrayObj *list_charts=engine.GetListCharts();
   if(list_charts!=NULL && list_charts.Total()>0)
     {
      //--- In a loop by the list, set the necessary values for tracked chart properties
      //--- By default, the LONG_MAX value is set to all properties, which means "Do not track this property"
      //--- It can be enabled or disabled (by setting the value less than LONG_MAX or vice versa - set the LONG_MAX value) at any time and anywhere in the program
      for(int i=0;i<list_charts.Total();i++)
        {
         CChartObj* chart=list_charts.At(i);
         if(chart==NULL)
            continue;
         //--- Set reference values for the selected chart windows
         int total_wnd=chart.WindowsTotal();
         for(int j=0;j<total_wnd;j++)
           {
            CChartWnd *wnd=engine.ChartGetChartWindow(chart.ID(),j);
            if(wnd==NULL)
               continue;
            //--- Set control of the chart window height increase by 20 pixels
            wnd.SetControlHeightInPixelsInc(20);
            //--- Set control of the chart window height decrease by 20 pixels
            wnd.SetControlHeightInPixelsDec(20);
            //--- Set the control height of the chart window to 50 pixels
            wnd.SetControlledValueLEVEL(CHART_WINDOW_PROP_HEIGHT_IN_PIXELS,50);
           }
        }
     }

//--- Get the end of the library initialization time counting and display it in the journal
   ulong end=GetTickCount();
   Print(TextByLanguage("Время инициализации библиотеки: ","Library initialization time: "),TimeMSCtoString(end-begin,TIME_MINUTES|TIME_SECONDS));
  }
//+------------------------------------------------------------------+
Here we set the parameters, at which:
- If the window height is increased by more than 20 pixels, the appropriate event is generated,
- If the window height is decreased by more than 20 pixels, the appropriate event is generated,
- If the window height becomes greater, less than or equal to 50 pixels, the corresponding event is generated.
The EA's OnDoEasyEvent() function receives handling all new library events (the entire code block of handling all chart collection events, including new ones, is provided here):
//--- Handling timeseries events
   else if(idx>SERIES_EVENTS_NO_EVENT && idx<SERIES_EVENTS_NEXT_CODE)
     {
      //--- "New bar" event
      if(idx==SERIES_EVENTS_NEW_BAR)
        {
         Print(TextByLanguage("Новый бар на ","New Bar on "),sparam," ",TimeframeDescription((ENUM_TIMEFRAMES)dparam),": ",TimeToString(lparam));
        }
     }

//--- Handle chart auto events
//--- Handle chart and window events
   if(source==COLLECTION_CHART_WND_ID)
     {
      int pos=StringFind(sparam,"_");
      long chart_id=StringToInteger(StringSubstr(sparam,0,pos));
      int wnd_num=(int)StringToInteger(StringSubstr(sparam,pos+1));

      CChartObj *chart=engine.ChartGetChartObj(chart_id);
      if(chart==NULL)
         return;
      CSymbol *symbol=engine.GetSymbolObjByName(chart.Symbol());
      if(symbol==NULL)
         return;
      CChartWnd *wnd=chart.GetWindowByNum(wnd_num);
      if(wnd==NULL)
         return;
      //--- Number of decimal places in the event value - in case of a 'long' event, it is 0, otherwise - Digits() of a symbol
      int digits=(idx<CHART_WINDOW_PROP_INTEGER_TOTAL ? 0 : symbol.Digits());
      //--- Event text description
      string id_descr=(idx<CHART_WINDOW_PROP_INTEGER_TOTAL ? wnd.GetPropertyDescription((ENUM_CHART_WINDOW_PROP_INTEGER)idx) : wnd.GetPropertyDescription((ENUM_CHART_WINDOW_PROP_DOUBLE)idx));
      //--- Property change text value
      string value=DoubleToString(dparam,digits);

      //--- Check event reasons and display its description in the journal
      if(reason==BASE_EVENT_REASON_INC)
        {
         Print(wnd.EventDescription(idx,(ENUM_BASE_EVENT_REASON)reason,source,value,id_descr,digits));
        }
      if(reason==BASE_EVENT_REASON_DEC)
        {
         Print(wnd.EventDescription(idx,(ENUM_BASE_EVENT_REASON)reason,source,value,id_descr,digits));
        }
      if(reason==BASE_EVENT_REASON_MORE_THEN)
        {
         Print(wnd.EventDescription(idx,(ENUM_BASE_EVENT_REASON)reason,source,value,id_descr,digits));
        }
      if(reason==BASE_EVENT_REASON_LESS_THEN)
        {
         Print(wnd.EventDescription(idx,(ENUM_BASE_EVENT_REASON)reason,source,value,id_descr,digits));
        }
      if(reason==BASE_EVENT_REASON_EQUALS)
        {
         Print(wnd.EventDescription(idx,(ENUM_BASE_EVENT_REASON)reason,source,value,id_descr,digits));
        }
     }
//--- Handle chart auto events
   if(source==COLLECTION_CHARTS_ID)
     {
      long chart_id=StringToInteger(sparam);

      CChartObj *chart=engine.ChartGetChartObj(chart_id);
      if(chart==NULL)
         return;
      Print(DFUN,"chart_id=",chart_id,", chart.Symbol()=",chart.Symbol());
      //--- Number of decimal places in the event value - in case of a 'long' event, it is 0, otherwise - Digits() of a symbol
      int digits=int(idx<CHART_PROP_INTEGER_TOTAL ? 0 : SymbolInfoInteger(chart.Symbol(),SYMBOL_DIGITS));
      //--- Event text description
      string id_descr=(idx<CHART_PROP_INTEGER_TOTAL ? chart.GetPropertyDescription((ENUM_CHART_PROP_INTEGER)idx) : chart.GetPropertyDescription((ENUM_CHART_PROP_DOUBLE)idx));
      //--- Property change text value
      string value=DoubleToString(dparam,digits);

      //--- Check event reasons and display its description in the journal
      if(reason==BASE_EVENT_REASON_INC)
        {
         Print(chart.EventDescription(idx,(ENUM_BASE_EVENT_REASON)reason,source,value,id_descr,digits));
        }
      if(reason==BASE_EVENT_REASON_DEC)
        {
         Print(chart.EventDescription(idx,(ENUM_BASE_EVENT_REASON)reason,source,value,id_descr,digits));
        }
      if(reason==BASE_EVENT_REASON_MORE_THEN)
        {
         Print(chart.EventDescription(idx,(ENUM_BASE_EVENT_REASON)reason,source,value,id_descr,digits));
        }
      if(reason==BASE_EVENT_REASON_LESS_THEN)
        {
         Print(chart.EventDescription(idx,(ENUM_BASE_EVENT_REASON)reason,source,value,id_descr,digits));
        }
      if(reason==BASE_EVENT_REASON_EQUALS)
        {
         Print(chart.EventDescription(idx,(ENUM_BASE_EVENT_REASON)reason,source,value,id_descr,digits));
        }
     }

//--- Handle non-auto chart events
   else if(idx>CHART_OBJ_EVENT_NO_EVENT && idx<CHART_OBJ_EVENTS_NEXT_CODE)
     {
      //--- "New chart opening" event
      if(idx==CHART_OBJ_EVENT_CHART_OPEN)
        {
         //::EventChartCustom(this.m_chart_id_main,(ushort)event,chart.ID(),chart.Timeframe(),chart.Symbol());
         CChartObj *chart=engine.ChartGetLastOpenedChart();
         if(chart!=NULL)
           {
            string symbol=sparam;
            long chart_id=lparam;
            ENUM_TIMEFRAMES timeframe=(ENUM_TIMEFRAMES)dparam;
            string header=symbol+" "+TimeframeDescription(timeframe)+", ID "+(string)chart_id;
            Print(DFUN,CMessage::Text(MSG_CHART_COLLECTION_CHART_OPENED),": ",header);
           }
        }
      //--- "Chart closure" event
      if(idx==CHART_OBJ_EVENT_CHART_CLOSE)
        {
         //::EventChartCustom(this.m_chart_id_main,(ushort)event,chart.ID(),chart.Timeframe(),chart.Symbol());
         CChartObj *chart=engine.ChartGetLastClosedChart();
         if(chart!=NULL)
           {
            string symbol=sparam;
            long   chart_id=lparam;
            ENUM_TIMEFRAMES timeframe=(ENUM_TIMEFRAMES)dparam;
            string header=symbol+" "+TimeframeDescription(timeframe)+", ID "+(string)chart_id;
            Print(DFUN,CMessage::Text(MSG_CHART_COLLECTION_CHART_CLOSED),": ",header);
           }
        }
      //--- "Chart symbol changed" event
      if(idx==CHART_OBJ_EVENT_CHART_SYMB_CHANGE)
        {
         //::EventChartCustom(this.m_chart_id_main,(ushort)event,this.m_chart_id,this.Timeframe(),this.m_symbol_prev);
         long chart_id=lparam;
         ENUM_TIMEFRAMES timeframe=(ENUM_TIMEFRAMES)dparam;
         string symbol_prev=sparam;
         CChartObj *chart=engine.ChartGetChartObj(chart_id);
         if(chart!=NULL)
           {
            string header=chart.Symbol()+" "+TimeframeDescription(timeframe)+", ID "+(string)chart_id;
            Print(DFUN,CMessage::Text(MSG_CHART_COLLECTION_CHART_SYMB_CHANGED),": ",header,": ",symbol_prev," >>> ",chart.Symbol());
           }
        }
      //--- "Chart timeframe changed" event
      if(idx==CHART_OBJ_EVENT_CHART_TF_CHANGE)
        {
         //::EventChartCustom(this.m_chart_id_main,(ushort)event,this.m_chart_id,this.m_timeframe_prev,this.Symbol());
         long chart_id=lparam;
         ENUM_TIMEFRAMES timeframe_prev=(ENUM_TIMEFRAMES)dparam;
         string symbol=sparam;
         CChartObj *chart=engine.ChartGetChartObj(chart_id);
         if(chart!=NULL)
           {
            string header=chart.Symbol()+" "+TimeframeDescription(chart.Timeframe())+", ID "+(string)chart_id;
            Print
              (
               DFUN,CMessage::Text(MSG_CHART_COLLECTION_CHART_TF_CHANGED),": ",header,": ",
               TimeframeDescription(timeframe_prev)," >>> ",TimeframeDescription(chart.Timeframe())
              );
           }
        }
      //--- "Chart symbol and timeframe changed" event
      if(idx==CHART_OBJ_EVENT_CHART_SYMB_TF_CHANGE)
        {
         //::EventChartCustom(this.m_chart_id_main,(ushort)event,this.m_chart_id,this.m_timeframe_prev,this.m_symbol_prev);
         long chart_id=lparam;
         ENUM_TIMEFRAMES timeframe_prev=(ENUM_TIMEFRAMES)dparam;
         string symbol_prev=sparam;
         CChartObj *chart=engine.ChartGetChartObj(chart_id);
         if(chart!=NULL)
           {
            string header=chart.Symbol()+" "+TimeframeDescription(chart.Timeframe())+", ID "+(string)chart_id;
            Print
              (
               DFUN,CMessage::Text(MSG_CHART_COLLECTION_CHART_SYMB_TF_CHANGED),": ",header,": ",
               symbol_prev," >>> ",chart.Symbol(),", ",TimeframeDescription(timeframe_prev)," >>> ",TimeframeDescription(chart.Timeframe())
              );
           }
        }

      //--- "Adding a new window on the chart" event
      if(idx==CHART_OBJ_EVENT_CHART_WND_ADD)
        {
         //::EventChartCustom(this.m_chart_id_main,(ushort)event,this.m_chart_id,wnd.WindowNum(),this.Symbol());
         ENUM_TIMEFRAMES timeframe=WRONG_VALUE;
         string ind_name="";
         string symbol=sparam;
         long   chart_id=lparam;
         int    win_num=(int)dparam;
         string header=symbol+" "+TimeframeDescription(timeframe)+", ID "+(string)chart_id+": ";

         CChartObj *chart=engine.ChartGetLastOpenedChart();
         if(chart!=NULL)
           {
            timeframe=chart.Timeframe();
            CChartWnd *wnd=engine.ChartGetLastAddedChartWindow(chart.ID());
            if(wnd!=NULL)
              {
               CWndInd *ind=wnd.GetLastAddedIndicator();
               if(ind!=NULL)
                  ind_name=ind.Name();
              }
           }
         Print(DFUN,header,CMessage::Text(MSG_CHART_OBJ_WINDOW_ADDED)," ",(string)win_num," ",ind_name);
        }
      //--- "Removing a window from the chart" event
      if(idx==CHART_OBJ_EVENT_CHART_WND_DEL)
        {
         //::EventChartCustom(this.m_chart_id_main,(ushort)event,this.m_chart_id,wnd.WindowNum(),this.Symbol());
         CChartWnd *wnd=engine.ChartGetLastDeletedChartWindow();
         ENUM_TIMEFRAMES timeframe=WRONG_VALUE;
         string symbol=sparam;
         long   chart_id=lparam;
         int    win_num=(int)dparam;
         string header=symbol+" "+TimeframeDescription(timeframe)+", ID "+(string)chart_id+": ";
         Print(DFUN,header,CMessage::Text(MSG_CHART_OBJ_WINDOW_REMOVED)," ",(string)win_num);
        }
      //--- "Adding a new indicator to the chart window" event
      if(idx==CHART_OBJ_EVENT_CHART_WND_IND_ADD)
        {
         //::EventChartCustom(this.m_chart_id_main,(ushort)event,this.m_chart_id,this.WindowNum(),ind.Name());
         ENUM_TIMEFRAMES timeframe=WRONG_VALUE;
         string ind_name=sparam;
         string symbol=NULL;
         long   chart_id=lparam;
         int    win_num=(int)dparam;
         string header=NULL;

         CWndInd *ind=engine.ChartGetLastAddedIndicator(chart_id,win_num);
         if(ind!=NULL)
           {
            CChartObj *chart=engine.ChartGetChartObj(chart_id);
            if(chart!=NULL)
              {
               symbol=chart.Symbol();
               timeframe=chart.Timeframe();
               CChartWnd *wnd=chart.GetWindowByNum(win_num);
               if(wnd!=NULL)
                  header=wnd.Header();
              }
           }
         Print(DFUN,symbol," ",TimeframeDescription(timeframe),", ID ",chart_id,", ",header,": ",CMessage::Text(MSG_CHART_OBJ_INDICATOR_ADDED)," ",ind_name);
        }
      //--- "Removing an indicator from the chart window" event
      if(idx==CHART_OBJ_EVENT_CHART_WND_IND_DEL)
        {
         //::EventChartCustom(this.m_chart_id_main,(ushort)event,this.m_chart_id,this.WindowNum(),ind.Name());
         ENUM_TIMEFRAMES timeframe=WRONG_VALUE;
         string ind_name=sparam;
         string symbol=NULL;
         long   chart_id=lparam;
         int    win_num=(int)dparam;
         string header=NULL;

         CWndInd *ind=engine.ChartGetLastDeletedIndicator();
         if(ind!=NULL)
           {
            CChartObj *chart=engine.ChartGetChartObj(chart_id);
            if(chart!=NULL)
              {
               symbol=chart.Symbol();
               timeframe=chart.Timeframe();
               CChartWnd *wnd=chart.GetWindowByNum(win_num);
               if(wnd!=NULL)
                  header=wnd.Header();
              }
           }
         Print(DFUN,symbol," ",TimeframeDescription(timeframe),", ID ",chart_id,", ",header,": ",CMessage::Text(MSG_CHART_OBJ_INDICATOR_REMOVED)," ",ind_name);
        }
      //--- "Changing indicator parameters in the chart window" event
      if(idx==CHART_OBJ_EVENT_CHART_WND_IND_CHANGE)
        {
         //::EventChartCustom(this.m_chart_id_main,(ushort)event,this.m_chart_id,this.WindowNum(),ind.Name());
         ENUM_TIMEFRAMES timeframe=WRONG_VALUE;
         string ind_name=sparam;
         string symbol=NULL;
         long   chart_id=lparam;
         int    win_num=(int)dparam;
         string header=NULL;

         CWndInd *ind=NULL;
         CWndInd *ind_changed=engine.ChartGetLastChangedIndicator();
         if(ind_changed!=NULL)
           {
            ind=engine.ChartGetIndicator(chart_id,win_num,ind_changed.Index());
            if(ind!=NULL)
              {
               CChartObj *chart=engine.ChartGetChartObj(chart_id);
               if(chart!=NULL)
                 {
                  symbol=chart.Symbol();
                  timeframe=chart.Timeframe();
                  CChartWnd *wnd=chart.GetWindowByNum(win_num);
                  if(wnd!=NULL)
                     header=wnd.Header();
                 }
              }
           }
         Print(DFUN,symbol," ",TimeframeDescription(timeframe),", ID ",chart_id,", ",header,": ",CMessage::Text(MSG_CHART_OBJ_INDICATOR_CHANGED)," ",ind_name," >>> ",ind.Name());
        }
     }

//--- Handling trading events
These are all the changes necessary for testing the newly created chart collection auto event functionality and testing the changes of specified collection object parameters.
Compile the EA and launch it on EURUSD after setting the use of EURUSD, GBPUSD and the current timeframe.
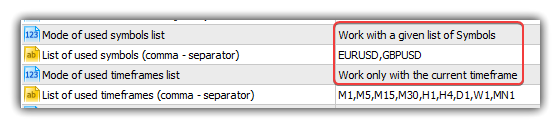
Both charts should be opened beforehand. Launch the EA on EURUSD, while GBPUSD should have a single subwindow with any oscillator indicator. We will use the subwindow to manage the event functionality of the chart collection class.
Let's check the chart timeframe change event:
Now let's change the chart symbol change:
Also, check managing the chart height change (the changes are applied to two charts — the main chart window and subwindow):

As we can see, several criteria are at play here: the window height is equal to the specified size, the window height is higher/lower than the specified size and the height of windows is increased/decreased by more than the specified number of pixels.
What's next?
The next article will start a new stage in the library development — working with graphical objects and custom graphics.
All files of the current version of the library are attached below together with the test EA file for MQL5 for you to test and download.
Leave your questions, comments and suggestions in the comments.
*Previous articles within the series:
Other classes in DoEasy library (Part 67): Chart object class
Other classes in DoEasy library (Part 68): Chart window object class and indicator object classes in the chart window
Other classes in DoEasy library (Part 69): Chart object collection class
Other classes in DoEasy library (Part 70): Expanding functionality and auto updating the chart object collection
Other classes in DoEasy library (Part 71): Chart object collection events
Translated from Russian by MetaQuotes Ltd.
Original article: https://www.mql5.com/ru/articles/9385
Warning: All rights to these materials are reserved by MetaQuotes Ltd. Copying or reprinting of these materials in whole or in part is prohibited.
This article was written by a user of the site and reflects their personal views. MetaQuotes Ltd is not responsible for the accuracy of the information presented, nor for any consequences resulting from the use of the solutions, strategies or recommendations described.

 Tips from a professional programmer (Part II): Storing and exchanging parameters between an Expert Advisor, scripts and external programs
- Free trading apps
- Over 8,000 signals for copying
- Economic news for exploring financial markets
You agree to website policy and terms of use
Artem, I have read your articles up to 34.
In it you have finished pending requests, the video at the end shows that you open an order and make a pending request to set the TP SL, after which the TP SL is set, but SL is deleted after a second.
Poganyal poked the panel, can not simultaneously use the pending request both in points and time, when triggered or stop is removed or take.
I downloaded the Expert Advisor from article 72, checked it, the same problem, the first triggers what I clicked on the panel last.
Artem, finished reading your articles up to 34.
In it you have finished pending requests, the video at the end shows that you open an order and make a pending request to set a TP SL, after which a TP SL is set, but the SL is deleted after a second.
I poked around the panel, I can't use pending request both in pips and time at the same time, either stop is deleted or takeout is deleted when triggered.
I downloaded the Expert Advisor from article 72, checked it, the same problem, the first triggers what I clicked on the panel last.
Thanks. I will have time to look into it. Most likely, at first glance, when one pending request is triggered, the others are deleted. I'll have a look when I have time. In any case, the library is still at the stage of refinement, and such bugs have the right to exist. The main thing is that there should be feedback from those interested, and then everything will be fixed.
Thank you. I'll have to take a look when I have time. Most likely, at first glance, when one pending request is triggered, the others are deleted as well. I'll have a look when I have time. In any case, the library is still at the stage of refinement, and such bugs have the right to exist. The main thing is that there should be feedback from those interested, and then everything will be fixed.
I am interested ))) Read and understand still I think a couple of weeks only in articles that would, at least, figuratively understand how everything is organised and how to use it... and I can not imagine how much in practice still ).
I've been waiting for a long time when there will be competent articles and most importantly a full-fledged OOP library with work on the Moscow Exchange. Last year I was out of life and did not visit the resource, but here I came and was horrified by the tonnes of top material.
Thank you for the work done, honestly speaking delighted at how people's brains can work in this plan
I am interested )) I think I will read and understand for a couple of weeks only in articles to at least understand figuratively how everything works and how to use it... and I don't know how much more in practice ).
I've been waiting for a long time when there will be competent articles and most importantly a full-fledged OOP library with work on the Moscow Exchange. Last year I was out of life and did not visit the resource, but here I came and was horrified by the tonnes of top material.
Thank you for the work done, honestly speaking delighted with how people's brains can work in this plan
Thanks for the assessment. Actually, it's just routine.
As for the Moscow Exchange, everything here needs to be thoroughly tested and bugs identified. Just like on Forex.
Thanks for the appraisal. It's really just a routine.
As for the Moscow Exchange, everything here needs to be thoroughly tested and bugs identified. Just like in forex.
I will finish reading up to this point, I will see what has already been done here, I just have all the strategies in the stack, I need its volumes, accumulations, etc. If the library allows you to fully work with the stack, its indices - prices - volumes, then I will rebuild my robot on your library and test it already.
It may reveal some flaws.
The main thing is not to give up, the content is great.