
Outras classes na biblioteca DoEasy (Parte 68): classe de objeto-gráfico e classes de objetos-indicadores na janela do gráfico

Sumário
Ideia
No último artigo começamos a desenvolver a classe de objeto-gráfico e fizemos a sua primeira versão. O objeto descreve um gráfico de terminal com todos os seus parâmetros. Permite que nós gerenciemos suas propriedades: obter e definir os parâmetros do tamanho da janela e da exibição dos elementos do gráfico.
Mas num gráfico podemos ter várias janelas onde também são colocados indicadores. Essas janelas têm seus próprios tamanhos, porém, por enquanto, nosso objeto-gráfico pode simplesmente retornar os parâmetros da subjanela especificada localizada nele e controlar sua altura. Numa subjanela (como na janela do gráfico principal) pode ser colocado um número diferente de indicadores, e precisamos levar isso em consideração para que, ao acessar o objeto-gráfico, possamos solicitar a janela localizada no gráfico e solicitar ao objeto-janela resultante uma lista de indicadores e obter o identificador desejado.
Hoje vamos criar dois objetos - um objeto do indicador na janela do gráfico que descreverá alguns parâmetros do indicador para identificá-lo, e um objeto da janela do gráfico que armazenará suas dimensões e uma lista de indicadores (objetos indicadores na janela do gráfico) anexados para isso. O objeto-gráfico que começamos a fazer no último artigo terá uma lista de objetos-janelas anexadas a ele (incluindo a janela de gráfico principal).
No futuro, essa hierarquia facilitará muito nosso trabalho com muitos gráficos e subjanelas com listas de indicadores. Infelizmente, ainda é muito cedo para criar a classe-coleção de objetos-gráficos, que foi anunciada no último artigo - precisamos completar todas as principais modificações do objeto-gráfico, o que faremos hoje.
Classe da janela do gráfico com objetos-indicadores
Em primeiro lugar, complementaremos a biblioteca com todos os textos de mensagens necessários.
No arquivo \MQL5\Include\DoEasy\Data.mqh escrevemos os índices das novas mensagens:
   MSG_CHART_OBJ_CHART_WINDOW,                        // Main chart window
   MSG_CHART_OBJ_CHART_SUBWINDOW,                     // Chart subwindow
   MSG_CHART_OBJ_CHART_SUBWINDOWS_NUM,                // Subwindows
   MSG_CHART_OBJ_INDICATORS_MW_NAME_LIST,             // Indicators in the main chart window
   MSG_CHART_OBJ_INDICATORS_SW_NAME_LIST,             // Indicators in the chart window
   MSG_CHART_OBJ_INDICATOR,                           // Indicator
   MSG_CHART_OBJ_INDICATORS_TOTAL,                    // Indicators
   MSG_CHART_OBJ_WINDOW_N,                            // Window
   MSG_CHART_OBJ_INDICATORS_NONE,                     // No indicators

  };
//+------------------------------------------------------------------+
bem como os textos das mensagens correspondentes aos índices adicionados recentemente:
   {"Главное окно графика","Main chart window"},
   {"Подокно графика","Chart subwindow"},
   {"Подокон","Subwindows"},
   {"Индикаторы в главном окне графика","Indicators in the main chart window"},
   {"Индикаторы в окне графика","Indicators in the chart window"},
   {"Индикатор","Indicator"},
   {"Индикаторов","Indicators total"},
   {"Окно","Window"},
   {"Отсутствуют","No indicators"},

  };
//+---------------------------------------------------------------------+
Ao criar uma enumeração de propriedades inteiras do objeto-gráfico, omitimos deliberadamente três propriedades que são inerentes não apenas ao objeto da janela principal, mas também a todas as subjanelas do gráfico:
- Visibilidade da subjanela,
- Distância em pixels ao longo do eixo Y vertical entre o quadro superior da subjanela do indicador e o quadro superior da janela do gráfico principal,
- Altura do gráfico em pixels.
São essas propriedades que serão as propriedades principais do objeto-janela do gráfico (exceto para a visibilidade da subjanela, que reconheceremos a partir do objeto-gráfico). A lista de janelas estará presente em cada objeto-gráfico e cada objeto terá seus próprios valores a nível dessas propriedades. Além disso, cada objeto-janela conterá uma lista de indicadores anexados a esta janela, e precisamos especificar constantes adicionais na enumeração de propriedades inteiras e strings do objeto-gráfico.
No arquivo \MQL5\Include\DoEasy\Defines.mqh descomentamos propriedades previamente definidas, mas, como as comentadas são as propriedades do objeto-janela, então escreveremos umas novas, para o objeto-indicador na janela do gráfico:
//+------------------------------------------------------------------+
//| Chart integer property                                           |
//+------------------------------------------------------------------+
enum ENUM_CHART_PROP_INTEGER
  {
   CHART_PROP_ID = 0,                                 // Chart ID
   CHART_PROP_TIMEFRAME,                              // Chart timeframe
   CHART_PROP_SHOW,                                   // Price chart drawing
   CHART_PROP_IS_OBJECT,                              // Chart object (OBJ_CHART) identification attribute
   CHART_PROP_BRING_TO_TOP,                           // Show chart above all others
   CHART_PROP_CONTEXT_MENU,                           // Enable/disable access to the context menu using the right click
   CHART_PROP_CROSSHAIR_TOOL,                         // Enable/disable access to the Crosshair tool using the middle click
   CHART_PROP_MOUSE_SCROLL,                           // Scroll the chart horizontally using the left mouse button
   CHART_PROP_EVENT_MOUSE_WHEEL,                      // Send messages about mouse wheel events (CHARTEVENT_MOUSE_WHEEL) to all MQL5 programs on a chart
   CHART_PROP_EVENT_MOUSE_MOVE,                       // Send messages about mouse button click and movement events (CHARTEVENT_MOUSE_MOVE) to all MQL5 programs on a chart
   CHART_PROP_EVENT_OBJECT_CREATE,                    // Send messages about the graphical object creation event (CHARTEVENT_OBJECT_CREATE) to all MQL5 programs on a chart
   CHART_PROP_EVENT_OBJECT_DELETE,                    // Send messages about the graphical object destruction event (CHARTEVENT_OBJECT_DELETE) to all MQL5 programs on a chart
   CHART_PROP_MODE,                                   // Type of the chart (candlesticks, bars or line (ENUM_CHART_MODE))
   CHART_PROP_FOREGROUND,                             // Price chart in the foreground
   CHART_PROP_SHIFT,                                  // Mode of shift of the price chart from the right border
   CHART_PROP_AUTOSCROLL,                             // The mode of automatic shift to the right border of the chart
   CHART_PROP_KEYBOARD_CONTROL,                       // Allow managing the chart using a keyboard
   CHART_PROP_QUICK_NAVIGATION,                       // Allow the chart to intercept Space and Enter key strokes to activate the quick navigation bar
   CHART_PROP_SCALE,                                  // Scale
   CHART_PROP_SCALEFIX,                               // Fixed scale mode
   CHART_PROP_SCALEFIX_11,                            // 1:1 scale mode
   CHART_PROP_SCALE_PT_PER_BAR,                       // The mode of specifying the scale in points per bar
   CHART_PROP_SHOW_TICKER,                            // Display a symbol ticker in the upper left corner
   CHART_PROP_SHOW_OHLC,                              // Display OHLC values in the upper left corner
   CHART_PROP_SHOW_BID_LINE,                          // Display Bid value as a horizontal line on the chart
   CHART_PROP_SHOW_ASK_LINE,                          // Display Ask value as a horizontal line on a chart
   CHART_PROP_SHOW_LAST_LINE,                         // Display Last value as a horizontal line on a chart
   CHART_PROP_SHOW_PERIOD_SEP,                        // Display vertical separators between adjacent periods
   CHART_PROP_SHOW_GRID,                              // Display a grid on the chart
   CHART_PROP_SHOW_VOLUMES,                           // Display volumes on a chart
   CHART_PROP_SHOW_OBJECT_DESCR,                      // Display text descriptions of objects
   CHART_PROP_VISIBLE_BARS,                           // Number of bars on a chart that are available for display
   CHART_PROP_WINDOWS_TOTAL,                          // The total number of chart windows including indicator subwindows
   CHART_PROP_WINDOW_IS_VISIBLE,                      // Subwindow visibility
   CHART_PROP_WINDOW_HANDLE,                          // Chart window handle
   CHART_PROP_WINDOW_YDISTANCE,                       // Distance in Y axis pixels between the upper frame of the indicator subwindow and the upper frame of the chart main window
   CHART_PROP_FIRST_VISIBLE_BAR,                      // Number of the first visible bar on the chart
   CHART_PROP_WIDTH_IN_BARS,                          // Width of the chart in bars
   CHART_PROP_WIDTH_IN_PIXELS,                        // Width of the chart in pixels
   CHART_PROP_HEIGHT_IN_PIXELS,                       // Height of the chart in pixels
   CHART_PROP_COLOR_BACKGROUND,                       // Color of background of the chart
   CHART_PROP_COLOR_FOREGROUND,                       // Color of axes, scale and OHLC line
   CHART_PROP_COLOR_GRID,                             // Grid color
   CHART_PROP_COLOR_VOLUME,                           // Color of volumes and position opening levels
   CHART_PROP_COLOR_CHART_UP,                         // Color for the up bar, shadows and body borders of bull candlesticks
   CHART_PROP_COLOR_CHART_DOWN,                       // Color of down bar, its shadow and border of body of the bullish candlestick
   CHART_PROP_COLOR_CHART_LINE,                       // Color of the chart line and the Doji candlesticks
   CHART_PROP_COLOR_CANDLE_BULL,                      // Color of body of a bullish candlestick
   CHART_PROP_COLOR_CANDLE_BEAR,                      // Color of body of a bearish candlestick
   CHART_PROP_COLOR_BID,                              // Color of the Bid price line
   CHART_PROP_COLOR_ASK,                              // Color of the Ask price line
   CHART_PROP_COLOR_LAST,                             // Color of the last performed deal's price line (Last)
   CHART_PROP_COLOR_STOP_LEVEL,                       // Color of stop order levels (Stop Loss and Take Profit)
   CHART_PROP_SHOW_TRADE_LEVELS,                      // Display trade levels on the chart (levels of open positions, Stop Loss, Take Profit and pending orders)
   CHART_PROP_DRAG_TRADE_LEVELS,                      // Enable the ability to drag trading levels on a chart using mouse
   CHART_PROP_SHOW_DATE_SCALE,                        // Display the time scale on a chart
   CHART_PROP_SHOW_PRICE_SCALE,                       // Display a price scale on a chart
   CHART_PROP_SHOW_ONE_CLICK,                         // Display the quick trading panel on the chart
   CHART_PROP_IS_MAXIMIZED,                           // Chart window maximized
   CHART_PROP_IS_MINIMIZED,                           // Chart window minimized
   CHART_PROP_IS_DOCKED,                              // Chart window docked
   CHART_PROP_FLOAT_LEFT,                             // Left coordinate of the undocked chart window relative to the virtual screen
   CHART_PROP_FLOAT_TOP,                              // Upper coordinate of the undocked chart window relative to the virtual screen
   CHART_PROP_FLOAT_RIGHT,                            // Right coordinate of the undocked chart window relative to the virtual screen
   CHART_PROP_FLOAT_BOTTOM,                           // Bottom coordinate of the undocked chart window relative to the virtual screen
   //--- CWndInd
   CHART_PROP_WINDOW_IND_HANDLE,                      // Indicator handle in the chart window
   CHART_PROP_WINDOW_IND_INDEX,                       // Indicator index in the chart window
  };
#define CHART_PROP_INTEGER_TOTAL (67)                 // Total number of integer properties
#define CHART_PROP_INTEGER_SKIP  (0)                  // Number of integer DOM properties not used in sorting
//+------------------------------------------------------------------+
//| Chart real properties                                            |
//+------------------------------------------------------------------+
enum ENUM_CHART_PROP_DOUBLE
  {
   CHART_PROP_SHIFT_SIZE = CHART_PROP_INTEGER_TOTAL,  // Shift size of the zero bar from the right border in %
   CHART_PROP_FIXED_POSITION,                         // Chart fixed position from the left border in %
   CHART_PROP_FIXED_MAX,                              // Chart fixed maximum
   CHART_PROP_FIXED_MIN,                              // Chart fixed minimum
   CHART_PROP_POINTS_PER_BAR,                         // Scale in points per bar
   CHART_PROP_PRICE_MIN,                              // Chart minimum
   CHART_PROP_PRICE_MAX,                              // Chart maximum
  };
#define CHART_PROP_DOUBLE_TOTAL  (7)                  // Total number of real properties
#define CHART_PROP_DOUBLE_SKIP   (0)                  // Number of real properties not used in sorting
//+------------------------------------------------------------------+
//| Chart string properties                                          |
//+------------------------------------------------------------------+
enum ENUM_CHART_PROP_STRING
  {
   CHART_PROP_COMMENT = (CHART_PROP_INTEGER_TOTAL+CHART_PROP_DOUBLE_TOTAL), // Chart comment text
   CHART_PROP_EXPERT_NAME,                            // Name of an EA launched on the chart
   CHART_PROP_SCRIPT_NAME,                            // Name of a script launched on the chart
   CHART_PROP_INDICATOR_NAME,                         // Name of an indicator launched on the chart
   CHART_PROP_SYMBOL,                                 // Chart symbol
  };
#define CHART_PROP_STRING_TOTAL  (5)                  // Total number of string properties
//+------------------------------------------------------------------+
Assim, alteramos os valores do número de propriedades, em cujas enumerações adicionamos novas constantes — número de propriedades inteiras é aumentado de 62 para a 67, e o número de strings de 4 para a 5.
Na lista de critérios possíveis para a classificação de objetos-gráficos escrevemos novos critérios correspondente às propriedades recém-adicionadas:
//+------------------------------------------------------------------+
//| Possible chart sorting criteria                                  |
//+------------------------------------------------------------------+
#define FIRST_CHART_DBL_PROP  (CHART_PROP_INTEGER_TOTAL-CHART_PROP_INTEGER_SKIP)
#define FIRST_CHART_STR_PROP  (CHART_PROP_INTEGER_TOTAL-CHART_PROP_INTEGER_SKIP+CHART_PROP_DOUBLE_TOTAL-CHART_PROP_DOUBLE_SKIP)
enum ENUM_SORT_CHART_MODE
  {
//--- Sort by integer properties
   SORT_BY_CHART_SHOW = 0,                            // Sort by the price chart drawing attribute
   SORT_BY_CHART_IS_OBJECT,                           // Sort by chart object (OBJ_CHART) identification attribute
   SORT_BY_CHART_BRING_TO_TOP,                        // Sort by the flag of displaying a chart above all others
   SORT_BY_CHART_CONTEXT_MENU,                        // Sort by the flag of enabling/disabling access to the context menu using the right click
   SORT_BY_CHART_CROSSHAIR_TOO,                       // Sort by the flag of enabling/disabling access to the Crosshair tool using the middle click
   SORT_BY_CHART_MOUSE_SCROLL,                        // Sort by the flag of scrolling the chart horizontally using the left mouse button
   SORT_BY_CHART_EVENT_MOUSE_WHEEL,                   // Sort by the flag of sending messages about mouse wheel events to all MQL5 programs on a chart
   SORT_BY_CHART_EVENT_MOUSE_MOVE,                    // Sort by the flag of sending messages about mouse button click and movement events to all MQL5 programs on a chart
   SORT_BY_CHART_EVENT_OBJECT_CREATE,                 // Sort by the flag of sending messages about the graphical object creation event to all MQL5 programs on a chart
   SORT_BY_CHART_EVENT_OBJECT_DELETE,                 // Sort by the flag of sending messages about the graphical object destruction event to all MQL5 programs on a chart
   SORT_BY_CHART_MODE,                                // Sort by chart type
   SORT_BY_CHART_FOREGROUND,                          // Sort by the "Price chart in the foreground" flag
   SORT_BY_CHART_SHIFT,                               // Sort by the "Mode of shift of the price chart from the right border" flag
   SORT_BY_CHART_AUTOSCROLL,                          // Sort by the "The mode of automatic shift to the right border of the chart" flag
   SORT_BY_CHART_KEYBOARD_CONTROL,                    // Sort by the flag allowing the chart management using a keyboard
   SORT_BY_CHART_QUICK_NAVIGATION,                    // Sort by the flag allowing the chart to intercept Space and Enter key strokes to activate the quick navigation bar
   SORT_BY_CHART_SCALE,                               // Sort by scale
   SORT_BY_CHART_SCALEFIX,                            // Sort by the fixed scale flag
   SORT_BY_CHART_SCALEFIX_11,                         // Sort by the 1:1 scale flag
   SORT_BY_CHART_SCALE_PT_PER_BAR,                    // Sort by the flag of specifying the scale in points per bar
   SORT_BY_CHART_SHOW_TICKER,                         // Sort by the flag displaying a symbol ticker in the upper left corner
   SORT_BY_CHART_SHOW_OHLC,                           // Sort by the flag displaying OHLC values in the upper left corner
   SORT_BY_CHART_SHOW_BID_LINE,                       // Sort by the flag displaying Bid value as a horizontal line on the chart
   SORT_BY_CHART_SHOW_ASK_LINE,                       // Sort by the flag displaying Ask value as a horizontal line on the chart
   SORT_BY_CHART_SHOW_LAST_LINE,                      // Sort by the flag displaying Last value as a horizontal line on the chart
   SORT_BY_CHART_SHOW_PERIOD_SEP,                     // Sort by the flag displaying vertical separators between adjacent periods
   SORT_BY_CHART_SHOW_GRID,                           // Sort by the flag of displaying a grid on the chart
   SORT_BY_CHART_SHOW_VOLUMES,                        // Sort by the mode of displaying volumes on a chart
   SORT_BY_CHART_SHOW_OBJECT_DESCR,                   // Sort by the flag of displaying object text descriptions
   SORT_BY_CHART_VISIBLE_BARS,                        // Sort by the number of bars on a chart that are available for display
   SORT_BY_CHART_WINDOWS_TOTAL,                       // Sort by the total number of chart windows including indicator subwindows
   SORT_BY_CHART_WINDOW_IS_VISIBLE,                   // Sort by the subwindow visibility flag
   SORT_BY_CHART_WINDOW_HANDLE,                       // Sort by the chart handle
   SORT_BY_CHART_WINDOW_YDISTANCE,                    // Sort by the distance in Y axis pixels between the upper frame of the indicator subwindow and the upper frame of the chart main window
   SORT_BY_CHART_FIRST_VISIBLE_BAR,                   // Sort by the number of the first visible bar on the chart
   SORT_BY_CHART_WIDTH_IN_BARS,                       // Sort by the width of the chart in bars
   SORT_BY_CHART_WIDTH_IN_PIXELS,                     // Sort by the width of the chart in pixels
   SORT_BY_CHART_HEIGHT_IN_PIXELS,                    // Sort by the height of the chart in pixels
   SORT_BY_CHART_COLOR_BACKGROUND,                    // Sort by the color of the chart background
   SORT_BY_CHART_COLOR_FOREGROUND,                    // Sort by color of axes, scale and OHLC line
   SORT_BY_CHART_COLOR_GRID,                          // Sort by grid color
   SORT_BY_CHART_COLOR_VOLUME,                        // Sort by the color of volumes and position opening levels
   SORT_BY_CHART_COLOR_CHART_UP,                      // Sort by the color for the up bar, shadows and body borders of bull candlesticks
   SORT_BY_CHART_COLOR_CHART_DOWN,                    // Sort by the color of down bar, its shadow and border of body of the bullish candlestick
   SORT_BY_CHART_COLOR_CHART_LINE,                    // Sort by the color of the chart line and the Doji candlesticks
   SORT_BY_CHART_COLOR_CANDLE_BULL,                   // Sort by the color of a bullish candlestick body
   SORT_BY_CHART_COLOR_CANDLE_BEAR,                   // Sort by the color of a bearish candlestick body
   SORT_BY_CHART_COLOR_BID,                           // Sort by the color of the Bid price line
   SORT_BY_CHART_COLOR_ASK,                           // Sort by the color of the Ask price line
   SORT_BY_CHART_COLOR_LAST,                          // Sort by the color of the last performed deal's price line (Last)
   SORT_BY_CHART_COLOR_STOP_LEVEL,                    // Sort by the color of stop order levels (Stop Loss and Take Profit)
   SORT_BY_CHART_SHOW_TRADE_LEVELS,                   // Sort by the flag of displaying trading levels on the chart
   SORT_BY_CHART_DRAG_TRADE_LEVELS,                   // Sort by the flag enabling the ability to drag trading levels on a chart using mouse
   SORT_BY_CHART_SHOW_DATE_SCALE,                     // Sort by the flag of displaying the time scale on the chart
   SORT_BY_CHART_SHOW_PRICE_SCALE,                    // Sort by the flag of displaying the price scale on the chart
   SORT_BY_CHART_SHOW_ONE_CLICK,                      // Sort by the flag of displaying the quick trading panel on the chart
   SORT_BY_CHART_IS_MAXIMIZED,                        // Sort by the "Chart window maximized" flag
   SORT_BY_CHART_IS_MINIMIZED,                        // Sort by the "Chart window minimized" flag
   SORT_BY_CHART_IS_DOCKED,                           // Sort by the "Chart window docked" flag
   SORT_BY_CHART_FLOAT_LEFT,                          // Sort by the left coordinate of the undocked chart window relative to the virtual screen
   SORT_BY_CHART_FLOAT_TOP,                           // Sort by the upper coordinate of the undocked chart window relative to the virtual screen
   SORT_BY_CHART_FLOAT_RIGHT,                         // Sort by the right coordinate of the undocked chart window relative to the virtual screen
   SORT_BY_CHART_FLOAT_BOTTOM,                        // Sort by the bottom coordinate of the undocked chart window relative to the virtual screen
   SORT_BY_CHART_WINDOW_IND_HANDLE,                   // Sort by the indicator handle in the chart window
   SORT_BY_CHART_WINDOW_IND_INDEX,                    // Sort by the indicator index in the chart window
//--- Sort by real properties
   SORT_BY_CHART_SHIFT_SIZE = FIRST_CHART_DBL_PROP,   // Sort by the shift size of the zero bar from the right border in %
   SORT_BY_CHART_FIXED_POSITION,                      // Sort by the chart fixed position from the left border in %
   SORT_BY_CHART_FIXED_MAX,                           // Sort by the fixed chart maximum
   SORT_BY_CHART_FIXED_MIN,                           // Sort by the fixed chart minimum
   SORT_BY_CHART_POINTS_PER_BAR,                      // Sort by the scale value in points per bar
   SORT_BY_CHART_PRICE_MIN,                           // Sort by the chart minimum
   SORT_BY_CHART_PRICE_MAX,                           // Sort by the chart maximum
//--- Sort by string properties
   SORT_BY_CHART_COMMENT = FIRST_CHART_STR_PROP,      // Sort by a comment text on the chart
   SORT_BY_CHART_EXPERT_NAME,                         // Sort by a name of an EA launched on the chart
   SORT_BY_CHART_SCRIPT_NAME,                         // Sort by a name of a script launched on the chart
   SORT_BY_CHART_INDICATOR_NAME,                      // Sort by a name of an indicator launched on the chart
   SORT_BY_CHART_SYMBOL,                              // Sort by chart symbol
  };
//+------------------------------------------------------------------+
Na primeira versão do objeto-gráfico, esta lista de critérios estava incorreta, uma vez que as propriedades inteiras comentadas do gráfico foram adicionadas aos critérios de classificação e não havia classificação por nome de símbolo. Nós consertamos isso hoje.
Agora precisamos criar duas classes - classe do objeto-indicador na janela do gráfico e a classe do objeto-janela do gráfico. Vamos colocá-los num arquivo de uma vez.
Na pasta da biblioteca \MQL5\Include\DoEasy\Objects\Chart\ criamos um novo arquivo ChartWnd.mqh das classes CWndInd (indicador na janela do gráfico) e CChartWnd (janela do gráfico).
A classe CWndInd deve ser herdada da classe base da biblioteca padrão CObject, e a classe CChartWnd deve ser herdada do objeto base da biblioteca CBaseObj.
Muitos indicadores diferentes podem ser anexados à janela do gráfico. Assim, o objeto da janela do gráfico deve saber sobre sua existência para que possamos sempre obter o identificador do indicador necessário a partir da janela do gráfico e, em seguida, trabalhar com ele. Para identificar os indicadores, não precisamos de muitos parâmetros, basta conhecer o identificador do indicador, seu nome abreviado e o índice da janela do gráfico à qual o indicador está anexado. Portanto, a classe do objeto-indicador na janela do gráfico será a mais simples e será herdada do objeto base da biblioteca padrão, apenas para que possamos adicionar todos esses objetos à lista de ponteiros para objetos CArrayObj incluída no objeto-janela do gráfico.
Escrevemos o código da nova classe no arquivo ChartWnd.mqh recém-criado:
//+------------------------------------------------------------------+
//|                                                     ChartWnd.mqh |
//|                                  Copyright 2021, MetaQuotes Ltd. |
//|                             https://mql5.com/en/users/artmedia70 |
//+------------------------------------------------------------------+
#property copyright "Copyright 2021, MetaQuotes Ltd."
#property link      "https://mql5.com/en/users/artmedia70"
#property version   "1.00"
#property strict    // Necessary for mql4
//+------------------------------------------------------------------+
//| Include files                                                    |
//+------------------------------------------------------------------+
#include "..\..\Objects\BaseObj.mqh"
//+------------------------------------------------------------------+
//| Chart window indicator object class                              |
//+------------------------------------------------------------------+
class CWndInd : public CObject
  {
private:
   long              m_chart_id;                         // Chart ID
   string            m_name;                             // Indicator short name
   int               m_index;                            // Window index on the chart
   int               m_handle;                           // Indicator handle
public:
//--- Return itself
   CWndInd          *GetObject(void)                     { return &this;         }
//--- Return (1) indicator name, (2) window index and (3) indicator handle
   string            Name(void)                    const { return this.m_name;   }
   int               Index(void)                   const { return this.m_index;  }
   int               Handle(void)                  const { return this.m_handle; }

//--- Display the description of object properties in the journal (dash=true - hyphen before the description, false - description only)
   void              Print(const bool dash=false)        { ::Print((dash ? "- " : "")+this.Header());                      }
//--- Return the object short name
   string            Header(void)                  const { return CMessage::Text(MSG_CHART_OBJ_INDICATOR)+" "+this.Name(); }

//--- Compare CWndInd objects with each other by the specified property
   virtual int       Compare(const CObject *node,const int mode=0) const;

//--- Constructors
                     CWndInd(void);
                     CWndInd(const int handle,const string name,const int index) : m_handle(handle),m_name(name),m_index(index) {}
  };
//+-----------------------------------------------------------------------+
//| Compare CWndInd objects with each other by the specified property     |
//+-----------------------------------------------------------------------+
int CWndInd::Compare(const CObject *node,const int mode=0) const
  {
   const CWndInd *obj_compared=node;
   if(mode==CHART_PROP_WINDOW_IND_HANDLE) return(this.Handle()>obj_compared.Handle() ? 1 : this.Handle()<obj_compared.Handle() ? -1 : 0);
   else if(mode==CHART_PROP_WINDOW_IND_INDEX) return(this.Index()>obj_compared.Index() ? 1 : this.Index()<obj_compared.Index() ? -1 : 0);
   return(this.Name()==obj_compared.Name() ? 0 : this.Name()<obj_compared.Name() ? -1 : 1);
  }
//+------------------------------------------------------------------+
Esta é toda a classe do objeto-indicador na janela do gráfico.
A seção privada contém variáveis-membros de classe para armazenamento:
- identificador do gráfico onde está localizada a janela com este indicador,
- nome curto do indicador (nas janelas dos gráficos, os indicadores são identificados pelo terminal por seus nomes curtos),
- índice da janela do gráfico onde está localizado o indicador (índice 0 - a janela do gráfico principal, índice 1 e mais - subjanelas do gráfico),
- identificador deste indicador.
Esses dados serão suficientes para armazenarmos no objeto-janela do gráfico uma lista de todos os indicadores anexados à ela. A própria lista conterá exatamente esses objetos, pelos quais podemos encontrar o indicador necessário e retornar seu identificador.
Os métodos públicos que retornam os valores das variáveis acima são autoexplicativos. Vamos considerar alguns outros métodos de classe.
Método que retorna o nome abreviado do objeto-indicador:
//--- Return the object short name
   string            Header(void)                  const { return CMessage::Text(MSG_CHART_OBJ_INDICATOR)+" "+this.Name(); }
O título "Indicador" + nome abreviado do indicador é simplesmente retornado.
Método que imprime a descrição das propriedades do objeto-indicador no log:
//--- Display the description of object properties in the journal (dash=true - hyphen before the description, false - description only)
   void              Print(const bool dash=false)        { ::Print((dash ? "- " : "")+this.Header());                      }
Como pode haver vários indicadores na janela do gráfico, eles serão exibidos como uma lista sob o título. Por isso, para uma visualização mais bonita da lista no log, usaremos um hífen antes do nome do indicador, a necessidade de exibição que será indicada pelo parâmetro de entrada do método.
Temos dois construtores, um é o padrão e o outro é paramétrico. O construtor padrão pode ser útil para criar um objeto-indicador "vazio" na janela, e o construtor paramétrico será usado como o construtor principal da classe ao criar uma lista de indicadores na classe do objeto-janela do gráfico.
Ao construtor paramétrico é transmitido o identificador do indicador, seu nome curto e o índice de subjanela onde este indicador está localizado.
//--- Constructors
                     CWndInd(void);
                     CWndInd(const int handle,const string name,const int index) : m_handle(handle),m_name(name),m_index(index) {}
Todos os valores dos parâmetros passados para o método são imediatamente atribuídos às variáveis de classe em sua lista de inicialização.
Método para comparar a propriedade especificada dos objetos-indicadores da janela do gráfico:
//+------------------------------------------------------------------+
//| Compare CWndInd objects with each other by the specified property|
//+------------------------------------------------------------------+
int CWndInd::Compare(const CObject *node,const int mode=0) const
  {
   const CWndInd *obj_compared=node;
   if(mode==CHART_PROP_WINDOW_IND_HANDLE) return(this.Handle()>obj_compared.Handle() ? 1 : this.Handle()<obj_compared.Handle() ? -1 : 0);
   else if(mode==CHART_PROP_WINDOW_IND_INDEX) return(this.Index()>obj_compared.Index() ? 1 : this.Index()<obj_compared.Index() ? -1 : 0);
   return(this.Name()==obj_compared.Name() ? 0 : this.Name()<obj_compared.Name() ? -1 : 1);
  }
//+------------------------------------------------------------------+
Para este objeto, não temos nossas próprias enumerações de propriedades, pois todas elas estão presentes nas enumerações das propriedades do objeto-gráfico. Por isso, qualquer uma das propriedades do objeto-gráfico pode ser passada para o método, mas a comparação com base nas propriedades passadas será realizada apenas se no parâmetro modoe for transferida a propriedade de "identificador do indicador" ou "índice da janela do gráfico". Em quaisquer outros casos, a comparação será realizada com base no nome abreviado do indicador.
O método de comparação é padrão para todos os objetos da biblioteca: se o valor do parâmetro do objeto atual for maior que o do objeto comparado, será retornado 1, já se o valor do parâmetro do objeto atual for menor que o do comparado, será retornado -1, caso contrário, 0.
Vamos começar a criar a classe do objeto-janela do gráfico.
No mesmo arquivo onde escrevemos a classe do objeto indicador para a janela do gráfico (ChartWnd.mqh), continuaremos a escrever o código e inserir a classe do objeto-janela. A classe deve ser herdada do objeto base de todos os objetos da biblioteca CBaseObj:
//+------------------------------------------------------------------+
//| Chart window object class                                        |
//+------------------------------------------------------------------+
class CChartWnd : public CBaseObj
  {
  }
A seção privada da classe conterá a lista de ponteiros para objetos-indicadores nesta janela, o número desta subjanela descrito pelo objeto e os métodos auxiliares para desenvolver o trabalho da classe:
//+------------------------------------------------------------------+
//| Chart window object class                                        |
//+------------------------------------------------------------------+
class CChartWnd : public CBaseObj
  {
private:
   CArrayObj         m_list_ind;                                        // Indicator list
   int               m_window_num;                                      // Subwindow index
//--- Return the flag indicating the presence of an indicator from the list in the window
   bool              IsPresentInWindow(const CWndInd *ind);
//--- Remove indicators not present in the window from the list
   void              IndicatorsDelete(void);
//--- Add new indicators to the list
   void              IndicatorsAdd(void);
//--- Set a subwindow index
   void              SetWindowNum(const int num)                        { this.m_window_num=num;   }
public:
A seção pública da classe contém métodos padrão para objetos de biblioteca (com exceção dos métodos para definir valores de propriedade, já que este objeto não tem suas próprias listas de propriedades, e nós apenas retornaremos os valores requeridos descritos por algumas propriedades do objeto-gráfico que pertencem à janela do gráfico), e já falamos bastante sobre esses métodos em artigos anteriores.
Também na classe há métodos para definir e retornar valores de propriedades da janela e para trabalhar com a classe. Vamos ver sua estrutura abaixo.
//+------------------------------------------------------------------+
//| Chart window object class                                        |
//+------------------------------------------------------------------+
class CChartWnd : public CBaseObj
  {
private:
   CArrayObj         m_list_ind;                                        // Indicator list
   int               m_window_num;                                      // Subwindow index
//--- Return the flag indicating the presence of an indicator from the list in the window
   bool              IsPresentInWindow(const CWndInd *ind);
//--- Remove indicators not present in the window from the list
   void              IndicatorsDelete(void);
//--- Add new indicators to the list
   void              IndicatorsAdd(void);
//--- Set a subwindow index
   void              SetWindowNum(const int num)                        { this.m_window_num=num;   }
public:
//--- Return itself
   CChartWnd        *GetObject(void)                                    { return &this;            }

//--- Return the flag of the object supporting this property
   virtual bool      SupportProperty(ENUM_CHART_PROP_INTEGER property)  { return(property==CHART_PROP_WINDOW_YDISTANCE || property==CHART_PROP_HEIGHT_IN_PIXELS ? true : false); }
   virtual bool      SupportProperty(ENUM_CHART_PROP_DOUBLE property)   { return false; }
   virtual bool      SupportProperty(ENUM_CHART_PROP_STRING property)   { return (property==CHART_PROP_INDICATOR_NAME ? true : false); }

//--- Get description of (1) integer, (2) real and (3) string properties
   string            GetPropertyDescription(ENUM_CHART_PROP_INTEGER property);
   string            GetPropertyDescription(ENUM_CHART_PROP_DOUBLE property)  { return CMessage::Text(MSG_LIB_PROP_NOT_SUPPORTED);  }
   string            GetPropertyDescription(ENUM_CHART_PROP_STRING property)  { return CMessage::Text(MSG_LIB_PROP_NOT_SUPPORTED);  }

//--- Display the description of object properties in the journal (full_prop=true - all properties, false - supported ones only)
   void              Print(const bool full_prop=false);
//--- Display a short description of the object in the journal
   virtual void      PrintShort(const bool dash=false);
//--- Return the object short name
   virtual string    Header(void);

//--- Compare CChartWnd objects by a specified property (to sort the list by an MQL5 signal object)
   virtual int       Compare(const CObject *node,const int mode=0) const;
//--- Compare CChartWnd objects by all properties (to search for equal MQL5 signal objects)
   bool              IsEqual(CChartWnd* compared_obj) const;

//--- Constructors
                     CChartWnd(void);
                     CChartWnd(const long chart_id,const int wnd_num);

//--- Return the distance in pixels between the window borders
   int               YDistance(void)                              const { return (int)::ChartGetInteger(this.m_chart_id,CHART_WINDOW_YDISTANCE,this.m_window_num);}
//--- (1) Return and (2) set the window height in pixels
   int               HeightInPixels(void)                         const { return (int)::ChartGetInteger(this.m_chart_id,CHART_HEIGHT_IN_PIXELS,this.m_window_num);}
   bool              SetHeightInPixels(const int value,const bool redraw=false);
//--- Return (1) the subwindow index and (2) the number of indicators attached to the window
   int               WindowNum(void)                              const { return this.m_window_num;}
   int               IndicatorsTotal(void)                        const { return this.m_list_ind.Total();   }

//--- Return (1) the indicator list and (2) the window indicator object from the list by index
   CArrayObj        *GetIndicatorsList(void)                            { return &this.m_list_ind;          }
   CWndInd          *GetIndicator(const int index)                      { return this.m_list_ind.At(index); }

//--- Display the description of indicators attached to the chart window in the journal
   void              PrintIndicators(const bool dash=false);
//--- Display the description of the window parameters in the journal
   void              PrintParameters(const bool dash=false);

//--- Create the list of indicators attached to the window
   void              IndicatorsListCreate(void);
//--- Update data on attached indicators
   void              Refresh(void);

  };
//+------------------------------------------------------------------+
Método que retorna a distância em pixels entre as bordas das janelas:
//--- Return the distance in pixels between the window borders
   int YDistance(void) const { return (int)::ChartGetInteger(this.m_chart_id,CHART_WINDOW_YDISTANCE,this.m_window_num);}
Visto que a propriedade do gráfico CHART_WINDOW_YDISTANCE é somente leitura, não há método para definir esse valor. O método simplesmente retorna o valor desta propriedade para esta subjanela do gráfico.
Método que retorna a altura da janela em pixels:
int HeightInPixels(void) const { return (int)::ChartGetInteger(this.m_chart_id,CHART_HEIGHT_IN_PIXELS,this.m_window_num);}
Funciona de forma idêntica ao anterior e retorna o valor desta propriedade para o número da janela especificado na variável m_window_num.
Método que define a altura da janela em pixels (declarado no corpo da classe, mas implementado fora desta):
//+------------------------------------------------------------------+
//| Set the window height in pixels                                  |
//+------------------------------------------------------------------+
bool CChartWnd::SetHeightInPixels(const int value,const bool redraw=false)
  {
   ::ResetLastError();
   if(!::ChartSetInteger(this.m_chart_id,CHART_HEIGHT_IN_PIXELS,this.m_window_num,value))
     {
      CMessage::ToLog(DFUN,::GetLastError(),true);
      return false;
     }
   if(redraw)
      ::ChartRedraw(this.m_chart_id);
   return true;
  }
//+------------------------------------------------------------------+
O método é semelhante aos que definem os valores das propriedades do objeto-gráfico, que vimos no último artigo. O valor necessário para a configuração é passado para o método, depois, tentamos defini-lo para a janela usando a função ChartSetInteger(), e se o evento de alteração do gráfico não estiver na fila, então retornamos false. Se o evento for colocado na fila com sucesso, retornaremos true primeiro redesenhando o gráfico quando o sinalizador redraw é definido. O redesenho forçado do gráfico não é necessário para esperar por nenhum evento do gráfico (chegada de uma cotação, redimensionamento, cliques do mouse, etc.) para exibir as alterações, mas, sim, para redesenhar imediatamente o gráfico e ver o resultado.
Método que compara a propriedade especificada dos objetos da janela:
//+------------------------------------------------------------------+
//| Compare CChartWnd objects with each other by a specified property|
//+------------------------------------------------------------------+
int CChartWnd::Compare(const CObject *node,const int mode=0) const
  {
   const CChartWnd *obj_compared=node;
   if(mode==CHART_PROP_WINDOW_YDISTANCE)
      return(this.YDistance()>obj_compared.YDistance() ? 1 : this.YDistance()<obj_compared.YDistance() ? -1 : 0);
   else if(mode==CHART_PROP_HEIGHT_IN_PIXELS)
      return(this.HeightInPixels()>obj_compared.HeightInPixels() ? 1 : this.HeightInPixels()<obj_compared.HeightInPixels() ? -1 : 0);
   return -1;
  }
//+------------------------------------------------------------------+
Aqui, assim como no método de comparação na classe do indicador da janela discutido acima, comparamos apenas algumas das propriedades especificadas nas enumerações das propriedades do objeto-gráfico:
- Distância em pixels ao longo do eixo Y vertical entre o quadro superior da subjanela do indicador e o quadro superior da janela do gráfico principal,
- A altura do gráfico em pixels,
- Em qualquer outro caso, retornamos -1
Método que comparar todas as propriedades dos objetos da janela do gráfico:
//+------------------------------------------------------------------+
//| Compare the CChartWnd objects by all properties                  |
//+------------------------------------------------------------------+
bool CChartWnd::IsEqual(CChartWnd *compared_obj) const
  {
   return(this.YDistance()!=compared_obj.YDistance() || this.HeightInPixels()!=compared_obj.HeightInPixels() ? false : true);
  }
//+------------------------------------------------------------------+
Aqui: se pelo menos uma das duas propriedades dos objetos comparados retorna desigualdade, então retornamos false - os objetos não são iguais. Caso contrário, devolvemos true - os objetos são idênticos.
Método que retorna uma descrição de uma propriedade inteira:
//+------------------------------------------------------------------+
//| Return description of object's integer property                  |
//+------------------------------------------------------------------+
string CChartWnd::GetPropertyDescription(ENUM_CHART_PROP_INTEGER property)
  {
   return
     (
      property==CHART_PROP_WINDOW_YDISTANCE  ?  CMessage::Text(MSG_CHART_OBJ_WINDOW_YDISTANCE)+
         (!this.SupportProperty(property) ?  ": "+CMessage::Text(MSG_LIB_PROP_NOT_SUPPORTED) :
          ": "+(string)this.YDistance()
         )  :
      property==CHART_PROP_HEIGHT_IN_PIXELS  ?  CMessage::Text(MSG_CHART_OBJ_HEIGHT_IN_PIXELS)+
         (!this.SupportProperty(property) ?  ": "+CMessage::Text(MSG_LIB_PROP_NOT_SUPPORTED) :
          ": "+(string)this.HeightInPixels()
         )  :
      ""
     );
  }
//+------------------------------------------------------------------+
Dependendo de qual das duas propriedades inteiras do objeto-janela do gráfico é passada para o método, uma string com sua descrição é criada e retornada.
Método que registra no log as propriedades do objeto:
//+------------------------------------------------------------------+
//| Display object properties in the journal                         |
//+------------------------------------------------------------------+
void CChartWnd::Print(const bool full_prop=false)
  {
   ::Print("============= ",CMessage::Text(MSG_LIB_PARAMS_LIST_BEG)," (",this.Header(),") =============");
   int beg=0, end=CHART_PROP_INTEGER_TOTAL;
   for(int i=beg; i<end; i++)
     {
      ENUM_CHART_PROP_INTEGER prop=(ENUM_CHART_PROP_INTEGER)i;
      if(prop!=CHART_PROP_WINDOW_YDISTANCE && prop!=CHART_PROP_HEIGHT_IN_PIXELS) continue;
      if(!full_prop && !this.SupportProperty(prop)) continue;
      ::Print(this.GetPropertyDescription(prop));
     }
   ::Print("------");
   beg=end; end+=CHART_PROP_DOUBLE_TOTAL;
   for(int i=beg; i<end; i++)
     {
      //ENUM_CHART_PROP_DOUBLE prop=(ENUM_CHART_PROP_DOUBLE)i;
      //if(!full_prop && !this.SupportProperty(prop)) continue;
      //::Print(this.GetPropertyDescription(prop));
     }
   beg=end; end+=CHART_PROP_STRING_TOTAL;
   for(int i=beg; i<end; i++)
     {
      ENUM_CHART_PROP_STRING prop=(ENUM_CHART_PROP_STRING)i;
      if(prop==CHART_PROP_INDICATOR_NAME)
        {
         this.PrintIndicators();
         continue;
        }
      if(!full_prop && !this.SupportProperty(prop)) continue;
      ::Print(this.GetPropertyDescription(prop));
     }
   ::Print("============= ",CMessage::Text(MSG_LIB_PARAMS_LIST_END)," (",this.Header(),") =============\n");
  }
//+------------------------------------------------------------------+
Em três loops percorrendo todas as propriedades do objeto-gráfico, obtemos a próxima propriedade e exibimos sua descrição no log. Como o objeto-janela do gráfico não tem suas próprias listas-enumerações de propriedades, precisamos imprimir apenas as propriedades do objeto-gráfico que são inerentes ao objeto-janela - inteiras e strings. Este objeto não possui propriedades reais e não é necessário exibi-las. Poderíamos ter feito de forma diferente, só definindo uma estrutura rígida para o início e o final de cada loop. Mas esta não é uma decisão muito correta se considerarmos as modificações das propriedades do objeto-gráfico que temos pela frente, pois teremos que retornar a este objeto e editar os valores do início e do final de cada loop. Por isso, vamos simplesmente deixar o loop das propriedades reais vazio (talvez temporariamente, até que as propriedades reais do objeto-janela do gráfico sejam necessárias se modificarmos no futuro). Assim, para qualquer alteração no número de propriedades, o início e o final de cada loop estarão sempre corretos.
Método que retorna o nome abreviado do objeto-janela do gráfico:
//+------------------------------------------------------------------+
//| Return the object short name                                     |
//+------------------------------------------------------------------+
string CChartWnd::Header(void)
  {
   return(this.m_window_num==0 ? CMessage::Text(MSG_CHART_OBJ_CHART_WINDOW) : (string)this.WindowNum()+" "+CMessage::Text(MSG_CHART_OBJ_CHART_SUBWINDOW));
  }
//+------------------------------------------------------------------+
O método verifica o número desta subjanela, e se esta for a janela principal do gráfico (se seu número for 0), a linha "Janela principal do gráfico" será retornada, já se for uma subjanela do gráfico principal, o número da subjanela + a linha "Subjanela do gráfico" serão retornados
Método que imprime uma breve descrição do objeto-janela do gráfico no log:
//+------------------------------------------------------------------+
//| Display a short description of the object in the journal         |
//+------------------------------------------------------------------+
void CChartWnd::PrintShort(const bool dash=false)
  {
   ::Print((dash ? "- " : ""),this.Header()," ID: ",(string)this.GetChartID(),", ",CMessage::Text(MSG_CHART_OBJ_INDICATORS_TOTAL),": ",this.IndicatorsTotal());
  }
//+------------------------------------------------------------------+
Aqui, criamos uma string a partir do nome abreviado do objeto, do identificador do gráfico e do número de indicadores anexados a esta janela. Se ao método for passado o sinalizador que indica exibição de hífen antes da descrição do objeto (dash), um hífen será exibido na frente da linha criada.
Método que imprime no log uma descrição de todos os indicadores anexados a uma determinada janela:
//+------------------------------------------------------------------+
//| Display the description of indicators attached to the window     |
//+------------------------------------------------------------------+
void CChartWnd::PrintIndicators(const bool dash=false)
  {
   string header=
     (
      this.WindowNum()==0 ? CMessage::Text(MSG_CHART_OBJ_INDICATORS_MW_NAME_LIST) :
      CMessage::Text(MSG_CHART_OBJ_INDICATORS_SW_NAME_LIST)+" "+(string)this.WindowNum()
     );
   ::Print(header,":");
   int total=this.IndicatorsTotal();
   if(total==0)
      ::Print("- ",CMessage::Text(MSG_CHART_OBJ_INDICATORS_NONE));
   else for(int i=0;i<total;i++)
     {
      CWndInd *ind=this.m_list_ind.At(i);
      if(ind==NULL)
         continue;
      ind.Print(dash);
     }
  }
//+------------------------------------------------------------------+
Primeiro criamos e exibimos um título no log, dependendo do tipo de janela.
Se esta for a janela principal do gráfico, o texto do título será "Indicadores na janela principal do gráfico",
caso contrário, o texto do título será "Indicadores na janela do gráfico" + Número desta janela.
Em seguida, vemos número de indicadores anexados a esta janela, e se não houver, imprimiremos a string "Em falta",
caso contrário, num loop percorrendo a lista de indicadores, obtemos outro objeto-indicador na janela do gráfico e imprimimos seus dados.
Método que imprime a descrição dos parâmetros da janela no log:
//+------------------------------------------------------------------+
//| Display the description of the window parameters in the journal  |
//+------------------------------------------------------------------+
void CChartWnd::PrintParameters(const bool dash=false)
  {
   string header=
     (
      this.WindowNum()==0 ? CMessage::Text(MSG_CHART_OBJ_CHART_WINDOW) :
      CMessage::Text(MSG_CHART_OBJ_CHART_SUBWINDOW)+" "+(string)this.WindowNum()
     );
   ::Print((dash ? " " : ""),header,":");
   if(this.WindowNum()>0)
      ::Print((dash ? " - " : ""),GetPropertyDescription(CHART_PROP_WINDOW_YDISTANCE));
   ::Print((dash ? " - " : ""),GetPropertyDescription(CHART_PROP_HEIGHT_IN_PIXELS));
  }
//+------------------------------------------------------------------+
Primeiro criamos e exibimos um título no log, dependendo do tipo de janela.
Se esta for a janela do gráfico principal, o texto do título será "Janela do gráfico principal",
caso contrário, o texto do título será "Subjanela do gráfico" + Número desta janela.
Em seguida, se for uma subjanela do gráfico (seu número for maior que zero), exibimos o valor da distância em pixels ao longo do eixo vertical Y entre o quadro superior da subjanela do indicador e o quadro superior da janela principal do gráfico no log (para a janela principal, este valor é sempre 0, e não iremos imprimi-lo), depois, imprimimos a segunda propriedade do objeto no log - a altura do gráfico em pixels.
Método que cria uma lista de indicadores anexados à janela:
//+------------------------------------------------------------------+
//| Create the list of indicators attached to the window             |
//+------------------------------------------------------------------+
void CChartWnd::IndicatorsListCreate(void)
  {
   //--- Clear the list of indicators
   this.m_list_ind.Clear();
   //--- Get the total number of indicators in the window
   int total=::ChartIndicatorsTotal(this.m_chart_id,this.m_window_num);
   //--- In the loop by the number of indicators,
   for(int i=0;i<total;i++)
     {
      //--- obtain and save the short indicator name,
      string name=::ChartIndicatorName(this.m_chart_id,this.m_window_num,i);
      //--- get and save the indicator handle by its short name
      int handle=::ChartIndicatorGet(this.m_chart_id,this.m_window_num,name);
      //--- Free the indicator handle
      ::IndicatorRelease(handle);
      //--- Create the new indicator object in the chart window
      CWndInd *ind=new CWndInd(handle,name,i);
      if(ind==NULL)
         continue;
      //--- set the sorted list flag to the list
      this.m_list_ind.Sort();
      //--- If failed to add the object to the list, remove it
      if(!this.m_list_ind.Add(ind))
         delete ind;
     }
  }
//+------------------------------------------------------------------+
O método é comentado em detalhes no código. Repare que, ao obter a lista de indicadores na janela, obtemos o identificador do indicador por seu nome abreviado usando ChartIndicatorGet(), o que nos dá mais trabalho. O terminal calcula a utilização de cada indicador e, a cada novo identificador, aumenta o contador interno de utilização do indicador em questão. Se em nosso programa não liberarmos o identificador do indicador que já é desnecessário, será impossível pegar o identificador "perdido" posteriormente. Por isso, aqui imediatamente após receber todos os dados necessários sobre o indicador, dispensamos o identificador, diminuindo assim o contador interno que indica o uso deste indicador.
Método de adição de novos indicadores à lista:
//+------------------------------------------------------------------+
//| Add new indicators to the list                                   |
//+------------------------------------------------------------------+
void CChartWnd::IndicatorsAdd(void)
  {
   //--- Get the total number of indicators in the window
   int total=::ChartIndicatorsTotal(this.m_chart_id,this.m_window_num);
   //--- In the loop by the number of indicators,
   for(int i=0;i<total;i++)
     {
      //--- obtain and save the short indicator name,
      string name=::ChartIndicatorName(this.m_chart_id,this.m_window_num,i);
      //--- get and save the indicator handle by its short name
      int handle=::ChartIndicatorGet(this.m_chart_id,this.m_window_num,name);
      //--- Release the indicator handle
      ::IndicatorRelease(handle);
      //--- Create the new indicator object in the chart window
      CWndInd *ind=new CWndInd(handle,name,i);
      if(ind==NULL)
         continue;
      //--- set the sorted list flag to the list
      this.m_list_ind.Sort();
      //--- If the object is already in the list or an attempt to add it to the list failed, remove it
      if(this.m_list_ind.Search(ind)>WRONG_VALUE || !this.m_list_ind.Add(ind))
         delete ind;
     }
  }
//+------------------------------------------------------------------+
A lógica do método é idêntica à anterior, também é comentada no código. A única diferença é que neste método a lista não é limpa inicialmente. Além disso, ao adicionar um indicador à lista, primeiro é verificada a presença de tal indicador na lista e, se já existir, o objeto deste indicador será excluído.
Para que possamos posteriormente sincronizar nossa lista de indicadores na janela com seu número real (afinal, os indicadores podem ser adicionados e removidos da janela do gráfico), precisamos comparar seu número na janela com o número na lista. Faremos isso nos artigos que temos pela frente, mas
faremos o método que retorna a presença de um indicador a partir da lista na janela do terminal:
//+---------------------------------------------------------------------------------------+
//| Return the flag indicating the presence of an indicator from the list in the window   |
//+---------------------------------------------------------------------------------------+
bool CChartWnd::IsPresentInWindow(const CWndInd *ind)
  {
   int total=::ChartIndicatorsTotal(this.m_chart_id,this.m_window_num);
   for(int i=0;i<total;i++)
     {
      string name=::ChartIndicatorName(this.m_chart_id,this.m_window_num,i);
      int handle=::ChartIndicatorGet(this.m_chart_id,this.m_window_num,name);
      ::IndicatorRelease(handle);
      if(ind.Name()==name && ind.Handle()==handle)
         return true;
     }
   return false;
  }
//+------------------------------------------------------------------+
Ao método é passado um ponteiro para o objeto-indicador na janela do gráfico, ponteiro esse que deve ser verificado. Em seguida, num loop percorrendo o número total de indicadores na janela do gráficoobtemos o nome do próximo indicador, obtemos seu identificador e o liberamos imediatamente. Se o nome abreviado e o identificador do indicador atual coincidem com o nome e o identificador do objeto verificado, então retornamos true, o que significa que este indicador ainda está na janela do gráfico. No final do loop retornamos false - não houve ocorrências, em outras palavras, não há nenhum indicador na janela do gráfico.
Se encontramos na lista indicadores que não estavam no gráfico, eles devem ser removidos da lista.
Método que remove da lista os indicadores que já estão faltando na janela:
//+------------------------------------------------------------------+
//| Remove indicators not present in the window from the list        |
//+------------------------------------------------------------------+
void CChartWnd::IndicatorsDelete(void)
  {
   int total=this.m_list_ind.Total();
   for(int i=total-1;i>WRONG_VALUE;i--)
     {
      CWndInd *ind=this.m_list_ind.At(i);
      if(!this.IsPresentInWindow(ind))
         this.m_list_ind.Delete(i);
     }
  }
//+------------------------------------------------------------------+
Aqui: num loop percorrendo a lista de objetos-indicadores obtemos o próximo objeto-indicador pelo índice do loop e verificamos sua presença na janela real do gráfico. Se não existir, o ponteiro para ele será removido de nossa lista usando o método Delete().
Posteriormente, quando criarmos uma classe-coleção de gráficos, precisaremos rastrear o estado dos indicadores nas subjanelas dos objetos do gráfico e, em caso de discrepâncias encontradas no número real de indicadores nas subjanelas do gráfico com suas descrições nas listas de objetos da janela do gráfico, precisaremos excluir indicadores desnecessários da lista e adicionar novos, se disponíveis.
Para fazer isso, criamos um método que atualiza os dados dos indicadores anexados às janelas do gráfico:
//+------------------------------------------------------------------+
//| Update data on attached indicators                               |
//+------------------------------------------------------------------+
void CChartWnd::Refresh(void)
  {
   this.IndicatorsDelete();
   this.IndicatorsAdd();
  }
//+------------------------------------------------------------------+
Aqui primeiro procuramos e removemos da lista os indicadores que estão faltando na janela do gráfico real, indicadores esses que ainda estão na lista, e, em seguida, procuramos e adicionamos novos indicadores que estão na janela, mas não na lista, usando os métodos acima.
Finalmente, consideraremos o construtor paramétrico da classe:
//+------------------------------------------------------------------+
//| Parametric constructor                                           |
//+------------------------------------------------------------------+
CChartWnd::CChartWnd(const long chart_id,const int wnd_num) : m_window_num(wnd_num)
  {
   CBaseObj::SetChartID(chart_id);
   this.IndicatorsListCreate();
  }
//+------------------------------------------------------------------+
Aqui primeiro definimos o valor do identificador do gráfico no objeto CBaseObj pai, e criamos uma lista de indicadores anexados a esta janela de gráfico. O número da subjanela do gráfico é definido na lista de inicialização do construtor.
Assim concluímos a criação de classes do objeto-indicador na janela do gráfico e no objeto-janela do gráfico.
Uma lista completa de ambas as classes localizadas num arquivo pode ser encontrada nos arquivos anexados ao artigo.
Como agora temos um objeto que descreve a janela do gráfico e suas subjanelas, respectivamente, precisamos modificar a classe do objeto-gráfico CChartObj localizado no arquivo \MQL5\Include\DoEasy\Objects\Chart\ChartObj.mqh. Agora ele terá uma lista de todas as subjanelas localizadas em sua janela principal, e para obter dados sobre as propriedades da janela, precisaremos fazer referência ao ponteiro do objeto-janela do gráfico desejado que criamos acima. A partir do objeto-janela resultante, nós, por sua vez, podemos obter uma lista de todos os indicadores anexados a ele, e deles podemos obter o identificador do indicador necessário para trabalhar com ele.
Em primeiro lugar anexamos ao arquivo do objeto-gráfico o arquivo do objeto da janela e indicadores na janela, e declaramos um objeto-lista no qual iremos armazenar ponteiros para todas as janelas do objeto-gráfico:
//+------------------------------------------------------------------+
//|                                                     ChartObj.mqh |
//|                                  Copyright 2021, MetaQuotes Ltd. |
//|                             https://mql5.com/en/users/artmedia70 |
//+------------------------------------------------------------------+
#property copyright "Copyright 2021, MetaQuotes Ltd."
#property link      "https://mql5.com/en/users/artmedia70"
#property version   "1.00"
#property strict    // Necessary for mql4
//+------------------------------------------------------------------+
//| Include files                                                    |
//+------------------------------------------------------------------+
#include "..\..\Objects\BaseObj.mqh"
#include "ChartWnd.mqh"
//+------------------------------------------------------------------+
//| Chart object class                                               |
//+------------------------------------------------------------------+
class CChartObj : public CBaseObj
  {
private:
   CArrayObj         m_list_wnd;                                  // List of chart window objects
   long              m_long_prop[CHART_PROP_INTEGER_TOTAL];       // Integer properties
   double            m_double_prop[CHART_PROP_DOUBLE_TOTAL];      // Real properties
   string            m_string_prop[CHART_PROP_STRING_TOTAL];      // String properties
   int               m_digits;                                    // Symbol's Digits()
Na seção privada da classe na lista de métodos para definir valores de propriedades adicionamos um método que define o valor de visibilidade da janela do gráfico:
//--- The methods of setting property values
   bool              SetMode(const string source,const ENUM_CHART_MODE mode,const bool redraw=false);
   bool              SetScale(const string source,const int scale,const bool redraw=false);
   bool              SetModeVolume(const string source,const ENUM_CHART_VOLUME_MODE mode,const bool redraw=false);
   void              SetVisibleBars(void);
   void              SetWindowsTotal(void);
   void              SetVisible(void);
   void              SetFirstVisibleBars(void);
   void              SetWidthInBars(void);
   void              SetWidthInPixels(void);
   void              SetMaximizedFlag(void);
   void              SetMinimizedFlag(void);
   void              SetExpertName(void);
   void              SetScriptName(void);

public:
Como a propriedade "Distância em pixels ao longo do eixo Y vertical entre o quadro superior da subjanela do indicador e o quadro superior da janela do gráfico principal" para a janela principal não faz sentido (ela é sempre 0), no método que retorna o sinalizador de que o objeto mantém uma propriedade inteira, alteraremos o valor se essa propriedade for CHART_PROP_WINDOW_YDISTANCE:
//--- Return the flag of the object supporting this property
   virtual bool      SupportProperty(ENUM_CHART_PROP_INTEGER property)           { return (property!=CHART_PROP_WINDOW_YDISTANCE ? true : false); }
   virtual bool      SupportProperty(ENUM_CHART_PROP_DOUBLE property)            { return true; }
   virtual bool      SupportProperty(ENUM_CHART_PROP_STRING property)            { return true; }
Se a propriedade passada ao método não for igual a CHART_PROP_WINDOW_YDISTANCE, retornamos true, caso contrário, devolvemos false.
À lista de métodos para fácil acesso às propriedades do objeto adicionamos um método que retorne a visibilidade da janela:
//--- Return the total number of chart windows including indicator subwindows
   int               WindowsTotal(void)                              const { return (int)this.GetProperty(CHART_PROP_WINDOWS_TOTAL);      }

//--- Return the window visibility
   bool              Visible(void)                                   const { return (bool)this.GetProperty(CHART_PROP_WINDOW_IS_VISIBLE); }

//--- Return the chart window handle
   int               Handle(void)                                    const { return (int)this.GetProperty(CHART_PROP_WINDOW_HANDLE);      }
Aqui, o método retornará essa propriedade apenas para a janela principal do gráfico.
Métodos que retornam a distância em pixels ao longo do eixo Y vertical entre o quadro superior da subjanela do indicador e o quadro superior da janela do gráfico principal, retorna e define a altura do gráfico especificado em pixels sofreram alterações. Agora, para definir e retornar essas propriedades, precisaremos encontrar o objeto da janela necessária e inserir ou obter esses valores em suas propriedades. Veremos a implementação dos métodos um pouco mais tarde.
//--- Return the name of a script launched on the chart
   string            ScriptName(void)                                const { return this.GetProperty(CHART_PROP_SCRIPT_NAME);             }

//--- Return the distance in Y axis pixels between the upper frame of the indicator subwindow and the upper frame of the chart main window
   int               WindowYDistance(const int sub_window)           const;

//--- (1) Return and (2) set the height of the specified chart in pixels
   int               WindowHeightInPixels(const int sub_window)      const;
   bool              SetWindowHeightInPixels(const int height,const int sub_window,const bool redraw=false);

//--- Return the specified subwindow visibility
No final do corpo da classe iremos declarar métodos adicionais para obter o objeto-janela necessário e para exibir no log as propriedades de todas as subjanelas do gráfico e dados de todos os indicadores anexados à janela do gráfico especificada:
//--- Emulate a tick (chart updates - similar to the terminal Refresh command)
   void              EmulateTick(void)                                     { ::ChartSetSymbolPeriod(this.ID(),this.Symbol(),this.Timeframe());}

//--- Return the chart window specified by index
   CChartWnd        *GetWindowByIndex(const int index)               const { return this.m_list_wnd.At(index); }
//--- Return the window object by its subwindow index
   CChartWnd        *GetWindowByNum(const int win_num)               const;

//--- Display data of all indicators of all chart windows in the journal
   void              PrintWndIndicators(void);
//--- Display the properties of all chart windows in the journal
   void              PrintWndParameters(void);

  };
//+------------------------------------------------------------------+
Num construtor paramétrico da classe definimos o valor do identificador do gráfico no objeto pai da classe, especificamos três propriedades da janela principal para o objeto-gráfico (isso poderia não ter sido feito, uma vez que o objeto da janela principal agora está na lista de janelas do gráfico, mas como o objeto possui tais propriedades, iremos preenchê-las com os dados corretos), e no final do método adicionamos à lista de janelas do gráfico todos os objetos de janela pertencentes a este gráfico:
//+------------------------------------------------------------------+
//| Parametric constructor                                           |
//+------------------------------------------------------------------+
CChartObj::CChartObj(const long chart_id)
  {
//--- Set chart ID to the base object
   CBaseObj::SetChartID(chart_id);
//--- Set integer properties
   this.SetProperty(CHART_PROP_ID,chart_id);                                                             // Chart ID
   this.SetProperty(CHART_PROP_TIMEFRAME,::ChartPeriod(this.ID()));                                      // Chart timeframe
   this.SetProperty(CHART_PROP_SHOW,::ChartGetInteger(this.ID(),CHART_SHOW));                            // Price chart drawing attribute
   this.SetProperty(CHART_PROP_IS_OBJECT,::ChartGetInteger(this.ID(),CHART_IS_OBJECT));                  // Chart object identification attribute
   this.SetProperty(CHART_PROP_BRING_TO_TOP,false);                                                      // Show chart above all others
   this.SetProperty(CHART_PROP_CONTEXT_MENU,::ChartGetInteger(this.ID(),CHART_CONTEXT_MENU));            // Access to the context menu using the right click
   this.SetProperty(CHART_PROP_CROSSHAIR_TOOL,::ChartGetInteger(this.ID(),CHART_CROSSHAIR_TOOL));        // Access the Crosshair tool by pressing the middle mouse button
   this.SetProperty(CHART_PROP_MOUSE_SCROLL,::ChartGetInteger(this.ID(),CHART_MOUSE_SCROLL));            // Scroll the chart horizontally using the left mouse button
   this.SetProperty(CHART_PROP_EVENT_MOUSE_WHEEL,::ChartGetInteger(this.ID(),CHART_EVENT_MOUSE_WHEEL));  // Send messages about mouse wheel events to all MQL5 programs on a chart
   this.SetProperty(CHART_PROP_EVENT_MOUSE_MOVE,::ChartGetInteger(this.ID(),CHART_EVENT_MOUSE_MOVE));    // Send messages about mouse button click and movement events to all MQL5 programs on a chart
   this.SetProperty(CHART_PROP_EVENT_OBJECT_CREATE,::ChartGetInteger(this.ID(),CHART_EVENT_OBJECT_CREATE)); // Send messages about the graphical object creation event to all MQL5 programs on a chart
   this.SetProperty(CHART_PROP_EVENT_OBJECT_DELETE,::ChartGetInteger(this.ID(),CHART_EVENT_OBJECT_DELETE)); // Send messages about the graphical object destruction event to all MQL5 programs on a chart
   this.SetProperty(CHART_PROP_MODE,::ChartGetInteger(this.ID(),CHART_MODE));                            // Type of the chart (candlesticks, bars or line)
   this.SetProperty(CHART_PROP_FOREGROUND,::ChartGetInteger(this.ID(),CHART_FOREGROUND));                // Price chart in the foreground
   this.SetProperty(CHART_PROP_SHIFT,::ChartGetInteger(this.ID(),CHART_SHIFT));                          // Mode of shift of the price chart from the right border
   this.SetProperty(CHART_PROP_AUTOSCROLL,::ChartGetInteger(this.ID(),CHART_AUTOSCROLL));                // The mode of automatic shift to the right border of the chart
   this.SetProperty(CHART_PROP_KEYBOARD_CONTROL,::ChartGetInteger(this.ID(),CHART_KEYBOARD_CONTROL));    // Allow managing the chart using a keyboard
   this.SetProperty(CHART_PROP_QUICK_NAVIGATION,::ChartGetInteger(this.ID(),CHART_QUICK_NAVIGATION));    // Allow the chart to intercept Space and Enter key strokes to activate the quick navigation bar
   this.SetProperty(CHART_PROP_SCALE,::ChartGetInteger(this.ID(),CHART_SCALE));                          // Scale
   this.SetProperty(CHART_PROP_SCALEFIX,::ChartGetInteger(this.ID(),CHART_SCALEFIX));                    // Fixed scale mode
   this.SetProperty(CHART_PROP_SCALEFIX_11,::ChartGetInteger(this.ID(),CHART_SCALEFIX_11));              // 1:1 scale mode
   this.SetProperty(CHART_PROP_SCALE_PT_PER_BAR,::ChartGetInteger(this.ID(),CHART_SCALE_PT_PER_BAR));    // Mode for specifying the scale in points per bar
   this.SetProperty(CHART_PROP_SHOW_TICKER,::ChartGetInteger(this.ID(),CHART_SHOW_TICKER));              // Display a symbol ticker in the upper left corner
   this.SetProperty(CHART_PROP_SHOW_OHLC,::ChartGetInteger(this.ID(),CHART_SHOW_OHLC));                  // Display OHLC values in the upper left corner
   this.SetProperty(CHART_PROP_SHOW_BID_LINE,::ChartGetInteger(this.ID(),CHART_SHOW_BID_LINE));          // Display Bid value as a horizontal line on the chart
   this.SetProperty(CHART_PROP_SHOW_ASK_LINE,::ChartGetInteger(this.ID(),CHART_SHOW_ASK_LINE));          // Display Ask value as a horizontal line on the chart
   this.SetProperty(CHART_PROP_SHOW_LAST_LINE,::ChartGetInteger(this.ID(),CHART_SHOW_LAST_LINE));        // Display Last value as a horizontal line on the chart
   this.SetProperty(CHART_PROP_SHOW_PERIOD_SEP,::ChartGetInteger(this.ID(),CHART_SHOW_PERIOD_SEP));      // Display vertical separators between adjacent periods
   this.SetProperty(CHART_PROP_SHOW_GRID,::ChartGetInteger(this.ID(),CHART_SHOW_GRID));                  // Display the chart grid
   this.SetProperty(CHART_PROP_SHOW_VOLUMES,::ChartGetInteger(this.ID(),CHART_SHOW_VOLUMES));            // Display volumes on the chart
   this.SetProperty(CHART_PROP_SHOW_OBJECT_DESCR,::ChartGetInteger(this.ID(),CHART_SHOW_OBJECT_DESCR));  // Display text descriptions of the objects
   this.SetProperty(CHART_PROP_VISIBLE_BARS,::ChartGetInteger(this.ID(),CHART_VISIBLE_BARS));            // Number of bars on a chart that are available for display
   this.SetProperty(CHART_PROP_WINDOWS_TOTAL,::ChartGetInteger(this.ID(),CHART_WINDOWS_TOTAL));          // The total number of chart windows including indicator subwindows
   this.SetProperty(CHART_PROP_WINDOW_IS_VISIBLE,::ChartGetInteger(this.ID(),CHART_WINDOW_IS_VISIBLE,0));// Window visibility
   this.SetProperty(CHART_PROP_WINDOW_HANDLE,::ChartGetInteger(this.ID(),CHART_WINDOW_HANDLE));          // Chart window handle
   this.SetProperty(CHART_PROP_WINDOW_YDISTANCE,::ChartGetInteger(this.ID(),CHART_WINDOW_YDISTANCE,0));  // Distance in Y axis pixels between the upper frame of the indicator subwindow and the upper frame of the chart main window
   this.SetProperty(CHART_PROP_FIRST_VISIBLE_BAR,::ChartGetInteger(this.ID(),CHART_FIRST_VISIBLE_BAR));  // Number of the first visible bar on the chart
   this.SetProperty(CHART_PROP_WIDTH_IN_BARS,::ChartGetInteger(this.ID(),CHART_WIDTH_IN_BARS));          // Chart width in bars
   this.SetProperty(CHART_PROP_WIDTH_IN_PIXELS,::ChartGetInteger(this.ID(),CHART_WIDTH_IN_PIXELS));      // Chart width in pixels
   this.SetProperty(CHART_PROP_HEIGHT_IN_PIXELS,::ChartGetInteger(this.ID(),CHART_HEIGHT_IN_PIXELS,0));  // Chart height in pixels
   this.SetProperty(CHART_PROP_COLOR_BACKGROUND,::ChartGetInteger(this.ID(),CHART_COLOR_BACKGROUND));    // Chart background color
   this.SetProperty(CHART_PROP_COLOR_FOREGROUND,::ChartGetInteger(this.ID(),CHART_COLOR_FOREGROUND));    // Color of axes, scale and OHLC line
   this.SetProperty(CHART_PROP_COLOR_GRID,::ChartGetInteger(this.ID(),CHART_COLOR_GRID));                // Grid color
   this.SetProperty(CHART_PROP_COLOR_VOLUME,::ChartGetInteger(this.ID(),CHART_COLOR_VOLUME));            // Color of volumes and position opening levels
   this.SetProperty(CHART_PROP_COLOR_CHART_UP,::ChartGetInteger(this.ID(),CHART_COLOR_CHART_UP));        // Color for the up bar, shadows and body borders of bullish candlesticks
   this.SetProperty(CHART_PROP_COLOR_CHART_DOWN,::ChartGetInteger(this.ID(),CHART_COLOR_CHART_DOWN));    // Color for the down bar, shadows and body borders of bearish candlesticks
   this.SetProperty(CHART_PROP_COLOR_CHART_LINE,::ChartGetInteger(this.ID(),CHART_COLOR_CHART_LINE));    // Color of the chart line and the Doji candlesticks
   this.SetProperty(CHART_PROP_COLOR_CANDLE_BULL,::ChartGetInteger(this.ID(),CHART_COLOR_CANDLE_BULL));  // Color of the bullish candle body
   this.SetProperty(CHART_PROP_COLOR_CANDLE_BEAR,::ChartGetInteger(this.ID(),CHART_COLOR_CANDLE_BEAR));  // Color of the bearish candle body
   this.SetProperty(CHART_PROP_COLOR_BID,::ChartGetInteger(this.ID(),CHART_COLOR_BID));                  // Bid price line color
   this.SetProperty(CHART_PROP_COLOR_ASK,::ChartGetInteger(this.ID(),CHART_COLOR_ASK));                  // Ask price line color
   this.SetProperty(CHART_PROP_COLOR_LAST,::ChartGetInteger(this.ID(),CHART_COLOR_LAST));                // Color of the last performed deal's price line (Last)
   this.SetProperty(CHART_PROP_COLOR_STOP_LEVEL,::ChartGetInteger(this.ID(),CHART_COLOR_STOP_LEVEL));    // Color of stop order levels (Stop Loss and Take Profit)
   this.SetProperty(CHART_PROP_SHOW_TRADE_LEVELS,::ChartGetInteger(this.ID(),CHART_SHOW_TRADE_LEVELS));  // Display trade levels on the chart (levels of open positions, Stop Loss, Take Profit and pending orders)
   this.SetProperty(CHART_PROP_DRAG_TRADE_LEVELS,::ChartGetInteger(this.ID(),CHART_DRAG_TRADE_LEVELS));  // Enable the ability to drag trading levels on a chart using mouse
   this.SetProperty(CHART_PROP_SHOW_DATE_SCALE,::ChartGetInteger(this.ID(),CHART_SHOW_DATE_SCALE));      // Display the time scale on the chart
   this.SetProperty(CHART_PROP_SHOW_PRICE_SCALE,::ChartGetInteger(this.ID(),CHART_SHOW_PRICE_SCALE));    // Display the price scale on the chart
   this.SetProperty(CHART_PROP_SHOW_ONE_CLICK,::ChartGetInteger(this.ID(),CHART_SHOW_ONE_CLICK));        // Display the quick trading panel on the chart
   this.SetProperty(CHART_PROP_IS_MAXIMIZED,::ChartGetInteger(this.ID(),CHART_IS_MAXIMIZED));            // Chart window maximized
   this.SetProperty(CHART_PROP_IS_MINIMIZED,::ChartGetInteger(this.ID(),CHART_IS_MINIMIZED));            // Chart window minimized
   this.SetProperty(CHART_PROP_IS_DOCKED,::ChartGetInteger(this.ID(),CHART_IS_DOCKED));                  // Chart window docked
   this.SetProperty(CHART_PROP_FLOAT_LEFT,::ChartGetInteger(this.ID(),CHART_FLOAT_LEFT));                // Left coordinate of the undocked chart window relative to the virtual screen
   this.SetProperty(CHART_PROP_FLOAT_TOP,::ChartGetInteger(this.ID(),CHART_FLOAT_TOP));                  // Upper coordinate of the undocked chart window relative to the virtual screen
   this.SetProperty(CHART_PROP_FLOAT_RIGHT,::ChartGetInteger(this.ID(),CHART_FLOAT_RIGHT));              // Right coordinate of the undocked chart window relative to the virtual screen
   this.SetProperty(CHART_PROP_FLOAT_BOTTOM,::ChartGetInteger(this.ID(),CHART_FLOAT_BOTTOM));            // Bottom coordinate of the undocked chart window relative to the virtual screen
//--- Set real properties
   this.SetProperty(CHART_PROP_SHIFT_SIZE,::ChartGetDouble(this.ID(),CHART_SHIFT_SIZE));                 // Shift size of the zero bar from the right border in %
   this.SetProperty(CHART_PROP_FIXED_POSITION,::ChartGetDouble(this.ID(),CHART_FIXED_POSITION));         // Chart fixed position from the left border in %
   this.SetProperty(CHART_PROP_FIXED_MAX,::ChartGetDouble(this.ID(),CHART_FIXED_MAX));                   // Fixed chart maximum
   this.SetProperty(CHART_PROP_FIXED_MIN,::ChartGetDouble(this.ID(),CHART_FIXED_MIN));                   // Fixed chart minimum
   this.SetProperty(CHART_PROP_POINTS_PER_BAR,::ChartGetDouble(this.ID(),CHART_POINTS_PER_BAR));         // Scale in points per bar
   this.SetProperty(CHART_PROP_PRICE_MIN,::ChartGetDouble(this.ID(),CHART_PRICE_MIN));                   // Chart minimum
   this.SetProperty(CHART_PROP_PRICE_MAX,::ChartGetDouble(this.ID(),CHART_PRICE_MAX));                   // Chart maximum
//--- Set string properties
   this.SetProperty(CHART_PROP_COMMENT,::ChartGetString(this.ID(),CHART_COMMENT));                       // Comment text on the chart
   this.SetProperty(CHART_PROP_EXPERT_NAME,::ChartGetString(this.ID(),CHART_EXPERT_NAME));               // name of an EA launched on the chart
   this.SetProperty(CHART_PROP_SCRIPT_NAME,::ChartGetString(this.ID(),CHART_SCRIPT_NAME));               // name of a script launched on the chart
   this.SetProperty(CHART_PROP_SYMBOL,::ChartSymbol(this.ID()));                                         // Chart symbol

   this.m_digits=(int)::SymbolInfoInteger(this.Symbol(),SYMBOL_DIGITS);
   int total=this.WindowsTotal();
   for(int i=0;i<total;i++)
     {
      CChartWnd *wnd=new CChartWnd(m_chart_id,i);
      if(wnd==NULL)
         continue;
      m_list_wnd.Sort();
      if(!m_list_wnd.Add(wnd))
         delete wnd;
     }
  }
//+------------------------------------------------------------------+
Para criar listas de janelas do gráfico, obtemos o número total de janelas do gráfico e, num loop percorrendo todas as janelas, criamos um novo objeto-janela do gráfico e o adicionamos à lista.
No método criado no último artigo para comparar dois objetos-gráficos, fizemos um erro a nível de lógica: cada gráfico tem seu próprio identificador de gráfico exclusivo e identificador de janela. Por isso, uma comparação dessas propriedades de dois gráficos diferentes sempre retornará false. Neste método, precisamos comparar se diferentes gráficos são idênticos. A comparação de identificadores sempre indicará que os dois gráficos não são idênticos.
Vamos corrigir o erro omitindo essas duas propriedades ao comparar:
//+------------------------------------------------------------------+
//| Compare the CChartObj objects by all properties                  |
//+------------------------------------------------------------------+
bool CChartObj::IsEqual(CChartObj *compared_obj) const
  {
   int beg=0, end=CHART_PROP_INTEGER_TOTAL;
   for(int i=beg; i<end; i++)
     {
      ENUM_CHART_PROP_INTEGER prop=(ENUM_CHART_PROP_INTEGER)i;
      if(prop==CHART_PROP_ID || prop==CHART_PROP_WINDOW_HANDLE) continue;
      if(this.GetProperty(prop)!=compared_obj.GetProperty(prop)) return false;
     }
   beg=end; end+=CHART_PROP_DOUBLE_TOTAL;
   for(int i=beg; i<end; i++)
     {
      ENUM_CHART_PROP_DOUBLE prop=(ENUM_CHART_PROP_DOUBLE)i;
      if(this.GetProperty(prop)!=compared_obj.GetProperty(prop)) return false;
     }
   beg=end; end+=CHART_PROP_STRING_TOTAL;
   for(int i=beg; i<end; i++)
     {
      ENUM_CHART_PROP_STRING prop=(ENUM_CHART_PROP_STRING)i;
      if(this.GetProperty(prop)!=compared_obj.GetProperty(prop)) return false;
     }
   return true;
  }
//+------------------------------------------------------------------+
No método que retorna a descrição da propriedade inteira do objeto, escreveremos o retorno da descrição das três propriedades adicionadas:
//+------------------------------------------------------------------+
//| Return description of object's integer property                  |
//+------------------------------------------------------------------+
string CChartObj::GetPropertyDescription(ENUM_CHART_PROP_INTEGER property)
  {
   return
     (
      property==CHART_PROP_ID     ?  CMessage::Text(MSG_CHART_OBJ_ID)+
         (!this.SupportProperty(property) ?  ": "+CMessage::Text(MSG_LIB_PROP_NOT_SUPPORTED) :
          ": "+(string)this.GetProperty(property)
         )  :
      property==CHART_PROP_TIMEFRAME      ?  CMessage::Text(MSG_LIB_TEXT_BAR_PERIOD)+
         (!this.SupportProperty(property) ?  ": "+CMessage::Text(MSG_LIB_PROP_NOT_SUPPORTED) :
          ": "+TimeframeDescription((ENUM_TIMEFRAMES)this.GetProperty(property))
         )  :
      property==CHART_PROP_SHOW   ?  CMessage::Text(MSG_CHART_OBJ_SHOW)+
         (!this.SupportProperty(property) ?  ": "+CMessage::Text(MSG_LIB_PROP_NOT_SUPPORTED) :
          ": "+(this.GetProperty(property) ? CMessage::Text(MSG_LIB_TEXT_YES) : CMessage::Text(MSG_LIB_TEXT_NO))
         )  :
      property==CHART_PROP_IS_OBJECT      ?  CMessage::Text(MSG_CHART_OBJ_IS_OBJECT)+
         (!this.SupportProperty(property) ?  ": "+CMessage::Text(MSG_LIB_PROP_NOT_SUPPORTED) :
          ": "+(this.GetProperty(property) ? CMessage::Text(MSG_LIB_TEXT_YES) : CMessage::Text(MSG_LIB_TEXT_NO))
         )  :
      property==CHART_PROP_BRING_TO_TOP   ?  CMessage::Text(MSG_CHART_OBJ_BRING_TO_TOP)+
         (!this.SupportProperty(property) ?  ": "+CMessage::Text(MSG_LIB_PROP_NOT_SUPPORTED) :
          ": "+(this.GetProperty(property) ? CMessage::Text(MSG_LIB_TEXT_YES) : CMessage::Text(MSG_LIB_TEXT_NO))
         )  :
      property==CHART_PROP_CONTEXT_MENU   ?  CMessage::Text(MSG_CHART_OBJ_CONTEXT_MENU)+
         (!this.SupportProperty(property) ?  ": "+CMessage::Text(MSG_LIB_PROP_NOT_SUPPORTED) :
          ": "+(this.GetProperty(property) ? CMessage::Text(MSG_LIB_TEXT_YES) : CMessage::Text(MSG_LIB_TEXT_NO))
         )  :
      property==CHART_PROP_CROSSHAIR_TOOL ?  CMessage::Text(MSG_CHART_OBJ_CROSSHAIR_TOOL)+
         (!this.SupportProperty(property) ?  ": "+CMessage::Text(MSG_LIB_PROP_NOT_SUPPORTED) :
          ": "+(this.GetProperty(property) ? CMessage::Text(MSG_LIB_TEXT_YES) : CMessage::Text(MSG_LIB_TEXT_NO))
         )  :
      property==CHART_PROP_MOUSE_SCROLL   ?  CMessage::Text(MSG_CHART_OBJ_MOUSE_SCROLL)+
         (!this.SupportProperty(property) ?  ": "+CMessage::Text(MSG_LIB_PROP_NOT_SUPPORTED) :
          ": "+(this.GetProperty(property) ? CMessage::Text(MSG_LIB_TEXT_YES) : CMessage::Text(MSG_LIB_TEXT_NO))
         )  :
      property==CHART_PROP_EVENT_MOUSE_WHEEL ?  CMessage::Text(MSG_CHART_OBJ_EVENT_MOUSE_WHEEL)+
         (!this.SupportProperty(property) ?  ": "+CMessage::Text(MSG_LIB_PROP_NOT_SUPPORTED) :
          ": "+(this.GetProperty(property) ? CMessage::Text(MSG_LIB_TEXT_YES) : CMessage::Text(MSG_LIB_TEXT_NO))
         )  :
      property==CHART_PROP_EVENT_MOUSE_MOVE  ?  CMessage::Text(MSG_CHART_OBJ_EVENT_MOUSE_MOVE)+
         (!this.SupportProperty(property) ?  ": "+CMessage::Text(MSG_LIB_PROP_NOT_SUPPORTED) :
          ": "+(this.GetProperty(property) ? CMessage::Text(MSG_LIB_TEXT_YES) : CMessage::Text(MSG_LIB_TEXT_NO))
         )  :
      property==CHART_PROP_EVENT_OBJECT_CREATE  ?  CMessage::Text(MSG_CHART_OBJ_EVENT_OBJECT_CREATE)+
         (!this.SupportProperty(property) ?  ": "+CMessage::Text(MSG_LIB_PROP_NOT_SUPPORTED) :
          ": "+(this.GetProperty(property) ? CMessage::Text(MSG_LIB_TEXT_YES) : CMessage::Text(MSG_LIB_TEXT_NO))
         )  :
      property==CHART_PROP_EVENT_OBJECT_DELETE  ?  CMessage::Text(MSG_CHART_OBJ_EVENT_OBJECT_DELETE)+
         (!this.SupportProperty(property) ?  ": "+CMessage::Text(MSG_LIB_PROP_NOT_SUPPORTED) :
          ": "+(this.GetProperty(property) ? CMessage::Text(MSG_LIB_TEXT_YES) : CMessage::Text(MSG_LIB_TEXT_NO))
         )  :
      property==CHART_PROP_MODE           ?  CMessage::Text(MSG_CHART_OBJ_MODE)+
         (!this.SupportProperty(property) ?  ": "+CMessage::Text(MSG_LIB_PROP_NOT_SUPPORTED) :
          ": "+ChartModeDescription((ENUM_CHART_MODE)this.GetProperty(property))
         )  :
      property==CHART_PROP_FOREGROUND     ?  CMessage::Text(MSG_CHART_OBJ_FOREGROUND)+
         (!this.SupportProperty(property) ?  ": "+CMessage::Text(MSG_LIB_PROP_NOT_SUPPORTED) :
          ": "+(this.GetProperty(property) ? CMessage::Text(MSG_LIB_TEXT_YES) : CMessage::Text(MSG_LIB_TEXT_NO))
         )  :
      property==CHART_PROP_SHIFT        ?  CMessage::Text(MSG_CHART_OBJ_SHIFT)+
         (!this.SupportProperty(property) ?  ": "+CMessage::Text(MSG_LIB_PROP_NOT_SUPPORTED) :
          ": "+(this.GetProperty(property) ? CMessage::Text(MSG_LIB_TEXT_YES) : CMessage::Text(MSG_LIB_TEXT_NO))
         )  :
      property==CHART_PROP_AUTOSCROLL        ?  CMessage::Text(MSG_CHART_OBJ_AUTOSCROLL)+
         (!this.SupportProperty(property) ?  ": "+CMessage::Text(MSG_LIB_PROP_NOT_SUPPORTED) :
          ": "+(this.GetProperty(property) ? CMessage::Text(MSG_LIB_TEXT_YES) : CMessage::Text(MSG_LIB_TEXT_NO))
         )  :
      property==CHART_PROP_KEYBOARD_CONTROL        ?  CMessage::Text(MSG_CHART_OBJ_KEYBOARD_CONTROL)+
         (!this.SupportProperty(property) ?  ": "+CMessage::Text(MSG_LIB_PROP_NOT_SUPPORTED) :
          ": "+(this.GetProperty(property) ? CMessage::Text(MSG_LIB_TEXT_YES) : CMessage::Text(MSG_LIB_TEXT_NO))
         )  :
      property==CHART_PROP_QUICK_NAVIGATION        ?  CMessage::Text(MSG_CHART_OBJ_QUICK_NAVIGATION)+
         (!this.SupportProperty(property) ?  ": "+CMessage::Text(MSG_LIB_PROP_NOT_SUPPORTED) :
          ": "+(this.GetProperty(property) ? CMessage::Text(MSG_LIB_TEXT_YES) : CMessage::Text(MSG_LIB_TEXT_NO))
         )  :
      property==CHART_PROP_SCALE        ?  CMessage::Text(MSG_CHART_OBJ_SCALE)+
         (!this.SupportProperty(property) ?  ": "+CMessage::Text(MSG_LIB_PROP_NOT_SUPPORTED) :
          ": "+(string)this.GetProperty(property)
         )  :
      property==CHART_PROP_SCALEFIX        ?  CMessage::Text(MSG_CHART_OBJ_SCALEFIX)+
         (!this.SupportProperty(property) ?  ": "+CMessage::Text(MSG_LIB_PROP_NOT_SUPPORTED) :
          ": "+(this.GetProperty(property) ? CMessage::Text(MSG_LIB_TEXT_YES) : CMessage::Text(MSG_LIB_TEXT_NO))
         )  :
      property==CHART_PROP_SCALEFIX_11        ?  CMessage::Text(MSG_CHART_OBJ_SCALEFIX_11)+
         (!this.SupportProperty(property) ?  ": "+CMessage::Text(MSG_LIB_PROP_NOT_SUPPORTED) :
          ": "+(this.GetProperty(property) ? CMessage::Text(MSG_LIB_TEXT_YES) : CMessage::Text(MSG_LIB_TEXT_NO))
         )  :
      property==CHART_PROP_SCALE_PT_PER_BAR  ?  CMessage::Text(MSG_CHART_OBJ_SCALE_PT_PER_BAR)+
         (!this.SupportProperty(property) ?  ": "+CMessage::Text(MSG_LIB_PROP_NOT_SUPPORTED) :
          ": "+(this.GetProperty(property) ? CMessage::Text(MSG_LIB_TEXT_YES) : CMessage::Text(MSG_LIB_TEXT_NO))
         )  :
      property==CHART_PROP_SHOW_TICKER        ?  CMessage::Text(MSG_CHART_OBJ_SHOW_TICKER)+
         (!this.SupportProperty(property) ?  ": "+CMessage::Text(MSG_LIB_PROP_NOT_SUPPORTED) :
          ": "+(this.GetProperty(property) ? CMessage::Text(MSG_LIB_TEXT_YES) : CMessage::Text(MSG_LIB_TEXT_NO))
         )  :
      property==CHART_PROP_SHOW_OHLC        ?  CMessage::Text(MSG_CHART_OBJ_SHOW_OHLC)+
         (!this.SupportProperty(property) ?  ": "+CMessage::Text(MSG_LIB_PROP_NOT_SUPPORTED) :
          ": "+(this.GetProperty(property) ? CMessage::Text(MSG_LIB_TEXT_YES) : CMessage::Text(MSG_LIB_TEXT_NO))
         )  :
      property==CHART_PROP_SHOW_BID_LINE  ?  CMessage::Text(MSG_CHART_OBJ_SHOW_BID_LINE)+
         (!this.SupportProperty(property) ?  ": "+CMessage::Text(MSG_LIB_PROP_NOT_SUPPORTED) :
          ": "+(this.GetProperty(property) ? CMessage::Text(MSG_LIB_TEXT_YES) : CMessage::Text(MSG_LIB_TEXT_NO))
         )  :
      property==CHART_PROP_SHOW_ASK_LINE  ?  CMessage::Text(MSG_CHART_OBJ_SHOW_ASK_LINE)+
         (!this.SupportProperty(property) ?  ": "+CMessage::Text(MSG_LIB_PROP_NOT_SUPPORTED) :
          ": "+(this.GetProperty(property) ? CMessage::Text(MSG_LIB_TEXT_YES) : CMessage::Text(MSG_LIB_TEXT_NO))
         )  :
      property==CHART_PROP_SHOW_LAST_LINE ?  CMessage::Text(MSG_CHART_OBJ_SHOW_LAST_LINE)+
         (!this.SupportProperty(property) ?  ": "+CMessage::Text(MSG_LIB_PROP_NOT_SUPPORTED) :
          ": "+(this.GetProperty(property) ? CMessage::Text(MSG_LIB_TEXT_YES) : CMessage::Text(MSG_LIB_TEXT_NO))
         )  :
      property==CHART_PROP_SHOW_PERIOD_SEP   ?  CMessage::Text(MSG_CHART_OBJ_SHOW_PERIOD_SEP)+
         (!this.SupportProperty(property) ?  ": "+CMessage::Text(MSG_LIB_PROP_NOT_SUPPORTED) :
          ": "+(this.GetProperty(property) ? CMessage::Text(MSG_LIB_TEXT_YES) : CMessage::Text(MSG_LIB_TEXT_NO))
         )  :
      property==CHART_PROP_SHOW_GRID        ?  CMessage::Text(MSG_CHART_OBJ_SHOW_GRID)+
         (!this.SupportProperty(property) ?  ": "+CMessage::Text(MSG_LIB_PROP_NOT_SUPPORTED) :
          ": "+(this.GetProperty(property) ? CMessage::Text(MSG_LIB_TEXT_YES) : CMessage::Text(MSG_LIB_TEXT_NO))
         )  :
      property==CHART_PROP_SHOW_VOLUMES   ?  CMessage::Text(MSG_CHART_OBJ_SHOW_VOLUMES)+
         (!this.SupportProperty(property) ?  ": "+CMessage::Text(MSG_LIB_PROP_NOT_SUPPORTED) :
          ": "+ChartModeVolumeDescription((ENUM_CHART_VOLUME_MODE)this.GetProperty(property))
         )  :
      property==CHART_PROP_SHOW_OBJECT_DESCR ?  CMessage::Text(MSG_CHART_OBJ_SHOW_OBJECT_DESCR)+
         (!this.SupportProperty(property) ?  ": "+CMessage::Text(MSG_LIB_PROP_NOT_SUPPORTED) :
          ": "+(this.GetProperty(property) ? CMessage::Text(MSG_LIB_TEXT_YES) : CMessage::Text(MSG_LIB_TEXT_NO))
         )  :
      property==CHART_PROP_VISIBLE_BARS   ?  CMessage::Text(MSG_CHART_OBJ_VISIBLE_BARS)+
         (!this.SupportProperty(property) ?  ": "+CMessage::Text(MSG_LIB_PROP_NOT_SUPPORTED) :
          ": "+(string)this.GetProperty(property)
         )  :
      property==CHART_PROP_WINDOWS_TOTAL  ?  CMessage::Text(MSG_CHART_OBJ_WINDOWS_TOTAL)+
         (!this.SupportProperty(property) ?  ": "+CMessage::Text(MSG_LIB_PROP_NOT_SUPPORTED) :
          ": "+(string)this.GetProperty(property)
         )  :
      property==CHART_PROP_WINDOW_IS_VISIBLE  ?  CMessage::Text(MSG_CHART_OBJ_WINDOW_IS_VISIBLE)+
         (!this.SupportProperty(property) ?  ": "+CMessage::Text(MSG_LIB_PROP_NOT_SUPPORTED) :
          ": "+(this.GetProperty(property) ? CMessage::Text(MSG_LIB_TEXT_YES) : CMessage::Text(MSG_LIB_TEXT_NO))
         )  :
      property==CHART_PROP_WINDOW_HANDLE  ?  CMessage::Text(MSG_CHART_OBJ_WINDOW_HANDLE)+
         (!this.SupportProperty(property) ?  ": "+CMessage::Text(MSG_LIB_PROP_NOT_SUPPORTED) :
          ": "+(string)this.GetProperty(property)
         )  :
      property==CHART_PROP_WINDOW_YDISTANCE  ?  CMessage::Text(MSG_CHART_OBJ_WINDOW_YDISTANCE)+
         (!this.SupportProperty(property) ?  ": "+CMessage::Text(MSG_LIB_PROP_NOT_SUPPORTED) :
          ": "+(string)this.GetProperty(property)
         )  :
      property==CHART_PROP_FIRST_VISIBLE_BAR ?  CMessage::Text(MSG_CHART_OBJ_FIRST_VISIBLE_BAR)+
         (!this.SupportProperty(property) ?  ": "+CMessage::Text(MSG_LIB_PROP_NOT_SUPPORTED) :
          ": "+(string)this.GetProperty(property)
         )  :
      property==CHART_PROP_WIDTH_IN_BARS  ?  CMessage::Text(MSG_CHART_OBJ_WIDTH_IN_BARS)+
         (!this.SupportProperty(property) ?  ": "+CMessage::Text(MSG_LIB_PROP_NOT_SUPPORTED) :
          ": "+(string)this.GetProperty(property)
         )  :
      property==CHART_PROP_WIDTH_IN_PIXELS   ?  CMessage::Text(MSG_CHART_OBJ_WIDTH_IN_PIXELS)+
         (!this.SupportProperty(property) ?  ": "+CMessage::Text(MSG_LIB_PROP_NOT_SUPPORTED) :
          ": "+(string)this.GetProperty(property)
         )  :
      property==CHART_PROP_HEIGHT_IN_PIXELS   ?  CMessage::Text(MSG_CHART_OBJ_HEIGHT_IN_PIXELS)+
         (!this.SupportProperty(property) ?  ": "+CMessage::Text(MSG_LIB_PROP_NOT_SUPPORTED) :
          ": "+(string)this.GetProperty(property)
         )  :
      property==CHART_PROP_COLOR_BACKGROUND        ?  CMessage::Text(MSG_CHART_OBJ_COLOR_BACKGROUND)+
         (!this.SupportProperty(property) ?  ": "+CMessage::Text(MSG_LIB_PROP_NOT_SUPPORTED) :
          ": "+::ColorToString((color)this.GetProperty(property),true)
         )  :
      property==CHART_PROP_COLOR_FOREGROUND  ?  CMessage::Text(MSG_CHART_OBJ_COLOR_FOREGROUND)+
         (!this.SupportProperty(property) ?  ": "+CMessage::Text(MSG_LIB_PROP_NOT_SUPPORTED) :
          ": "+::ColorToString((color)this.GetProperty(property),true)
         )  :
      property==CHART_PROP_COLOR_GRID     ?  CMessage::Text(MSG_CHART_OBJ_COLOR_GRID)+
         (!this.SupportProperty(property) ?  ": "+CMessage::Text(MSG_LIB_PROP_NOT_SUPPORTED) :
          ": "+::ColorToString((color)this.GetProperty(property),true)
         )  :
      property==CHART_PROP_COLOR_VOLUME   ?  CMessage::Text(MSG_CHART_OBJ_COLOR_VOLUME)+
         (!this.SupportProperty(property) ?  ": "+CMessage::Text(MSG_LIB_PROP_NOT_SUPPORTED) :
          ": "+::ColorToString((color)this.GetProperty(property),true)
         )  :
      property==CHART_PROP_COLOR_CHART_UP ?  CMessage::Text(MSG_CHART_OBJ_COLOR_CHART_UP)+
         (!this.SupportProperty(property) ?  ": "+CMessage::Text(MSG_LIB_PROP_NOT_SUPPORTED) :
          ": "+::ColorToString((color)this.GetProperty(property),true)
         )  :
      property==CHART_PROP_COLOR_CHART_DOWN  ?  CMessage::Text(MSG_CHART_OBJ_COLOR_CHART_DOWN)+
         (!this.SupportProperty(property) ?  ": "+CMessage::Text(MSG_LIB_PROP_NOT_SUPPORTED) :
          ": "+::ColorToString((color)this.GetProperty(property),true)
         )  :
      property==CHART_PROP_COLOR_CHART_LINE  ?  CMessage::Text(MSG_CHART_OBJ_COLOR_CHART_LINE)+
         (!this.SupportProperty(property) ?  ": "+CMessage::Text(MSG_LIB_PROP_NOT_SUPPORTED) :
          ": "+::ColorToString((color)this.GetProperty(property),true)
         )  :
      property==CHART_PROP_COLOR_CANDLE_BULL ?  CMessage::Text(MSG_CHART_OBJ_COLOR_CANDLE_BULL)+
         (!this.SupportProperty(property) ?  ": "+CMessage::Text(MSG_LIB_PROP_NOT_SUPPORTED) :
          ": "+::ColorToString((color)this.GetProperty(property),true)
         )  :
      property==CHART_PROP_COLOR_CANDLE_BEAR ?  CMessage::Text(MSG_CHART_OBJ_COLOR_CANDLE_BEAR)+
         (!this.SupportProperty(property) ?  ": "+CMessage::Text(MSG_LIB_PROP_NOT_SUPPORTED) :
          ": "+::ColorToString((color)this.GetProperty(property),true)
         )  :
      property==CHART_PROP_COLOR_BID        ?  CMessage::Text(MSG_CHART_OBJ_COLOR_BID)+
         (!this.SupportProperty(property) ?  ": "+CMessage::Text(MSG_LIB_PROP_NOT_SUPPORTED) :
          ": "+::ColorToString((color)this.GetProperty(property),true)
         )  :
      property==CHART_PROP_COLOR_ASK        ?  CMessage::Text(MSG_CHART_OBJ_COLOR_ASK)+
         (!this.SupportProperty(property) ?  ": "+CMessage::Text(MSG_LIB_PROP_NOT_SUPPORTED) :
          ": "+::ColorToString((color)this.GetProperty(property),true)
         )  :
      property==CHART_PROP_COLOR_LAST        ?  CMessage::Text(MSG_CHART_OBJ_COLOR_LAST)+
         (!this.SupportProperty(property) ?  ": "+CMessage::Text(MSG_LIB_PROP_NOT_SUPPORTED) :
          ": "+::ColorToString((color)this.GetProperty(property),true)
         )  :
      property==CHART_PROP_COLOR_STOP_LEVEL  ?  CMessage::Text(MSG_CHART_OBJ_COLOR_STOP_LEVEL)+
         (!this.SupportProperty(property) ?  ": "+CMessage::Text(MSG_LIB_PROP_NOT_SUPPORTED) :
          ": "+::ColorToString((color)this.GetProperty(property),true)
         )  :
      property==CHART_PROP_SHOW_TRADE_LEVELS ?  CMessage::Text(MSG_CHART_OBJ_SHOW_TRADE_LEVELS)+
         (!this.SupportProperty(property) ?  ": "+CMessage::Text(MSG_LIB_PROP_NOT_SUPPORTED) :
          ": "+(this.GetProperty(property) ? CMessage::Text(MSG_LIB_TEXT_YES) : CMessage::Text(MSG_LIB_TEXT_NO))
         )  :
      property==CHART_PROP_DRAG_TRADE_LEVELS ?  CMessage::Text(MSG_CHART_OBJ_DRAG_TRADE_LEVELS)+
         (!this.SupportProperty(property) ?  ": "+CMessage::Text(MSG_LIB_PROP_NOT_SUPPORTED) :
          ": "+(this.GetProperty(property) ? CMessage::Text(MSG_LIB_TEXT_YES) : CMessage::Text(MSG_LIB_TEXT_NO))
         )  :
      property==CHART_PROP_SHOW_DATE_SCALE   ?  CMessage::Text(MSG_CHART_OBJ_SHOW_DATE_SCALE)+
         (!this.SupportProperty(property) ?  ": "+CMessage::Text(MSG_LIB_PROP_NOT_SUPPORTED) :
          ": "+(this.GetProperty(property) ? CMessage::Text(MSG_LIB_TEXT_YES) : CMessage::Text(MSG_LIB_TEXT_NO))
         )  :
      property==CHART_PROP_SHOW_PRICE_SCALE  ?  CMessage::Text(MSG_CHART_OBJ_SHOW_PRICE_SCALE)+
         (!this.SupportProperty(property) ?  ": "+CMessage::Text(MSG_LIB_PROP_NOT_SUPPORTED) :
          ": "+(this.GetProperty(property) ? CMessage::Text(MSG_LIB_TEXT_YES) : CMessage::Text(MSG_LIB_TEXT_NO))
         )  :
      property==CHART_PROP_SHOW_ONE_CLICK ?  CMessage::Text(MSG_CHART_OBJ_SHOW_ONE_CLICK)+
         (!this.SupportProperty(property) ?  ": "+CMessage::Text(MSG_LIB_PROP_NOT_SUPPORTED) :
          ": "+(this.GetProperty(property) ? CMessage::Text(MSG_LIB_TEXT_YES) : CMessage::Text(MSG_LIB_TEXT_NO))
         )  :
      property==CHART_PROP_IS_MAXIMIZED   ?  CMessage::Text(MSG_CHART_OBJ_IS_MAXIMIZED)+
         (!this.SupportProperty(property) ?  ": "+CMessage::Text(MSG_LIB_PROP_NOT_SUPPORTED) :
          ": "+(this.GetProperty(property) ? CMessage::Text(MSG_LIB_TEXT_YES) : CMessage::Text(MSG_LIB_TEXT_NO))
         )  :
      property==CHART_PROP_IS_MINIMIZED   ?  CMessage::Text(MSG_CHART_OBJ_IS_MINIMIZED)+
         (!this.SupportProperty(property) ?  ": "+CMessage::Text(MSG_LIB_PROP_NOT_SUPPORTED) :
          ": "+(this.GetProperty(property) ? CMessage::Text(MSG_LIB_TEXT_YES) : CMessage::Text(MSG_LIB_TEXT_NO))
         )  :
      property==CHART_PROP_IS_DOCKED      ?  CMessage::Text(MSG_CHART_OBJ_IS_DOCKED)+
         (!this.SupportProperty(property) ?  ": "+CMessage::Text(MSG_LIB_PROP_NOT_SUPPORTED) :
          ": "+(this.GetProperty(property) ? CMessage::Text(MSG_LIB_TEXT_YES) : CMessage::Text(MSG_LIB_TEXT_NO))
         )  :
      property==CHART_PROP_FLOAT_LEFT     ?  CMessage::Text(MSG_CHART_OBJ_FLOAT_LEFT)+
         (!this.SupportProperty(property) ?  ": "+CMessage::Text(MSG_LIB_PROP_NOT_SUPPORTED) :
          ": "+(string)this.GetProperty(property)
         )  :
      property==CHART_PROP_FLOAT_TOP      ?  CMessage::Text(MSG_CHART_OBJ_FLOAT_TOP)+
         (!this.SupportProperty(property) ?  ": "+CMessage::Text(MSG_LIB_PROP_NOT_SUPPORTED) :
          ": "+(string)this.GetProperty(property)
         )  :
      property==CHART_PROP_FLOAT_RIGHT    ?  CMessage::Text(MSG_CHART_OBJ_FLOAT_RIGHT)+
         (!this.SupportProperty(property) ?  ": "+CMessage::Text(MSG_LIB_PROP_NOT_SUPPORTED) :
          ": "+(string)this.GetProperty(property)
         )  :
      property==CHART_PROP_FLOAT_BOTTOM   ?  CMessage::Text(MSG_CHART_OBJ_FLOAT_BOTTOM)+
         (!this.SupportProperty(property) ?  ": "+CMessage::Text(MSG_LIB_PROP_NOT_SUPPORTED) :
          ": "+(string)this.GetProperty(property)
         )  :
      ""
     );
  }
//+------------------------------------------------------------------+
Os blocos do código adicionado são idênticos a todos os outros - dependendo da propriedade passada ao método, uma string que descreve essa propriedade é criada e retornada.
Vamos modificar o método que imprime todas as propriedades do objeto no log:
//+------------------------------------------------------------------+
//| Display object properties in the journal                         |
//+------------------------------------------------------------------+
void CChartObj::Print(const bool full_prop=false)
  {
   ::Print("============= ",CMessage::Text(MSG_LIB_PARAMS_LIST_BEG)," (",this.Header(),") =============");
   int beg=0, end=CHART_PROP_INTEGER_TOTAL;
   for(int i=beg; i<end; i++)
     {
      ENUM_CHART_PROP_INTEGER prop=(ENUM_CHART_PROP_INTEGER)i;
      if(!full_prop && !this.SupportProperty(prop)) continue;
      if(prop==CHART_PROP_WINDOW_IND_HANDLE || prop==CHART_PROP_WINDOW_IND_INDEX) continue;
      if(prop==CHART_PROP_HEIGHT_IN_PIXELS)
        {
         this.PrintWndParameters();
         continue;
        }
      ::Print(this.GetPropertyDescription(prop));
     }
   ::Print("------");
   beg=end; end+=CHART_PROP_DOUBLE_TOTAL;
   for(int i=beg; i<end; i++)
     {
      ENUM_CHART_PROP_DOUBLE prop=(ENUM_CHART_PROP_DOUBLE)i;
      if(!full_prop && !this.SupportProperty(prop)) continue;
      ::Print(this.GetPropertyDescription(prop));
     }
   ::Print("------");
   beg=end; end+=CHART_PROP_STRING_TOTAL;
   for(int i=beg; i<end; i++)
     {
      ENUM_CHART_PROP_STRING prop=(ENUM_CHART_PROP_STRING)i;
      if(!full_prop && !this.SupportProperty(prop)) continue;
      if(prop==CHART_PROP_INDICATOR_NAME)
        {
         this.PrintWndIndicators();
         continue;
        }
      ::Print(this.GetPropertyDescription(prop));
     }
   ::Print("============= ",CMessage::Text(MSG_LIB_PARAMS_LIST_END)," (",this.Header(),") =============\n");
  }
//+------------------------------------------------------------------+
Se durante o loop encontrarmos as propriedades "Identificador do indicador" e "ID do indicador na janela", essas propriedades serão ignoradas - elas não pertencem ao objeto gráfico.
Se a propriedade "Altura do gráfico em pixels" for encontrada, será chamado o método que exibe a descrição desta propriedade para todas as janelas deste gráfico.
De igual maneira, se for encontrada a propriedade "Nome do indicador na janela", será chamado um método que exibe uma descrição de todos os indicadores anexados a todas as janelas do gráfico. Veremos esses métodos mais tarde.
Método que registra uma breve descrição de um objeto também foi complementado.
Além disso, agora exibe o número de subjanelas da janela do gráfico, se houver, ou imprime que não há:
//+------------------------------------------------------------------+
//| Display a short description of the object in the journal         |
//+------------------------------------------------------------------+
void CChartObj::PrintShort(const bool dash=false)
  {
   ::Print
     (
      (dash ? "- " : ""),this.Header()," ID: ",(string)this.ID(),", HWND: ",(string)this.Handle(),
      ", ",CMessage::Text(MSG_CHART_OBJ_CHART_SUBWINDOWS_NUM),": ",(this.WindowsTotal()>1 ? string(this.WindowsTotal()-1) : CMessage::Text(MSG_LIB_TEXT_NO))
     );
  }
//+------------------------------------------------------------------+
Método que imprime no log dados de todos os indicadores de todas as janelas do gráfico:
//+-------------------------------------------------------------------+
//| Display data of all indicators of all chart windows in the journal|
//+-------------------------------------------------------------------+
void CChartObj::PrintWndIndicators(void)
  {
   for(int i=0;i<this.WindowsTotal();i++)
     {
      CChartWnd *wnd=m_list_wnd.At(i);
      if(wnd==NULL)
         continue;
      wnd.PrintIndicators(true);
     }
  }
//+------------------------------------------------------------------+
Aqui: num loop percorrendo todos os objetos-janelas do gráfico obtemos o próximo objeto-janela do gráfico e imprimimos no log as descrições de todos os indicadores anexados a esta janela. Ao método transferimos true para que um hífen apareça antes da descrição do indicador.
Método que imprime no log as propriedades de todas as janelas do gráfico:
//+------------------------------------------------------------------+
//| Display the properties of all chart windows in the journal       |
//+------------------------------------------------------------------+
void CChartObj::PrintWndParameters(void)
  {
   for(int i=0;i<this.WindowsTotal();i++)
     {
      CChartWnd *wnd=m_list_wnd.At(i);
      if(wnd==NULL)
         continue;
      wnd.PrintParameters(true);
     }
  }
//+------------------------------------------------------------------+
Aqui: num loop percorrendo todos os objetos da janela do gráfico obtemos o próximo objeto-janela do gráfico e imprimimos no log uma descrição de seus parâmetros. Ao método transferimos true para que um hífen apareça antes da descrição da janela.
Método que retorna um objeto-janela por seu número de subjanela:
//+------------------------------------------------------------------+
//| Return the window object by its subwindow index                  |
//+------------------------------------------------------------------+
CChartWnd *CChartObj::GetWindowByNum(const int win_num) const
  {
   int total=m_list_wnd.Total();
   for(int i=0;i<total;i++)
     {
      CChartWnd *wnd=m_list_wnd.At(i);
      if(wnd==NULL)
         continue;
      if(wnd.WindowNum()==win_num)
         return wnd;
     }
   return NULL;
  }
//+------------------------------------------------------------------+
Aqui: num loop percorrendo o número total de objetos-janelas do gráfico obtemos o próximo objeto-janela e se o seu número corresponder ao passado para o método, retornamos um ponteiro para o objeto encontrado na lista. No final do loop, retornamos NULL - o objeto foi encontrado.
O método que define a propriedade "Visibilidade da subjanela" para o objeto-gráfico:
//+------------------------------------------------------------------+
//| Set the "Subwindow visibility" property                          |
//+------------------------------------------------------------------+
void CChartObj::SetVisible(void)
  {
   this.SetProperty(CHART_PROP_WINDOW_IS_VISIBLE,::ChartGetInteger(this.ID(),CHART_WINDOW_IS_VISIBLE,0));
  }
//+------------------------------------------------------------------+
Aqui, simplesmente na propriedade especificada correspondente escrevemos a propriedade read/only da janela principal do gráfico.
Método que retorna a distância em pixels ao longo do eixo Y vertical entre o quadro superior da subjanela do indicador e o quadro superior da janela principal:
//+-----------------------------------------------------------------------------------+
//| Return the distance in pixels by Y axis between                                   |
//| the upper frame of the indicator subwindow and the upper frame of the main window |
//+-----------------------------------------------------------------------------------+
int CChartObj::WindowYDistance(const int sub_window) const
  {
   CChartWnd *wnd=GetWindowByNum(sub_window);
   return(wnd!=NULL ? wnd.YDistance() : WRONG_VALUE);
  }
//+------------------------------------------------------------------+
Aqui: obtemos o objeto da janela do gráfico por seu número de subjanela e retornamos o valor da propriedade a partir do objeto recebido.
Se o objeto não for recebido, retornamos -1.
Método que retorna a altura do gráfico especificado em pixels:
//+------------------------------------------------------------------+
//| Return the height of the specified chart in pixels               |
//+------------------------------------------------------------------+
int CChartObj::WindowHeightInPixels(const int sub_window) const
  {
   CChartWnd *wnd=GetWindowByNum(sub_window);
   return(wnd!=NULL ? wnd.HeightInPixels() : WRONG_VALUE);
  }
//+------------------------------------------------------------------+
Aqui: obtemos o objeto da janela do gráfico por seu número de subjanela e retornamos o valor da propriedade a partir do objeto recebido.
Se o objeto não for recebido, retornamos -1.
Método que define a altura do gráfico especificado em pixels:
//+------------------------------------------------------------------+
//| Set the height of the specified chart in pixels                  |
//+------------------------------------------------------------------+
bool CChartObj::SetWindowHeightInPixels(const int height,const int sub_window,const bool redraw=false)
  {
   CChartWnd *wnd=GetWindowByNum(sub_window);
   return(wnd!=NULL ? wnd.SetHeightInPixels(height,redraw) : false);
  }
//+------------------------------------------------------------------+
Aqui: obtemos o objeto-janela do gráfico por seu número de subjanela e retornamos o resultado da configuração da propriedade correspondente para o objeto resultante.
Se o objeto não for recebido, devolvemos false.
Vamos remover o método antigo que escrevemos no último artigo:
//+------------------------------------------------------------------+
//| Set the height of the specified chart in pixels                  |
//+------------------------------------------------------------------+
bool CChartObj::SetWindowHeightInPixels(const int height,const int sub_window,const bool redraw=false)
  {
   ::ResetLastError();
   if(!::ChartSetInteger(this.ID(),CHART_HEIGHT_IN_PIXELS,sub_window,height))
     {
      CMessage::ToLog(DFUN,::GetLastError(),true);
      return false;
     }
   if(redraw)
      ::ChartRedraw(this.ID());
   return true;
  }
//+------------------------------------------------------------------+
Assim concluímos a modificação da classe do objeto-gráfico.
Teste
Para verificar o desempenho dos objetos criados, basta abrir três gráficos. À janela principal do gráfico do EA adicionamos o indicador de fractais + adicionamos uma janela de um indicador, por exemplo, DeMarker, nela colocaremos outro, por exemplo, AMA, calculado sobre os dados DeMarker.
No segundo gráfico, colocaremos a janela do estocástico, e desafixaremos a terceira janela (Alt+D):
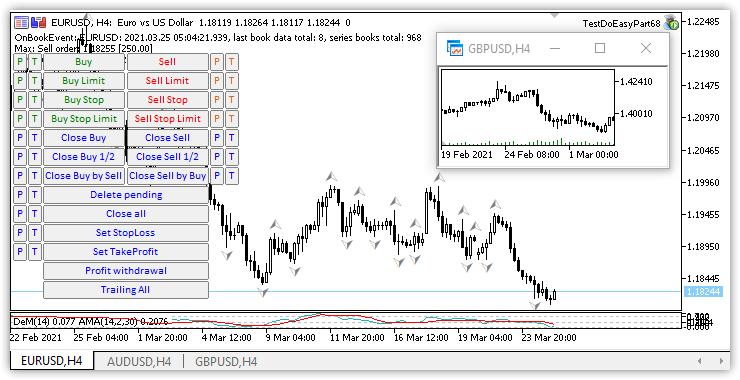
No logo imprimiremos breves descrições de todos os três objetos-gráficos e uma descrição completa do gráfico atual onde está localizado o EA.
Para o teste, tomamos o Expert Advisor do último artigo e
o salvamos numa nova pasta \MQL5\Experts\TestDoEasy\Part68\ com o novo nome TestDoEasyPart68.mq5.
O EA permanecerá praticamente inalterado. Tudo o que precisamos é adicionar a seguinte lógica ao código do manipulador OnTick():
//+------------------------------------------------------------------+
//| Expert tick function                                             |
//+------------------------------------------------------------------+
void OnTick()
  {
//--- Handle the NewTick event in the library
   engine.OnTick(rates_data);

//--- If working in the tester
   if(MQLInfoInteger(MQL_TESTER))
     {
      engine.OnTimer(rates_data);   // Working in the timer
      PressButtonsControl();        // Button pressing control
      engine.EventsHandling();      // Working with events
     }

//--- If the trailing flag is set
   if(trailing_on)
     {
      TrailingPositions();          // Trailing positions
      TrailingOrders();             // Trailing pending orders
     }

//--- If it is the first launch
   static bool done=false;
   if(!done)
     {
      //--- Create the list object for storing chart objects
      CArrayObj *list=new CArrayObj();
      if(list==NULL)
         return;
      //--- Declare the variables and get the first chart ID
      long currChart,prevChart=ChartFirst();
      int i=0;
      //--- Create the chart object and add it to the list
      CChartObj *chart_first=new CChartObj(prevChart);
      list.Add(chart_first);
      //--- In the loop by the total number of terminal charts (not more than 100)
      while(i<CHARTS_MAX)
        {
         //--- based on the previous one, get the new chart
         currChart=ChartNext(prevChart);
         //--- When reaching the end of the chart list, complete the loop
         if(currChart<0) break;
         //--- Create the chart object based on the current chart ID in the loop and add it to the list
         CChartObj *chart=new CChartObj(currChart);
         list.Add(chart);
         //--- remember the current chart ID for ChartNext() and increase the loop counter
         prevChart=currChart;
         i++;
        }
      Print("");
      //--- From the filled list in the loop, receive the next chart object and display its short description
      int total=list.Total();
      for(int j=0;j<total;j++)
        {
         CChartObj *chart_obj=list.At(j);
         if(chart_obj!=NULL)
            chart_obj.PrintShort();
        }
      Print("");
      //--- Display the full description of the current chart: in the loop by all objects of the created list
      for(int j=0;j<total;j++)
        {
         //--- get the next chart object and
         CChartObj *chart_obj=list.At(j);
         //--- if its symbol matches the current chart symbol, display its full description in the journal
         if(chart_obj!=NULL && chart_obj.Symbol()==Symbol())
            chart_obj.Print();
        }
      //--- Destroy the list of chart objects
      delete list;
      done=true;
     }
//---
  }
//+------------------------------------------------------------------+
Vamos compilar o Expert Advisor e iniciá-lo no gráfico, tendo criado anteriormente o ambiente necessário no terminal, descrito no início desta seção.
No log serão exibidas breves descrições de todos os três gráficos abertos:
Main chart window EURUSD H4 ID: 131733844391938630, HWND: 5179646, Subwindows: 1
Main chart window AUDUSD H4 ID: 131733844391938634, HWND: 3672036, Subwindows: 1
Main chart window GBPUSD H4 ID: 131733844391938633, HWND: 3473910, Subwindows: No
e uma descrição completa do atual. O desempenho das classes criadas hoje é exibido no log como linhas ordenadas de propriedades de objetos-janelas e de indicadores anexados a eles:
============= The beginning of the parameter list (Main chart window EURUSD H4) =============
Chart ID: 131733844391938630
Timeframe: H4
Drawing attributes of a price chart: Yes
Object "Chart": No
Chart on top of other charts: No
Accessing the context menu by pressing the right mouse button: Yes
Accessing the "Crosshair tool" by pressing the middle mouse button: Yes
Scrolling the chart horizontally using the left mouse button: Yes
Sending messages about mouse wheel events to all mql5 programs on a chart: No
Send notifications of mouse move and mouse click events to all mql5 programs on a chart: No
Send a notification of an event of new object creation to all mql5-programs on a chart: No
Send a notification of an event of object deletion to all mql5-programs on a chart: No
Chart type: Display as Japanese candlesticks
Price chart in the foreground: No
Price chart indent from the right border: Yes
Automatic moving to the right border of the chart: Yes
Managing the chart using a keyboard: Yes
Allowed to intercept Space and Enter key presses on the chart to activate the quick navigation bar: Yes
Scale: 2
Fixed scale mode: No
Scale 1:1 mode: No
Scale to be specified in points per bar: No
Display a symbol ticker in the upper left corner: Yes
Display OHLC values in the upper left corner: Yes
Display Bid values as a horizontal line in a chart: Yes
Display Ask values as a horizontal line in a chart: Yes
Display Last values as a horizontal line in a chart: No
Display vertical separators between adjacent periods: No
Display grid in the chart: No
Display volume in the chart: Trade volumes
Display textual descriptions of objects: Yes
The number of bars on the chart that can be displayed: 137
The total number of chart windows, including indicator subwindows: 2
Visibility of subwindow: Yes
Chart window handle: 5179646
Number of the first visible bar in the chart: 136
Chart width in bars: 168
Chart width in pixels: 670
 Main chart window:
 - Chart height in pixels: 301
 Chart subwindow 1:
 - The distance between the upper frame of the indicator subwindow and the upper frame of the main chart window: 303
 - Chart height in pixels: 13
Chart background color: clrWhite
Color of axes, scales and OHLC line: clrBlack
Grid color: clrSilver
Color of volumes and position opening levels: clrGreen
Color for the up bar, shadows and body borders of bull candlesticks: clrBlack
Color for the down bar, shadows and body borders of bear candlesticks: clrBlack
Line chart color and color of "Doji" Japanese candlesticks: clrBlack
Body color of a bull candlestick: clrWhite
Body color of a bear candlestick: clrBlack
Bid price level color: clrLightSkyBlue
Ask price level color: clrCoral
Line color of the last executed deal price (Last): clrSilver
Color of stop order levels (Stop Loss and Take Profit): clrOrangeRed
Displaying trade levels in the chart (levels of open positions, Stop Loss, Take Profit and pending orders): Yes
Permission to drag trading levels on a chart with a mouse: Yes
Showing the time scale on a chart: Yes
Showing the price scale on a chart: Yes
Showing the "One click trading" panel on a chart: No
Chart window is maximized: Yes
Chart window is minimized: No
The chart window is docked: Yes
The left coordinate of the undocked chart window relative to the virtual screen: 0
The top coordinate of the undocked chart window relative to the virtual screen: 0
The right coordinate of the undocked chart window relative to the virtual screen: 0
The bottom coordinate of the undocked chart window relative to the virtual screen: 0
------
The size of the zero bar indent from the right border in percents: 18.93
Chart fixed position from the left border in percent value: 0.00
Fixed  chart maximum: 1.22620
Fixed  chart minimum : 1.17940
Scale in points per bar: 1.00
Chart minimum: 1.17940
Chart maximum: 1.22620
------
Text of a comment in a chart: ""
The name of the Expert Advisor running on the chart: "TestDoEasyPart68"
The name of the script running on the chart: ""
Indicators in the main chart window:
- Indicator Fractals
Indicators in the chart window 1:
- Indicator DeM(14)
- Indicator AMA(14,2,30)
Symbol: "EURUSD"
============= End of the parameter list (Main chart window EURUSD H4) =============
O que vem agora?
No próximo artigo, começaremos a desenvolver uma classes-coleção de objetos-gráficos.
Todos os arquivos da versão atual da biblioteca e o arquivo do EA de teste para MQL5 estão anexados abaixo. Você pode baixá-los e testar tudo sozinho.
Gostaria de ressaltar que não é recomendado usar os objetos-gráficos como estão agora atual devido a que posteriormente serão alterados.
Se você tiver perguntas, comentários e sugestões, poderá expressá-los nos comentários do artigo.
*Artigos desta série:
Trabalhando com preços na biblioteca DoEasy (Parte 62): atualização em tempo real da série de ticks, preparação para trabalhar com o livro de ofertas Trabalhando preços na biblioteca DoEasy (Parte 63): livro de ofertas, classe de ordem abstrata do livro de ofertas
Trabalhando com preços na biblioteca DoEasy (Parte 64): livro de ofertas, classes do objeto-instantâneo e objeto-série de instantâneos do livro de ofertas
Trabalhando com preços e sinais na biblioteca DoEasy (Parte 65): coleção de livros de ofertas e classe para trabalhar com sinais MQL5.com
Outras classes na biblioteca DoEasy (Parte 66): classe-coleção de sinais MQL5.com
Outras classes na biblioteca DoEasy (Parte 67): classe de objeto-gráfico
Traduzido do russo pela MetaQuotes Ltd.
Artigo original: https://www.mql5.com/ru/articles/9236
Aviso: Todos os direitos sobre esses materiais pertencem à MetaQuotes Ltd. É proibida a reimpressão total ou parcial.
Esse artigo foi escrito por um usuário do site e reflete seu ponto de vista pessoal. A MetaQuotes Ltd. não se responsabiliza pela precisão das informações apresentadas nem pelas possíveis consequências decorrentes do uso das soluções, estratégias ou recomendações descritas.

 Redes neurais de maneira fácil (Parte 13): normalização em lote
 Padrão de design MVC e a possibilidade de usá-lo
- Aplicativos de negociação gratuitos
- 8 000+ sinais para cópia
- Notícias econômicas para análise dos mercados financeiros
Você concorda com a política do site e com os termos de uso
Por favor, devolva o dinheiro!
Se você tiver uma oferta de acordo, apresente-a!
1. você não tem ideia do que está falando.
2. se você estiver com problemas com a MetaQuotes, informe a central de atendimento.
3. Ninguém vê o que você escreve no fórum. Não perca mais tempo postando.