
DoEasy 库中的其他类(第七十二部分):跟踪并记录集合中的图表对象参数

内容
概述
本文会完成图表对象类及其集合的讲述。 在客户端打开的所有图表,以及它们的子窗口和指标,都已经存储在图表集合当中了。 在图表属性发生任何变化的情况下,一些事件已经得到处理,同时相应的自定义事件会被发送到控制程序图表。 然而,我们能够更改图表对象或窗口属性,且我们需要将变更后的属性新值设置到变更对象参数。
幸运的是,我们已拥有t赋予其所有衍生后代事件功能的对象(所有函数库对象的扩展基准对象)。 我们的图表对象和图表窗口类已是该对象的衍生后代。 我们只需要针对衍生后代对象的属性更改添加标准处理程序即可。 若指定属性发生变化时,该类会自动更新其衍生后代的所有属性,并创建其衍生后代对象发生的事件列表。
我们期望由程序管理的所有被跟踪对象属性均应预先指定,从而创建对象所发生事件,并将其发送到控制程序图表。 扩展基准对象允许为指定属性设置变更值,或为所跟踪属性或所跟踪属性的变化组合设置超界阈值。
为对象属性实现的所有修改都会自动地设置到其参数。 如果启用了跟踪某些对象属性,我们所要跟踪的这些属性将会提交变更“信号”。
几乎所有的函数库对象都有相似的结构 — 一套属性(整数型、实数型和字符串型),对象排序标准,专门对应于每个单独对象的属性,一些在对象排序列表中查找和排序的方法,描述对象属性的方法,且该类允许依据指定属性在对象列表中搜索并返回列表中含有所需属性的最大值或最小值的对象索引。
所有这些对象属性的长篇简述,附加到对象本身,并与它密不可分地联系在一起,令对象本身的创建稍微复杂化,但极大简化了将来的工作。 事实证明,图表窗口对象类也是如此。 它表明最初是不完整的(就像所有主库对象一样),而我已经简化了我的任务,从而可不必单独编写其所有属性,而是将它们放在窗口归属的图表对象的属性之中。
现在,当实现图表对象及其子窗口属性的自动更新时,若利用其父类的方法保存图表窗口对象属性的先前状态,我们会遇到极复杂的情况。 因此,我决定令图表窗口对象成为一个成熟的函数库对象,通过搜索跟踪事件大大简化了其自动更新的实现(我很久以前在创建父类时已经完成了所有这些工作 — 扩展对象所有函数库对象)。
改进库类
在 \MQL5\Include\DoEasy\Data.mqh 里,添加函数库的新消息索引:
   MSG_LIB_TEXT_SYMBOL,                               // symbol:
   MSG_LIB_TEXT_ACCOUNT,                              // account:
   MSG_LIB_TEXT_CHART,                                // chart:
   MSG_LIB_TEXT_CHART_WND,                            // chart window:
   MSG_LIB_TEXT_PROP_VALUE,                           // Property value
...
   MSG_CHART_COLLECTION_CHART_OPENED,                 // Chart opened
   MSG_CHART_COLLECTION_CHART_CLOSED,                 // Chart closed

   MSG_CHART_COLLECTION_CHART_SYMB_CHANGED,           // Chart symbol changed
   MSG_CHART_COLLECTION_CHART_TF_CHANGED,             // Chart timeframe changed
   MSG_CHART_COLLECTION_CHART_SYMB_TF_CHANGED,        // Chart symbol and timeframe changed

  };
//+------------------------------------------------------------------+
及与新添加的索引相对应的消息文本:
   {"символа: ","symbol property: "},
   {"аккаунта: ","account property: "},
   {"чарта: ","chart property: "},
   {"окна чарта: ","chart window property: "},
   {"Значение свойства ","Value of the "},
...
   {"Открыт график","Open chart"},
   {"Закрыт график","Closed chart"},

   {"Изменён символ графика","Changed chart symbol"},
   {"Изменён таймфрейм графика","Changed chart timeframe"},
   {"Изменён символ и таймфрейм графика","Changed the symbol and timeframe of the chart"},

  };
//+---------------------------------------------------------------------+
在 \MQL5\Include\DoEasy\Defines.mqh 文件的集合列表 ID 部分,添加一个新的图表窗口列表 ID:
//--- Collection list IDs
#define COLLECTION_HISTORY_ID          (0x777A)                   // Historical collection list ID
#define COLLECTION_MARKET_ID           (0x777B)                   // Market collection list ID
#define COLLECTION_EVENTS_ID           (0x777C)                   // Event collection list ID
#define COLLECTION_ACCOUNT_ID          (0x777D)                   // Account collection list ID
#define COLLECTION_SYMBOLS_ID          (0x777E)                   // Symbol collection list ID
#define COLLECTION_SERIES_ID           (0x777F)                   // Timeseries collection list ID
#define COLLECTION_BUFFERS_ID          (0x7780)                   // Indicator buffer collection list ID
#define COLLECTION_INDICATORS_ID       (0x7781)                   // Indicator collection list ID
#define COLLECTION_INDICATORS_DATA_ID  (0x7782)                   // Indicator data collection list ID
#define COLLECTION_TICKSERIES_ID       (0x7783)                   // Tick series collection list ID
#define COLLECTION_MBOOKSERIES_ID      (0x7784)                   // DOM series collection list ID
#define COLLECTION_MQL5_SIGNALS_ID     (0x7785)                   // MQL5 signals collection list ID
#define COLLECTION_CHARTS_ID           (0x7786)                   // Chart collection list ID
#define COLLECTION_CHART_WND_ID        (0x7787)                   // Chart window list ID
//--- Pending request type IDs
这些 ID 允许我们定义某个对象所归属属的集合或列表。 在这种情况下,该 ID 允许我们定义事件来自的对象,并创建事件描述。 所有这些都是在所有函数库对象的扩展基准对象类中完成的。
在上一篇文章中,我已实现了一些图表事件的处理。 今天,我将为它们添加一个品种和时间帧的修改。
为此,在同一文件中的可能图表事件枚举中 设置三个附加常量:
//+------------------------------------------------------------------+
//| Data for working with charts                                     |
//+------------------------------------------------------------------+
//+------------------------------------------------------------------+
//| List of possible chart events                                    |
//+------------------------------------------------------------------+
enum ENUM_CHART_OBJ_EVENT
  {
   CHART_OBJ_EVENT_NO_EVENT = SIGNAL_MQL5_EVENTS_NEXT_CODE, // No event
   CHART_OBJ_EVENT_CHART_OPEN,                        // "New chart opening" event
   CHART_OBJ_EVENT_CHART_CLOSE,                       // "Chart closure" event
   CHART_OBJ_EVENT_CHART_SYMB_CHANGE,                 // "Chart symbol changed" event
   CHART_OBJ_EVENT_CHART_SYMB_TF_CHANGE,              // "Chart symbol and timeframe changed" event
   CHART_OBJ_EVENT_CHART_TF_CHANGE,                   // "Chart timeframe changed" event
   CHART_OBJ_EVENT_CHART_WND_ADD,                     // "Adding a new window on the chart" event
   CHART_OBJ_EVENT_CHART_WND_DEL,                     // "Removing a window from the chart" event
   CHART_OBJ_EVENT_CHART_WND_IND_ADD,                 // "Adding a new indicator to the chart window" event
   CHART_OBJ_EVENT_CHART_WND_IND_DEL,                 // "Removing an indicator from the chart window" event
   CHART_OBJ_EVENT_CHART_WND_IND_CHANGE,              // "Changing indicator parameters in the chart window" event
  };
#define CHART_OBJ_EVENTS_NEXT_CODE  (CHART_OBJ_EVENT_CHART_WND_IND_CHANGE+1)  // The code of the next event after the last chart event code
//+------------------------------------------------------------------+
从整数型属性的枚举中删除图表窗口索引:
   CHART_PROP_WINDOW_NUM,                             // Chart window index
  };
此属性属于图表窗口对象。 将图表及其窗口的一些通用属性移到枚举常量列表的末尾:
//+------------------------------------------------------------------+
//| Chart integer property                                           |
//+------------------------------------------------------------------+
enum ENUM_CHART_PROP_INTEGER
  {
   CHART_PROP_ID = 0,                                 // Chart ID
   CHART_PROP_TIMEFRAME,                              // Chart timeframe
   CHART_PROP_SHOW,                                   // Price chart drawing
   CHART_PROP_IS_OBJECT,                              // Chart object (OBJ_CHART) identification attribute
   CHART_PROP_BRING_TO_TOP,                           // Show chart above all others
   CHART_PROP_CONTEXT_MENU,                           // Enable/disable access to the context menu using the right click
   CHART_PROP_CROSSHAIR_TOOL,                         // Enable/disable access to the Crosshair tool using the middle click
   CHART_PROP_MOUSE_SCROLL,                           // Scroll the chart horizontally using the left mouse button
   CHART_PROP_EVENT_MOUSE_WHEEL,                      // Send messages about mouse wheel events (CHARTEVENT_MOUSE_WHEEL) to all MQL5 programs on a chart
   CHART_PROP_EVENT_MOUSE_MOVE,                       // Send messages about mouse button click and movement events (CHARTEVENT_MOUSE_MOVE) to all MQL5 programs on a chart
   CHART_PROP_EVENT_OBJECT_CREATE,                    // Send messages about the graphical object creation event (CHARTEVENT_OBJECT_CREATE) to all MQL5 programs on a chart
   CHART_PROP_EVENT_OBJECT_DELETE,                    // Send messages about the graphical object destruction event (CHARTEVENT_OBJECT_DELETE) to all MQL5 programs on a chart
   CHART_PROP_MODE,                                   // Type of the chart (candlesticks, bars or line (ENUM_CHART_MODE))
   CHART_PROP_FOREGROUND,                             // Price chart in the foreground
   CHART_PROP_SHIFT,                                  // Mode of shift of the price chart from the right border
   CHART_PROP_AUTOSCROLL,                             // The mode of automatic shift to the right border of the chart
   CHART_PROP_KEYBOARD_CONTROL,                       // Allow managing the chart using a keyboard
   CHART_PROP_QUICK_NAVIGATION,                       // Allow the chart to intercept Space and Enter key strokes to activate the quick navigation bar
   CHART_PROP_SCALE,                                  // Scale
   CHART_PROP_SCALEFIX,                               // Fixed scale mode
   CHART_PROP_SCALEFIX_11,                            // 1:1 scale mode
   CHART_PROP_SCALE_PT_PER_BAR,                       // The mode of specifying the scale in points per bar
   CHART_PROP_SHOW_TICKER,                            // Display a symbol ticker in the upper left corner
   CHART_PROP_SHOW_OHLC,                              // Display OHLC values in the upper left corner
   CHART_PROP_SHOW_BID_LINE,                          // Display Bid value as a horizontal line on the chart
   CHART_PROP_SHOW_ASK_LINE,                          // Display Ask value as a horizontal line on a chart
   CHART_PROP_SHOW_LAST_LINE,                         // Display Last value as a horizontal line on a chart
   CHART_PROP_SHOW_PERIOD_SEP,                        // Display vertical separators between adjacent periods
   CHART_PROP_SHOW_GRID,                              // Display a grid on the chart
   CHART_PROP_SHOW_VOLUMES,                           // Display volumes on a chart
   CHART_PROP_SHOW_OBJECT_DESCR,                      // Display text descriptions of objects
   CHART_PROP_VISIBLE_BARS,                           // Number of bars on a chart that are available for display
   CHART_PROP_WINDOWS_TOTAL,                          // The total number of chart windows including indicator subwindows
   CHART_PROP_WINDOW_HANDLE,                          // Chart window handle
   CHART_PROP_FIRST_VISIBLE_BAR,                      // Number of the first visible bar on the chart
   CHART_PROP_WIDTH_IN_BARS,                          // Width of the chart in bars
   CHART_PROP_WIDTH_IN_PIXELS,                        // Width of the chart in pixels
   CHART_PROP_COLOR_BACKGROUND,                       // Color of background of the chart
   CHART_PROP_COLOR_FOREGROUND,                       // Color of axes, scale and OHLC line
   CHART_PROP_COLOR_GRID,                             // Grid color
   CHART_PROP_COLOR_VOLUME,                           // Color of volumes and position opening levels
   CHART_PROP_COLOR_CHART_UP,                         // Color for the up bar, shadows and body borders of bull candlesticks
   CHART_PROP_COLOR_CHART_DOWN,                       // Color of down bar, its shadow and border of body of the bullish candlestick
   CHART_PROP_COLOR_CHART_LINE,                       // Color of the chart line and the Doji candlesticks
   CHART_PROP_COLOR_CANDLE_BULL,                      // Color of body of a bullish candlestick
   CHART_PROP_COLOR_CANDLE_BEAR,                      // Color of body of a bearish candlestick
   CHART_PROP_COLOR_BID,                              // Color of the Bid price line
   CHART_PROP_COLOR_ASK,                              // Color of the Ask price line
   CHART_PROP_COLOR_LAST,                             // Color of the last performed deal's price line (Last)
   CHART_PROP_COLOR_STOP_LEVEL,                       // Color of stop order levels (Stop Loss and Take Profit)
   CHART_PROP_SHOW_TRADE_LEVELS,                      // Display trade levels on the chart (levels of open positions, Stop Loss, Take Profit and pending orders)
   CHART_PROP_DRAG_TRADE_LEVELS,                      // Enable the ability to drag trading levels on a chart using mouse
   CHART_PROP_SHOW_DATE_SCALE,                        // Display the time scale on a chart
   CHART_PROP_SHOW_PRICE_SCALE,                       // Display a price scale on a chart
   CHART_PROP_SHOW_ONE_CLICK,                         // Display the quick trading panel on the chart
   CHART_PROP_IS_MAXIMIZED,                           // Chart window maximized
   CHART_PROP_IS_MINIMIZED,                           // Chart window minimized
   CHART_PROP_IS_DOCKED,                              // Chart window docked
   CHART_PROP_FLOAT_LEFT,                             // Left coordinate of the undocked chart window relative to the virtual screen
   CHART_PROP_FLOAT_TOP,                              // Upper coordinate of the undocked chart window relative to the virtual screen
   CHART_PROP_FLOAT_RIGHT,                            // Right coordinate of the undocked chart window relative to the virtual screen
   CHART_PROP_FLOAT_BOTTOM,                           // Bottom coordinate of the undocked chart window relative to the virtual screen
   CHART_PROP_YDISTANCE,                              // Distance in Y axis pixels between the upper frame of the indicator subwindow and the upper frame of the chart main window
   CHART_PROP_HEIGHT_IN_PIXELS,                       // Height of the chart in pixels
   CHART_PROP_WINDOW_IND_HANDLE,                      // Indicator handle on the chart
   CHART_PROP_WINDOW_IND_INDEX,                       // Indicator index on the chart
  };
#define CHART_PROP_INTEGER_TOTAL (66)                 // Total number of integer properties
#define CHART_PROP_INTEGER_SKIP  (2)                  // Number of integer properties not used in sorting
//+------------------------------------------------------------------+
图表整数型属性的数量减少了 1 个 — 设置 66 替换 67,并指定最后两个属性不应参与搜索和排序,故此,它们不会显示在图表属性当中。 这些常量对于图表窗口中的指标对象类是必需的(它也有简化版本)。
图表属性枚举中实现的变更与图表对象排序标准的枚举变更相对应:
//+------------------------------------------------------------------+
//| Possible chart sorting criteria                                  |
//+------------------------------------------------------------------+
#define FIRST_CHART_DBL_PROP  (CHART_PROP_INTEGER_TOTAL-CHART_PROP_INTEGER_SKIP)
#define FIRST_CHART_STR_PROP  (CHART_PROP_INTEGER_TOTAL-CHART_PROP_INTEGER_SKIP+CHART_PROP_DOUBLE_TOTAL-CHART_PROP_DOUBLE_SKIP)
enum ENUM_SORT_CHART_MODE
  {
//--- Sort by integer properties
   SORT_BY_CHART_ID = 0,                              // Sort by chart ID
   SORT_BY_CHART_TIMEFRAME,                           // Sort by chart timeframe
   SORT_BY_CHART_SHOW,                                // Sort by the price chart drawing attribute
   SORT_BY_CHART_IS_OBJECT,                           // Sort by chart object (OBJ_CHART) identification attribute
   SORT_BY_CHART_BRING_TO_TOP,                        // Sort by the flag of displaying a chart above all others
   SORT_BY_CHART_CONTEXT_MENU,                        // Sort by the flag of enabling/disabling access to the context menu using the right click
   SORT_BY_CHART_CROSSHAIR_TOO,                       // Sort by the flag of enabling/disabling access to the Crosshair tool using the middle click
   SORT_BY_CHART_MOUSE_SCROLL,                        // Sort by the flag of scrolling the chart horizontally using the left mouse button
   SORT_BY_CHART_EVENT_MOUSE_WHEEL,                   // Sort by the flag of sending messages about mouse wheel events to all MQL5 programs on a chart
   SORT_BY_CHART_EVENT_MOUSE_MOVE,                    // Sort by the flag of sending messages about mouse button click and movement events to all MQL5 programs on a chart
   SORT_BY_CHART_EVENT_OBJECT_CREATE,                 // Sort by the flag of sending messages about the graphical object creation event to all MQL5 programs on a chart
   SORT_BY_CHART_EVENT_OBJECT_DELETE,                 // Sort by the flag of sending messages about the graphical object destruction event to all MQL5 programs on a chart
   SORT_BY_CHART_MODE,                                // Sort by chart type
   SORT_BY_CHART_FOREGROUND,                          // Sort by the "Price chart in the foreground" flag
   SORT_BY_CHART_SHIFT,                               // Sort by the "Mode of shift of the price chart from the right border" flag
   SORT_BY_CHART_AUTOSCROLL,                          // Sort by the "The mode of automatic shift to the right border of the chart" flag
   SORT_BY_CHART_KEYBOARD_CONTROL,                    // Sort by the flag allowing the chart management using a keyboard
   SORT_BY_CHART_QUICK_NAVIGATION,                    // Sort by the flag allowing the chart to intercept Space and Enter key strokes to activate the quick navigation bar
   SORT_BY_CHART_SCALE,                               // Sort by scale
   SORT_BY_CHART_SCALEFIX,                            // Sort by the fixed scale flag
   SORT_BY_CHART_SCALEFIX_11,                         // Sort by the 1:1 scale flag
   SORT_BY_CHART_SCALE_PT_PER_BAR,                    // Sort by the flag of specifying the scale in points per bar
   SORT_BY_CHART_SHOW_TICKER,                         // Sort by the flag displaying a symbol ticker in the upper left corner
   SORT_BY_CHART_SHOW_OHLC,                           // Sort by the flag displaying OHLC values in the upper left corner
   SORT_BY_CHART_SHOW_BID_LINE,                       // Sort by the flag displaying Bid value as a horizontal line on the chart
   SORT_BY_CHART_SHOW_ASK_LINE,                       // Sort by the flag displaying Ask value as a horizontal line on the chart
   SORT_BY_CHART_SHOW_LAST_LINE,                      // Sort by the flag displaying Last value as a horizontal line on the chart
   SORT_BY_CHART_SHOW_PERIOD_SEP,                     // Sort by the flag displaying vertical separators between adjacent periods
   SORT_BY_CHART_SHOW_GRID,                           // Sort by the flag of displaying a grid on the chart
   SORT_BY_CHART_SHOW_VOLUMES,                        // Sort by the mode of displaying volumes on a chart
   SORT_BY_CHART_SHOW_OBJECT_DESCR,                   // Sort by the flag of displaying object text descriptions
   SORT_BY_CHART_VISIBLE_BARS,                        // Sort by the number of bars on a chart that are available for display
   SORT_BY_CHART_WINDOWS_TOTAL,                       // Sort by the total number of chart windows including indicator subwindows
   SORT_BY_CHART_WINDOW_HANDLE,                       // Sort by the chart handle
   SORT_BY_CHART_FIRST_VISIBLE_BAR,                   // Sort by the number of the first visible bar on the chart
   SORT_BY_CHART_WIDTH_IN_BARS,                       // Sort by the width of the chart in bars
   SORT_BY_CHART_WIDTH_IN_PIXELS,                     // Sort by the width of the chart in pixels
   SORT_BY_CHART_COLOR_BACKGROUND,                    // Sort by the color of the chart background
   SORT_BY_CHART_COLOR_FOREGROUND,                    // Sort by color of axes, scale and OHLC line
   SORT_BY_CHART_COLOR_GRID,                          // Sort by grid color
   SORT_BY_CHART_COLOR_VOLUME,                        // Sort by the color of volumes and position opening levels
   SORT_BY_CHART_COLOR_CHART_UP,                      // Sort by the color for the up bar, shadows and body borders of bull candlesticks
   SORT_BY_CHART_COLOR_CHART_DOWN,                    // Sort by the color of down bar, its shadow and border of body of the bullish candlestick
   SORT_BY_CHART_COLOR_CHART_LINE,                    // Sort by the color of the chart line and the Doji candlesticks
   SORT_BY_CHART_COLOR_CANDLE_BULL,                   // Sort by the color of a bullish candlestick body
   SORT_BY_CHART_COLOR_CANDLE_BEAR,                   // Sort by the color of a bearish candlestick body
   SORT_BY_CHART_COLOR_BID,                           // Sort by the color of the Bid price line
   SORT_BY_CHART_COLOR_ASK,                           // Sort by the color of the Ask price line
   SORT_BY_CHART_COLOR_LAST,                          // Sort by the color of the last performed deal's price line (Last)
   SORT_BY_CHART_COLOR_STOP_LEVEL,                    // Sort by the color of stop order levels (Stop Loss and Take Profit)
   SORT_BY_CHART_SHOW_TRADE_LEVELS,                   // Sort by the flag of displaying trading levels on the chart
   SORT_BY_CHART_DRAG_TRADE_LEVELS,                   // Sort by the flag enabling the ability to drag trading levels on a chart using mouse
   SORT_BY_CHART_SHOW_DATE_SCALE,                     // Sort by the flag of displaying the time scale on the chart
   SORT_BY_CHART_SHOW_PRICE_SCALE,                    // Sort by the flag of displaying the price scale on the chart
   SORT_BY_CHART_SHOW_ONE_CLICK,                      // Sort by the flag of displaying the quick trading panel on the chart
   SORT_BY_CHART_IS_MAXIMIZED,                        // Sort by the "Chart window maximized" flag
   SORT_BY_CHART_IS_MINIMIZED,                        // Sort by the "Chart window minimized" flag
   SORT_BY_CHART_IS_DOCKED,                           // Sort by the "Chart window docked" flag
   SORT_BY_CHART_FLOAT_LEFT,                          // Sort by the left coordinate of the undocked chart window relative to the virtual screen
   SORT_BY_CHART_FLOAT_TOP,                           // Sort by the upper coordinate of the undocked chart window relative to the virtual screen
   SORT_BY_CHART_FLOAT_RIGHT,                         // Sort by the right coordinate of the undocked chart window relative to the virtual screen
   SORT_BY_CHART_FLOAT_BOTTOM,                        // Sort by the bottom coordinate of the undocked chart window relative to the virtual screen
   SORT_BY_CHART_YDISTANCE,                           // Sort by the distance in Y axis pixels between the upper frame of the indicator subwindow and the upper frame of the chart main window
   SORT_BY_CHART_HEIGHT_IN_PIXELS,                    // Sort by the height of the chart in pixels
//--- Sort by real properties
   SORT_BY_CHART_SHIFT_SIZE = FIRST_CHART_DBL_PROP,   // Sort by the shift size of the zero bar from the right border in %
   SORT_BY_CHART_FIXED_POSITION,                      // Sort by the chart fixed position from the left border in %
   SORT_BY_CHART_FIXED_MAX,                           // Sort by the fixed chart maximum
   SORT_BY_CHART_FIXED_MIN,                           // Sort by the fixed chart minimum
   SORT_BY_CHART_POINTS_PER_BAR,                      // Sort by the scale value in points per bar
   SORT_BY_CHART_PRICE_MIN,                           // Sort by the chart minimum
   SORT_BY_CHART_PRICE_MAX,                           // Sort by the chart maximum
//--- Sort by string properties
   SORT_BY_CHART_COMMENT = FIRST_CHART_STR_PROP,      // Sort by a comment text on the chart
   SORT_BY_CHART_EXPERT_NAME,                         // Sort by a name of an EA launched on the chart
   SORT_BY_CHART_SCRIPT_NAME,                         // Sort by a name of a script launched on the chart
   SORT_BY_CHART_INDICATOR_NAME,                      // Sort by a name of an indicator launched in the chart window
   SORT_BY_CHART_SYMBOL,                              // Sort by chart symbol
  };
//+------------------------------------------------------------------+
如果我们仔细查看按整数型属性排序的标准,我们会发现少了最后两个属性,因为它们在排序中无法使用,因此不应设置在此处 — 每个排序标准都严格对应于某个对象属性的枚举常量数值。
由于图表对象现在基本完善,因此应为其设置整数型、实数型和字符串型属性的枚举:
//+------------------------------------------------------------------+
//| Data for handling chart windows                                  |
//+------------------------------------------------------------------+
//+------------------------------------------------------------------+
//| Chart window integer properties                                  |
//+------------------------------------------------------------------+
enum ENUM_CHART_WINDOW_PROP_INTEGER
  {
   CHART_WINDOW_PROP_ID = 0,                          // Chart ID
   CHART_WINDOW_PROP_WINDOW_NUM,                      // Chart window index
   CHART_WINDOW_PROP_YDISTANCE,                       // Distance in Y axis pixels between the upper frame of the indicator subwindow and the upper frame of the chart main window
   CHART_WINDOW_PROP_HEIGHT_IN_PIXELS,                // Height of the chart in pixels
   //--- for CWndInd
   CHART_WINDOW_PROP_WINDOW_IND_HANDLE,               // Indicator handle in the chart window
   CHART_WINDOW_PROP_WINDOW_IND_INDEX,                // Indicator index in the chart window
  };
#define CHART_WINDOW_PROP_INTEGER_TOTAL (6)           // Total number of integer properties
#define CHART_WINDOW_PROP_INTEGER_SKIP  (0)           // Number of integer DOM properties not used in sorting
//+------------------------------------------------------------------+
//| Chart window real properties                                     |
//+------------------------------------------------------------------+
enum ENUM_CHART_WINDOW_PROP_DOUBLE
  {
   CHART_WINDOW_PROP_PRICE_MIN = CHART_WINDOW_PROP_INTEGER_TOTAL, // Chart minimum
   CHART_WINDOW_PROP_PRICE_MAX,                       // Chart maximum
  };
#define CHART_WINDOW_PROP_DOUBLE_TOTAL  (2)           // Total number of real properties
#define CHART_WINDOW_PROP_DOUBLE_SKIP   (0)           // Number of real properties not used in sorting
//+------------------------------------------------------------------+
//| Chart window string properties                                   |
//+------------------------------------------------------------------+
enum ENUM_CHART_WINDOW_PROP_STRING
  {
   CHART_WINDOW_PROP_IND_NAME = (CHART_WINDOW_PROP_INTEGER_TOTAL+CHART_WINDOW_PROP_DOUBLE_TOTAL), // Name of the indicator launched in the window
   CHART_WINDOW_PROP_SYMBOL,                          // Chart symbol
  };
#define CHART_WINDOW_PROP_STRING_TOTAL  (2)           // Total number of string properties
//+------------------------------------------------------------------+
最后,我们需要针对图表窗口对象进行排序的可能条件添加枚举:
//+------------------------------------------------------------------+
//| Possible criteria of sorting chart windows                       |
//+------------------------------------------------------------------+
#define FIRST_CHART_WINDOW_DBL_PROP  (CHART_WINDOW_PROP_INTEGER_TOTAL-CHART_WINDOW_PROP_INTEGER_SKIP)
#define FIRST_CHART_WINDOW_STR_PROP  (CHART_WINDOW_PROP_INTEGER_TOTAL-CHART_WINDOW_PROP_INTEGER_SKIP+CHART_WINDOW_PROP_DOUBLE_TOTAL-CHART_WINDOW_PROP_DOUBLE_SKIP)
enum ENUM_SORT_CHART_WINDOW_MODE
  {
//--- Sort by integer properties
   SORT_BY_CHART_WINDOW_ID = 0,                       // Sort by chart ID
   SORT_BY_CHART_WINDOW_NUM,                          // Sort by chart window index
   SORT_BY_CHART_WINDOW_YDISTANCE,                    // Sort by the distance in Y axis pixels between the upper frame of the indicator subwindow and the upper frame of the chart main window
   SORT_BY_CHART_WINDOW_HEIGHT_IN_PIXELS,             // Sort by the height of the chart in pixels
   SORT_BY_CHART_WINDOW_IND_HANDLE,                   // Sort by the indicator handle in the chart window
   SORT_BY_CHART_WINDOW_IND_INDEX,                    // Sort by the indicator index in the chart window
//--- Sort by real properties
   SORT_BY_CHART_WINDOW_PRICE_MIN = FIRST_CHART_WINDOW_DBL_PROP,  // Sort by chart window minimum
   SORT_BY_CHART_WINDOW_PRICE_MAX,                    // Sort by chart window maximum
//--- Sort by string properties
   SORT_BY_CHART_WINDOW_IND_NAME = FIRST_CHART_WINDOW_STR_PROP,   // Sort by name of an indicator launched in the window
   SORT_BY_CHART_WINDOW_SYMBOL,                       // Sort by chart symbol
  };
//+------------------------------------------------------------------+
现在我们回到图表窗口对象列表 ID。 您也许还记得,我们需要改进 CBaseObjExt 基准扩展对象,其类已设置在 \MQL5\Include\DoEasy\Objects\BaseObj.mqh 基准对象类文件之中。
我们需要为它做的全部就是在 EventDescription() 方法中添加两个新列表的处理逻辑。 该对象应作为类(图表对象和图表窗口对象)的衍生后代属于这些列表:
//+------------------------------------------------------------------+
//| Return an object event description                               |
//+------------------------------------------------------------------+
string CBaseObjExt::EventDescription(const int property,
                                  const ENUM_BASE_EVENT_REASON reason,
                                  const int source,
                                  const string value,
                                  const string property_descr,
                                  const int digits)
  {
//--- Depending on the collection ID, create th object type description
   string type=
     (
      this.Type()==COLLECTION_SYMBOLS_ID     ? CMessage::Text(MSG_LIB_TEXT_SYMBOL)     :
      this.Type()==COLLECTION_ACCOUNT_ID     ?  CMessage::Text(MSG_LIB_TEXT_ACCOUNT)   :
      this.Type()==COLLECTION_CHARTS_ID      ?  CMessage::Text(MSG_LIB_TEXT_CHART)     :
      this.Type()==COLLECTION_CHART_WND_ID   ?  CMessage::Text(MSG_LIB_TEXT_CHART_WND) :
      ""
     );
//--- Depending on the property type, create the property change value description
   string level=
     (
      property<this.m_long_prop_total ?
      ::DoubleToString(this.GetControlledLongValueLEVEL(property),digits) :
      ::DoubleToString(this.GetControlledDoubleValueLEVEL(property),digits)
     );
//--- Depending on the event reason, create the event description text
   string res=
     (
      reason==BASE_EVENT_REASON_INC       ?  CMessage::Text(MSG_LIB_TEXT_PROP_VALUE)+type+property_descr+CMessage::Text(MSG_LIB_TEXT_INC_BY)+value    :
      reason==BASE_EVENT_REASON_DEC       ?  CMessage::Text(MSG_LIB_TEXT_PROP_VALUE)+type+property_descr+CMessage::Text(MSG_LIB_TEXT_DEC_BY)+value    :
      reason==BASE_EVENT_REASON_MORE_THEN ?  CMessage::Text(MSG_LIB_TEXT_PROP_VALUE)+type+property_descr+CMessage::Text(MSG_LIB_TEXT_MORE_THEN)+level :
      reason==BASE_EVENT_REASON_LESS_THEN ?  CMessage::Text(MSG_LIB_TEXT_PROP_VALUE)+type+property_descr+CMessage::Text(MSG_LIB_TEXT_LESS_THEN)+level :
      reason==BASE_EVENT_REASON_EQUALS    ?  CMessage::Text(MSG_LIB_TEXT_PROP_VALUE)+type+property_descr+CMessage::Text(MSG_LIB_TEXT_EQUAL)+level     :
      CMessage::Text(MSG_LIB_TEXT_BASE_OBJ_UNKNOWN_EVENT)+type
     );
//--- Return the object name+created event description text
   return this.m_name+": "+res;
  }
//+------------------------------------------------------------------+
在文章第三十七部分中能查找到有关该类的更多信息。
我现在将修复一个在开发过程中未曾留意的瑕疵 — 我将改进图表窗口对象类,令其成为一个完善的类,如同主库对象类。 我需要添加存储对象属性的数组、设置和返回其属性的方法(现成的方法将重做)、以及显示对象属性数据的方法。
打开 \MQL5\Include\DoEasy\Objects\Chart\ChartWnd.mqh 文件,并进行必要的更正。 该文件还含有窗口中指标对象的辅助类。 由于我修改了这些对象的一些属性,因此将新枚举的常量添加到 CWndInd 类的 Compare() 方法之中:
//+------------------------------------------------------------------+
//| Compare CWndInd objects with each other by the specified property|
//+------------------------------------------------------------------+
int CWndInd::Compare(const CObject *node,const int mode=0) const
  {
   const CWndInd *obj_compared=node;
   if(mode==CHART_WINDOW_PROP_WINDOW_IND_HANDLE) return(this.Handle()>obj_compared.Handle() ? 1 : this.Handle()<obj_compared.Handle() ? -1 : 0);
   else if(mode==CHART_WINDOW_PROP_WINDOW_IND_INDEX) return(this.Index()>obj_compared.Index() ? 1 : this.Index()<obj_compared.Index() ? -1 : 0);
   return(this.Name()==obj_compared.Name() ? 0 : this.Name()<obj_compared.Name() ? -1 : 1);
  }
//+------------------------------------------------------------------+
以前,这些是从 CHART_PROP_WINDOW_IND_HANDLE 和 CHART_PROP_WINDOW_IND_INDEX 枚举中已删除的常量。
在类的私密部分,添加 m_digits 变量,存储图表品种的 Digits(),和存储整数型、实数型和字符串型属性的数组,以及返回实数型和字符串型属性位于相应数组实际索引的方法:
//+------------------------------------------------------------------+
//| Chart window object class                                        |
//+------------------------------------------------------------------+
class CChartWnd : public CBaseObjExt
  {
private:
   CArrayObj         m_list_ind;                                        // Indicator list
   CArrayObj        *m_list_ind_del;                                    // Pointer to the list of indicators removed from the indicator window
   CArrayObj        *m_list_ind_param;                                  // Pointer to the list of changed indicators
   long              m_long_prop[CHART_WINDOW_PROP_INTEGER_TOTAL];      // Integer properties
   double            m_double_prop[CHART_WINDOW_PROP_DOUBLE_TOTAL];     // Real properties
   string            m_string_prop[CHART_WINDOW_PROP_STRING_TOTAL];     // String properties
   int               m_digits;                                          // Symbol's Digits()
   int               m_wnd_coord_x;                                     // The X coordinate for the time on the chart in the window
   int               m_wnd_coord_y;                                     // The Y coordinate for the price on the chart in the window
//--- Return the index of the array the (1) double and (2) string properties are actually located at
   int               IndexProp(ENUM_CHART_WINDOW_PROP_DOUBLE property)  const { return(int)property-CHART_WINDOW_PROP_INTEGER_TOTAL;                                 }
   int               IndexProp(ENUM_CHART_WINDOW_PROP_STRING property)  const { return(int)property-CHART_WINDOW_PROP_INTEGER_TOTAL-CHART_WINDOW_PROP_DOUBLE_TOTAL;  }
在类的公开部分,编写设置和返回指定对象属性的方法:
public:
//--- Set object's (1) integer, (2) real and (3) string properties
   void              SetProperty(ENUM_CHART_WINDOW_PROP_INTEGER property,long value)   { this.m_long_prop[property]=value;                      }
   void              SetProperty(ENUM_CHART_WINDOW_PROP_DOUBLE property,double value)  { this.m_double_prop[this.IndexProp(property)]=value;    }
   void              SetProperty(ENUM_CHART_WINDOW_PROP_STRING property,string value)  { this.m_string_prop[this.IndexProp(property)]=value;    }
//--- Return object’s (1) integer, (2) real and (3) string property from the properties array
   long              GetProperty(ENUM_CHART_WINDOW_PROP_INTEGER property)        const { return this.m_long_prop[property];                     }
   double            GetProperty(ENUM_CHART_WINDOW_PROP_DOUBLE property)         const { return this.m_double_prop[this.IndexProp(property)];   }
   string            GetProperty(ENUM_CHART_WINDOW_PROP_STRING property)         const { return this.m_string_prop[this.IndexProp(property)];   }
//--- Return itself
   CChartWnd        *GetObject(void)                                                   { return &this;   }
所有返回对象支持指定整数型、实数型或字符串型属性标志的方法都返回 true — 支持每个属性,而返回对象属性描述的方法只在此处声明,而它们的实现位于类主体之外 (目前,返回实数型属性描述的方法返回“属性不支持的消息” — 它的实现将移到类主体之外,因为另外两个已经编写好了):
//--- Return itself
   CChartWnd        *GetObject(void)                                                   { return &this;   }

//--- Return the flag of the object supporting this property
   virtual bool      SupportProperty(ENUM_CHART_WINDOW_PROP_INTEGER property)          { return true;    }
   virtual bool      SupportProperty(ENUM_CHART_WINDOW_PROP_DOUBLE property)           { return true;    }
   virtual bool      SupportProperty(ENUM_CHART_WINDOW_PROP_STRING property)           { return true;    }

//--- Get description of (1) integer, (2) real and (3) string properties
   string            GetPropertyDescription(ENUM_CHART_WINDOW_PROP_INTEGER property);
   string            GetPropertyDescription(ENUM_CHART_WINDOW_PROP_DOUBLE property);
   string            GetPropertyDescription(ENUM_CHART_WINDOW_PROP_STRING property);
将所有 "this.m_window_num" 字符串实例替换为 "this.WindowNum()"(当然没有引号),因为我已经删除了 m_window_num 变量,且窗口索引现在位于对象属性之中,我们将利用 WindowNum() 方法返回属性值。
WindowNum() 方法以前返回 m_window_num 变量值:
int WindowNum(void) const { return this.m_window_num; }
现在该方法将返回对象属性:
int WindowNum(void) const { return (int)this.GetProperty(CHART_WINDOW_PROP_WINDOW_NUM); }
添加两个返回实数型属性的方法,并修复已经存在的返回和设置相应对象属性而非变量的方法:
//--- Return (1) the subwindow index, (2) the number of indicators attached to the window, (3) the name of a symbol chart, as well as (4) the highest and (5) lowest prices
   int               WindowNum(void)                              const { return (int)this.GetProperty(CHART_WINDOW_PROP_WINDOW_NUM);     }
   int               IndicatorsTotal(void)                        const { return this.m_list_ind.Total();                                 }
   string            Symbol(void)                                 const { return this.GetProperty(CHART_WINDOW_PROP_SYMBOL);              }
   double            PriceMax(void)                               const { return this.GetProperty(CHART_WINDOW_PROP_PRICE_MAX);           }
   double            PriceMin(void)                               const { return this.GetProperty(CHART_WINDOW_PROP_PRICE_MIN);           }
//--- Set (1) the subwindow index and (2) the chart symbol
   void              SetWindowNum(const int num)                        { this.SetProperty(CHART_WINDOW_PROP_WINDOW_NUM,num);             }
   void              SetSymbol(const string symbol)                     { this.SetProperty(CHART_WINDOW_PROP_SYMBOL,symbol);              }
为了实现由 CBaseObjExt 类(它是已编辑类的父类)提供对象属性的自动更新,我需要在其 Refresh() 方法中进行一些修正。 为了编排事件功能,最好添加设置跟踪对象属性值和受控属性值的方法,从而可按照我们所管理的对象属性值来搜索指定跟踪值的交汇时刻。
可以不实现这些方法,因为 CBaseObjExt 类已提供了设置参考值和跟踪属性的能力。 然而,由于这个类非常综合,它的方法亦非常抽象,故我们需要记住管控属性所需的常量名称。 这很不方便。 因此,基于 CBaseObjExt 扩展对象类的类接收明确指示为对象设置的方法。
因此,在类主体清单的末尾,编写两个代码块,用于设置窗口框之间的距离(以像素为单位),和图表窗口高度(以像素为单位)的跟踪属性:
//+------------------------------------------------------------------+
//| Get and set the parameters of tracked property changes           |
//+------------------------------------------------------------------+
//--- Distance in Y axis pixels between the upper frame of the indicator subwindow and the upper frame of the chart main window
//--- set the controlled (1) growth, (2) decrease, (3) reference distance level in pixels by the vertical Y axis between the window frames
//--- get (4) the distance change in pixels by the vertical Y axis between the window frames,
//--- get the distance change flag in pixels by the vertical Y axis between the window frames exceeding the (5) growth and (6) decrease values
   void              SetControlWindowYDistanceInc(const long value)        { this.SetControlledValueINC(CHART_WINDOW_PROP_YDISTANCE,(long)::fabs(value));         }
   void              SetControlWindowYDistanceDec(const long value)        { this.SetControlledValueDEC(CHART_WINDOW_PROP_YDISTANCE,(long)::fabs(value));         }
   void              SetControlWindowYDistanceLevel(const long value)      { this.SetControlledValueLEVEL(CHART_WINDOW_PROP_YDISTANCE,(long)::fabs(value));       }
   long              GetValueChangedWindowYDistance(void)            const { return this.GetPropLongChangedValue(CHART_WINDOW_PROP_YDISTANCE);                    }
   bool              IsIncreasedWindowYDistance(void)                const { return (bool)this.GetPropLongFlagINC(CHART_WINDOW_PROP_YDISTANCE);                   }
   bool              IsDecreasedWindowYDistance(void)                const { return (bool)this.GetPropLongFlagDEC(CHART_WINDOW_PROP_YDISTANCE);                   }

//--- Height of the chart in pixels
//--- setting the controlled spread (1) increase, (2) decrease value and (3) reference chart height in pixels
//--- get (4) the chart height change in pixels,
//--- get the flag of the chart height change in pixels exceeding (5) the growth and (6) decrease values
   void              SetControlHeightInPixelsInc(const long value)         { this.SetControlledValueINC(CHART_WINDOW_PROP_HEIGHT_IN_PIXELS,(long)::fabs(value));   }
   void              SetControlHeightInPixelsDec(const long value)         { this.SetControlledValueDEC(CHART_WINDOW_PROP_HEIGHT_IN_PIXELS,(long)::fabs(value));   }
   void              SetControlHeightInPixelsLevel(const long value)       { this.SetControlledValueLEVEL(CHART_WINDOW_PROP_HEIGHT_IN_PIXELS,(long)::fabs(value)); }
   long              GetValueChangedHeightInPixels(void)             const { return this.GetPropLongChangedValue(CHART_WINDOW_PROP_HEIGHT_IN_PIXELS);              }
   bool              IsIncreasedHeightInPixels(void)                 const { return (bool)this.GetPropLongFlagINC(CHART_WINDOW_PROP_HEIGHT_IN_PIXELS);             }
   bool              IsDecreasedHeightInPixels(void)                 const { return (bool)this.GetPropLongFlagDEC(CHART_WINDOW_PROP_HEIGHT_IN_PIXELS);             }

  };
//+------------------------------------------------------------------+
现在我们能够为这些属性设置必要的跟踪值,函数库会自动跟踪它们,并将这些属性产生的事件发送到我们处理它们的控制程序图表。 在创建所有函数库对象的基准扩展对象时,所有这些都曾详细研究过。
类的参数型构造函数已有所变化:
//+------------------------------------------------------------------+
//| Parametric constructor                                           |
//+------------------------------------------------------------------+
CChartWnd::CChartWnd(const long chart_id,const int wnd_num,const string symbol,CArrayObj *list_ind_del,CArrayObj *list_ind_param) : m_wnd_coord_x(0),m_wnd_coord_y(0)
  {
   this.m_digits=(int)::SymbolInfoInteger(symbol,SYMBOL_DIGITS);
   this.m_list_ind_del=list_ind_del;
   this.m_list_ind_param=list_ind_param;
   CBaseObj::SetChartID(chart_id);
   this.m_type=COLLECTION_CHART_WND_ID;

//--- Initialize base object data arrays
   this.SetControlDataArraySizeLong(CHART_WINDOW_PROP_INTEGER_TOTAL);
   this.SetControlDataArraySizeDouble(CHART_WINDOW_PROP_DOUBLE_TOTAL);
   this.ResetChangesParams();
   this.ResetControlsParams();

//--- Set object properties
   this.SetProperty(CHART_WINDOW_PROP_WINDOW_NUM,wnd_num);
   this.SetProperty(CHART_WINDOW_PROP_SYMBOL,symbol);
   this.SetProperty(CHART_WINDOW_PROP_ID,chart_id);
   this.SetProperty(CHART_WINDOW_PROP_YDISTANCE,::ChartGetInteger(chart_id,CHART_WINDOW_YDISTANCE,wnd_num));
   this.SetProperty(CHART_WINDOW_PROP_HEIGHT_IN_PIXELS,::ChartGetInteger(chart_id,CHART_HEIGHT_IN_PIXELS,wnd_num));
   this.SetProperty(CHART_WINDOW_PROP_PRICE_MIN,::ChartGetDouble(chart_id,CHART_PRICE_MIN,wnd_num));
   this.SetProperty(CHART_WINDOW_PROP_PRICE_MAX,::ChartGetDouble(chart_id,CHART_PRICE_MAX,wnd_num));
   this.m_name=this.Header();

//--- Fill in the symbol current data
   for(int i=0;i<CHART_WINDOW_PROP_INTEGER_TOTAL;i++)
      this.m_long_prop_event[i][3]=this.m_long_prop[i];
   for(int i=0;i<CHART_WINDOW_PROP_DOUBLE_TOTAL;i++)
      this.m_double_prop_event[i][3]=this.m_double_prop[i];
//--- Update the base object data and search for changes
   CBaseObjExt::Refresh();

//--- Create the indicator list
   this.IndicatorsListCreate();
  }
//+------------------------------------------------------------------+
此处我们获取图表品种的 Digits()(用于显示小数位),并将对象类型设置为等于图表窗口对象列表 ID。
在初始化基准对象数据数组的模块中,为基准对象数组设置当前对象数组的大小(存储上次检查时的对象数据),并将所有值重置为零。
在设置对象属性的模块中,将所有必要的图表数据写入对象参数。
在填充当前品种数据的模块中,将对象属性中设置的所有数据写入基准对象数组。
在更新基准对象数据和搜索变化的模块中,将当前对象数据填充到基准对象数组之中,并与之前的状态进行比较。 如果设置了属性跟踪标志,则检查这是否为可管理状况。 如果检查为肯定,则创建一个基准事件,并将其放置到基准对象事件列表中。
在比较两个图表窗口对象的方法中,将所有删除的枚举常量替换为新的:
//+------------------------------------------------------------------+
//| Compare CChartWnd objects with each other by a specified property|
//+------------------------------------------------------------------+
int CChartWnd::Compare(const CObject *node,const int mode=0) const
  {
   const CChartWnd *obj_compared=node;
   if(mode==CHART_WINDOW_PROP_YDISTANCE)
      return(this.YDistance()>obj_compared.YDistance() ? 1 : this.YDistance()<obj_compared.YDistance() ? -1 : 0);
   else if(mode==CHART_WINDOW_PROP_HEIGHT_IN_PIXELS)
      return(this.HeightInPixels()>obj_compared.HeightInPixels() ? 1 : this.HeightInPixels()<obj_compared.HeightInPixels() ? -1 : 0);
   else if(mode==CHART_WINDOW_PROP_WINDOW_NUM)
      return(this.WindowNum()>obj_compared.WindowNum() ? 1 : this.WindowNum()<obj_compared.WindowNum() ? -1 : 0);
   else if(mode==CHART_WINDOW_PROP_SYMBOL)
      return(this.Symbol()==obj_compared.Symbol() ? 0 : this.Symbol()>obj_compared.Symbol() ? 1 : -1);
   return -1;
  }
//+------------------------------------------------------------------+
在返回对象整数型属性描述的方法中,将枚举常量替换为新的枚举常量,并返回新属性的描述:
//+------------------------------------------------------------------+
//| Return description of object's integer property                  |
//+------------------------------------------------------------------+
string CChartWnd::GetPropertyDescription(ENUM_CHART_WINDOW_PROP_INTEGER property)
  {
   return
     (
      property==CHART_WINDOW_PROP_ID  ?  CMessage::Text(MSG_CHART_OBJ_ID)+
         (!this.SupportProperty(property) ?  ": "+CMessage::Text(MSG_LIB_PROP_NOT_SUPPORTED) :
          ": "+(string)CBaseObj::GetChartID()
         )  :
      property==CHART_WINDOW_PROP_WINDOW_NUM  ?  CMessage::Text(MSG_CHART_OBJ_WINDOW_N)+
         (!this.SupportProperty(property) ?  ": "+CMessage::Text(MSG_LIB_PROP_NOT_SUPPORTED) :
          ": "+(string)this.WindowNum()
         )  :
      property==CHART_WINDOW_PROP_YDISTANCE  ?  CMessage::Text(MSG_CHART_OBJ_WINDOW_YDISTANCE)+
         (!this.SupportProperty(property) ?  ": "+CMessage::Text(MSG_LIB_PROP_NOT_SUPPORTED) :
          ": "+(string)this.YDistance()
         )  :
      property==CHART_WINDOW_PROP_HEIGHT_IN_PIXELS  ?  CMessage::Text(MSG_CHART_OBJ_HEIGHT_IN_PIXELS)+
         (!this.SupportProperty(property) ?  ": "+CMessage::Text(MSG_LIB_PROP_NOT_SUPPORTED) :
          ": "+(string)this.HeightInPixels()
         )  :
      ""
     );
  }
//+------------------------------------------------------------------+
实现返回对象实数型属性描述的方法:
//+------------------------------------------------------------------+
//| Return description of object's real property                     |
//+------------------------------------------------------------------+
string CChartWnd::GetPropertyDescription(ENUM_CHART_WINDOW_PROP_DOUBLE property)
  {
   return
     (
      property==CHART_WINDOW_PROP_PRICE_MIN  ?  CMessage::Text(MSG_CHART_OBJ_PRICE_MIN)+
         (!this.SupportProperty(property) ?  ": "+CMessage::Text(MSG_LIB_PROP_NOT_SUPPORTED) :
          ": "+::DoubleToString(this.PriceMin(),this.m_digits)
         )  :
      property==CHART_WINDOW_PROP_PRICE_MAX  ?  CMessage::Text(MSG_CHART_OBJ_PRICE_MAX)+
         (!this.SupportProperty(property) ?  ": "+CMessage::Text(MSG_LIB_PROP_NOT_SUPPORTED) :
          ": "+::DoubleToString(this.PriceMax(),this.m_digits)
         )  :
      ""
     );
  }
//+------------------------------------------------------------------+
在返回对象字符串型属性描述的方法中,将枚举常量替换为新的:
//+------------------------------------------------------------------+
//| Return description of object's string property                   |
//+------------------------------------------------------------------+
string CChartWnd::GetPropertyDescription(ENUM_CHART_WINDOW_PROP_STRING property)
  {
   return
     (
      property==CHART_WINDOW_PROP_SYMBOL  ?  CMessage::Text(MSG_LIB_PROP_SYMBOL)+
         (!this.SupportProperty(property) ?  ": "+CMessage::Text(MSG_LIB_PROP_NOT_SUPPORTED) :
          ": "+this.Symbol()
         )  :
      ""
     );
  }
//+------------------------------------------------------------------+
显示对象属性日志的方法也有枚举常量的变化,而负责显示对象实数型属性的代码块已取消注释(之前,循环内的代码块曾被注释掉,但并未从方法中删除):
//+------------------------------------------------------------------+
//| Display object properties in the journal                         |
//+------------------------------------------------------------------+
void CChartWnd::Print(const bool full_prop=false)
  {
   ::Print("============= ",CMessage::Text(MSG_LIB_PARAMS_LIST_BEG)," (",this.Header(),") =============");
   int beg=0, end=CHART_WINDOW_PROP_INTEGER_TOTAL;
   for(int i=beg; i<end; i++)
     {
      ENUM_CHART_WINDOW_PROP_INTEGER prop=(ENUM_CHART_WINDOW_PROP_INTEGER)i;
      if(prop==CHART_WINDOW_PROP_WINDOW_IND_HANDLE || prop==CHART_WINDOW_PROP_WINDOW_IND_INDEX) continue;
      if(!full_prop && !this.SupportProperty(prop)) continue;
      ::Print(this.GetPropertyDescription(prop));
     }
   ::Print("------");
   beg=end; end+=CHART_WINDOW_PROP_DOUBLE_TOTAL;
   for(int i=beg; i<end; i++)
     {
      ENUM_CHART_WINDOW_PROP_DOUBLE prop=(ENUM_CHART_WINDOW_PROP_DOUBLE)i;
      if(!full_prop && !this.SupportProperty(prop)) continue;
      ::Print(this.GetPropertyDescription(prop));
     }
   beg=end; end+=CHART_WINDOW_PROP_STRING_TOTAL;
   for(int i=beg; i<end; i++)
     {
      ENUM_CHART_WINDOW_PROP_STRING prop=(ENUM_CHART_WINDOW_PROP_STRING)i;
      if(prop==CHART_WINDOW_PROP_IND_NAME)
        {
         this.PrintIndicators();
         continue;
        }
      if(!full_prop && !this.SupportProperty(prop)) continue;
      ::Print(this.GetPropertyDescription(prop));
     }
   ::Print("============= ",CMessage::Text(MSG_LIB_PARAMS_LIST_END)," (",this.Header(),") =============\n");
  }
//+------------------------------------------------------------------+
在日志中显示窗口参数说明的方法中,添加显示新参数 ,并修改为新的常量:
//+------------------------------------------------------------------+
//| Display the description of the window parameters in the journal  |
//+------------------------------------------------------------------+
void CChartWnd::PrintParameters(const bool dash=false)
  {
   string header=
     (
      this.WindowNum()==0 ? CMessage::Text(MSG_CHART_OBJ_CHART_WINDOW) :
      CMessage::Text(MSG_CHART_OBJ_CHART_SUBWINDOW)+" "+(string)this.WindowNum()
     );
   ::Print((dash ? " " : ""),header,":");
   string pref=(dash ? " - " : "");
   if(this.WindowNum()>0)
      ::Print(pref,GetPropertyDescription(CHART_WINDOW_PROP_YDISTANCE));
   ::Print(pref,GetPropertyDescription(CHART_WINDOW_PROP_HEIGHT_IN_PIXELS));
   ::Print(pref,GetPropertyDescription(CHART_WINDOW_PROP_PRICE_MAX));
   ::Print(pref,GetPropertyDescription(CHART_WINDOW_PROP_PRICE_MIN));
  }
//+------------------------------------------------------------------+
改进更新图表窗口数据的方法。 我们需要添加事件数据(变量)的初始化,和处理对象参数变更的代码块,以防没有其他变化(添加到窗口或从窗口中删除指标)。
//+------------------------------------------------------------------+
//| Update data on attached indicators                               |
//+------------------------------------------------------------------+
void CChartWnd::Refresh(void)
  {
   //--- Initialize event data
   this.m_is_event=false;
   this.m_hash_sum=0;
   //--- Calculate the change of the indicator number in the "now and during the previous check" window
   int change=::ChartIndicatorsTotal(this.m_chart_id,this.WindowNum())-this.m_list_ind.Total();
   //--- If there is no change in the number of indicators in the window,
   if(change==0)
     {
      //--- check the change of parameters of all indicators and exit
      this.IndicatorsChangeCheck();
      //--- Update integer properties
      this.SetProperty(CHART_WINDOW_PROP_YDISTANCE,::ChartGetInteger(this.m_chart_id,CHART_WINDOW_YDISTANCE,this.WindowNum()));
      this.SetProperty(CHART_WINDOW_PROP_HEIGHT_IN_PIXELS,::ChartGetInteger(this.m_chart_id,CHART_HEIGHT_IN_PIXELS,this.WindowNum()));
      //--- Update real properties
      this.SetProperty(CHART_WINDOW_PROP_PRICE_MIN,::ChartGetDouble(this.m_chart_id,CHART_PRICE_MIN,this.WindowNum()));
      this.SetProperty(CHART_WINDOW_PROP_PRICE_MAX,::ChartGetDouble(this.m_chart_id,CHART_PRICE_MAX,this.WindowNum()));
      //--- Update string properties
      string symbol=::ChartSymbol(this.m_chart_id);
      if(symbol!=NULL)
         this.SetProperty(CHART_WINDOW_PROP_SYMBOL,symbol);

      //--- Fill in the current symbol data
      for(int i=0;i<CHART_WINDOW_PROP_INTEGER_TOTAL;i++)
         this.m_long_prop_event[i][3]=this.m_long_prop[i];
      for(int i=0;i<CHART_WINDOW_PROP_DOUBLE_TOTAL;i++)
         this.m_double_prop_event[i][3]=this.m_double_prop[i];

      //--- Update the base object data, search for changes and exit
      CBaseObjExt::Refresh();
      this.CheckEvents();
      return;
     }
   //--- If indicators are added
   if(change>0)
     {
      //--- Call the method of adding new indicators to the list
      this.IndicatorsAdd();
      //--- In the loop by the number of indicators added to the window,
      for(int i=0;i<change;i++)
        {
         //--- get the new indicator in the list by the index calculated from the end of the list
         int index=this.m_list_ind.Total()-(1+i);
         //--- and if failed to obtain the object, move on to the next one
         CWndInd *ind=this.m_list_ind.At(index);
         if(ind==NULL)
            continue;
         //--- call the method of sending an event to the control program chart
         this.SendEvent(CHART_OBJ_EVENT_CHART_WND_IND_ADD);
        }
     }
   //--- If there are removed indicators
   if(change<0)
     {
      //--- Call the method of removing unnecessary indicators from the list
      this.IndicatorsDelete();
      //--- In the loop by the number of indicators removed from the window,
      for(int i=0;i<-change;i++)
        {
         //--- get a new removed indicator in the list of removed indicators by index calculated from the end of the list
         int index=this.m_list_ind_del.Total()-(1+i);
         //--- and if failed to obtain the object, move on to the next one
         CWndInd *ind=this.m_list_ind_del.At(index);
         if(ind==NULL)
            continue;
         //--- call the method of sending an event to the control program chart
         this.SendEvent(CHART_OBJ_EVENT_CHART_WND_IND_DEL);
        }
     }
  }
//+------------------------------------------------------------------+
这里的所有内容都在代码块注释中进行了讲述。 在简述参数型构造函数的改进时,已研究过细节。 这几乎是同一件事。
图表窗口对象类转换到完善的函数库对象的任务至此完毕。
现在我们来改进 \MQL5\Include\DoEasy\Objects\Chart\ChartObj.mqh 中的图表对象类。
在类的私密部分,添加存储前一个品种和图表时间帧的新变量,以及存储最后一个事件的变量:
//+------------------------------------------------------------------+
//| Chart object class                                               |
//+------------------------------------------------------------------+
class CChartObj : public CBaseObjExt
  {
private:
   CArrayObj         m_list_wnd;                                  // List of chart window objects
   CArrayObj        *m_list_wnd_del;                              // Pointer to the list of chart window objects
   CArrayObj        *m_list_ind_del;                              // Pointer to the list of indicators removed from the indicator window
   CArrayObj        *m_list_ind_param;                            // Pointer to the list of changed indicators
   long              m_long_prop[CHART_PROP_INTEGER_TOTAL];       // Integer properties
   double            m_double_prop[CHART_PROP_DOUBLE_TOTAL];      // Real properties
   string            m_string_prop[CHART_PROP_STRING_TOTAL];      // String properties
   string            m_symbol_prev;                               // Previous chart symbol
   ENUM_TIMEFRAMES   m_timeframe_prev;                            // Previous timeframe
   int               m_digits;                                    // Symbol's Digits()
   int               m_last_event;                                // The last event
   datetime          m_wnd_time_x;                                // Time for X coordinate on the windowed chart
   double            m_wnd_price_y;                               // Price for Y coordinate on the windowed chart
我们需要在图表更新方法中填写图表数据,在类构造函数中也会填充它们。 图表对象有众多属性。 为避免在不同方法中出现相同类型的代码,将其移至单独的方法,并调用把图表数据填充至对象属性的方法。 在类的私密部分声明它们:
//--- The methods of setting property values
   bool              SetMode(const string source,const ENUM_CHART_MODE mode,const bool redraw=false);
   bool              SetScale(const string source,const int scale,const bool redraw=false);
   bool              SetModeVolume(const string source,const ENUM_CHART_VOLUME_MODE mode,const bool redraw=false);
   void              SetVisibleBars(void);
   void              SetWindowsTotal(void);
   void              SetFirstVisibleBars(void);
   void              SetWidthInBars(void);
   void              SetWidthInPixels(void);
   void              SetMaximizedFlag(void);
   void              SetMinimizedFlag(void);
   void              SetExpertName(void);
   void              SetScriptName(void);

//--- Fill in (1) integer, (2) real and (3) string object properties
   bool              SetIntegerParameters(void);
   void              SetDoubleParameters(void);
   bool              SetStringParameters(void);

//--- (1) Create, (2) check and re-create the chart window list
   void              CreateWindowsList(void);
   void              RecreateWindowsList(const int change);
//--- Add an extension to the screenshot file if it is missing
   string            FileNameWithExtention(const string filename);

public:
返回指示对象支持某个属性标志的所有方法都应返回 true:
//--- Return the indicator by index from the specified chart window
   CWndInd          *GetIndicator(const int win_num,const int ind_index);

//--- Return the flag of the object supporting this property
   virtual bool      SupportProperty(ENUM_CHART_PROP_INTEGER property)           { return true; }
   virtual bool      SupportProperty(ENUM_CHART_PROP_DOUBLE property)            { return true; }
   virtual bool      SupportProperty(ENUM_CHART_PROP_STRING property)            { return true; }

//--- Get description of (1) integer, (2) real and (3) string properties
   string            GetPropertyDescription(ENUM_CHART_PROP_INTEGER property);
   string            GetPropertyDescription(ENUM_CHART_PROP_DOUBLE property);
   string            GetPropertyDescription(ENUM_CHART_PROP_STRING property);
以前,该方法返回指示整数型属性的标志,如果该属性是以像素为单位的图表窗口框之间的距离,则返回 false 。
添加操控父类事件功能所需的三个公开方法:
//--- Return (1) the flag event, (2) the last event code and (3) the last event
   bool              IsEvent(void)                                   const { return this.m_is_event;                                      }
   int               GetLastEventsCode(void)                         const { return this.m_event_code;                                    }
   int               GetLastEvent(void)                              const { return this.m_last_event;                                    }

//--- Constructors
                     CChartObj(){;}
                     CChartObj(const long chart_id,CArrayObj *list_wnd_del,CArrayObj *list_ind_del,CArrayObj *list_ind_param);
//+------------------------------------------------------------------+
在简化的访问对象属性的方法模块中,添加方法返回指示图表窗口位于前台的标志:
//--- (1) Return, (2) enable, (3) disable docking the chart window
   bool              IsDocked(void)                                  const { return (bool)this.GetProperty(CHART_PROP_IS_DOCKED);         }
   bool              SetDockedON(const bool redraw=false)                  { return this.SetDockedFlag(DFUN,true,redraw); }
   bool              SetDockedOFF(const bool redraw=false)                 { return this.SetDockedFlag(DFUN,false,redraw); }

//--- (1) Return, (2) enable and (3) disable the display of the chart above all others
   bool              IsBringTop(void)                                      { return (bool)this.GetProperty(CHART_PROP_BRING_TO_TOP);      }
   bool              SetBringToTopON(const bool redraw=false)              { return this.SetBringToTopFlag(DFUN,true,redraw);             }
   bool              SetBringToTopOFF(const bool redraw=false)             { return this.SetBringToTopFlag(DFUN,false,redraw);            }

//--- (1) Return, set the chart type (2) bars, (3) candles, (4) line
   ENUM_CHART_MODE   Mode(void)                                      const { return (ENUM_CHART_MODE)this.GetProperty(CHART_PROP_MODE);   }
   bool              SetModeBars(const bool redraw=false)                  { return this.SetMode(DFUN,CHART_BARS,redraw);                 }
   bool              SetModeCandles(const bool redraw=false)               { return this.SetMode(DFUN,CHART_CANDLES,redraw);              }
   bool              SetModeLine(const bool redraw=false)                  { return this.SetMode(DFUN,CHART_LINE,redraw);                 }
该方法返回 CHART_BRING_TO_TOP 标志。
在帮助中,此属性被标记为“只写”(w/o),而示例显示可以将所需图表设置为活动状态,且不允许读取其状态。 然而,实际上,这个属性也可以被读取,允许我们找出当前处于活动状态的图表。 要么这是帮助中的错误,要么是未记录的功能(这令人极其不爽),但事实上它仍然可操作。 如果突然无法读取图表属性(根据帮助),则更难以快速获取当前活动的图表。 自定义一个解决方案很有必要。
在类清单的末尾,编写为父类对象受控属性设置跟踪值的方法。
编写所有的属性(整数型和实数型)。 然而,并非所有均有状态控制方法。 我会考虑是否真的应该控制某些对象属性。 无论如何,所有属性都设置了注释,并且始终可以添加新属性:
//+------------------------------------------------------------------+ //| Get and set the parameters of tracked property changes | //+------------------------------------------------------------------+ //CHART_PROP_ID = 0, // Chart ID //--- Chart timeframe //--- setting the chart timeframe (1) increase, (2) decrease controlled value and (3) reference level //--- getting (4) the chart timeframe change value, //--- getting the chart timeframe change flag increasing the (5) growth and (6) decrease values void SetControlTimeframeInc(const long value) { this.SetControlledValueINC(CHART_PROP_TIMEFRAME,(long)::fabs(value)); } void SetControlTimeframeDec(const long value) { this.SetControlledValueDEC(CHART_PROP_TIMEFRAME,(long)::fabs(value)); } void SetControlTimeframeLevel(const long value) { this.SetControlledValueLEVEL(CHART_PROP_TIMEFRAME,(long)::fabs(value)); } long GetValueChangedTimeframe(void) const { return this.GetPropLongChangedValue(CHART_PROP_TIMEFRAME); } bool IsIncreasedTimeframe(void) const { return (bool)this.GetPropLongFlagINC(CHART_PROP_TIMEFRAME); } bool IsDecreasedTimeframe(void) const { return (bool)this.GetPropLongFlagDEC(CHART_PROP_TIMEFRAME); } //CHART_PROP_SHOW // Price chart drawing //CHART_PROP_IS_OBJECT, // Chart object (OBJ_CHART) identification attribute //CHART_PROP_BRING_TO_TOP, // Show the chart above all others //CHART_PROP_CONTEXT_MENU, // Enable/disable access to the context menu using the right click //CHART_PROP_CROSSHAIR_TOOL, // Enable/disable access to the Crosshair tool using the middle click //CHART_PROP_MOUSE_SCROLL, // Scroll the chart horizontally using the left mouse button //CHART_PROP_EVENT_MOUSE_WHEEL, // Send messages about mouse wheel events (CHARTEVENT_MOUSE_WHEEL) to all MQL5 programs on a chart //CHART_PROP_EVENT_MOUSE_MOVE, // Send messages about mouse button click and movement events (CHARTEVENT_MOUSE_MOVE) to all MQL5 programs on a chart //CHART_PROP_EVENT_OBJECT_CREATE, // Send messages about the graphical object creation event (CHARTEVENT_OBJECT_CREATE) to all MQL5 programs on a chart //CHART_PROP_EVENT_OBJECT_DELETE, // Send messages about the graphical object destruction event (CHARTEVENT_OBJECT_DELETE) to all MQL5 programs on a chart //--- Type of the chart (candlesticks, bars or line (ENUM_CHART_MODE)) //--- setting the chart timeframe (1) increase, (2) decrease controlled value and (3) reference level //--- getting (4) the chart timeframe change value, //--- getting the chart timeframe change flag increasing the (5) growth and (6) decrease values void SetControlChartModeInc(const long value) { this.SetControlledValueINC(CHART_PROP_MODE,(long)::fabs(value)); } void SetControlChartModeDec(const long value) { this.SetControlledValueDEC(CHART_PROP_MODE,(long)::fabs(value)); } void SetControlChartModeLevel(const long value) { this.SetControlledValueLEVEL(CHART_PROP_MODE,(long)::fabs(value)); } long GetValueChangedChartMode(void) const { return this.GetPropLongChangedValue(CHART_PROP_MODE); } bool IsIncreasedChartMode(void) const { return (bool)this.GetPropLongFlagINC(CHART_PROP_MODE); } bool IsDecreasedChartMode(void) const { return (bool)this.GetPropLongFlagDEC(CHART_PROP_MODE); } //CHART_PROP_FOREGROUND, // Price chart in the foreground //CHART_PROP_SHIFT, // Mode of shift of the price chart from the right border //CHART_PROP_AUTOSCROLL, // The mode of automatic shift to the right border of the chart //CHART_PROP_KEYBOARD_CONTROL, // Allow managing the chart using a keyboard //CHART_PROP_QUICK_NAVIGATION, // Allow the chart to intercept Space and Enter key strokes to activate the quick navigation bar //CHART_PROP_SCALE, // Scale //CHART_PROP_SCALEFIX, // Fixed scale mode //CHART_PROP_SCALEFIX_11, // 1:1 scale mode //CHART_PROP_SCALE_PT_PER_BAR, // The mode of specifying the scale in points per bar //CHART_PROP_SHOW_TICKER, // Display a symbol ticker in the upper left corner //CHART_PROP_SHOW_OHLC, // Display OHLC values in the upper left corner //CHART_PROP_SHOW_BID_LINE, // Display Bid value as a horizontal line on the chart //CHART_PROP_SHOW_ASK_LINE, // Display Ask value as a horizontal line on a chart //CHART_PROP_SHOW_LAST_LINE, // Display Last value as a horizontal line on a chart //CHART_PROP_SHOW_PERIOD_SEP, // Display vertical separators between adjacent periods //CHART_PROP_SHOW_GRID, // Display a grid on the chart //CHART_PROP_SHOW_VOLUMES, // Display volumes on a chart //CHART_PROP_SHOW_OBJECT_DESCR, // Display text descriptions of objects //CHART_PROP_VISIBLE_BARS, // Number of bars on a chart that are available for display //CHART_PROP_WINDOWS_TOTAL, // The total number of chart windows including indicator subwindows //CHART_PROP_WINDOW_HANDLE, // Chart window handle //CHART_PROP_WINDOW_YDISTANCE ////--- Distance in Y axis pixels between the upper frame of the indicator subwindow and the upper frame of the chart main window ////--- set the controlled (1) growth, (2) decrease, (3) reference distance level in pixels by the vertical Y axis between the window frames ////--- get (4) the distance change in pixels by the vertical Y axis between the window frames, ////--- get the distance change flag in pixels by the vertical Y axis between the window frames exceeding the (5) growth and (6) decrease values // void SetControlWindowYDistanceInc(const long value) { this.SetControlledValueINC(CHART_PROP_WINDOW_YDISTANCE,(long)::fabs(value)); } // void SetControlWindowYDistanceDec(const long value) { this.SetControlledValueDEC(CHART_PROP_WINDOW_YDISTANCE,(long)::fabs(value)); } // void SetControlWindowYDistanceLevel(const long value) { this.SetControlledValueLEVEL(CHART_PROP_WINDOW_YDISTANCE,(long)::fabs(value)); } // long GetValueChangedWindowYDistance(void) const { return this.GetPropLongChangedValue(CHART_PROP_WINDOW_YDISTANCE); } // bool IsIncreasedWindowYDistance(void) const { return (bool)this.GetPropLongFlagINC(CHART_PROP_WINDOW_YDISTANCE); } // bool IsDecreasedWindowYDistance(void) const { return (bool)this.GetPropLongFlagDEC(CHART_PROP_WINDOW_YDISTANCE); } //CHART_PROP_FIRST_VISIBLE_BAR, // Number of the first visible bar on the chart //--- Width of the chart in bars //--- setting the controlled spread (1) increase, (2) decrease value and (3) reference chart width in bars //--- getting (4) the chart width change value in bars, //--- get the flag of the chart width change in bars exceeding (5) the growth and (6) decrease values void SetControlWidthInBarsInc(const long value) { this.SetControlledValueINC(CHART_PROP_WIDTH_IN_BARS,(long)::fabs(value)); } void SetControlWidthInBarsDec(const long value) { this.SetControlledValueDEC(CHART_PROP_WIDTH_IN_BARS,(long)::fabs(value)); } void SetControlWidthInBarsLevel(const long value) { this.SetControlledValueLEVEL(CHART_PROP_WIDTH_IN_BARS,(long)::fabs(value)); } long GetValueChangedWidthInBars(void) const { return this.GetPropLongChangedValue(CHART_PROP_WIDTH_IN_BARS); } bool IsIncreasedWidthInBars(void) const { return (bool)this.GetPropLongFlagINC(CHART_PROP_WIDTH_IN_BARS); } bool IsDecreasedWidthInBars(void) const { return (bool)this.GetPropLongFlagDEC(CHART_PROP_WIDTH_IN_BARS); } //--- Chart width in pixels //--- setting the controlled spread (1) increase, (2) decrease value and (3) reference chart width in pixels //--- getting (4) the chart width change value in pixels, //--- get the flag of the chart width change in pixels exceeding (5) the growth and (6) decrease values void SetControlWidthInPixelsInc(const long value) { this.SetControlledValueINC(CHART_PROP_WIDTH_IN_PIXELS,(long)::fabs(value)); } void SetControlWidthInPixelsDec(const long value) { this.SetControlledValueDEC(CHART_PROP_WIDTH_IN_PIXELS,(long)::fabs(value)); } void SetControlWidthInPixelsLevel(const long value) { this.SetControlledValueLEVEL(CHART_PROP_WIDTH_IN_PIXELS,(long)::fabs(value)); } long GetValueChangedWidthInPixels(void) const { return this.GetPropLongChangedValue(CHART_PROP_WIDTH_IN_PIXELS); } bool IsIncreasedWidthInPixels(void) const { return (bool)this.GetPropLongFlagINC(CHART_PROP_WIDTH_IN_PIXELS); } bool IsDecreasedWidthInPixels(void) const { return (bool)this.GetPropLongFlagDEC(CHART_PROP_WIDTH_IN_PIXELS); } //--- Chart height in pixels //--- setting the controlled spread (1) increase, (2) decrease value and (3) reference chart height in pixels //--- get (4) the chart height change in pixels, //--- get the flag of the chart height change in pixels exceeding (5) the growth and (6) decrease values void SetControlHeightInPixelsInc(const long value) { this.SetControlledValueINC(CHART_PROP_HEIGHT_IN_PIXELS,(long)::fabs(value)); } void SetControlHeightInPixelsDec(const long value) { this.SetControlledValueDEC(CHART_PROP_HEIGHT_IN_PIXELS,(long)::fabs(value)); } void SetControlHeightInPixelsLevel(const long value) { this.SetControlledValueLEVEL(CHART_PROP_HEIGHT_IN_PIXELS,(long)::fabs(value)); } long GetValueChangedHeightInPixels(void) const { return this.GetPropLongChangedValue(CHART_PROP_HEIGHT_IN_PIXELS); } bool IsIncreasedHeightInPixels(void) const { return (bool)this.GetPropLongFlagINC(CHART_PROP_HEIGHT_IN_PIXELS); } bool IsDecreasedHeightInPixels(void) const { return (bool)this.GetPropLongFlagDEC(CHART_PROP_HEIGHT_IN_PIXELS); } //CHART_PROP_COLOR_BACKGROUND, // Chart background color //CHART_PROP_COLOR_FOREGROUND, // Color of axes, scale and OHLC line //CHART_PROP_COLOR_GRID, // Grid color //CHART_PROP_COLOR_VOLUME, // Color of volumes and position opening levels //CHART_PROP_COLOR_CHART_UP, // Color for the up bar, shadows and body borders of bull candlesticks //CHART_PROP_COLOR_CHART_DOWN, // Color of down bar, its shadow and border of body of the bullish candlestick //CHART_PROP_COLOR_CHART_LINE, // Color of the chart line and the Doji candlesticks //CHART_PROP_COLOR_CANDLE_BULL, // Bullish candlestick body color //CHART_PROP_COLOR_CANDLE_BEAR, // Bearish candlestick body color //CHART_PROP_COLOR_BID, // Color of the Bid price line //CHART_PROP_COLOR_ASK, // Color of the Ask price line //CHART_PROP_COLOR_LAST, // Color of the last performed deal's price line (Last) //CHART_PROP_COLOR_STOP_LEVEL, // Color of stop order levels (Stop Loss and Take Profit) //CHART_PROP_SHOW_TRADE_LEVELS, // Display trade levels on the chart (levels of open positions, Stop Loss, Take Profit and pending orders) //CHART_PROP_DRAG_TRADE_LEVELS, // Enable the ability to drag trading levels on a chart using mouse //CHART_PROP_SHOW_DATE_SCALE, // Display the time scale on a chart //CHART_PROP_SHOW_PRICE_SCALE, // Display a price scale on a chart //CHART_PROP_SHOW_ONE_CLICK, // Display the quick trading panel on the chart //CHART_PROP_IS_MAXIMIZED, // Chart window maximized //CHART_PROP_IS_MINIMIZED, // Chart window minimized //CHART_PROP_IS_DOCKED, // Chart window docked //--- The left coordinate of the undocked chart window relative to the virtual screen //--- setting the controlled spread (1) increase, (2) decrease value and (3) reference level of the left coordinate of the undocked chart relative to the virtual screen //--- getting (4) the change value of the left coordinate of the undocked chart relative to the virtual screen, //--- getting the flag of changing the left coordinate of the undocked chart relative to the virtual screen exceeding the (5) increase and (6) decrease values void SetControlFloatLeftInc(const long value) { this.SetControlledValueINC(CHART_PROP_FLOAT_LEFT,(long)::fabs(value)); } void SetControlFloatLeftDec(const long value) { this.SetControlledValueDEC(CHART_PROP_FLOAT_LEFT,(long)::fabs(value)); } void SetControlFloatLeftLevel(const long value) { this.SetControlledValueLEVEL(CHART_PROP_FLOAT_LEFT,(long)::fabs(value)); } long GetValueChangedFloatLeft(void) const { return this.GetPropLongChangedValue(CHART_PROP_FLOAT_LEFT); } bool IsIncreasedFloatLeft(void) const { return (bool)this.GetPropLongFlagINC(CHART_PROP_FLOAT_LEFT); } bool IsDecreasedFloatLeft(void) const { return (bool)this.GetPropLongFlagDEC(CHART_PROP_FLOAT_LEFT); } //--- Upper coordinate of the undocked chart window relative to the virtual screen //--- setting the controlled spread (1) increase, (2) decrease value and (3) reference level of the upper coordinate of the undocked chart relative to the virtual screen //--- getting (4) the change value of the upper coordinate of the undocked chart relative to the virtual screen, //--- getting the flag of changing the upper coordinate of the undocked chart relative to the virtual screen exceeding the (5) increase and (6) decrease values void SetControlFloatTopInc(const long value) { this.SetControlledValueINC(CHART_PROP_FLOAT_TOP,(long)::fabs(value)); } void SetControlFloatTopDec(const long value) { this.SetControlledValueDEC(CHART_PROP_FLOAT_TOP,(long)::fabs(value)); } void SetControlFloatTopLevel(const long value) { this.SetControlledValueLEVEL(CHART_PROP_FLOAT_TOP,(long)::fabs(value)); } long GetValueChangedFloatTop(void) const { return this.GetPropLongChangedValue(CHART_PROP_FLOAT_TOP); } bool IsIncreasedFloatTop(void) const { return (bool)this.GetPropLongFlagINC(CHART_PROP_FLOAT_TOP); } bool IsDecreasedFloatTop(void) const { return (bool)this.GetPropLongFlagDEC(CHART_PROP_FLOAT_TOP); } //--- The right coordinate of the undocked chart window relative to the virtual screen //--- setting the controlled spread (1) increase, (2) decrease value and (3) reference level of the right coordinate of the undocked chart relative to the virtual screen //--- getting (4) the change value of the right coordinate of the undocked chart relative to the virtual screen, //--- getting the flag of changing the right coordinate of the undocked chart relative to the virtual screen exceeding the (5) increase and (6) decrease values void SetControlFloatRightInc(const long value) { this.SetControlledValueINC(CHART_PROP_FLOAT_RIGHT,(long)::fabs(value)); } void SetControlFloatRightDec(const long value) { this.SetControlledValueDEC(CHART_PROP_FLOAT_RIGHT,(long)::fabs(value)); } void SetControlFloatRightLevel(const long value) { this.SetControlledValueLEVEL(CHART_PROP_FLOAT_RIGHT,(long)::fabs(value)); } long GetValueChangedFloatRight(void) const { return this.GetPropLongChangedValue(CHART_PROP_FLOAT_RIGHT); } bool IsIncreasedFloatRight(void) const { return (bool)this.GetPropLongFlagINC(CHART_PROP_FLOAT_RIGHT); } bool IsDecreasedFloatRight(void) const { return (bool)this.GetPropLongFlagDEC(CHART_PROP_FLOAT_RIGHT); } //--- The bottom coordinate of the undocked chart window relative to the virtual screen //--- setting the controlled spread (1) increase, (2) decrease value and (3) reference level of the lower coordinate of the undocked chart relative to the virtual screen //--- getting (4) the change value of the lower coordinate of the undocked chart relative to the virtual screen, //--- getting the flag of changing the lower coordinate of the undocked chart relative to the virtual screen exceeding the (5) increase and (6) decrease values void SetControlFloatBottomInc(const long value) { this.SetControlledValueINC(CHART_PROP_FLOAT_BOTTOM,(long)::fabs(value)); } void SetControlFloatBottomDec(const long value) { this.SetControlledValueDEC(CHART_PROP_FLOAT_BOTTOM,(long)::fabs(value)); } void SetControlFloatBottomLevel(const long value) { this.SetControlledValueLEVEL(CHART_PROP_FLOAT_BOTTOM,(long)::fabs(value)); } long GetValueChangedFloatBottom(void) const { return this.GetPropLongChangedValue(CHART_PROP_FLOAT_BOTTOM); } bool IsIncreasedFloatBottom(void) const { return (bool)this.GetPropLongFlagINC(CHART_PROP_FLOAT_BOTTOM); } bool IsDecreasedFloatBottom(void) const { return (bool)this.GetPropLongFlagDEC(CHART_PROP_FLOAT_BOTTOM); } //--- Shift size of the zero bar from the right border in % //--- setting (1) increase, (2) decrease and (3) reference level of the shift size of the zero bar from the right border in % //--- getting (4) the change value of the shift of the zero bar from the right border in %, //--- getting the flag of the change value of the shift of the zero bar from the right border in % exceeding (5) the growth and (6) decrease values void SetControlShiftSizeInc(const long value) { this.SetControlledValueINC(CHART_PROP_SHIFT_SIZE,(long)::fabs(value)); } void SetControlShiftSizeDec(const long value) { this.SetControlledValueDEC(CHART_PROP_SHIFT_SIZE,(long)::fabs(value)); } void SetControlShiftSizeLevel(const long value) { this.SetControlledValueLEVEL(CHART_PROP_SHIFT_SIZE,(long)::fabs(value)); } double GetValueChangedShiftSize(void) const { return this.GetPropDoubleChangedValue(CHART_PROP_SHIFT_SIZE); } bool IsIncreasedShiftSize(void) const { return (bool)this.GetPropLongFlagINC(CHART_PROP_SHIFT_SIZE); } bool IsDecreasedShiftSize(void) const { return (bool)this.GetPropLongFlagDEC(CHART_PROP_SHIFT_SIZE); } //--- Chart fixed position from the left border in % //--- setting (1) increase, (2) decrease and (3) reference level of the chart fixed position from the left border in % //--- getting (4) the change value of the chart fixed position from the left border in %, //--- getting the flag of changing the chart fixed position from the left border in % more than by the (5) increase and (6) decrease values void SetControlFixedPositionInc(const long value) { this.SetControlledValueINC(CHART_PROP_FIXED_POSITION,(long)::fabs(value)); } void SetControlFixedPositionDec(const long value) { this.SetControlledValueDEC(CHART_PROP_FIXED_POSITION,(long)::fabs(value)); } void SetControlFixedPositionLevel(const long value) { this.SetControlledValueLEVEL(CHART_PROP_FIXED_POSITION,(long)::fabs(value)); } double GetValueChangedFixedPosition(void) const { return this.GetPropDoubleChangedValue(CHART_PROP_FIXED_POSITION); } bool IsIncreasedFixedPosition(void) const { return (bool)this.GetPropLongFlagINC(CHART_PROP_FIXED_POSITION); } bool IsDecreasedFixedPosition(void) const { return (bool)this.GetPropLongFlagDEC(CHART_PROP_FIXED_POSITION); } //--- Fixed chart maximum //--- setting the fixed chart maximum (1) increase, (2) decrease controlled value and (3) reference level //--- getting (4) the change value of the fixed chart maximum, //--- getting the flag of changing the position of the fixed chart maximum by more than (5) increase and (6) decrease values void SetControlFixedMaxInc(const long value) { this.SetControlledValueINC(CHART_PROP_FIXED_MAX,(long)::fabs(value)); } void SetControlFixedMaxDec(const long value) { this.SetControlledValueDEC(CHART_PROP_FIXED_MAX,(long)::fabs(value)); } void SetControlFixedMaxLevel(const long value) { this.SetControlledValueLEVEL(CHART_PROP_FIXED_MAX,(long)::fabs(value)); } double GetValueChangedFixedMax(void) const { return this.GetPropDoubleChangedValue(CHART_PROP_FIXED_MAX); } bool IsIncreasedFixedMax(void) const { return (bool)this.GetPropLongFlagINC(CHART_PROP_FIXED_MAX); } bool IsDecreasedFixedMax(void) const { return (bool)this.GetPropLongFlagDEC(CHART_PROP_FIXED_MAX); } //--- Fixed chart minimum //--- setting the fixed chart minimum (1) increase, (2) decrease controlled value and (3) reference level //--- getting (4) the change value of the fixed chart minimum, //--- getting the flag of changing the position of the fixed chart minimum by more than (5) increase and (6) decrease values void SetControlFixedMinInc(const long value) { this.SetControlledValueINC(CHART_PROP_FIXED_MIN,(long)::fabs(value)); } void SetControlFixedMinDec(const long value) { this.SetControlledValueDEC(CHART_PROP_FIXED_MIN,(long)::fabs(value)); } void SetControlFixedMinLevel(const long value) { this.SetControlledValueLEVEL(CHART_PROP_FIXED_MIN,(long)::fabs(value)); } double GetValueChangedFixedMin(void) const { return this.GetPropDoubleChangedValue(CHART_PROP_FIXED_MIN); } bool IsIncreasedFixedMin(void) const { return (bool)this.GetPropLongFlagINC(CHART_PROP_FIXED_MIN); } bool IsDecreasedFixedMin(void) const { return (bool)this.GetPropLongFlagDEC(CHART_PROP_FIXED_MIN); } //CHART_PROP_POINTS_PER_BAR, // Scale in points per bar //--- Chart minimum //--- setting the chart minimum (1) increase, (2) decrease controlled value and (3) reference level //--- getting (4) the change value of the chart minimum, //--- getting the flag of changing the position of the chart minimum by more than (5) increase and (6) decrease values void SetControlPriceMinInc(const long value) { this.SetControlledValueINC(CHART_PROP_PRICE_MIN,(long)::fabs(value)); } void SetControlPriceMinDec(const long value) { this.SetControlledValueDEC(CHART_PROP_PRICE_MIN,(long)::fabs(value)); } void SetControlPriceMinLevel(const long value) { this.SetControlledValueLEVEL(CHART_PROP_PRICE_MIN,(long)::fabs(value)); } double GetValueChangedPriceMin(void) const { return this.GetPropDoubleChangedValue(CHART_PROP_PRICE_MIN); } bool IsIncreasedPriceMin(void) const { return (bool)this.GetPropLongFlagINC(CHART_PROP_PRICE_MIN); } bool IsDecreasedPriceMin(void) const { return (bool)this.GetPropLongFlagDEC(CHART_PROP_PRICE_MIN); } //--- Chart maximum //--- setting the chart maximum (1) increase, (2) decrease controlled value and (3) reference level //--- getting (4) the change value of the chart maximum, //--- getting the flag of changing the position of the chart maximum by more than (5) increase and (6) decrease values void SetControlPriceMaxInc(const long value) { this.SetControlledValueINC(CHART_PROP_PRICE_MAX,(long)::fabs(value)); } void SetControlPriceMaxDec(const long value) { this.SetControlledValueDEC(CHART_PROP_PRICE_MAX,(long)::fabs(value)); } void SetControlPriceMaxLevel(const long value) { this.SetControlledValueLEVEL(CHART_PROP_PRICE_MAX,(long)::fabs(value)); } double GetValueChangedPriceMax(void) const { return this.GetPropDoubleChangedValue(CHART_PROP_PRICE_MAX); } bool IsIncreasedPriceMax(void) const { return (bool)this.GetPropLongFlagINC(CHART_PROP_PRICE_MAX); } bool IsDecreasedPriceMax(void) const { return (bool)this.GetPropLongFlagDEC(CHART_PROP_PRICE_MAX); } }; //+------------------------------------------------------------------+
这些方法令您能够快速为受控对象属性设置其值,且当增加/减少受控属性值时超界,会将事件发送到控制程序图表。
类构造函数的修改方式与之前研究的图表窗口对象类相同:
//+------------------------------------------------------------------+
//| Parametric constructor                                           |
//+------------------------------------------------------------------+
CChartObj::CChartObj(const long chart_id,CArrayObj *list_wnd_del,CArrayObj *list_ind_del,CArrayObj *list_ind_param) : m_wnd_time_x(0),m_wnd_price_y(0)
  {
   this.m_list_wnd_del=list_wnd_del;
   this.m_list_ind_del=list_ind_del;
   this.m_list_ind_param=list_ind_param;
//--- Set the chart ID to the base object and set the chart object ID
   CBaseObj::SetChartID(chart_id);
   this.m_type=COLLECTION_CHARTS_ID;

//--- Initialize base object data arrays
   this.SetControlDataArraySizeLong(CHART_PROP_INTEGER_TOTAL);
   this.SetControlDataArraySizeDouble(CHART_PROP_DOUBLE_TOTAL);
   this.ResetChangesParams();
   this.ResetControlsParams();

//--- Chart ID
   this.SetProperty(CHART_PROP_ID,chart_id);
//--- Set integer properties
   this.SetIntegerParameters();
//--- Set real properties
   this.SetDoubleParameters();
//--- Set string properties
   this.SetStringParameters();
//--- Initialize variables and lists
   this.m_digits=(int)::SymbolInfoInteger(this.Symbol(),SYMBOL_DIGITS);
   this.m_list_wnd_del.Sort(SORT_BY_CHART_WINDOW_NUM);
   this.CreateWindowsList();
   this.m_symbol_prev=this.Symbol();
   this.m_timeframe_prev=this.Timeframe();
   this.m_name=this.Header();

//--- Fill in the current chart data
   for(int i=0;i<CHART_PROP_INTEGER_TOTAL;i++)
      this.m_long_prop_event[i][3]=this.m_long_prop[i];
   for(int i=0;i<CHART_PROP_DOUBLE_TOTAL;i++)
      this.m_double_prop_event[i][3]=this.m_double_prop[i];

//--- Update the base object data and search for changes
   CBaseObjExt::Refresh();
  }
//+------------------------------------------------------------------+
此处图表参数值利用三种特殊方法设置在对象属性之中:
填充整数型对象属性的方法:
//+------------------------------------------------------------------+
//| Fill in integer object properties                                |
//+------------------------------------------------------------------+
bool CChartObj::SetIntegerParameters(void)
  {
   ENUM_TIMEFRAMES timeframe=::ChartPeriod(this.ID());
   if(timeframe==0)
      return false;
   this.SetProperty(CHART_PROP_TIMEFRAME,timeframe);                                                     // Chart timeframe
   this.SetProperty(CHART_PROP_SHOW,::ChartGetInteger(this.ID(),CHART_SHOW));                            // Price chart drawing attribute
   this.SetProperty(CHART_PROP_IS_OBJECT,::ChartGetInteger(this.ID(),CHART_IS_OBJECT));                  // Chart object identification attribute
   this.SetProperty(CHART_PROP_BRING_TO_TOP,::ChartGetInteger(this.ID(),CHART_BRING_TO_TOP));            // Show the chart above all others
   this.SetProperty(CHART_PROP_CONTEXT_MENU,::ChartGetInteger(this.ID(),CHART_CONTEXT_MENU));            // Access to the context menu using the right click
   this.SetProperty(CHART_PROP_CROSSHAIR_TOOL,::ChartGetInteger(this.ID(),CHART_CROSSHAIR_TOOL));        // Access the Crosshair tool by pressing the middle mouse button
   this.SetProperty(CHART_PROP_MOUSE_SCROLL,::ChartGetInteger(this.ID(),CHART_MOUSE_SCROLL));            // Scroll the chart horizontally using the left mouse button
   this.SetProperty(CHART_PROP_EVENT_MOUSE_WHEEL,::ChartGetInteger(this.ID(),CHART_EVENT_MOUSE_WHEEL));  // Send messages about mouse wheel events to all MQL5 programs on a chart
   this.SetProperty(CHART_PROP_EVENT_MOUSE_MOVE,::ChartGetInteger(this.ID(),CHART_EVENT_MOUSE_MOVE));    // Send messages about mouse button click and movement events to all MQL5 programs on a chart
   this.SetProperty(CHART_PROP_EVENT_OBJECT_CREATE,::ChartGetInteger(this.ID(),CHART_EVENT_OBJECT_CREATE)); // Send messages about the graphical object creation event to all MQL5 programs on a chart
   this.SetProperty(CHART_PROP_EVENT_OBJECT_DELETE,::ChartGetInteger(this.ID(),CHART_EVENT_OBJECT_DELETE)); // Send messages about the graphical object destruction event to all MQL5 programs on a chart
   this.SetProperty(CHART_PROP_MODE,::ChartGetInteger(this.ID(),CHART_MODE));                            // Type of the chart (candlesticks, bars or line)
   this.SetProperty(CHART_PROP_FOREGROUND,::ChartGetInteger(this.ID(),CHART_FOREGROUND));                // Price chart in the foreground
   this.SetProperty(CHART_PROP_SHIFT,::ChartGetInteger(this.ID(),CHART_SHIFT));                          // Mode of shift of the price chart from the right border
   this.SetProperty(CHART_PROP_AUTOSCROLL,::ChartGetInteger(this.ID(),CHART_AUTOSCROLL));                // The mode of automatic shift to the right border of the chart
   this.SetProperty(CHART_PROP_KEYBOARD_CONTROL,::ChartGetInteger(this.ID(),CHART_KEYBOARD_CONTROL));    // Allow managing the chart using a keyboard
   this.SetProperty(CHART_PROP_QUICK_NAVIGATION,::ChartGetInteger(this.ID(),CHART_QUICK_NAVIGATION));    // Allow the chart to intercept Space and Enter key strokes to activate the quick navigation bar
   this.SetProperty(CHART_PROP_SCALE,::ChartGetInteger(this.ID(),CHART_SCALE));                          // Scale
   this.SetProperty(CHART_PROP_SCALEFIX,::ChartGetInteger(this.ID(),CHART_SCALEFIX));                    // Fixed scale mode
   this.SetProperty(CHART_PROP_SCALEFIX_11,::ChartGetInteger(this.ID(),CHART_SCALEFIX_11));              // 1:1 scale mode
   this.SetProperty(CHART_PROP_SCALE_PT_PER_BAR,::ChartGetInteger(this.ID(),CHART_SCALE_PT_PER_BAR));    // Mode for specifying the scale in points per bar
   this.SetProperty(CHART_PROP_SHOW_TICKER,::ChartGetInteger(this.ID(),CHART_SHOW_TICKER));              // Display a symbol ticker in the upper left corner
   this.SetProperty(CHART_PROP_SHOW_OHLC,::ChartGetInteger(this.ID(),CHART_SHOW_OHLC));                  // Display OHLC values in the upper left corner
   this.SetProperty(CHART_PROP_SHOW_BID_LINE,::ChartGetInteger(this.ID(),CHART_SHOW_BID_LINE));          // Display Bid value as a horizontal line on the chart
   this.SetProperty(CHART_PROP_SHOW_ASK_LINE,::ChartGetInteger(this.ID(),CHART_SHOW_ASK_LINE));          // Display Ask value as a horizontal line on the chart
   this.SetProperty(CHART_PROP_SHOW_LAST_LINE,::ChartGetInteger(this.ID(),CHART_SHOW_LAST_LINE));        // Display Last value as a horizontal line on the chart
   this.SetProperty(CHART_PROP_SHOW_PERIOD_SEP,::ChartGetInteger(this.ID(),CHART_SHOW_PERIOD_SEP));      // Display vertical separators between adjacent periods
   this.SetProperty(CHART_PROP_SHOW_GRID,::ChartGetInteger(this.ID(),CHART_SHOW_GRID));                  // Display the chart grid
   this.SetProperty(CHART_PROP_SHOW_VOLUMES,::ChartGetInteger(this.ID(),CHART_SHOW_VOLUMES));            // Display volumes on the chart
   this.SetProperty(CHART_PROP_SHOW_OBJECT_DESCR,::ChartGetInteger(this.ID(),CHART_SHOW_OBJECT_DESCR));  // Display text descriptions of the objects
   this.SetProperty(CHART_PROP_VISIBLE_BARS,::ChartGetInteger(this.ID(),CHART_VISIBLE_BARS));            // Number of bars on a chart that are available for display
   this.SetProperty(CHART_PROP_WINDOWS_TOTAL,::ChartGetInteger(this.ID(),CHART_WINDOWS_TOTAL));          // The total number of chart windows including indicator subwindows
   this.SetProperty(CHART_PROP_WINDOW_HANDLE,::ChartGetInteger(this.ID(),CHART_WINDOW_HANDLE));          // Chart window handle
   this.SetProperty(CHART_PROP_FIRST_VISIBLE_BAR,::ChartGetInteger(this.ID(),CHART_FIRST_VISIBLE_BAR));  // Number of the first visible bar on the chart
   this.SetProperty(CHART_PROP_WIDTH_IN_BARS,::ChartGetInteger(this.ID(),CHART_WIDTH_IN_BARS));          // Chart width in bars
   this.SetProperty(CHART_PROP_WIDTH_IN_PIXELS,::ChartGetInteger(this.ID(),CHART_WIDTH_IN_PIXELS));      // Chart width in pixels
   this.SetProperty(CHART_PROP_COLOR_BACKGROUND,::ChartGetInteger(this.ID(),CHART_COLOR_BACKGROUND));    // Chart background color
   this.SetProperty(CHART_PROP_COLOR_FOREGROUND,::ChartGetInteger(this.ID(),CHART_COLOR_FOREGROUND));    // Color of axes, scale and OHLC line
   this.SetProperty(CHART_PROP_COLOR_GRID,::ChartGetInteger(this.ID(),CHART_COLOR_GRID));                // Grid color
   this.SetProperty(CHART_PROP_COLOR_VOLUME,::ChartGetInteger(this.ID(),CHART_COLOR_VOLUME));            // Color of volumes and position opening levels
   this.SetProperty(CHART_PROP_COLOR_CHART_UP,::ChartGetInteger(this.ID(),CHART_COLOR_CHART_UP));        // Color for the up bar, shadows and body borders of bullish candlesticks
   this.SetProperty(CHART_PROP_COLOR_CHART_DOWN,::ChartGetInteger(this.ID(),CHART_COLOR_CHART_DOWN));    // Color for the down bar, shadows and body borders of bearish candlesticks
   this.SetProperty(CHART_PROP_COLOR_CHART_LINE,::ChartGetInteger(this.ID(),CHART_COLOR_CHART_LINE));    // Color of the chart line and the Doji candlesticks
   this.SetProperty(CHART_PROP_COLOR_CANDLE_BULL,::ChartGetInteger(this.ID(),CHART_COLOR_CANDLE_BULL));  // Color of the bullish candle body
   this.SetProperty(CHART_PROP_COLOR_CANDLE_BEAR,::ChartGetInteger(this.ID(),CHART_COLOR_CANDLE_BEAR));  // Color of the bearish candle body
   this.SetProperty(CHART_PROP_COLOR_BID,::ChartGetInteger(this.ID(),CHART_COLOR_BID));                  // Bid price line color
   this.SetProperty(CHART_PROP_COLOR_ASK,::ChartGetInteger(this.ID(),CHART_COLOR_ASK));                  // Ask price line color
   this.SetProperty(CHART_PROP_COLOR_LAST,::ChartGetInteger(this.ID(),CHART_COLOR_LAST));                // Color of the last performed deal's price line (Last)
   this.SetProperty(CHART_PROP_COLOR_STOP_LEVEL,::ChartGetInteger(this.ID(),CHART_COLOR_STOP_LEVEL));    // Color of stop order levels (Stop Loss and Take Profit)
   this.SetProperty(CHART_PROP_SHOW_TRADE_LEVELS,::ChartGetInteger(this.ID(),CHART_SHOW_TRADE_LEVELS));  // Display trade levels on the chart (levels of open positions, Stop Loss, Take Profit and pending orders)
   this.SetProperty(CHART_PROP_DRAG_TRADE_LEVELS,::ChartGetInteger(this.ID(),CHART_DRAG_TRADE_LEVELS));  // Enable the ability to drag trading levels on a chart using mouse
   this.SetProperty(CHART_PROP_SHOW_DATE_SCALE,::ChartGetInteger(this.ID(),CHART_SHOW_DATE_SCALE));      // Display the time scale on the chart
   this.SetProperty(CHART_PROP_SHOW_PRICE_SCALE,::ChartGetInteger(this.ID(),CHART_SHOW_PRICE_SCALE));    // Display the price scale on the chart
   this.SetProperty(CHART_PROP_SHOW_ONE_CLICK,::ChartGetInteger(this.ID(),CHART_SHOW_ONE_CLICK));        // Display the quick trading panel on the chart
   this.SetProperty(CHART_PROP_IS_MAXIMIZED,::ChartGetInteger(this.ID(),CHART_IS_MAXIMIZED));            // Chart window maximized
   this.SetProperty(CHART_PROP_IS_MINIMIZED,::ChartGetInteger(this.ID(),CHART_IS_MINIMIZED));            // Chart window minimized
   this.SetProperty(CHART_PROP_IS_DOCKED,::ChartGetInteger(this.ID(),CHART_IS_DOCKED));                  // Chart window docked
   this.SetProperty(CHART_PROP_FLOAT_LEFT,::ChartGetInteger(this.ID(),CHART_FLOAT_LEFT));                // Left coordinate of the undocked chart window relative to the virtual screen
   this.SetProperty(CHART_PROP_FLOAT_TOP,::ChartGetInteger(this.ID(),CHART_FLOAT_TOP));                  // Upper coordinate of the undocked chart window relative to the virtual screen
   this.SetProperty(CHART_PROP_FLOAT_RIGHT,::ChartGetInteger(this.ID(),CHART_FLOAT_RIGHT));              // Right coordinate of the undocked chart window relative to the virtual screen
   this.SetProperty(CHART_PROP_FLOAT_BOTTOM,::ChartGetInteger(this.ID(),CHART_FLOAT_BOTTOM));            // Bottom coordinate of the undocked chart window relative to the virtual screen
   this.SetProperty(CHART_PROP_YDISTANCE,::ChartGetInteger(this.ID(),CHART_WINDOW_YDISTANCE,0));         // Distance in Y axis pixels between the upper frame of the indicator subwindow and the upper frame of the chart main window
   this.SetProperty(CHART_PROP_HEIGHT_IN_PIXELS,::ChartGetInteger(this.ID(),CHART_HEIGHT_IN_PIXELS,0));  // Chart height in pixels
   return true;
  }
//+------------------------------------------------------------------+
填充实数型对象属性的方法:
//+------------------------------------------------------------------+
//| Fill in real object properties                                   |
//+------------------------------------------------------------------+
void CChartObj::SetDoubleParameters(void)
  {
   this.SetProperty(CHART_PROP_SHIFT_SIZE,::ChartGetDouble(this.ID(),CHART_SHIFT_SIZE));                 // Shift size of the zero bar from the right border in %
   this.SetProperty(CHART_PROP_FIXED_POSITION,::ChartGetDouble(this.ID(),CHART_FIXED_POSITION));         // Chart fixed position from the left border in %
   this.SetProperty(CHART_PROP_FIXED_MAX,::ChartGetDouble(this.ID(),CHART_FIXED_MAX));                   // Fixed chart maximum
   this.SetProperty(CHART_PROP_FIXED_MIN,::ChartGetDouble(this.ID(),CHART_FIXED_MIN));                   // Fixed chart minimum
   this.SetProperty(CHART_PROP_POINTS_PER_BAR,::ChartGetDouble(this.ID(),CHART_POINTS_PER_BAR));         // Scale in points per bar
   this.SetProperty(CHART_PROP_PRICE_MIN,::ChartGetDouble(this.ID(),CHART_PRICE_MIN));                   // Chart minimum
   this.SetProperty(CHART_PROP_PRICE_MAX,::ChartGetDouble(this.ID(),CHART_PRICE_MAX));                   // Chart maximum
  }
//+------------------------------------------------------------------+
填充字符串型对象属性的方法:
//+------------------------------------------------------------------+
//| Fill in string object properties                                 |
//+------------------------------------------------------------------+
bool CChartObj::SetStringParameters(void)
  {
   string symbol=::ChartSymbol(this.ID());
   if(symbol==NULL)
      return false;
   this.SetProperty(CHART_PROP_SYMBOL,symbol);                                                           // Chart symbol
   this.SetProperty(CHART_PROP_COMMENT,::ChartGetString(this.ID(),CHART_COMMENT));                       // Comment text on the chart
   this.SetProperty(CHART_PROP_EXPERT_NAME,::ChartGetString(this.ID(),CHART_EXPERT_NAME));               // name of an EA launched on the chart
   this.SetProperty(CHART_PROP_SCRIPT_NAME,::ChartGetString(this.ID(),CHART_SCRIPT_NAME));               // name of a script launched on the chart
   return true;
  }
//+------------------------------------------------------------------+
填充整数型和字符串型属性的方法返回 bool 值,因为在该方法内,我们调用 ChartPeriod() 和 ChartSymbol() 函数按图表 ID 获取图表周期和品种。 这些函数可以返回零或空字符串。 在这种情况下,这些方法返回 false。
在返回对象整数型属性说明的方法中(即在返回窗口框之间的距离,和以像素为单位的图表高度的代码块中,直接从图表而非对象返回该属性:
      property==CHART_PROP_WINDOW_HANDLE  ?  CMessage::Text(MSG_CHART_OBJ_WINDOW_HANDLE)+
         (!this.SupportProperty(property) ?  ": "+CMessage::Text(MSG_LIB_PROP_NOT_SUPPORTED) :
          ": "+(string)this.GetProperty(property)
         )  :
      property==CHART_PROP_YDISTANCE  ?  CMessage::Text(MSG_CHART_OBJ_WINDOW_YDISTANCE)+
         (!this.SupportProperty(property) ?  ": "+CMessage::Text(MSG_LIB_PROP_NOT_SUPPORTED) :
          ": "+(string)::ChartGetInteger(this.m_chart_id,CHART_WINDOW_YDISTANCE,0)
         )  :
      property==CHART_PROP_FIRST_VISIBLE_BAR ?  CMessage::Text(MSG_CHART_OBJ_FIRST_VISIBLE_BAR)+
         (!this.SupportProperty(property) ?  ": "+CMessage::Text(MSG_LIB_PROP_NOT_SUPPORTED) :
          ": "+(string)this.GetProperty(property)
         )  :
      property==CHART_PROP_WIDTH_IN_BARS  ?  CMessage::Text(MSG_CHART_OBJ_WIDTH_IN_BARS)+
         (!this.SupportProperty(property) ?  ": "+CMessage::Text(MSG_LIB_PROP_NOT_SUPPORTED) :
          ": "+(string)this.GetProperty(property)
         )  :
      property==CHART_PROP_WIDTH_IN_PIXELS   ?  CMessage::Text(MSG_CHART_OBJ_WIDTH_IN_PIXELS)+
         (!this.SupportProperty(property) ?  ": "+CMessage::Text(MSG_LIB_PROP_NOT_SUPPORTED) :
          ": "+(string)this.GetProperty(property)
         )  :
      property==CHART_PROP_HEIGHT_IN_PIXELS   ?  CMessage::Text(MSG_CHART_OBJ_HEIGHT_IN_PIXELS)+
         (!this.SupportProperty(property) ?  ": "+CMessage::Text(MSG_LIB_PROP_NOT_SUPPORTED) :
          ": "+(string)::ChartGetInteger(this.m_chart_id,CHART_HEIGHT_IN_PIXELS,0)
         )  :
      property==CHART_PROP_COLOR_BACKGROUND        ?  CMessage::Text(MSG_CHART_OBJ_COLOR_BACKGROUND)+
         (!this.SupportProperty(property) ?  ": "+CMessage::Text(MSG_LIB_PROP_NOT_SUPPORTED) :
          ": "+::ColorToString((color)this.GetProperty(property),true)
         )  :
虽然图表有这样的属性,但它们属于其窗口(在这种情况下是零),而非图表本身;且我们需从图表窗口对象中获取这些属性。
更新图表对象及其窗口列表的方法也有所变化:
//+------------------------------------------------------------------+
//| Update the chart object and its window list                      |
//+------------------------------------------------------------------+
void CChartObj::Refresh(void)
  {
//--- Initialize event data
   this.m_is_event=false;
   this.m_hash_sum=0;
   this.m_list_events.Clear();
   this.m_list_events.Sort();
//--- Update all chart windows
   for(int i=0;i<this.m_list_wnd.Total();i++)
     {
      //--- Get the next chart window object from the list
      CChartWnd *wnd=this.m_list_wnd.At(i);
      if(wnd==NULL)
         continue;
      //--- Update the window and check its event flag
      //--- If the window has no event, move on to the next window
      wnd.Refresh();
      if(!wnd.IsEvent())
         continue;
      //--- Get the list of chart window events
      CArrayObj *list=wnd.GetListEvents();
      if(list==NULL)
         continue;
      //--- Set the chart event flag and get the last event code
      this.m_is_event=true;
      this.m_event_code=wnd.GetEventCode();
      //--- In the loop by the number of chart window events,
      int n=list.Total();
      for(int j=0; j<n; j++)
        {
         //--- get the base event object from the chart window event list
         CEventBaseObj *event=list.At(j);
         if(event==NULL)
            continue;
         //--- Create the chart window event parameters using the base event
         ushort event_id=event.ID();
         this.m_last_event=event_id;
         string sparam=(string)this.GetChartID()+"_"+(string)wnd.WindowNum();
         //--- if the event is on the foreground and the chart window event is added to the chart event list,
         if(::ChartGetInteger(this.ID(),CHART_BRING_TO_TOP) && this.EventAdd((ushort)event.ID(),event.LParam(),event.DParam(),sparam))
           {
            //--- send the newly created chart window event to the control program chart
            ::EventChartCustom(this.m_chart_id_main,(ushort)event_id,event.LParam(),event.DParam(),sparam);
           }
        }
     }

//--- Check changes of a symbol and chart period
   int change=(int)::ChartGetInteger(this.m_chart_id,CHART_WINDOWS_TOTAL)-this.WindowsTotal();
   if(change==0)
     {
      //--- Get a chart symbol and period by its ID
      string symbol=::ChartSymbol(this.ID());
      ENUM_TIMEFRAMES timeframe=::ChartPeriod(this.ID());
      //--- If a symbol and period are received
      if(symbol!=NULL && timeframe!=0)
        {
         //--- create the flags specifying the equality/non-equality of the obtained period symbol with the current ones
         bool symb=symbol!=this.m_symbol_prev;
         bool tf=timeframe!=this.m_timeframe_prev;
         //--- If case of any changes, find out their exact nature:
         if(symb || tf)
           {
            //--- If both a symbol and a timeframe changed
            if(symb && tf)
              {
               //--- Send the CHART_OBJ_EVENT_CHART_SYMB_TF_CHANGE event to the control program chart
               this.SendEvent(CHART_OBJ_EVENT_CHART_SYMB_TF_CHANGE);
               //--- Set a new symbol and a period for the object, and
               this.SetSymbol(symbol);
               this.SetTimeframe(timeframe);
               //--- write the current symbol/period as the previous ones
               this.m_symbol_prev=this.Symbol();
               this.m_timeframe_prev=this.Timeframe();
              }
            //--- If only a chart symbol is changed
            else if(symb)
              {
               //--- Send the CHART_OBJ_EVENT_CHART_SYMB_CHANGE event to the control program chart
               this.SendEvent(CHART_OBJ_EVENT_CHART_SYMB_CHANGE);
               //--- Set a new symbol for the object and write the current symbol as the previous one
               this.SetSymbol(symbol);
               this.m_symbol_prev=this.Symbol();
              }
            //--- If only a chart period is changed
            else if(tf)
              {
               //--- Send the CHART_OBJ_EVENT_CHART_TF_CHANGE event to the control program chart
               this.SendEvent(CHART_OBJ_EVENT_CHART_TF_CHANGE);
               //--- Set a new timeframe for the object and write the current timeframe as the previous one
               this.SetTimeframe(timeframe);
               this.m_timeframe_prev=this.Timeframe();
              }
           }
        }
      //--- Update chart data
      if(this.SetIntegerParameters())
        {
         this.SetDoubleParameters();
         this.SetStringParameters();
        }
      //--- Fill in the current chart data
      for(int i=0;i<CHART_PROP_INTEGER_TOTAL;i++)
         this.m_long_prop_event[i][3]=this.m_long_prop[i];
      for(int i=0;i<CHART_PROP_DOUBLE_TOTAL;i++)
         this.m_double_prop_event[i][3]=this.m_double_prop[i];
      //--- Update the base object data and search for changes
      CBaseObjExt::Refresh();
      this.CheckEvents();
     }
   else
     {
      this.RecreateWindowsList(change);
     }
  }
//+------------------------------------------------------------------+
方法清单具有详细的注释。 简而言之:更新图表窗口对象之后,我们需要检查每个窗口事件的标志。 如果窗口产生事件,则应将每个事件发送到控制程序图表。 更新图表窗口,并检查其事件之后,我们需要检查图表品种和/或周期的变化,以防图表不再发生变化。
在创建和发送图表事件到控制程序图表的方法中,添加图表品种和/或周期变化事件的处理:
//+------------------------------------------------------------------+
//| Create and send a chart event                                    |
//| to the control program chart                                     |
//+------------------------------------------------------------------+
void CChartObj::SendEvent(ENUM_CHART_OBJ_EVENT event)
  {
   //--- If a window is added
   if(event==CHART_OBJ_EVENT_CHART_WND_ADD)
     {
      //--- Get the last chart window object added to the list
      CChartWnd *wnd=this.GetLastAddedWindow();
      if(wnd==NULL)
         return;
      //--- Send the CHART_OBJ_EVENT_CHART_WND_ADD event to the control program chart
      //--- pass the chart ID to lparam,
      //--- pass the chart window index to dparam,
      //--- pass the chart symbol to sparam
      ::EventChartCustom(this.m_chart_id_main,(ushort)event,this.m_chart_id,wnd.WindowNum(),this.Symbol());
     }
   //--- If the window is removed
   else if(event==CHART_OBJ_EVENT_CHART_WND_DEL)
     {
      //--- Get the last chart window object added to the list of removed windows
      CChartWnd *wnd=this.GetLastDeletedWindow();
      if(wnd==NULL)
         return;
      //--- Send the CHART_OBJ_EVENT_CHART_WND_DEL event to the control program chart
      //--- pass the chart ID to lparam,
      //--- pass the chart window index to dparam,
      //--- pass the chart symbol to sparam
      ::EventChartCustom(this.m_chart_id_main,(ushort)event,this.m_chart_id,wnd.WindowNum(),this.Symbol());
     }
   //--- If symbol and timeframe changed
   else if(event==CHART_OBJ_EVENT_CHART_SYMB_TF_CHANGE)
     {
      //--- Send the CHART_OBJ_EVENT_CHART_SYMB_TF_CHANGE event to the control program chart
      //--- pass the chart ID to lparam,
      //--- pass the previous timeframe to dparam,
      //--- pass the previous chart symbol to sparam
      ::EventChartCustom(this.m_chart_id_main,(ushort)event,this.m_chart_id,this.m_timeframe_prev,this.m_symbol_prev);
     }
   //--- If a symbol changed
   else if(event==CHART_OBJ_EVENT_CHART_SYMB_CHANGE)
     {
      //--- Send the CHART_OBJ_EVENT_CHART_SYMB_CHANGE event to the control program chart
      //--- pass the chart ID to lparam,
      //--- pass the current timeframe to dparam,
      //--- pass the previous chart symbol to sparam
      ::EventChartCustom(this.m_chart_id_main,(ushort)event,this.m_chart_id,this.Timeframe(),this.m_symbol_prev);
     }
   //--- If a timeframe changed
   else if(event==CHART_OBJ_EVENT_CHART_TF_CHANGE)
     {
      //--- Send the CHART_OBJ_EVENT_CHART_TF_CHANGE event to the control program chart
      //--- pass the chart ID to lparam,
      //--- pass the previous timeframe to dparam,
      //--- pass the current chart symbol to sparam
      ::EventChartCustom(this.m_chart_id_main,(ushort)event,this.m_chart_id,this.m_timeframe_prev,this.Symbol());
     }
  }
//+------------------------------------------------------------------+
代码注释包含所有详细信息。 如果您有任何疑问,请随时在下面的评论中提问。
现在我们来改进 \MQL5\Include\DoEasy\Collections\ChartObjCollection.mqh 中的图表对象集合类。
首先,令其成为基准扩展对象类的衍生后代,并将存储最后一个事件的变量添加到类的私密部分:
//+------------------------------------------------------------------+
//| MQL5 signal object collection                                    |
//+------------------------------------------------------------------+
class CChartObjCollection : public CBaseObjExt
  {
private:
   CListObj                m_list;                                   // List of chart objects
   CListObj                m_list_del;                               // List of deleted chart objects
   CArrayObj               m_list_wnd_del;                           // List of deleted chart window objects
   CArrayObj               m_list_ind_del;                           // List of indicators removed from the indicator window
   CArrayObj               m_list_ind_param;                         // List of changed indicators
   int                     m_charts_total_prev;                      // Previous number of charts in the terminal
   int                     m_last_event;                             // The last event
   //--- Return the number of charts in the terminal
   int                     ChartsTotal(void) const;
   //--- Return the flag indicating the existence of (1) a chart object and (2) a chart
   bool                    IsPresentChartObj(const long chart_id);
   bool                    IsPresentChart(const long chart_id);
   //--- Create a new chart object and add it to the list
   bool                    CreateNewChartObj(const long chart_id,const string source);
   //--- Find the missing chart object, create it and add it to the collection list
   bool                    FindAndCreateMissingChartObj(void);
   //--- Find a chart object not present in the terminal and remove it from the list
   void                    FindAndDeleteExcessChartObj(void);
public:
在类的公开部分,添加三个处理基准扩展对象事件功能的方法,并声明指示图表(由 ID 指定)的窗口对象(由索引指定)的方法:
//--- Return (1) the flag event, (2) an event of one of the charts and (3) the last event
   bool                    IsEvent(void)                             const { return this.m_is_event;                                   }
   int                     GetLastEventsCode(void)                   const { return this.m_event_code;                                 }
   int                     GetLastEvent(void)                        const { return this.m_last_event;                                 }

//--- Constructor
                           CChartObjCollection();

//--- Return the list of chart objects by (1) symbol and (2) timeframe
   CArrayObj              *GetChartsList(const string symbol)              { return this.GetList(CHART_PROP_SYMBOL,symbol,EQUAL);      }
   CArrayObj              *GetChartsList(const ENUM_TIMEFRAMES timeframe)  { return this.GetList(CHART_PROP_TIMEFRAME,timeframe,EQUAL);}
//--- Return the pointer to the chart object (1) by ID and (2) by an index in the list
   CChartObj              *GetChart(const long id);
   CChartObj              *GetChart(const int index)                       { return this.m_list.At(index);                             }
//--- Return (1) the last added chart and (2) the last removed chart
   CChartObj              *GetLastAddedChart(void)                         { return this.m_list.At(this.m_list.Total()-1);             }
   CChartObj              *GetLastDeletedChart(void)                       { return this.m_list_del.At(this.m_list_del.Total()-1);     }

//--- Return (1) the last added window on the chart by chart ID and (2) the last removed chart window
   CChartWnd              *GetLastAddedChartWindow(const long chart_id);
   CChartWnd              *GetLastDeletedChartWindow(void)                 { return this.m_list_wnd_del.At(this.m_list_wnd_del.Total()-1);}
//--- Return the window object (specified by index) of the chart (specified by ID)
   CChartWnd              *GetChartWindow(const long chart_id,const int wnd_num);
更新图表对象集合列表的方法接收处理图表对象事件:
//+------------------------------------------------------------------+
//| Update the collection list of chart objects                      |
//+------------------------------------------------------------------+
void CChartObjCollection::Refresh(void)
  {
//--- Initialize event data
   this.m_is_event=false;
   this.m_hash_sum=0;
   this.m_list_events.Clear();
   this.m_list_events.Sort();
   //--- In the loop by the number of chart objects in the collection list
   for(int i=0;i<this.m_list.Total();i++)
     {
      //--- get the next chart object and
      CChartObj *chart=this.m_list.At(i);
      if(chart==NULL)
         continue;
      //--- update it
      chart.Refresh();
      //--- If there is no chart event, move on to the next one
      if(!chart.IsEvent())
         continue;
      //--- Get the list of events of a selected chart
      CArrayObj *list=chart.GetListEvents();
      if(list==NULL)
         continue;
      //--- Set the event flag in the chart collection and get the last event code
      this.m_is_event=true;
      this.m_event_code=chart.GetEventCode();
      //--- In the loop by the chart event list,
      int n=list.Total();
      for(int j=0; j<n; j++)
        {
         //--- get the base event object from the chart event list
         CEventBaseObj *event=list.At(j);
         if(event==NULL)
            continue;
         //--- Create the chart event parameters using the base event
         ushort event_id=event.ID();
         this.m_last_event=event_id;
         string sparam=(string)this.GetChartID();
         //--- and, if the chart event is added to the chart event list,
         if(this.EventAdd((ushort)event.ID(),event.LParam(),event.DParam(),sparam))
           {
            //--- send the newly created chart event to the control program chart
            ::EventChartCustom(this.m_chart_id_main,(ushort)event_id,event.LParam(),event.DParam(),sparam);
           }
        }
     }

   //--- Get the number of open charts in the terminal and
   int charts_total=this.ChartsTotal();
   //--- calculate the difference between the number of open charts in the terminal
   //--- and chart objects in the collection list. These values are displayed in the chart comment
   int change=charts_total-this.m_list.Total();
   //--- If there are no changes, leave
   if(change==0)
      return;
   //--- If a chart is added in the terminal
   if(change>0)
     {
      //--- Find the missing chart object, create and add it to the collection list
      this.FindAndCreateMissingChartObj();
      //--- Get the current chart and return to it since
      //--- adding a new chart switches the focus to it
      CChartObj *chart=this.GetChart(GetMainChartID());
      if(chart!=NULL)
         chart.SetBringToTopON(true);
      for(int i=0;i<change;i++)
        {
         chart=m_list.At(m_list.Total()-(1+i));
         if(chart==NULL)
            continue;
         this.SendEvent(CHART_OBJ_EVENT_CHART_OPEN);
        }
     }
   //--- If a chart is removed in the terminal
   else if(change<0)
     {
      //--- Find an extra chart object in the collection list and remove it from the list
      this.FindAndDeleteExcessChartObj();
      for(int i=0;i<-change;i++)
        {
         CChartObj *chart=this.m_list_del.At(this.m_list_del.Total()-(1+i));
         if(chart==NULL)
            continue;
         this.SendEvent(CHART_OBJ_EVENT_CHART_CLOSE);
        }
     }
  }
//+------------------------------------------------------------------+
此处的逻辑与之前曾研究过的图表对象和图表窗口对象更新方法之一类似。 一切都在此都有详细注释。
返回图表(由 ID 指定)的窗口对象(由索引指定)的方法:
//+------------------------------------------------------------------+
//| Return the window object (specified by index)                    |
//| of the chart (specified by ID)                                   |
//+------------------------------------------------------------------+
CChartWnd* CChartObjCollection::GetChartWindow(const long chart_id,const int wnd_num)
  {
   CChartObj *chart=this.GetChart(chart_id);
   if(chart==NULL)
      return NULL;
   return chart.GetWindowByNum(wnd_num);
  }
//+------------------------------------------------------------------+
在此, 我们依据其 ID 获取图表对象,并通过指定的窗口索引返回属于图表的窗口。
如果未收到任何对象,则该方法返回 NULL。
接下来,在 \MQL5\Include\DoEasy\Engine.mqh 中的 CEngine 函数库主类中添加相同的方法:
//--- Return the object (1) of the last added window of the specified chart and (2) the last removed chart window
   CChartWnd           *ChartGetLastAddedChartWindow(const long chart_id)              { return this.m_charts.GetLastAddedChartWindow(chart_id);}
   CChartWnd           *ChartGetLastDeletedChartWindow(void)                           { return this.m_charts.GetLastDeletedChartWindow();   }
//--- Return the window object (specified by index) of the chart (specified by ID)
   CChartWnd           *ChartGetChartWindow(const long chart_id,const int wnd_num)     { return this.m_charts.GetChartWindow(chart_id,wnd_num);}
该方法简单地返回调用上述图表对象集合类 GetChartWindow() 方法的结果。
所有的修改和改进至此完毕。. 我们来进行一个测试。
测试
为了执行测试,我将借用上一篇文章中的 EA, 并将其保存在 \MQL5\Experts\TestDoEasy\Part72\ 里,命名为 TestDoEasyPart72.mq5。
我们需要跟踪一些图表窗口对象属性,并针对来自图表对象集合的所有传入新事件添加处理逻辑。
在 EA OnInitDoEasy() 函数的最后,添加代码块设置需要跟踪的图表窗口属性(整个函数代码比较大,就不在此提供了):
//--- Set controlled values for the current account
   CAccount* account=engine.GetAccountCurrent();
   if(account!=NULL)
     {
      //--- Set control of the profit increase to 10
      account.SetControlledValueINC(ACCOUNT_PROP_PROFIT,10.0);
      //--- Set control of the funds increase to 15
      account.SetControlledValueINC(ACCOUNT_PROP_EQUITY,15.0);
      //--- Set profit control level to 20
      account.SetControlledValueLEVEL(ACCOUNT_PROP_PROFIT,20.0);
     }

//--- Set controlled values for charts
   //--- Get the list of all collection charts
   CArrayObj *list_charts=engine.GetListCharts();
   if(list_charts!=NULL && list_charts.Total()>0)
     {
      //--- In a loop by the list, set the necessary values for tracked chart properties
      //--- By default, the LONG_MAX value is set to all properties, which means "Do not track this property"
      //--- It can be enabled or disabled (by setting the value less than LONG_MAX or vice versa - set the LONG_MAX value) at any time and anywhere in the program
      for(int i=0;i<list_charts.Total();i++)
        {
         CChartObj* chart=list_charts.At(i);
         if(chart==NULL)
            continue;
         //--- Set reference values for the selected chart windows
         int total_wnd=chart.WindowsTotal();
         for(int j=0;j<total_wnd;j++)
           {
            CChartWnd *wnd=engine.ChartGetChartWindow(chart.ID(),j);
            if(wnd==NULL)
               continue;
            //--- Set control of the chart window height increase by 20 pixels
            wnd.SetControlHeightInPixelsInc(20);
            //--- Set control of the chart window height decrease by 20 pixels
            wnd.SetControlHeightInPixelsDec(20);
            //--- Set the control height of the chart window to 50 pixels
            wnd.SetControlledValueLEVEL(CHART_WINDOW_PROP_HEIGHT_IN_PIXELS,50);
           }
        }
     }

//--- Get the end of the library initialization time counting and display it in the journal
   ulong end=GetTickCount();
   Print(TextByLanguage("Время инициализации библиотеки: ","Library initialization time: "),TimeMSCtoString(end-begin,TIME_MINUTES|TIME_SECONDS));
  }
//+------------------------------------------------------------------+
这里我们设置参数,其中:
- 如果窗口高度增加超过 20 个像素,则生成相应的事件,
- 如果窗口高度减少超过 20 个像素,则生成相应的事件,
- 如果窗口高度大于、小于或等于 50 个像素,则生成相应的事件。
EA 的 OnDoEasyEvent() 函数接收处理所有新的函数库事件(此处提供了处理所有图表集合事件的整个代码块,包括新事件):
//--- Handling timeseries events
   else if(idx>SERIES_EVENTS_NO_EVENT && idx<SERIES_EVENTS_NEXT_CODE)
     {
      //--- "New bar" event
      if(idx==SERIES_EVENTS_NEW_BAR)
        {
         Print(TextByLanguage("Новый бар на ","New Bar on "),sparam," ",TimeframeDescription((ENUM_TIMEFRAMES)dparam),": ",TimeToString(lparam));
        }
     }

//--- Handle chart auto events
//--- Handle chart and window events
   if(source==COLLECTION_CHART_WND_ID)
     {
      int pos=StringFind(sparam,"_");
      long chart_id=StringToInteger(StringSubstr(sparam,0,pos));
      int wnd_num=(int)StringToInteger(StringSubstr(sparam,pos+1));

      CChartObj *chart=engine.ChartGetChartObj(chart_id);
      if(chart==NULL)
         return;
      CSymbol *symbol=engine.GetSymbolObjByName(chart.Symbol());
      if(symbol==NULL)
         return;
      CChartWnd *wnd=chart.GetWindowByNum(wnd_num);
      if(wnd==NULL)
         return;
      //--- Number of decimal places in the event value - in case of a 'long' event, it is 0, otherwise - Digits() of a symbol
      int digits=(idx<CHART_WINDOW_PROP_INTEGER_TOTAL ? 0 : symbol.Digits());
      //--- Event text description
      string id_descr=(idx<CHART_WINDOW_PROP_INTEGER_TOTAL ? wnd.GetPropertyDescription((ENUM_CHART_WINDOW_PROP_INTEGER)idx) : wnd.GetPropertyDescription((ENUM_CHART_WINDOW_PROP_DOUBLE)idx));
      //--- Property change text value
      string value=DoubleToString(dparam,digits);

      //--- Check event reasons and display its description in the journal
      if(reason==BASE_EVENT_REASON_INC)
        {
         Print(wnd.EventDescription(idx,(ENUM_BASE_EVENT_REASON)reason,source,value,id_descr,digits));
        }
      if(reason==BASE_EVENT_REASON_DEC)
        {
         Print(wnd.EventDescription(idx,(ENUM_BASE_EVENT_REASON)reason,source,value,id_descr,digits));
        }
      if(reason==BASE_EVENT_REASON_MORE_THEN)
        {
         Print(wnd.EventDescription(idx,(ENUM_BASE_EVENT_REASON)reason,source,value,id_descr,digits));
        }
      if(reason==BASE_EVENT_REASON_LESS_THEN)
        {
         Print(wnd.EventDescription(idx,(ENUM_BASE_EVENT_REASON)reason,source,value,id_descr,digits));
        }
      if(reason==BASE_EVENT_REASON_EQUALS)
        {
         Print(wnd.EventDescription(idx,(ENUM_BASE_EVENT_REASON)reason,source,value,id_descr,digits));
        }
     }
//--- Handle chart auto events
   if(source==COLLECTION_CHARTS_ID)
     {
      long chart_id=StringToInteger(sparam);

      CChartObj *chart=engine.ChartGetChartObj(chart_id);
      if(chart==NULL)
         return;
      Print(DFUN,"chart_id=",chart_id,", chart.Symbol()=",chart.Symbol());
      //--- Number of decimal places in the event value - in case of a 'long' event, it is 0, otherwise - Digits() of a symbol
      int digits=int(idx<CHART_PROP_INTEGER_TOTAL ? 0 : SymbolInfoInteger(chart.Symbol(),SYMBOL_DIGITS));
      //--- Event text description
      string id_descr=(idx<CHART_PROP_INTEGER_TOTAL ? chart.GetPropertyDescription((ENUM_CHART_PROP_INTEGER)idx) : chart.GetPropertyDescription((ENUM_CHART_PROP_DOUBLE)idx));
      //--- Property change text value
      string value=DoubleToString(dparam,digits);

      //--- Check event reasons and display its description in the journal
      if(reason==BASE_EVENT_REASON_INC)
        {
         Print(chart.EventDescription(idx,(ENUM_BASE_EVENT_REASON)reason,source,value,id_descr,digits));
        }
      if(reason==BASE_EVENT_REASON_DEC)
        {
         Print(chart.EventDescription(idx,(ENUM_BASE_EVENT_REASON)reason,source,value,id_descr,digits));
        }
      if(reason==BASE_EVENT_REASON_MORE_THEN)
        {
         Print(chart.EventDescription(idx,(ENUM_BASE_EVENT_REASON)reason,source,value,id_descr,digits));
        }
      if(reason==BASE_EVENT_REASON_LESS_THEN)
        {
         Print(chart.EventDescription(idx,(ENUM_BASE_EVENT_REASON)reason,source,value,id_descr,digits));
        }
      if(reason==BASE_EVENT_REASON_EQUALS)
        {
         Print(chart.EventDescription(idx,(ENUM_BASE_EVENT_REASON)reason,source,value,id_descr,digits));
        }
     }

//--- Handle non-auto chart events
   else if(idx>CHART_OBJ_EVENT_NO_EVENT && idx<CHART_OBJ_EVENTS_NEXT_CODE)
     {
      //--- "New chart opening" event
      if(idx==CHART_OBJ_EVENT_CHART_OPEN)
        {
         //::EventChartCustom(this.m_chart_id_main,(ushort)event,chart.ID(),chart.Timeframe(),chart.Symbol());
         CChartObj *chart=engine.ChartGetLastOpenedChart();
         if(chart!=NULL)
           {
            string symbol=sparam;
            long chart_id=lparam;
            ENUM_TIMEFRAMES timeframe=(ENUM_TIMEFRAMES)dparam;
            string header=symbol+" "+TimeframeDescription(timeframe)+", ID "+(string)chart_id;
            Print(DFUN,CMessage::Text(MSG_CHART_COLLECTION_CHART_OPENED),": ",header);
           }
        }
      //--- "Chart closure" event
      if(idx==CHART_OBJ_EVENT_CHART_CLOSE)
        {
         //::EventChartCustom(this.m_chart_id_main,(ushort)event,chart.ID(),chart.Timeframe(),chart.Symbol());
         CChartObj *chart=engine.ChartGetLastClosedChart();
         if(chart!=NULL)
           {
            string symbol=sparam;
            long   chart_id=lparam;
            ENUM_TIMEFRAMES timeframe=(ENUM_TIMEFRAMES)dparam;
            string header=symbol+" "+TimeframeDescription(timeframe)+", ID "+(string)chart_id;
            Print(DFUN,CMessage::Text(MSG_CHART_COLLECTION_CHART_CLOSED),": ",header);
           }
        }
      //--- "Chart symbol changed" event
      if(idx==CHART_OBJ_EVENT_CHART_SYMB_CHANGE)
        {
         //::EventChartCustom(this.m_chart_id_main,(ushort)event,this.m_chart_id,this.Timeframe(),this.m_symbol_prev);
         long chart_id=lparam;
         ENUM_TIMEFRAMES timeframe=(ENUM_TIMEFRAMES)dparam;
         string symbol_prev=sparam;
         CChartObj *chart=engine.ChartGetChartObj(chart_id);
         if(chart!=NULL)
           {
            string header=chart.Symbol()+" "+TimeframeDescription(timeframe)+", ID "+(string)chart_id;
            Print(DFUN,CMessage::Text(MSG_CHART_COLLECTION_CHART_SYMB_CHANGED),": ",header,": ",symbol_prev," >>> ",chart.Symbol());
           }
        }
      //--- "Chart timeframe changed" event
      if(idx==CHART_OBJ_EVENT_CHART_TF_CHANGE)
        {
         //::EventChartCustom(this.m_chart_id_main,(ushort)event,this.m_chart_id,this.m_timeframe_prev,this.Symbol());
         long chart_id=lparam;
         ENUM_TIMEFRAMES timeframe_prev=(ENUM_TIMEFRAMES)dparam;
         string symbol=sparam;
         CChartObj *chart=engine.ChartGetChartObj(chart_id);
         if(chart!=NULL)
           {
            string header=chart.Symbol()+" "+TimeframeDescription(chart.Timeframe())+", ID "+(string)chart_id;
            Print
              (
               DFUN,CMessage::Text(MSG_CHART_COLLECTION_CHART_TF_CHANGED),": ",header,": ",
               TimeframeDescription(timeframe_prev)," >>> ",TimeframeDescription(chart.Timeframe())
              );
           }
        }
      //--- "Chart symbol and timeframe changed" event
      if(idx==CHART_OBJ_EVENT_CHART_SYMB_TF_CHANGE)
        {
         //::EventChartCustom(this.m_chart_id_main,(ushort)event,this.m_chart_id,this.m_timeframe_prev,this.m_symbol_prev);
         long chart_id=lparam;
         ENUM_TIMEFRAMES timeframe_prev=(ENUM_TIMEFRAMES)dparam;
         string symbol_prev=sparam;
         CChartObj *chart=engine.ChartGetChartObj(chart_id);
         if(chart!=NULL)
           {
            string header=chart.Symbol()+" "+TimeframeDescription(chart.Timeframe())+", ID "+(string)chart_id;
            Print
              (
               DFUN,CMessage::Text(MSG_CHART_COLLECTION_CHART_SYMB_TF_CHANGED),": ",header,": ",
               symbol_prev," >>> ",chart.Symbol(),", ",TimeframeDescription(timeframe_prev)," >>> ",TimeframeDescription(chart.Timeframe())
              );
           }
        }

      //--- "Adding a new window on the chart" event
      if(idx==CHART_OBJ_EVENT_CHART_WND_ADD)
        {
         //::EventChartCustom(this.m_chart_id_main,(ushort)event,this.m_chart_id,wnd.WindowNum(),this.Symbol());
         ENUM_TIMEFRAMES timeframe=WRONG_VALUE;
         string ind_name="";
         string symbol=sparam;
         long   chart_id=lparam;
         int    win_num=(int)dparam;
         string header=symbol+" "+TimeframeDescription(timeframe)+", ID "+(string)chart_id+": ";

         CChartObj *chart=engine.ChartGetLastOpenedChart();
         if(chart!=NULL)
           {
            timeframe=chart.Timeframe();
            CChartWnd *wnd=engine.ChartGetLastAddedChartWindow(chart.ID());
            if(wnd!=NULL)
              {
               CWndInd *ind=wnd.GetLastAddedIndicator();
               if(ind!=NULL)
                  ind_name=ind.Name();
              }
           }
         Print(DFUN,header,CMessage::Text(MSG_CHART_OBJ_WINDOW_ADDED)," ",(string)win_num," ",ind_name);
        }
      //--- "Removing a window from the chart" event
      if(idx==CHART_OBJ_EVENT_CHART_WND_DEL)
        {
         //::EventChartCustom(this.m_chart_id_main,(ushort)event,this.m_chart_id,wnd.WindowNum(),this.Symbol());
         CChartWnd *wnd=engine.ChartGetLastDeletedChartWindow();
         ENUM_TIMEFRAMES timeframe=WRONG_VALUE;
         string symbol=sparam;
         long   chart_id=lparam;
         int    win_num=(int)dparam;
         string header=symbol+" "+TimeframeDescription(timeframe)+", ID "+(string)chart_id+": ";
         Print(DFUN,header,CMessage::Text(MSG_CHART_OBJ_WINDOW_REMOVED)," ",(string)win_num);
        }
      //--- "Adding a new indicator to the chart window" event
      if(idx==CHART_OBJ_EVENT_CHART_WND_IND_ADD)
        {
         //::EventChartCustom(this.m_chart_id_main,(ushort)event,this.m_chart_id,this.WindowNum(),ind.Name());
         ENUM_TIMEFRAMES timeframe=WRONG_VALUE;
         string ind_name=sparam;
         string symbol=NULL;
         long   chart_id=lparam;
         int    win_num=(int)dparam;
         string header=NULL;

         CWndInd *ind=engine.ChartGetLastAddedIndicator(chart_id,win_num);
         if(ind!=NULL)
           {
            CChartObj *chart=engine.ChartGetChartObj(chart_id);
            if(chart!=NULL)
              {
               symbol=chart.Symbol();
               timeframe=chart.Timeframe();
               CChartWnd *wnd=chart.GetWindowByNum(win_num);
               if(wnd!=NULL)
                  header=wnd.Header();
              }
           }
         Print(DFUN,symbol," ",TimeframeDescription(timeframe),", ID ",chart_id,", ",header,": ",CMessage::Text(MSG_CHART_OBJ_INDICATOR_ADDED)," ",ind_name);
        }
      //--- "Removing an indicator from the chart window" event
      if(idx==CHART_OBJ_EVENT_CHART_WND_IND_DEL)
        {
         //::EventChartCustom(this.m_chart_id_main,(ushort)event,this.m_chart_id,this.WindowNum(),ind.Name());
         ENUM_TIMEFRAMES timeframe=WRONG_VALUE;
         string ind_name=sparam;
         string symbol=NULL;
         long   chart_id=lparam;
         int    win_num=(int)dparam;
         string header=NULL;

         CWndInd *ind=engine.ChartGetLastDeletedIndicator();
         if(ind!=NULL)
           {
            CChartObj *chart=engine.ChartGetChartObj(chart_id);
            if(chart!=NULL)
              {
               symbol=chart.Symbol();
               timeframe=chart.Timeframe();
               CChartWnd *wnd=chart.GetWindowByNum(win_num);
               if(wnd!=NULL)
                  header=wnd.Header();
              }
           }
         Print(DFUN,symbol," ",TimeframeDescription(timeframe),", ID ",chart_id,", ",header,": ",CMessage::Text(MSG_CHART_OBJ_INDICATOR_REMOVED)," ",ind_name);
        }
      //--- "Changing indicator parameters in the chart window" event
      if(idx==CHART_OBJ_EVENT_CHART_WND_IND_CHANGE)
        {
         //::EventChartCustom(this.m_chart_id_main,(ushort)event,this.m_chart_id,this.WindowNum(),ind.Name());
         ENUM_TIMEFRAMES timeframe=WRONG_VALUE;
         string ind_name=sparam;
         string symbol=NULL;
         long   chart_id=lparam;
         int    win_num=(int)dparam;
         string header=NULL;

         CWndInd *ind=NULL;
         CWndInd *ind_changed=engine.ChartGetLastChangedIndicator();
         if(ind_changed!=NULL)
           {
            ind=engine.ChartGetIndicator(chart_id,win_num,ind_changed.Index());
            if(ind!=NULL)
              {
               CChartObj *chart=engine.ChartGetChartObj(chart_id);
               if(chart!=NULL)
                 {
                  symbol=chart.Symbol();
                  timeframe=chart.Timeframe();
                  CChartWnd *wnd=chart.GetWindowByNum(win_num);
                  if(wnd!=NULL)
                     header=wnd.Header();
                 }
              }
           }
         Print(DFUN,symbol," ",TimeframeDescription(timeframe),", ID ",chart_id,", ",header,": ",CMessage::Text(MSG_CHART_OBJ_INDICATOR_CHANGED)," ",ind_name," >>> ",ind.Name());
        }
     }

//--- Handling trading events
这些就是测试新创建图表集合自动事件功能,和测试指定集合对象参数更改所需的所有修改。
设置使用 EURUSD、GBPUSD 和当前时间帧之后,编译 EA,并在 EURUSD 上启动它。
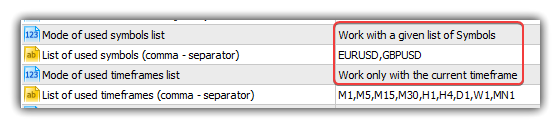
两个图表都应事先打开。 在 EURUSD 上启动 EA,而 GBPUSD 应该有一个含有任意振荡器指标的子窗口。 我们将利用子窗口来管理图表集合类的事件功能。
我们来检查图表时间帧变化事件:
现在我们来检查图表品种的变化:
此外,检查管理图表高度的变化(变化应用于两个图表 — 主图表窗口和子窗口):

正如我们所见,这里有几个标准在起作用:窗口高度等于指定大小,窗口高度高于/低于指定大小,窗口高度增加/减少超过指定的像素数。
下一步是什么?
下一篇文章将开启函数库开发的新阶段 — 操控图形对象和自定义图形。
以下是该函数库当前版本的所有文件,以及 MQL5 的测试 EA 文件,供您测试和下载。
在评论中留下您的问题、意见和建议。
*该系列的前几篇文章:
DoEasy 函数库中的其他类(第六十七部分):图表对象类
DoEasy 函数库中的其他类(第六十八部分):图表窗口对象类和图表窗口中的指标对象类
DoEasy 函数库中的其他类(第六十九部分):图表对象集合类
DoEasy 函数库中的其他类(第七十部分):扩展功能并自动更新图表对象集合
DoEasy 函数库中的其他类(第七十一部分):图表对象集合事件
本文由MetaQuotes Ltd译自俄文
原文地址: https://www.mql5.com/ru/articles/9385
注意: MetaQuotes Ltd.将保留所有关于这些材料的权利。全部或部分复制或者转载这些材料将被禁止。
本文由网站的一位用户撰写,反映了他们的个人观点。MetaQuotes Ltd 不对所提供信息的准确性负责,也不对因使用所述解决方案、策略或建议而产生的任何后果负责。

 来自专业程序员的提示(第二部分):在智能交易系统、脚本和外部程序之间存储和交换参数
Artem,我读了您写到 34 的文章。
在您的文章中,您已经完成了挂单请求,最后的视频显示您打开了一个订单,并挂单请求设置 TP SL,之后设置了 TP SL,但 SL 在一秒后被删除。
Poganyal 戳了一下面板,不能同时使用挂单请求中的点和时间,当触发或停止时被删除或采取。
我从第 72 条下载了 Expert Advisor,检查后发现问题相同,首先触发的是我最后点击的面板。
Artem,读完了您的文章,目前读到第 34 篇。
在您的文章中,您完成了挂单请求,最后的视频显示,您打开了一个订单,并挂单请求设置 TP SL,之后设置了一个 TP SL,但在一秒钟后,SL 被删除。
我在面板上查看了一下,我无法同时在点数和时间上使用挂单请求,触发后要么止损被删除,要么止盈被删除。
我从第 72 条下载了智能交易系统,检查后发现问题相同,第一个触发的是我在面板上最后点击的。
谢谢。我有时间再研究一下。乍一看,很可能是当一个待处理请求被触发时,其他请求被删除了。有时间我再看看。无论如何,程序库仍处于完善阶段,这样的 bug 有权利存在。最重要的是得到感兴趣者的反馈,然后一切都会得到修复。
谢谢。有时间我得去看看。乍一看,很可能是当一个待处理请求被触发时,其他请求也会被删除。有时间我再看看。无论如何,程序库仍处于完善阶段,这样的 bug 有权利存在。最重要的是,有兴趣的人应该提供反馈,然后一切都会得到修复。
我很感兴趣 )))阅读和理解仍然是我认为几个星期的文章,至少可以形象地理解一切是如何组织的,以及如何使用它......我无法想象在实践中还有多少)。
我已经等了很久了,什么时候才会有称职的文章,最重要的是,什么时候才会有在莫斯科交易所工作的成熟的 OOP 库。去年我因为生活所迫,没有访问过这个资源库,但这次我来到这里,却被成吨的顶级资料所震撼。
感谢你们所做的工作,老实说,我很高兴看到人们的大脑是如何在这个计划中工作的。
我很感兴趣 ))我想我将只读几周的文章,至少要形象地理解一切是如何工作的,以及如何使用它......我不知道在实践中还要读多少)。
我已经等了很久了,什么时候才会有称职的文章,最重要的是,什么时候才会有在莫斯科交易所工作的成熟的 OOP 库。去年,我因为生活所迫,没有访问该资源,但这次我来到这里,却被成吨的顶级资料吓了一跳。
感谢你们所做的工作,老实说,我很高兴看到人们的大脑是如何在这个计划中工作的。
感谢您的评估。事实上,这只是例行公事。
至于莫斯科交易所,这里的一切都需要彻底测试,找出漏洞。就像外汇交易一样。
谢谢你的评价。这其实只是例行公事。
至于莫斯科交易所,这里的一切都需要彻底测试,找出漏洞。就像外汇交易一样。
如果库允许您完全使用堆栈、指数-价格-交易量,那么我将在您的库上重建我的机器人并进行测试。
这可能会暴露出一些缺陷。
最重要的是不要放弃,内容非常好。