
Otras clases en la biblioteca DoEasy (Parte 72): Seguimiento y registro de parámetros de los objetos de gráfico en la colección

Contenido
Concepto
Este artículo será el último en la descripción de las clases de objetos de gráfico y su colección. Todos los gráficos abiertos en el terminal del cliente, así como sus subventanas y los indicadores en ellas ya están almacenados en la colección de gráficos. Si las propiedades del gráfico cambian, entonces ya procesaremos algunos eventos y enviaremos al gráfico del programa de control un evento personalizado sobre el cambio en el gráfico, su ventana o el indicador en la ventana del gráfico. Sin embargo, podemos cambiar las propiedades del objeto gráfico o su ventana; necesitaremos escribir los nuevos valores de las propiedades modificadas en los parámetros del objeto modificado.
Por fortuna, ya hace tiempo que creamos un objeto que ofrece funcionalidad de eventos a todos sus herederos (el objeto básico ampliado de todos los objetos de la biblioteca). Y nuestras clases de objetos de gráfico y ventanas de gráfico ya son sus herederas. Solo necesitaremos añadir para este objeto el procesamiento estándar de los cambios en las propiedades de su objeto descendiente: esta clase actualizará automáticamente todas las propiedades de su descendiente, y cuando cambien las propiedades establecidas, creará una lista con los eventos que han ocurrido con su objeto descendiente.
Para que los eventos que suceden en el objeto sean creados y enviados al gráfico del programa de control, será necesario que este indique todas las propiedades monitoreadas que queremos controlar en nuestro programa. El objeto básico ampliado nos permite establecer la magnitud de cambio de una propiedad específica o la superación de un umbral específico para la propiedad monitoreada, o bien una combinación de cambios en las propiedades a seguir.
Cualquier cambio introducido en las propiedades del objeto quedará automáticamente registrado en sus parámetros, y si hemos configurado los permisos para monitorear alguna de las propiedades del objeto, estas propiedades "indicarán" los cambios confirmados que queremos seguir.
Casi todos los objetos de la biblioteca tienen la misma estructura de construcción: un conjunto de propiedades (enteras, reales y string), criterios para clasificar objetos que se corresponden exclusivamente con las propiedades de cada objeto individual y algunos métodos para encontrar y clasificar dichos objetos en el listas donde se almacenan, así como métodos para describir las propiedades del objeto y una clase que permite realizar búsquedas en una lista de objetos según la propiedad especificada y retornar el índice del objeto en la lista con el valor máximo o mínimo de la propiedad necesaria.
Todas estas largas descripciones de las propiedades del objeto adjuntas al objeto en sí y vinculadas inseparablemente a él, complican un poco la creación del propio objeto, pero simplifican sustancialmente el trabajo posterior con el mismo. Pero, respecto a la clase del objeto de ventana del gráfico, resulta que la creamos inicialmente incompleta (como todos los objetos de la biblioteca principal), y simplificamos la tarea para no escribir todas sus propiedades por separado, colocándolas mejor en las propiedades del objeto de gráfico al que pertenecía esta ventana.
Ahora, al crear la actualización automática de las propiedades de los objetos de gráfico y sus subventanas, encontraremos una gran complicación al guardar el estado anterior de las propiedades del objeto de ventana del gráfico usando los métodos de su clase padre. Por consiguiente, hemos decido convertir el objeto de ventana del gráfico en un objeto de biblioteca completo, lo cual simplificará enormemente la creación de su actualización automática con búsqueda de eventos monitoreados (hemos implementado todo esto hace mucho, cuando creamos la clase padre: el objeto ampliado de todos los objetos de la biblioteca).
Mejorando las clases de la biblioteca
En el archivo \MQL5\Include\DoEasy\Data.mqh, añadimos los índices de los nuevos mensajes de la biblioteca:
   MSG_LIB_TEXT_SYMBOL,                               // symbol:
   MSG_LIB_TEXT_ACCOUNT,                              // account:
   MSG_LIB_TEXT_CHART,                                // chart:
   MSG_LIB_TEXT_CHART_WND,                            // chart window:
   MSG_LIB_TEXT_PROP_VALUE,                           // Property value
...
   MSG_CHART_COLLECTION_CHART_OPENED,                 // Chart opened
   MSG_CHART_COLLECTION_CHART_CLOSED,                 // Chart closed

   MSG_CHART_COLLECTION_CHART_SYMB_CHANGED,           // Chart symbol changed
   MSG_CHART_COLLECTION_CHART_TF_CHANGED,             // Chart timeframe changed
   MSG_CHART_COLLECTION_CHART_SYMB_TF_CHANGED,        // Chart symbol and timeframe changed

  };
//+------------------------------------------------------------------+
y los textos de los mensajes que se corresponden con los índices nuevamente añadidos:
   {"символа: ","symbol property: "},
   {"аккаунта: ","account property: "},
   {"чарта: ","chart property: "},
   {"окна чарта: ","chart window property: "},
   {"Значение свойства ","Value of the "},
...
   {"Открыт график","Open chart"},
   {"Закрыт график","Closed chart"},

   {"Изменён символ графика","Changed chart symbol"},
   {"Изменён таймфрейм графика","Changed chart timeframe"},
   {"Изменён символ и таймфрейм графика","Changed the symbol and timeframe of the chart"},

  };
//+---------------------------------------------------------------------+
En el archivo \MQL5\Include\DoEasy\Defines.mqh, en el apartado de los identificadores de las listas de las colecciones, añadimos el nuevo identificador de la lista de ventanas del gráfico:
//--- Collection list IDs
#define COLLECTION_HISTORY_ID          (0x777A)                   // Historical collection list ID
#define COLLECTION_MARKET_ID           (0x777B)                   // Market collection list ID
#define COLLECTION_EVENTS_ID           (0x777C)                   // Event collection list ID
#define COLLECTION_ACCOUNT_ID          (0x777D)                   // Account collection list ID
#define COLLECTION_SYMBOLS_ID          (0x777E)                   // Symbol collection list ID
#define COLLECTION_SERIES_ID           (0x777F)                   // Timeseries collection list ID
#define COLLECTION_BUFFERS_ID          (0x7780)                   // Indicator buffer collection list ID
#define COLLECTION_INDICATORS_ID       (0x7781)                   // Indicator collection list ID
#define COLLECTION_INDICATORS_DATA_ID  (0x7782)                   // Indicator data collection list ID
#define COLLECTION_TICKSERIES_ID       (0x7783)                   // Tick series collection list ID
#define COLLECTION_MBOOKSERIES_ID      (0x7784)                   // DOM series collection list ID
#define COLLECTION_MQL5_SIGNALS_ID     (0x7785)                   // MQL5 signals collection list ID
#define COLLECTION_CHARTS_ID           (0x7786)                   // Chart collection list ID
#define COLLECTION_CHART_WND_ID        (0x7787)                   // Chart window list ID
//--- Pending request type IDs
Según estos identificadores, podemos monitorear a qué colección o lista pertenece un objeto en particular. En este caso, necesitaremos este identificador para determinar de qué objeto procede el evento, y también para crear una descripción de este. Todo lo mencionado se realiza en la clase del objeto básico ampliado de todos los objetos de la biblioteca.
En el último artículo, creamos el manejador de algunos eventos del gráfico; hoy vamos a añadirles el cambio de símbolo y marco temporal del gráfico.
Para ello, añadiremos tres constantes adicionales a la enumeración de posibles eventos del gráfico en este mismo archivo:
//+------------------------------------------------------------------+
//| Data for working with charts                                     |
//+------------------------------------------------------------------+
//+------------------------------------------------------------------+
//| List of possible chart events                                    |
//+------------------------------------------------------------------+
enum ENUM_CHART_OBJ_EVENT
  {
   CHART_OBJ_EVENT_NO_EVENT = SIGNAL_MQL5_EVENTS_NEXT_CODE, // No event
   CHART_OBJ_EVENT_CHART_OPEN,                        // "New chart opening" event
   CHART_OBJ_EVENT_CHART_CLOSE,                       // "Chart closure" event
   CHART_OBJ_EVENT_CHART_SYMB_CHANGE,                 // "Chart symbol changed" event
   CHART_OBJ_EVENT_CHART_SYMB_TF_CHANGE,              // "Chart symbol and timeframe changed" event
   CHART_OBJ_EVENT_CHART_TF_CHANGE,                   // "Chart timeframe changed" event
   CHART_OBJ_EVENT_CHART_WND_ADD,                     // "Adding a new window on the chart" event
   CHART_OBJ_EVENT_CHART_WND_DEL,                     // "Removing a window from the chart" event
   CHART_OBJ_EVENT_CHART_WND_IND_ADD,                 // "Adding a new indicator to the chart window" event
   CHART_OBJ_EVENT_CHART_WND_IND_DEL,                 // "Removing an indicator from the chart window" event
   CHART_OBJ_EVENT_CHART_WND_IND_CHANGE,              // "Changing indicator parameters in the chart window" event
  };
#define CHART_OBJ_EVENTS_NEXT_CODE  (CHART_OBJ_EVENT_CHART_WND_IND_CHANGE+1)  // The code of the next event after the last chart event code
//+------------------------------------------------------------------+
De la enumeración de propiedades de tipo entero, quitamos el número de ventana del gráfico:
   CHART_PROP_WINDOW_NUM,                             // Chart window index
  };
esta propiedad pertenece a otro objeto, el objeto de ventana del gráfico,
Algunas propiedades comunes tanto al gráfico como a su ventana, las trasladaremos al final de la lista de constantes de la enumeración:
//+------------------------------------------------------------------+
//| Chart integer property                                           |
//+------------------------------------------------------------------+
enum ENUM_CHART_PROP_INTEGER
  {
   CHART_PROP_ID = 0,                                 // Chart ID
   CHART_PROP_TIMEFRAME,                              // Chart timeframe
   CHART_PROP_SHOW,                                   // Price chart drawing
   CHART_PROP_IS_OBJECT,                              // Chart object (OBJ_CHART) identification attribute
   CHART_PROP_BRING_TO_TOP,                           // Show chart above all others
   CHART_PROP_CONTEXT_MENU,                           // Enable/disable access to the context menu using the right click
   CHART_PROP_CROSSHAIR_TOOL,                         // Enable/disable access to the Crosshair tool using the middle click
   CHART_PROP_MOUSE_SCROLL,                           // Scroll the chart horizontally using the left mouse button
   CHART_PROP_EVENT_MOUSE_WHEEL,                      // Send messages about mouse wheel events (CHARTEVENT_MOUSE_WHEEL) to all MQL5 programs on a chart
   CHART_PROP_EVENT_MOUSE_MOVE,                       // Send messages about mouse button click and movement events (CHARTEVENT_MOUSE_MOVE) to all MQL5 programs on a chart
   CHART_PROP_EVENT_OBJECT_CREATE,                    // Send messages about the graphical object creation event (CHARTEVENT_OBJECT_CREATE) to all MQL5 programs on a chart
   CHART_PROP_EVENT_OBJECT_DELETE,                    // Send messages about the graphical object destruction event (CHARTEVENT_OBJECT_DELETE) to all MQL5 programs on a chart
   CHART_PROP_MODE,                                   // Type of the chart (candlesticks, bars or line (ENUM_CHART_MODE))
   CHART_PROP_FOREGROUND,                             // Price chart in the foreground
   CHART_PROP_SHIFT,                                  // Mode of shift of the price chart from the right border
   CHART_PROP_AUTOSCROLL,                             // The mode of automatic shift to the right border of the chart
   CHART_PROP_KEYBOARD_CONTROL,                       // Allow managing the chart using a keyboard
   CHART_PROP_QUICK_NAVIGATION,                       // Allow the chart to intercept Space and Enter key strokes to activate the quick navigation bar
   CHART_PROP_SCALE,                                  // Scale
   CHART_PROP_SCALEFIX,                               // Fixed scale mode
   CHART_PROP_SCALEFIX_11,                            // 1:1 scale mode
   CHART_PROP_SCALE_PT_PER_BAR,                       // The mode of specifying the scale in points per bar
   CHART_PROP_SHOW_TICKER,                            // Display a symbol ticker in the upper left corner
   CHART_PROP_SHOW_OHLC,                              // Display OHLC values in the upper left corner
   CHART_PROP_SHOW_BID_LINE,                          // Display Bid value as a horizontal line on the chart
   CHART_PROP_SHOW_ASK_LINE,                          // Display Ask value as a horizontal line on a chart
   CHART_PROP_SHOW_LAST_LINE,                         // Display Last value as a horizontal line on a chart
   CHART_PROP_SHOW_PERIOD_SEP,                        // Display vertical separators between adjacent periods
   CHART_PROP_SHOW_GRID,                              // Display a grid on the chart
   CHART_PROP_SHOW_VOLUMES,                           // Display volumes on a chart
   CHART_PROP_SHOW_OBJECT_DESCR,                      // Display text descriptions of objects
   CHART_PROP_VISIBLE_BARS,                           // Number of bars on a chart that are available for display
   CHART_PROP_WINDOWS_TOTAL,                          // The total number of chart windows including indicator subwindows
   CHART_PROP_WINDOW_HANDLE,                          // Chart window handle
   CHART_PROP_FIRST_VISIBLE_BAR,                      // Number of the first visible bar on the chart
   CHART_PROP_WIDTH_IN_BARS,                          // Width of the chart in bars
   CHART_PROP_WIDTH_IN_PIXELS,                        // Width of the chart in pixels
   CHART_PROP_COLOR_BACKGROUND,                       // Color of background of the chart
   CHART_PROP_COLOR_FOREGROUND,                       // Color of axes, scale and OHLC line
   CHART_PROP_COLOR_GRID,                             // Grid color
   CHART_PROP_COLOR_VOLUME,                           // Color of volumes and position opening levels
   CHART_PROP_COLOR_CHART_UP,                         // Color for the up bar, shadows and body borders of bull candlesticks
   CHART_PROP_COLOR_CHART_DOWN,                       // Color of down bar, its shadow and border of body of the bullish candlestick
   CHART_PROP_COLOR_CHART_LINE,                       // Color of the chart line and the Doji candlesticks
   CHART_PROP_COLOR_CANDLE_BULL,                      // Color of body of a bullish candlestick
   CHART_PROP_COLOR_CANDLE_BEAR,                      // Color of body of a bearish candlestick
   CHART_PROP_COLOR_BID,                              // Color of the Bid price line
   CHART_PROP_COLOR_ASK,                              // Color of the Ask price line
   CHART_PROP_COLOR_LAST,                             // Color of the last performed deal's price line (Last)
   CHART_PROP_COLOR_STOP_LEVEL,                       // Color of stop order levels (Stop Loss and Take Profit)
   CHART_PROP_SHOW_TRADE_LEVELS,                      // Display trade levels on the chart (levels of open positions, Stop Loss, Take Profit and pending orders)
   CHART_PROP_DRAG_TRADE_LEVELS,                      // Enable the ability to drag trading levels on a chart using mouse
   CHART_PROP_SHOW_DATE_SCALE,                        // Display the time scale on a chart
   CHART_PROP_SHOW_PRICE_SCALE,                       // Display a price scale on a chart
   CHART_PROP_SHOW_ONE_CLICK,                         // Display the quick trading panel on the chart
   CHART_PROP_IS_MAXIMIZED,                           // Chart window maximized
   CHART_PROP_IS_MINIMIZED,                           // Chart window minimized
   CHART_PROP_IS_DOCKED,                              // Chart window docked
   CHART_PROP_FLOAT_LEFT,                             // Left coordinate of the undocked chart window relative to the virtual screen
   CHART_PROP_FLOAT_TOP,                              // Upper coordinate of the undocked chart window relative to the virtual screen
   CHART_PROP_FLOAT_RIGHT,                            // Right coordinate of the undocked chart window relative to the virtual screen
   CHART_PROP_FLOAT_BOTTOM,                           // Bottom coordinate of the undocked chart window relative to the virtual screen
   CHART_PROP_YDISTANCE,                              // Distance in Y axis pixels between the upper frame of the indicator subwindow and the upper frame of the chart main window
   CHART_PROP_HEIGHT_IN_PIXELS,                       // Height of the chart in pixels
   CHART_PROP_WINDOW_IND_HANDLE,                      // Indicator handle on the chart
   CHART_PROP_WINDOW_IND_INDEX,                       // Indicator index on the chart
  };
#define CHART_PROP_INTEGER_TOTAL (66)                 // Total number of integer properties
#define CHART_PROP_INTEGER_SKIP  (2)                  // Number of integer properties not used in sorting
//+------------------------------------------------------------------+
En este caso, hemos reducido en 1 el número de propiedades de tipo entero del gráfico: vamos a escribir 66 en lugar de 67, indicando a continuación que las dos últimas propiedades no deberán tomar parte en la búsqueda y la clasificación; por consiguiente, dichas propiedades no se representarán en las propiedades del grafico. Estas constantes son necesarias para la clase del objeto de indicador en la ventana del gráfico (también se ha implementado como versión simplificada).
De acuerdo con los cambios introducidos en la enumeración de las propiedades del gráfico, debemos realizar las modificaciones correspondientes en la enumeración de los criterios de clasificación de los objetos de gráfico:
//+------------------------------------------------------------------+
//| Possible chart sorting criteria                                  |
//+------------------------------------------------------------------+
#define FIRST_CHART_DBL_PROP  (CHART_PROP_INTEGER_TOTAL-CHART_PROP_INTEGER_SKIP)
#define FIRST_CHART_STR_PROP  (CHART_PROP_INTEGER_TOTAL-CHART_PROP_INTEGER_SKIP+CHART_PROP_DOUBLE_TOTAL-CHART_PROP_DOUBLE_SKIP)
enum ENUM_SORT_CHART_MODE
  {
//--- Sort by integer properties
   SORT_BY_CHART_ID = 0,                              // Sort by chart ID
   SORT_BY_CHART_TIMEFRAME,                           // Sort by chart timeframe
   SORT_BY_CHART_SHOW,                                // Sort by the price chart drawing attribute
   SORT_BY_CHART_IS_OBJECT,                           // Sort by chart object (OBJ_CHART) identification attribute
   SORT_BY_CHART_BRING_TO_TOP,                        // Sort by the flag of displaying a chart above all others
   SORT_BY_CHART_CONTEXT_MENU,                        // Sort by the flag of enabling/disabling access to the context menu using the right click
   SORT_BY_CHART_CROSSHAIR_TOO,                       // Sort by the flag of enabling/disabling access to the Crosshair tool using the middle click
   SORT_BY_CHART_MOUSE_SCROLL,                        // Sort by the flag of scrolling the chart horizontally using the left mouse button
   SORT_BY_CHART_EVENT_MOUSE_WHEEL,                   // Sort by the flag of sending messages about mouse wheel events to all MQL5 programs on a chart
   SORT_BY_CHART_EVENT_MOUSE_MOVE,                    // Sort by the flag of sending messages about mouse button click and movement events to all MQL5 programs on a chart
   SORT_BY_CHART_EVENT_OBJECT_CREATE,                 // Sort by the flag of sending messages about the graphical object creation event to all MQL5 programs on a chart
   SORT_BY_CHART_EVENT_OBJECT_DELETE,                 // Sort by the flag of sending messages about the graphical object destruction event to all MQL5 programs on a chart
   SORT_BY_CHART_MODE,                                // Sort by chart type
   SORT_BY_CHART_FOREGROUND,                          // Sort by the "Price chart in the foreground" flag
   SORT_BY_CHART_SHIFT,                               // Sort by the "Mode of shift of the price chart from the right border" flag
   SORT_BY_CHART_AUTOSCROLL,                          // Sort by the "The mode of automatic shift to the right border of the chart" flag
   SORT_BY_CHART_KEYBOARD_CONTROL,                    // Sort by the flag allowing the chart management using a keyboard
   SORT_BY_CHART_QUICK_NAVIGATION,                    // Sort by the flag allowing the chart to intercept Space and Enter key strokes to activate the quick navigation bar
   SORT_BY_CHART_SCALE,                               // Sort by scale
   SORT_BY_CHART_SCALEFIX,                            // Sort by the fixed scale flag
   SORT_BY_CHART_SCALEFIX_11,                         // Sort by the 1:1 scale flag
   SORT_BY_CHART_SCALE_PT_PER_BAR,                    // Sort by the flag of specifying the scale in points per bar
   SORT_BY_CHART_SHOW_TICKER,                         // Sort by the flag displaying a symbol ticker in the upper left corner
   SORT_BY_CHART_SHOW_OHLC,                           // Sort by the flag displaying OHLC values in the upper left corner
   SORT_BY_CHART_SHOW_BID_LINE,                       // Sort by the flag displaying Bid value as a horizontal line on the chart
   SORT_BY_CHART_SHOW_ASK_LINE,                       // Sort by the flag displaying Ask value as a horizontal line on the chart
   SORT_BY_CHART_SHOW_LAST_LINE,                      // Sort by the flag displaying Last value as a horizontal line on the chart
   SORT_BY_CHART_SHOW_PERIOD_SEP,                     // Sort by the flag displaying vertical separators between adjacent periods
   SORT_BY_CHART_SHOW_GRID,                           // Sort by the flag of displaying a grid on the chart
   SORT_BY_CHART_SHOW_VOLUMES,                        // Sort by the mode of displaying volumes on a chart
   SORT_BY_CHART_SHOW_OBJECT_DESCR,                   // Sort by the flag of displaying object text descriptions
   SORT_BY_CHART_VISIBLE_BARS,                        // Sort by the number of bars on a chart that are available for display
   SORT_BY_CHART_WINDOWS_TOTAL,                       // Sort by the total number of chart windows including indicator subwindows
   SORT_BY_CHART_WINDOW_HANDLE,                       // Sort by the chart handle
   SORT_BY_CHART_FIRST_VISIBLE_BAR,                   // Sort by the number of the first visible bar on the chart
   SORT_BY_CHART_WIDTH_IN_BARS,                       // Sort by the width of the chart in bars
   SORT_BY_CHART_WIDTH_IN_PIXELS,                     // Sort by the width of the chart in pixels
   SORT_BY_CHART_COLOR_BACKGROUND,                    // Sort by the color of the chart background
   SORT_BY_CHART_COLOR_FOREGROUND,                    // Sort by color of axes, scale and OHLC line
   SORT_BY_CHART_COLOR_GRID,                          // Sort by grid color
   SORT_BY_CHART_COLOR_VOLUME,                        // Sort by the color of volumes and position opening levels
   SORT_BY_CHART_COLOR_CHART_UP,                      // Sort by the color for the up bar, shadows and body borders of bull candlesticks
   SORT_BY_CHART_COLOR_CHART_DOWN,                    // Sort by the color of down bar, its shadow and border of body of the bullish candlestick
   SORT_BY_CHART_COLOR_CHART_LINE,                    // Sort by the color of the chart line and the Doji candlesticks
   SORT_BY_CHART_COLOR_CANDLE_BULL,                   // Sort by the color of a bullish candlestick body
   SORT_BY_CHART_COLOR_CANDLE_BEAR,                   // Sort by the color of a bearish candlestick body
   SORT_BY_CHART_COLOR_BID,                           // Sort by the color of the Bid price line
   SORT_BY_CHART_COLOR_ASK,                           // Sort by the color of the Ask price line
   SORT_BY_CHART_COLOR_LAST,                          // Sort by the color of the last performed deal's price line (Last)
   SORT_BY_CHART_COLOR_STOP_LEVEL,                    // Sort by the color of stop order levels (Stop Loss and Take Profit)
   SORT_BY_CHART_SHOW_TRADE_LEVELS,                   // Sort by the flag of displaying trading levels on the chart
   SORT_BY_CHART_DRAG_TRADE_LEVELS,                   // Sort by the flag enabling the ability to drag trading levels on a chart using mouse
   SORT_BY_CHART_SHOW_DATE_SCALE,                     // Sort by the flag of displaying the time scale on the chart
   SORT_BY_CHART_SHOW_PRICE_SCALE,                    // Sort by the flag of displaying the price scale on the chart
   SORT_BY_CHART_SHOW_ONE_CLICK,                      // Sort by the flag of displaying the quick trading panel on the chart
   SORT_BY_CHART_IS_MAXIMIZED,                        // Sort by the "Chart window maximized" flag
   SORT_BY_CHART_IS_MINIMIZED,                        // Sort by the "Chart window minimized" flag
   SORT_BY_CHART_IS_DOCKED,                           // Sort by the "Chart window docked" flag
   SORT_BY_CHART_FLOAT_LEFT,                          // Sort by the left coordinate of the undocked chart window relative to the virtual screen
   SORT_BY_CHART_FLOAT_TOP,                           // Sort by the upper coordinate of the undocked chart window relative to the virtual screen
   SORT_BY_CHART_FLOAT_RIGHT,                         // Sort by the right coordinate of the undocked chart window relative to the virtual screen
   SORT_BY_CHART_FLOAT_BOTTOM,                        // Sort by the bottom coordinate of the undocked chart window relative to the virtual screen
   SORT_BY_CHART_YDISTANCE,                           // Sort by the distance in Y axis pixels between the upper frame of the indicator subwindow and the upper frame of the chart main window
   SORT_BY_CHART_HEIGHT_IN_PIXELS,                    // Sort by the height of the chart in pixels
//--- Sort by real properties
   SORT_BY_CHART_SHIFT_SIZE = FIRST_CHART_DBL_PROP,   // Sort by the shift size of the zero bar from the right border in %
   SORT_BY_CHART_FIXED_POSITION,                      // Sort by the chart fixed position from the left border in %
   SORT_BY_CHART_FIXED_MAX,                           // Sort by the fixed chart maximum
   SORT_BY_CHART_FIXED_MIN,                           // Sort by the fixed chart minimum
   SORT_BY_CHART_POINTS_PER_BAR,                      // Sort by the scale value in points per bar
   SORT_BY_CHART_PRICE_MIN,                           // Sort by the chart minimum
   SORT_BY_CHART_PRICE_MAX,                           // Sort by the chart maximum
//--- Sort by string properties
   SORT_BY_CHART_COMMENT = FIRST_CHART_STR_PROP,      // Sort by a comment text on the chart
   SORT_BY_CHART_EXPERT_NAME,                         // Sort by a name of an EA launched on the chart
   SORT_BY_CHART_SCRIPT_NAME,                         // Sort by a name of a script launched on the chart
   SORT_BY_CHART_INDICATOR_NAME,                      // Sort by a name of an indicator launched in the chart window
   SORT_BY_CHART_SYMBOL,                              // Sort by chart symbol
  };
//+------------------------------------------------------------------+
Si miramos de cerca los criterios usados para realizar la clasificación según las propiedades de tipo entero, veremos que no están las dos últimas propiedades, porque las implementamos como no utilizadas en la clasificación; por ello, no hay necesidad de introducirlas aquí, cada criterio de clasificación según una cierta propiedad se corresponde estrictamente con el valor numérico de una constante de las propiedades de enumeración del objeto.
Como ahora vamos a rellenar el objeto de ventana del gráfico, deberemos escribir las enumeraciones de sus propiedades de tipo entero, real y string:
//+------------------------------------------------------------------+
//| Data for handling chart windows                                  |
//+------------------------------------------------------------------+
//+------------------------------------------------------------------+
//| Chart window integer properties                                  |
//+------------------------------------------------------------------+
enum ENUM_CHART_WINDOW_PROP_INTEGER
  {
   CHART_WINDOW_PROP_ID = 0,                          // Chart ID
   CHART_WINDOW_PROP_WINDOW_NUM,                      // Chart window index
   CHART_WINDOW_PROP_YDISTANCE,                       // Distance in Y axis pixels between the upper frame of the indicator subwindow and the upper frame of the chart main window
   CHART_WINDOW_PROP_HEIGHT_IN_PIXELS,                // Height of the chart in pixels
   //--- for CWndInd
   CHART_WINDOW_PROP_WINDOW_IND_HANDLE,               // Indicator handle in the chart window
   CHART_WINDOW_PROP_WINDOW_IND_INDEX,                // Indicator index in the chart window
  };
#define CHART_WINDOW_PROP_INTEGER_TOTAL (6)           // Total number of integer properties
#define CHART_WINDOW_PROP_INTEGER_SKIP  (0)           // Number of integer DOM properties not used in sorting
//+------------------------------------------------------------------+
//| Chart window real properties                                     |
//+------------------------------------------------------------------+
enum ENUM_CHART_WINDOW_PROP_DOUBLE
  {
   CHART_WINDOW_PROP_PRICE_MIN = CHART_WINDOW_PROP_INTEGER_TOTAL, // Chart minimum
   CHART_WINDOW_PROP_PRICE_MAX,                       // Chart maximum
  };
#define CHART_WINDOW_PROP_DOUBLE_TOTAL  (2)           // Total number of real properties
#define CHART_WINDOW_PROP_DOUBLE_SKIP   (0)           // Number of real properties not used in sorting
//+------------------------------------------------------------------+
//| Chart window string properties                                   |
//+------------------------------------------------------------------+
enum ENUM_CHART_WINDOW_PROP_STRING
  {
   CHART_WINDOW_PROP_IND_NAME = (CHART_WINDOW_PROP_INTEGER_TOTAL+CHART_WINDOW_PROP_DOUBLE_TOTAL), // Name of the indicator launched in the window
   CHART_WINDOW_PROP_SYMBOL,                          // Chart symbol
  };
#define CHART_WINDOW_PROP_STRING_TOTAL  (2)           // Total number of string properties
//+------------------------------------------------------------------+
Finalmente, introduciremos la enumeración de posibles criterios para clasificar los objetos de ventana del gráfico:
//+------------------------------------------------------------------+
//| Possible criteria of sorting chart windows                       |
//+------------------------------------------------------------------+
#define FIRST_CHART_WINDOW_DBL_PROP  (CHART_WINDOW_PROP_INTEGER_TOTAL-CHART_WINDOW_PROP_INTEGER_SKIP)
#define FIRST_CHART_WINDOW_STR_PROP  (CHART_WINDOW_PROP_INTEGER_TOTAL-CHART_WINDOW_PROP_INTEGER_SKIP+CHART_WINDOW_PROP_DOUBLE_TOTAL-CHART_WINDOW_PROP_DOUBLE_SKIP)
enum ENUM_SORT_CHART_WINDOW_MODE
  {
//--- Sort by integer properties
   SORT_BY_CHART_WINDOW_ID = 0,                       // Sort by chart ID
   SORT_BY_CHART_WINDOW_NUM,                          // Sort by chart window index
   SORT_BY_CHART_WINDOW_YDISTANCE,                    // Sort by the distance in Y axis pixels between the upper frame of the indicator subwindow and the upper frame of the chart main window
   SORT_BY_CHART_WINDOW_HEIGHT_IN_PIXELS,             // Sort by the height of the chart in pixels
   SORT_BY_CHART_WINDOW_IND_HANDLE,                   // Sort by the indicator handle in the chart window
   SORT_BY_CHART_WINDOW_IND_INDEX,                    // Sort by the indicator index in the chart window
//--- Sort by real properties
   SORT_BY_CHART_WINDOW_PRICE_MIN = FIRST_CHART_WINDOW_DBL_PROP,  // Sort by chart window minimum
   SORT_BY_CHART_WINDOW_PRICE_MAX,                    // Sort by chart window maximum
//--- Sort by string properties
   SORT_BY_CHART_WINDOW_IND_NAME = FIRST_CHART_WINDOW_STR_PROP,   // Sort by name of an indicator launched in the window
   SORT_BY_CHART_WINDOW_SYMBOL,                       // Sort by chart symbol
  };
//+------------------------------------------------------------------+
Volviendo al identificador de la lista de objetos de ventana del gráfico, no debemos olvidar que necesitamos modificar el objeto CBaseObjExt básico ampliado cuya clase está escrita en el archivo de clase del objeto básico \MQL5\Include\DoEasy\Objects\BaseObj.mqh.
Todo lo que necesitamos hacer en él es añadir a su método EventDescription() el procesamiento de las dos nuevas listas a las que pertenecen los objetos que heredarán esta clase: el objeto de gráfico y el objeto de ventana del gráfico:
//+------------------------------------------------------------------+
//| Return an object event description                               |
//+------------------------------------------------------------------+
string CBaseObjExt::EventDescription(const int property,
                                  const ENUM_BASE_EVENT_REASON reason,
                                  const int source,
                                  const string value,
                                  const string property_descr,
                                  const int digits)
  {
//--- Depending on the collection ID, create th object type description
   string type=
     (
      this.Type()==COLLECTION_SYMBOLS_ID     ? CMessage::Text(MSG_LIB_TEXT_SYMBOL)     :
      this.Type()==COLLECTION_ACCOUNT_ID     ?  CMessage::Text(MSG_LIB_TEXT_ACCOUNT)   :
      this.Type()==COLLECTION_CHARTS_ID      ?  CMessage::Text(MSG_LIB_TEXT_CHART)     :
      this.Type()==COLLECTION_CHART_WND_ID   ?  CMessage::Text(MSG_LIB_TEXT_CHART_WND) :
      ""
     );
//--- Depending on the property type, create the property change value description
   string level=
     (
      property<this.m_long_prop_total ?
      ::DoubleToString(this.GetControlledLongValueLEVEL(property),digits) :
      ::DoubleToString(this.GetControlledDoubleValueLEVEL(property),digits)
     );
//--- Depending on the event reason, create the event description text
   string res=
     (
      reason==BASE_EVENT_REASON_INC       ?  CMessage::Text(MSG_LIB_TEXT_PROP_VALUE)+type+property_descr+CMessage::Text(MSG_LIB_TEXT_INC_BY)+value    :
      reason==BASE_EVENT_REASON_DEC       ?  CMessage::Text(MSG_LIB_TEXT_PROP_VALUE)+type+property_descr+CMessage::Text(MSG_LIB_TEXT_DEC_BY)+value    :
      reason==BASE_EVENT_REASON_MORE_THEN ?  CMessage::Text(MSG_LIB_TEXT_PROP_VALUE)+type+property_descr+CMessage::Text(MSG_LIB_TEXT_MORE_THEN)+level :
      reason==BASE_EVENT_REASON_LESS_THEN ?  CMessage::Text(MSG_LIB_TEXT_PROP_VALUE)+type+property_descr+CMessage::Text(MSG_LIB_TEXT_LESS_THEN)+level :
      reason==BASE_EVENT_REASON_EQUALS    ?  CMessage::Text(MSG_LIB_TEXT_PROP_VALUE)+type+property_descr+CMessage::Text(MSG_LIB_TEXT_EQUAL)+level     :
      CMessage::Text(MSG_LIB_TEXT_BASE_OBJ_UNKNOWN_EVENT)+type
     );
//--- Return the object name+created event description text
   return this.m_name+": "+res;
  }
//+------------------------------------------------------------------+
El lector encontrará más información sobre el funcionamiento de esta clase en el artículo 37.
Bueno, vamos a corregir un pequeño descuido cometido en el diseño. Para ello, modificaremos la clase de objeto de la ventana del gráfico hasta formar una clase completa, como se ha hecho con otros objetos de la biblioteca principal. Necesitaremos añadir las matrices necesarias para almacenar las propiedades del objeto, los métodos para configurar y retornar sus propiedades (reharemos los métodos listos para usar) y los métodos para mostrar la información sobre las propiedades del objeto.
Abrimos el archivo \MQL5\Include\DoEasy\Objects\Chart\ChartWnd.mqh y realizamos las correcciones necesarias. El mismo archivo contiene la clase auxiliar del objeto de indicador en la ventana. Como hemos cambiado algunas propiedades de estos objetos, en el método Compare() de la clase CWndInd añadiremos las constantes de las nuevas enumeraciones:
//+------------------------------------------------------------------+
//| Compare CWndInd objects with each other by the specified property|
//+------------------------------------------------------------------+
int CWndInd::Compare(const CObject *node,const int mode=0) const
  {
   const CWndInd *obj_compared=node;
   if(mode==CHART_WINDOW_PROP_WINDOW_IND_HANDLE) return(this.Handle()>obj_compared.Handle() ? 1 : this.Handle()<obj_compared.Handle() ? -1 : 0);
   else if(mode==CHART_WINDOW_PROP_WINDOW_IND_INDEX) return(this.Index()>obj_compared.Index() ? 1 : this.Index()<obj_compared.Index() ? -1 : 0);
   return(this.Name()==obj_compared.Name() ? 0 : this.Name()<obj_compared.Name() ? -1 : 1);
  }
//+------------------------------------------------------------------+
Anteriormente, estas constantes ya se habían eliminado de otra enumeración CHART_PROP_WINDOW_IND_HANDLE y de CHART_PROP_WINDOW_IND_INDEX.
En la sección pública de la clase, añadimos la variable m_digits para guardar Digits() del símbolo del gráfico, las matrices para guardar las propiedades de tipo entero, real y string, y también los métodos para retornar el índice real de las propiedades de tipo real y string en la matriz correspondiente:
//+------------------------------------------------------------------+
//| Chart window object class                                        |
//+------------------------------------------------------------------+
class CChartWnd : public CBaseObjExt
  {
private:
   CArrayObj         m_list_ind;                                        // Indicator list
   CArrayObj        *m_list_ind_del;                                    // Pointer to the list of indicators removed from the indicator window
   CArrayObj        *m_list_ind_param;                                  // Pointer to the list of changed indicators
   long              m_long_prop[CHART_WINDOW_PROP_INTEGER_TOTAL];      // Integer properties
   double            m_double_prop[CHART_WINDOW_PROP_DOUBLE_TOTAL];     // Real properties
   string            m_string_prop[CHART_WINDOW_PROP_STRING_TOTAL];     // String properties
   int               m_digits;                                          // Symbol's Digits()
   int               m_wnd_coord_x;                                     // The X coordinate for the time on the chart in the window
   int               m_wnd_coord_y;                                     // The Y coordinate for the price on the chart in the window
//--- Return the index of the array the (1) double and (2) string properties are actually located at
   int               IndexProp(ENUM_CHART_WINDOW_PROP_DOUBLE property)  const { return(int)property-CHART_WINDOW_PROP_INTEGER_TOTAL;                                 }
   int               IndexProp(ENUM_CHART_WINDOW_PROP_STRING property)  const { return(int)property-CHART_WINDOW_PROP_INTEGER_TOTAL-CHART_WINDOW_PROP_DOUBLE_TOTAL;  }
En la sección pública de la clase, escribimos los métodos para configurar y para retornar las propiedades del objeto especificado:
public:
//--- Set object's (1) integer, (2) real and (3) string properties
   void              SetProperty(ENUM_CHART_WINDOW_PROP_INTEGER property,long value)   { this.m_long_prop[property]=value;                      }
   void              SetProperty(ENUM_CHART_WINDOW_PROP_DOUBLE property,double value)  { this.m_double_prop[this.IndexProp(property)]=value;    }
   void              SetProperty(ENUM_CHART_WINDOW_PROP_STRING property,string value)  { this.m_string_prop[this.IndexProp(property)]=value;    }
//--- Return object’s (1) integer, (2) real and (3) string property from the properties array
   long              GetProperty(ENUM_CHART_WINDOW_PROP_INTEGER property)        const { return this.m_long_prop[property];                     }
   double            GetProperty(ENUM_CHART_WINDOW_PROP_DOUBLE property)         const { return this.m_double_prop[this.IndexProp(property)];   }
   string            GetProperty(ENUM_CHART_WINDOW_PROP_STRING property)         const { return this.m_string_prop[this.IndexProp(property)];   }
//--- Return itself
   CChartWnd        *GetObject(void)                                                   { return &this;   }
Todos los métodos que retornan las banderas sobre el soporte por parte del objeto de la propiedad de tipo de entero, real o string especificada, retornarán true : cada una de las propiedades es compatible; mientras que los métodos que retornan las descripciones de las propiedades del objeto simplemente se declararán aquí, y su implementación se escribirá fuera del cuerpo de la clase (concretamente, ahora tenemos que el método que retorna la descripción de una propiedad real devuelve el texto "la propiedad no es compatible"; así que trasladaremos su implementación fuera del cuerpo de la clase, ya que las otras dos ya se han escrito):
//--- Return itself
   CChartWnd        *GetObject(void)                                                   { return &this;   }

//--- Return the flag of the object supporting this property
   virtual bool      SupportProperty(ENUM_CHART_WINDOW_PROP_INTEGER property)          { return true;    }
   virtual bool      SupportProperty(ENUM_CHART_WINDOW_PROP_DOUBLE property)           { return true;    }
   virtual bool      SupportProperty(ENUM_CHART_WINDOW_PROP_STRING property)           { return true;    }

//--- Get description of (1) integer, (2) real and (3) string properties
   string            GetPropertyDescription(ENUM_CHART_WINDOW_PROP_INTEGER property);
   string            GetPropertyDescription(ENUM_CHART_WINDOW_PROP_DOUBLE property);
   string            GetPropertyDescription(ENUM_CHART_WINDOW_PROP_STRING property);
Todas las apariciones de la línea "this.m_window_num" las reemplazaremos con la línea "this.WindowNum()" (sin comillas, por supuesto): como eliminamos la variable m_window_num, y ahora el número de ventana estará ubicado en las propiedades del objeto, retornaremos el valor de esta propiedad utilizando el método WindowNum ().
El método WindowNum() antes retornaba el valor de la variable m_window_num:
int WindowNum(void) const { return this.m_window_num; }
Ahora, este método retornará la propiedad del objeto:
int WindowNum(void) const { return (int)this.GetProperty(CHART_WINDOW_PROP_WINDOW_NUM); }
Vamos a añadir dos métodos para retornar las propiedades reales y a corregir los métodos existentes para retornar y establecer los valores no de las variables, sino de las propiedades de objeto correspondientes:
//--- Return (1) the subwindow index, (2) the number of indicators attached to the window, (3) the name of a symbol chart, as well as (4) the highest and (5) lowest prices
   int               WindowNum(void)                              const { return (int)this.GetProperty(CHART_WINDOW_PROP_WINDOW_NUM);     }
   int               IndicatorsTotal(void)                        const { return this.m_list_ind.Total();                                 }
   string            Symbol(void)                                 const { return this.GetProperty(CHART_WINDOW_PROP_SYMBOL);              }
   double            PriceMax(void)                               const { return this.GetProperty(CHART_WINDOW_PROP_PRICE_MAX);           }
   double            PriceMin(void)                               const { return this.GetProperty(CHART_WINDOW_PROP_PRICE_MIN);           }
//--- Set (1) the subwindow index and (2) the chart symbol
   void              SetWindowNum(const int num)                        { this.SetProperty(CHART_WINDOW_PROP_WINDOW_NUM,num);             }
   void              SetSymbol(const string symbol)                     { this.SetProperty(CHART_WINDOW_PROP_SYMBOL,symbol);              }
Para implementar la actualización automática de las propiedades del objeto ofrecidas por la clase CBaseObjExt, que es la clase padre de la clase editada, necesitaremos implementar algunos cambios en sus métodos Refresh(). Para organizar la funcionalidad del evento, además, añadiremos los métodos necesarios para configurar los valores de las propiedades monitoreadas del objeto y los valores de propiedad controlados: para encontrar los momentos de intersección de los valores monitoreados especificados por los valores de las propiedades de los objetos que controlamos.
En principio, no podemos usar estos métodos: la clase CBaseObjExt ya ofrece la capacidad de establecer los valores de control y las propiedades monitoreadas, pero, como la clase es universal, sus métodos resultan bastante abstractos, así que deberemos recordar los nombres de las constantes que necesitamos para controlar las propiedades. Y esto es un inconveniente. Por consiguiente, añadiremos dichos métodos a las clases que operan usando como base la clase del objeto extendido CBaseObjExt: estas indican explícitamente lo que asignamos al objeto con su ayuda.
Entonces, al final de la lista del cuerpo de la clase, escribiremos dos bloques de código para configurar las propiedades monitoreadas para la distancia en píxeles entre los marcos de las ventanas y para la altura de la ventana del gráfico en píxeles:
//+------------------------------------------------------------------+
//| Get and set the parameters of tracked property changes           |
//+------------------------------------------------------------------+
//--- Distance in Y axis pixels between the upper frame of the indicator subwindow and the upper frame of the chart main window
//--- set the controlled (1) growth, (2) decrease, (3) reference distance level in pixels by the vertical Y axis between the window frames
//--- get (4) the distance change in pixels by the vertical Y axis between the window frames,
//--- get the distance change flag in pixels by the vertical Y axis between the window frames exceeding the (5) growth and (6) decrease values
   void              SetControlWindowYDistanceInc(const long value)        { this.SetControlledValueINC(CHART_WINDOW_PROP_YDISTANCE,(long)::fabs(value));         }
   void              SetControlWindowYDistanceDec(const long value)        { this.SetControlledValueDEC(CHART_WINDOW_PROP_YDISTANCE,(long)::fabs(value));         }
   void              SetControlWindowYDistanceLevel(const long value)      { this.SetControlledValueLEVEL(CHART_WINDOW_PROP_YDISTANCE,(long)::fabs(value));       }
   long              GetValueChangedWindowYDistance(void)            const { return this.GetPropLongChangedValue(CHART_WINDOW_PROP_YDISTANCE);                    }
   bool              IsIncreasedWindowYDistance(void)                const { return (bool)this.GetPropLongFlagINC(CHART_WINDOW_PROP_YDISTANCE);                   }
   bool              IsDecreasedWindowYDistance(void)                const { return (bool)this.GetPropLongFlagDEC(CHART_WINDOW_PROP_YDISTANCE);                   }

//--- Height of the chart in pixels
//--- setting the controlled spread (1) increase, (2) decrease value and (3) reference chart height in pixels
//--- get (4) the chart height change in pixels,
//--- get the flag of the chart height change in pixels exceeding (5) the growth and (6) decrease values
   void              SetControlHeightInPixelsInc(const long value)         { this.SetControlledValueINC(CHART_WINDOW_PROP_HEIGHT_IN_PIXELS,(long)::fabs(value));   }
   void              SetControlHeightInPixelsDec(const long value)         { this.SetControlledValueDEC(CHART_WINDOW_PROP_HEIGHT_IN_PIXELS,(long)::fabs(value));   }
   void              SetControlHeightInPixelsLevel(const long value)       { this.SetControlledValueLEVEL(CHART_WINDOW_PROP_HEIGHT_IN_PIXELS,(long)::fabs(value)); }
   long              GetValueChangedHeightInPixels(void)             const { return this.GetPropLongChangedValue(CHART_WINDOW_PROP_HEIGHT_IN_PIXELS);              }
   bool              IsIncreasedHeightInPixels(void)                 const { return (bool)this.GetPropLongFlagINC(CHART_WINDOW_PROP_HEIGHT_IN_PIXELS);             }
   bool              IsDecreasedHeightInPixels(void)                 const { return (bool)this.GetPropLongFlagDEC(CHART_WINDOW_PROP_HEIGHT_IN_PIXELS);             }

  };
//+------------------------------------------------------------------+
Ahora podemos establecer los valores de seguimiento deseados para estas propiedades en nuestro programa; la biblioteca los monitoreará automáticamente y enviará los eventos ocurridos con estas propiedades al gráfico del programa de control, donde podremos procesarlos. Ya analizamos con detalle todo esto al crear el objeto básico ampliado de todos los objetos de la biblioteca.
El constructor paramétrico de la clase ha sufrido cambios:
//+------------------------------------------------------------------+
//| Parametric constructor                                           |
//+------------------------------------------------------------------+
CChartWnd::CChartWnd(const long chart_id,const int wnd_num,const string symbol,CArrayObj *list_ind_del,CArrayObj *list_ind_param) : m_wnd_coord_x(0),m_wnd_coord_y(0)
  {
   this.m_digits=(int)::SymbolInfoInteger(symbol,SYMBOL_DIGITS);
   this.m_list_ind_del=list_ind_del;
   this.m_list_ind_param=list_ind_param;
   CBaseObj::SetChartID(chart_id);
   this.m_type=COLLECTION_CHART_WND_ID;

//--- Initialize base object data arrays
   this.SetControlDataArraySizeLong(CHART_WINDOW_PROP_INTEGER_TOTAL);
   this.SetControlDataArraySizeDouble(CHART_WINDOW_PROP_DOUBLE_TOTAL);
   this.ResetChangesParams();
   this.ResetControlsParams();

//--- Set object properties
   this.SetProperty(CHART_WINDOW_PROP_WINDOW_NUM,wnd_num);
   this.SetProperty(CHART_WINDOW_PROP_SYMBOL,symbol);
   this.SetProperty(CHART_WINDOW_PROP_ID,chart_id);
   this.SetProperty(CHART_WINDOW_PROP_YDISTANCE,::ChartGetInteger(chart_id,CHART_WINDOW_YDISTANCE,wnd_num));
   this.SetProperty(CHART_WINDOW_PROP_HEIGHT_IN_PIXELS,::ChartGetInteger(chart_id,CHART_HEIGHT_IN_PIXELS,wnd_num));
   this.SetProperty(CHART_WINDOW_PROP_PRICE_MIN,::ChartGetDouble(chart_id,CHART_PRICE_MIN,wnd_num));
   this.SetProperty(CHART_WINDOW_PROP_PRICE_MAX,::ChartGetDouble(chart_id,CHART_PRICE_MAX,wnd_num));
   this.m_name=this.Header();

//--- Fill in the symbol current data
   for(int i=0;i<CHART_WINDOW_PROP_INTEGER_TOTAL;i++)
      this.m_long_prop_event[i][3]=this.m_long_prop[i];
   for(int i=0;i<CHART_WINDOW_PROP_DOUBLE_TOTAL;i++)
      this.m_double_prop_event[i][3]=this.m_double_prop[i];
//--- Update the base object data and search for changes
   CBaseObjExt::Refresh();

//--- Create the indicator list
   this.IndicatorsListCreate();
  }
//+------------------------------------------------------------------+
Aquí, obtenemos Digits() del símbolo del gráfico (para mostrar la información), y luego establecemos el tipo de objeto igual al identificador de la lista de objetos de ventana del gráfico.
En el bloque de inicialización de las matrices de datos del objeto básico, asignamos a las matrices del objeto básico los tamaños de las matrices del objeto actual (esas matrices guardan los datos del objeto en la última comprobación) y reseteamos todos los valores
En el bloque para configurar las propiedades del objeto, escribimos todos los datos necesarios del gráfico en los parámetros del objeto.
En el bloque para rellenar los datos del símbolo actual, escribimos en las propiedades del objeto básico todos los datos establecidos en las propiedades del objeto.
En el bloque encargado de actualizar los datos en el objeto básico y de buscar los cambios, rellenamos las matrices del objeto básico con los datos del objeto actual; luego las comparamos con el estado anterior y, si se han establecido las banderas de seguimiento de la propiedad, verificamos si se ha dado el hecho de situación controlada. Si la verificación ha tenido éxito, creamos un evento básico y lo colocamos en la lista de eventos básicos del objeto.
En el método encargado de comparar dos objetos de ventana del gráfico, reemplazamos con las constantes nuevas todas las constantes de enumeración eliminadas:
//+------------------------------------------------------------------+
//| Compare CChartWnd objects with each other by a specified property|
//+------------------------------------------------------------------+
int CChartWnd::Compare(const CObject *node,const int mode=0) const
  {
   const CChartWnd *obj_compared=node;
   if(mode==CHART_WINDOW_PROP_YDISTANCE)
      return(this.YDistance()>obj_compared.YDistance() ? 1 : this.YDistance()<obj_compared.YDistance() ? -1 : 0);
   else if(mode==CHART_WINDOW_PROP_HEIGHT_IN_PIXELS)
      return(this.HeightInPixels()>obj_compared.HeightInPixels() ? 1 : this.HeightInPixels()<obj_compared.HeightInPixels() ? -1 : 0);
   else if(mode==CHART_WINDOW_PROP_WINDOW_NUM)
      return(this.WindowNum()>obj_compared.WindowNum() ? 1 : this.WindowNum()<obj_compared.WindowNum() ? -1 : 0);
   else if(mode==CHART_WINDOW_PROP_SYMBOL)
      return(this.Symbol()==obj_compared.Symbol() ? 0 : this.Symbol()>obj_compared.Symbol() ? 1 : -1);
   return -1;
  }
//+------------------------------------------------------------------+
En el método que retorna la descripción de la propiedad entera del objeto, también reemplazamos las constantes de enumeración por otras nuevas y añadimos el retorno de la descripción de las nuevas propiedades:
//+------------------------------------------------------------------+
//| Return description of object's integer property                  |
//+------------------------------------------------------------------+
string CChartWnd::GetPropertyDescription(ENUM_CHART_WINDOW_PROP_INTEGER property)
  {
   return
     (
      property==CHART_WINDOW_PROP_ID  ?  CMessage::Text(MSG_CHART_OBJ_ID)+
         (!this.SupportProperty(property) ?  ": "+CMessage::Text(MSG_LIB_PROP_NOT_SUPPORTED) :
          ": "+(string)CBaseObj::GetChartID()
         )  :
      property==CHART_WINDOW_PROP_WINDOW_NUM  ?  CMessage::Text(MSG_CHART_OBJ_WINDOW_N)+
         (!this.SupportProperty(property) ?  ": "+CMessage::Text(MSG_LIB_PROP_NOT_SUPPORTED) :
          ": "+(string)this.WindowNum()
         )  :
      property==CHART_WINDOW_PROP_YDISTANCE  ?  CMessage::Text(MSG_CHART_OBJ_WINDOW_YDISTANCE)+
         (!this.SupportProperty(property) ?  ": "+CMessage::Text(MSG_LIB_PROP_NOT_SUPPORTED) :
          ": "+(string)this.YDistance()
         )  :
      property==CHART_WINDOW_PROP_HEIGHT_IN_PIXELS  ?  CMessage::Text(MSG_CHART_OBJ_HEIGHT_IN_PIXELS)+
         (!this.SupportProperty(property) ?  ": "+CMessage::Text(MSG_LIB_PROP_NOT_SUPPORTED) :
          ": "+(string)this.HeightInPixels()
         )  :
      ""
     );
  }
//+------------------------------------------------------------------+
Vamos a escribir la implementación del método que retorna la descripción de la propiedad real de un objeto:
//+------------------------------------------------------------------+
//| Return description of object's real property                     |
//+------------------------------------------------------------------+
string CChartWnd::GetPropertyDescription(ENUM_CHART_WINDOW_PROP_DOUBLE property)
  {
   return
     (
      property==CHART_WINDOW_PROP_PRICE_MIN  ?  CMessage::Text(MSG_CHART_OBJ_PRICE_MIN)+
         (!this.SupportProperty(property) ?  ": "+CMessage::Text(MSG_LIB_PROP_NOT_SUPPORTED) :
          ": "+::DoubleToString(this.PriceMin(),this.m_digits)
         )  :
      property==CHART_WINDOW_PROP_PRICE_MAX  ?  CMessage::Text(MSG_CHART_OBJ_PRICE_MAX)+
         (!this.SupportProperty(property) ?  ": "+CMessage::Text(MSG_LIB_PROP_NOT_SUPPORTED) :
          ": "+::DoubleToString(this.PriceMax(),this.m_digits)
         )  :
      ""
     );
  }
//+------------------------------------------------------------------+
En el método que retorna la descripción de una propiedad de tipo string del objeto, también reemplazamos las constantes de enumeración por otras nuevas:
//+------------------------------------------------------------------+
//| Return description of object's string property                   |
//+------------------------------------------------------------------+
string CChartWnd::GetPropertyDescription(ENUM_CHART_WINDOW_PROP_STRING property)
  {
   return
     (
      property==CHART_WINDOW_PROP_SYMBOL  ?  CMessage::Text(MSG_LIB_PROP_SYMBOL)+
         (!this.SupportProperty(property) ?  ": "+CMessage::Text(MSG_LIB_PROP_NOT_SUPPORTED) :
          ": "+this.Symbol()
         )  :
      ""
     );
  }
//+------------------------------------------------------------------+
También hemos hecho correcciones en el método que registra las propiedades del objeto , en las constantes de enumeración y en el bloque de código sin comentar, encargado de generar las propiedades reales del objeto (anteriormente, este bloque de código dentro del ciclo tenía comentarios, pero no había sido eliminado del método):
//+------------------------------------------------------------------+
//| Display object properties in the journal                         |
//+------------------------------------------------------------------+
void CChartWnd::Print(const bool full_prop=false)
  {
   ::Print("============= ",CMessage::Text(MSG_LIB_PARAMS_LIST_BEG)," (",this.Header(),") =============");
   int beg=0, end=CHART_WINDOW_PROP_INTEGER_TOTAL;
   for(int i=beg; i<end; i++)
     {
      ENUM_CHART_WINDOW_PROP_INTEGER prop=(ENUM_CHART_WINDOW_PROP_INTEGER)i;
      if(prop==CHART_WINDOW_PROP_WINDOW_IND_HANDLE || prop==CHART_WINDOW_PROP_WINDOW_IND_INDEX) continue;
      if(!full_prop && !this.SupportProperty(prop)) continue;
      ::Print(this.GetPropertyDescription(prop));
     }
   ::Print("------");
   beg=end; end+=CHART_WINDOW_PROP_DOUBLE_TOTAL;
   for(int i=beg; i<end; i++)
     {
      ENUM_CHART_WINDOW_PROP_DOUBLE prop=(ENUM_CHART_WINDOW_PROP_DOUBLE)i;
      if(!full_prop && !this.SupportProperty(prop)) continue;
      ::Print(this.GetPropertyDescription(prop));
     }
   beg=end; end+=CHART_WINDOW_PROP_STRING_TOTAL;
   for(int i=beg; i<end; i++)
     {
      ENUM_CHART_WINDOW_PROP_STRING prop=(ENUM_CHART_WINDOW_PROP_STRING)i;
      if(prop==CHART_WINDOW_PROP_IND_NAME)
        {
         this.PrintIndicators();
         continue;
        }
      if(!full_prop && !this.SupportProperty(prop)) continue;
      ::Print(this.GetPropertyDescription(prop));
     }
   ::Print("============= ",CMessage::Text(MSG_LIB_PARAMS_LIST_END)," (",this.Header(),") =============\n");
  }
//+------------------------------------------------------------------+
En el método que muestra en el diario la descripción de los parámetros de la ventana, añadimos la muestra de los nuevos parámetros y sustituimos las constantes por otras nuevas:
//+------------------------------------------------------------------+
//| Display the description of the window parameters in the journal  |
//+------------------------------------------------------------------+
void CChartWnd::PrintParameters(const bool dash=false)
  {
   string header=
     (
      this.WindowNum()==0 ? CMessage::Text(MSG_CHART_OBJ_CHART_WINDOW) :
      CMessage::Text(MSG_CHART_OBJ_CHART_SUBWINDOW)+" "+(string)this.WindowNum()
     );
   ::Print((dash ? " " : ""),header,":");
   string pref=(dash ? " - " : "");
   if(this.WindowNum()>0)
      ::Print(pref,GetPropertyDescription(CHART_WINDOW_PROP_YDISTANCE));
   ::Print(pref,GetPropertyDescription(CHART_WINDOW_PROP_HEIGHT_IN_PIXELS));
   ::Print(pref,GetPropertyDescription(CHART_WINDOW_PROP_PRICE_MAX));
   ::Print(pref,GetPropertyDescription(CHART_WINDOW_PROP_PRICE_MIN));
  }
//+------------------------------------------------------------------+
Vamos a mejorar el método encargado de actualizar los datos de la ventana del gráfico. Necesitamos añadirle la inicialización de los datos (variables) del evento y un bloque de código que procese los cambios en los parámetros del objeto si no se han dado otros cambios en él (los otros cambios son la adición a la ventana o la eliminación de un indicador de la misma).
//+------------------------------------------------------------------+
//| Update data on attached indicators                               |
//+------------------------------------------------------------------+
void CChartWnd::Refresh(void)
  {
   //--- Initialize event data
   this.m_is_event=false;
   this.m_hash_sum=0;
   //--- Calculate the change of the indicator number in the "now and during the previous check" window
   int change=::ChartIndicatorsTotal(this.m_chart_id,this.WindowNum())-this.m_list_ind.Total();
   //--- If there is no change in the number of indicators in the window,
   if(change==0)
     {
      //--- check the change of parameters of all indicators and exit
      this.IndicatorsChangeCheck();
      //--- Update integer properties
      this.SetProperty(CHART_WINDOW_PROP_YDISTANCE,::ChartGetInteger(this.m_chart_id,CHART_WINDOW_YDISTANCE,this.WindowNum()));
      this.SetProperty(CHART_WINDOW_PROP_HEIGHT_IN_PIXELS,::ChartGetInteger(this.m_chart_id,CHART_HEIGHT_IN_PIXELS,this.WindowNum()));
      //--- Update real properties
      this.SetProperty(CHART_WINDOW_PROP_PRICE_MIN,::ChartGetDouble(this.m_chart_id,CHART_PRICE_MIN,this.WindowNum()));
      this.SetProperty(CHART_WINDOW_PROP_PRICE_MAX,::ChartGetDouble(this.m_chart_id,CHART_PRICE_MAX,this.WindowNum()));
      //--- Update string properties
      string symbol=::ChartSymbol(this.m_chart_id);
      if(symbol!=NULL)
         this.SetProperty(CHART_WINDOW_PROP_SYMBOL,symbol);

      //--- Fill in the current symbol data
      for(int i=0;i<CHART_WINDOW_PROP_INTEGER_TOTAL;i++)
         this.m_long_prop_event[i][3]=this.m_long_prop[i];
      for(int i=0;i<CHART_WINDOW_PROP_DOUBLE_TOTAL;i++)
         this.m_double_prop_event[i][3]=this.m_double_prop[i];

      //--- Update the base object data, search for changes and exit
      CBaseObjExt::Refresh();
      this.CheckEvents();
      return;
     }
   //--- If indicators are added
   if(change>0)
     {
      //--- Call the method of adding new indicators to the list
      this.IndicatorsAdd();
      //--- In the loop by the number of indicators added to the window,
      for(int i=0;i<change;i++)
        {
         //--- get the new indicator in the list by the index calculated from the end of the list
         int index=this.m_list_ind.Total()-(1+i);
         //--- and if failed to obtain the object, move on to the next one
         CWndInd *ind=this.m_list_ind.At(index);
         if(ind==NULL)
            continue;
         //--- call the method of sending an event to the control program chart
         this.SendEvent(CHART_OBJ_EVENT_CHART_WND_IND_ADD);
        }
     }
   //--- If there are removed indicators
   if(change<0)
     {
      //--- Call the method of removing unnecessary indicators from the list
      this.IndicatorsDelete();
      //--- In the loop by the number of indicators removed from the window,
      for(int i=0;i<-change;i++)
        {
         //--- get a new removed indicator in the list of removed indicators by index calculated from the end of the list
         int index=this.m_list_ind_del.Total()-(1+i);
         //--- and if failed to obtain the object, move on to the next one
         CWndInd *ind=this.m_list_ind_del.At(index);
         if(ind==NULL)
            continue;
         //--- call the method of sending an event to the control program chart
         this.SendEvent(CHART_OBJ_EVENT_CHART_WND_IND_DEL);
        }
     }
  }
//+------------------------------------------------------------------+
Todo está descrito aquí, en los comentarios al bloque de código; lo analizaremos con más detalle en la descripción de la mejora del constructor paramétrico, es prácticamente lo mismo.
Con esto, podemos dar por finalizada la transformación de la clase de objeto de la ventana del gráfico en un objeto de biblioteca completo.
Ahora, vamos a mejorar la clase del objeto de gráfico en el archivo \MQL5\Include\DoEasy\Objects\Chart\ChartObj.mqh.
Para ello, añadiremos las nuevas variables a la sección privada de la clase para almacenar el carácter anterior y el marco temporal del gráfico, así como la variable para guardar el último evento:
//+------------------------------------------------------------------+
//| Chart object class                                               |
//+------------------------------------------------------------------+
class CChartObj : public CBaseObjExt
  {
private:
   CArrayObj         m_list_wnd;                                  // List of chart window objects
   CArrayObj        *m_list_wnd_del;                              // Pointer to the list of chart window objects
   CArrayObj        *m_list_ind_del;                              // Pointer to the list of indicators removed from the indicator window
   CArrayObj        *m_list_ind_param;                            // Pointer to the list of changed indicators
   long              m_long_prop[CHART_PROP_INTEGER_TOTAL];       // Integer properties
   double            m_double_prop[CHART_PROP_DOUBLE_TOTAL];      // Real properties
   string            m_string_prop[CHART_PROP_STRING_TOTAL];      // String properties
   string            m_symbol_prev;                               // Previous chart symbol
   ENUM_TIMEFRAMES   m_timeframe_prev;                            // Previous timeframe
   int               m_digits;                                    // Symbol's Digits()
   int               m_last_event;                                // The last event
   datetime          m_wnd_time_x;                                // Time for X coordinate on the windowed chart
   double            m_wnd_price_y;                               // Price for Y coordinate on the windowed chart
Necesitaremos completar los datos del gráfico en el método de actualización del gráfico; estos también se completan en el constructor de la clase. El objeto de gráfico tiene muchas propiedades, asi que para no escribir el mismo tipo de código en diferentes métodos, lo trasladaremos a métodos separados, y, llamaremos a estos métodos allí donde sea necesario rellenar las propiedades del objeto con los datos de gráfico. Vamos a declararlos en la sección privada de la clase:
//--- The methods of setting property values
   bool              SetMode(const string source,const ENUM_CHART_MODE mode,const bool redraw=false);
   bool              SetScale(const string source,const int scale,const bool redraw=false);
   bool              SetModeVolume(const string source,const ENUM_CHART_VOLUME_MODE mode,const bool redraw=false);
   void              SetVisibleBars(void);
   void              SetWindowsTotal(void);
   void              SetFirstVisibleBars(void);
   void              SetWidthInBars(void);
   void              SetWidthInPixels(void);
   void              SetMaximizedFlag(void);
   void              SetMinimizedFlag(void);
   void              SetExpertName(void);
   void              SetScriptName(void);

//--- Fill in (1) integer, (2) real and (3) string object properties
   bool              SetIntegerParameters(void);
   void              SetDoubleParameters(void);
   bool              SetStringParameters(void);

//--- (1) Create, (2) check and re-create the chart window list
   void              CreateWindowsList(void);
   void              RecreateWindowsList(const int change);
//--- Add an extension to the screenshot file if it is missing
   string            FileNameWithExtention(const string filename);

public:
Todos los métodos que retornan las banderas que indican que el objeto ofrece soporte a esta u otra propiedad, deberán retornar true:
//--- Return the indicator by index from the specified chart window
   CWndInd          *GetIndicator(const int win_num,const int ind_index);

//--- Return the flag of the object supporting this property
   virtual bool      SupportProperty(ENUM_CHART_PROP_INTEGER property)           { return true; }
   virtual bool      SupportProperty(ENUM_CHART_PROP_DOUBLE property)            { return true; }
   virtual bool      SupportProperty(ENUM_CHART_PROP_STRING property)            { return true; }

//--- Get description of (1) integer, (2) real and (3) string properties
   string            GetPropertyDescription(ENUM_CHART_PROP_INTEGER property);
   string            GetPropertyDescription(ENUM_CHART_PROP_DOUBLE property);
   string            GetPropertyDescription(ENUM_CHART_PROP_STRING property);
Antes, el método que retornaba la bandera que indica que el objeto ofrece soporte a una propiedad de tipo entero, retornaba false si esta propiedad era la distancia en píxeles entre los marcos de las ventanas del gráfico.
Introducimos los tres métodos públicos necesarios para trabajar con la funcionalidad de eventos de la clase principal:
//--- Return (1) the flag event, (2) the last event code and (3) the last event
   bool              IsEvent(void)                                   const { return this.m_is_event;                                      }
   int               GetLastEventsCode(void)                         const { return this.m_event_code;                                    }
   int               GetLastEvent(void)                              const { return this.m_last_event;                                    }

//--- Constructors
                     CChartObj(){;}
                     CChartObj(const long chart_id,CArrayObj *list_wnd_del,CArrayObj *list_ind_del,CArrayObj *list_ind_param);
//+------------------------------------------------------------------+
En el bloque de métodos para acceder fácilmente a las propiedades del objeto, escribimos un método que retorna la bandera que indica que la ventana del gráfico se encuentra en primer plano:
//--- (1) Return, (2) enable, (3) disable docking the chart window
   bool              IsDocked(void)                                  const { return (bool)this.GetProperty(CHART_PROP_IS_DOCKED);         }
   bool              SetDockedON(const bool redraw=false)                  { return this.SetDockedFlag(DFUN,true,redraw); }
   bool              SetDockedOFF(const bool redraw=false)                 { return this.SetDockedFlag(DFUN,false,redraw); }

//--- (1) Return, (2) enable and (3) disable the display of the chart above all others
   bool              IsBringTop(void)                                      { return (bool)this.GetProperty(CHART_PROP_BRING_TO_TOP);      }
   bool              SetBringToTopON(const bool redraw=false)              { return this.SetBringToTopFlag(DFUN,true,redraw);             }
   bool              SetBringToTopOFF(const bool redraw=false)             { return this.SetBringToTopFlag(DFUN,false,redraw);            }

//--- (1) Return, set the chart type (2) bars, (3) candles, (4) line
   ENUM_CHART_MODE   Mode(void)                                      const { return (ENUM_CHART_MODE)this.GetProperty(CHART_PROP_MODE);   }
   bool              SetModeBars(const bool redraw=false)                  { return this.SetMode(DFUN,CHART_BARS,redraw);                 }
   bool              SetModeCandles(const bool redraw=false)               { return this.SetMode(DFUN,CHART_CANDLES,redraw);              }
   bool              SetModeLine(const bool redraw=false)                  { return this.SetMode(DFUN,CHART_LINE,redraw);                 }
El método retorna la bandera CHART_BRING_TO_TOP.
Debemos señalar que en la guía de ayuda esta propiedad se indica como "solo escritura" (w/o), y en el ejemplo se indica que solo se puede establecer el gráfico necesario como activo, es decir, no permite leer su estado, solo configurarlo. No obstante, en la práctica, esta propiedad también se lee y, con su ayuda, podemos averiguar qué gráfico está activo en ese momento. O bien esto es un error en la guía de ayuda, o bien es una característica indocumentada (lo cual resulta altamente indeseable), pero de hecho todavía funciona. Si esta propiedad del gráfico deja de leerse repentinamente (se mostrará de acuerdo con la guía de ayuda), entonces tendremos problemas para obtener rápidamente el gráfico actualmente activo y deberemos inventar algo propio.
Al final del listado de la clase, escribimos los métodos para establecer los valores monitoreados de las propiedades del objeto controlado para la clase padre.
Añadiremos todas las propiedades, tanto enteras como reales, pero no escribiremos para todas los métodos para controlar su estado. Simplemente tendremos en cuenta la conveniencia de controlar algunas de las propiedades del objeto. Sea como fuere, todas las propiedades están escritas en los comentarios, y siempre podremos añadir nuevas:
//+------------------------------------------------------------------+ //| Get and set the parameters of tracked property changes | //+------------------------------------------------------------------+ //CHART_PROP_ID = 0, // Chart ID //--- Chart timeframe //--- setting the chart timeframe (1) increase, (2) decrease controlled value and (3) reference level //--- getting (4) the chart timeframe change value, //--- getting the chart timeframe change flag increasing the (5) growth and (6) decrease values void SetControlTimeframeInc(const long value) { this.SetControlledValueINC(CHART_PROP_TIMEFRAME,(long)::fabs(value)); } void SetControlTimeframeDec(const long value) { this.SetControlledValueDEC(CHART_PROP_TIMEFRAME,(long)::fabs(value)); } void SetControlTimeframeLevel(const long value) { this.SetControlledValueLEVEL(CHART_PROP_TIMEFRAME,(long)::fabs(value)); } long GetValueChangedTimeframe(void) const { return this.GetPropLongChangedValue(CHART_PROP_TIMEFRAME); } bool IsIncreasedTimeframe(void) const { return (bool)this.GetPropLongFlagINC(CHART_PROP_TIMEFRAME); } bool IsDecreasedTimeframe(void) const { return (bool)this.GetPropLongFlagDEC(CHART_PROP_TIMEFRAME); } //CHART_PROP_SHOW // Price chart drawing //CHART_PROP_IS_OBJECT, // Chart object (OBJ_CHART) identification attribute //CHART_PROP_BRING_TO_TOP, // Show the chart above all others //CHART_PROP_CONTEXT_MENU, // Enable/disable access to the context menu using the right click //CHART_PROP_CROSSHAIR_TOOL, // Enable/disable access to the Crosshair tool using the middle click //CHART_PROP_MOUSE_SCROLL, // Scroll the chart horizontally using the left mouse button //CHART_PROP_EVENT_MOUSE_WHEEL, // Send messages about mouse wheel events (CHARTEVENT_MOUSE_WHEEL) to all MQL5 programs on a chart //CHART_PROP_EVENT_MOUSE_MOVE, // Send messages about mouse button click and movement events (CHARTEVENT_MOUSE_MOVE) to all MQL5 programs on a chart //CHART_PROP_EVENT_OBJECT_CREATE, // Send messages about the graphical object creation event (CHARTEVENT_OBJECT_CREATE) to all MQL5 programs on a chart //CHART_PROP_EVENT_OBJECT_DELETE, // Send messages about the graphical object destruction event (CHARTEVENT_OBJECT_DELETE) to all MQL5 programs on a chart //--- Type of the chart (candlesticks, bars or line (ENUM_CHART_MODE)) //--- setting the chart timeframe (1) increase, (2) decrease controlled value and (3) reference level //--- getting (4) the chart timeframe change value, //--- getting the chart timeframe change flag increasing the (5) growth and (6) decrease values void SetControlChartModeInc(const long value) { this.SetControlledValueINC(CHART_PROP_MODE,(long)::fabs(value)); } void SetControlChartModeDec(const long value) { this.SetControlledValueDEC(CHART_PROP_MODE,(long)::fabs(value)); } void SetControlChartModeLevel(const long value) { this.SetControlledValueLEVEL(CHART_PROP_MODE,(long)::fabs(value)); } long GetValueChangedChartMode(void) const { return this.GetPropLongChangedValue(CHART_PROP_MODE); } bool IsIncreasedChartMode(void) const { return (bool)this.GetPropLongFlagINC(CHART_PROP_MODE); } bool IsDecreasedChartMode(void) const { return (bool)this.GetPropLongFlagDEC(CHART_PROP_MODE); } //CHART_PROP_FOREGROUND, // Price chart in the foreground //CHART_PROP_SHIFT, // Mode of shift of the price chart from the right border //CHART_PROP_AUTOSCROLL, // The mode of automatic shift to the right border of the chart //CHART_PROP_KEYBOARD_CONTROL, // Allow managing the chart using a keyboard //CHART_PROP_QUICK_NAVIGATION, // Allow the chart to intercept Space and Enter key strokes to activate the quick navigation bar //CHART_PROP_SCALE, // Scale //CHART_PROP_SCALEFIX, // Fixed scale mode //CHART_PROP_SCALEFIX_11, // 1:1 scale mode //CHART_PROP_SCALE_PT_PER_BAR, // The mode of specifying the scale in points per bar //CHART_PROP_SHOW_TICKER, // Display a symbol ticker in the upper left corner //CHART_PROP_SHOW_OHLC, // Display OHLC values in the upper left corner //CHART_PROP_SHOW_BID_LINE, // Display Bid value as a horizontal line on the chart //CHART_PROP_SHOW_ASK_LINE, // Display Ask value as a horizontal line on a chart //CHART_PROP_SHOW_LAST_LINE, // Display Last value as a horizontal line on a chart //CHART_PROP_SHOW_PERIOD_SEP, // Display vertical separators between adjacent periods //CHART_PROP_SHOW_GRID, // Display a grid on the chart //CHART_PROP_SHOW_VOLUMES, // Display volumes on a chart //CHART_PROP_SHOW_OBJECT_DESCR, // Display text descriptions of objects //CHART_PROP_VISIBLE_BARS, // Number of bars on a chart that are available for display //CHART_PROP_WINDOWS_TOTAL, // The total number of chart windows including indicator subwindows //CHART_PROP_WINDOW_HANDLE, // Chart window handle //CHART_PROP_WINDOW_YDISTANCE ////--- Distance in Y axis pixels between the upper frame of the indicator subwindow and the upper frame of the chart main window ////--- set the controlled (1) growth, (2) decrease, (3) reference distance level in pixels by the vertical Y axis between the window frames ////--- get (4) the distance change in pixels by the vertical Y axis between the window frames, ////--- get the distance change flag in pixels by the vertical Y axis between the window frames exceeding the (5) growth and (6) decrease values // void SetControlWindowYDistanceInc(const long value) { this.SetControlledValueINC(CHART_PROP_WINDOW_YDISTANCE,(long)::fabs(value)); } // void SetControlWindowYDistanceDec(const long value) { this.SetControlledValueDEC(CHART_PROP_WINDOW_YDISTANCE,(long)::fabs(value)); } // void SetControlWindowYDistanceLevel(const long value) { this.SetControlledValueLEVEL(CHART_PROP_WINDOW_YDISTANCE,(long)::fabs(value)); } // long GetValueChangedWindowYDistance(void) const { return this.GetPropLongChangedValue(CHART_PROP_WINDOW_YDISTANCE); } // bool IsIncreasedWindowYDistance(void) const { return (bool)this.GetPropLongFlagINC(CHART_PROP_WINDOW_YDISTANCE); } // bool IsDecreasedWindowYDistance(void) const { return (bool)this.GetPropLongFlagDEC(CHART_PROP_WINDOW_YDISTANCE); } //CHART_PROP_FIRST_VISIBLE_BAR, // Number of the first visible bar on the chart //--- Width of the chart in bars //--- setting the controlled spread (1) increase, (2) decrease value and (3) reference chart width in bars //--- getting (4) the chart width change value in bars, //--- get the flag of the chart width change in bars exceeding (5) the growth and (6) decrease values void SetControlWidthInBarsInc(const long value) { this.SetControlledValueINC(CHART_PROP_WIDTH_IN_BARS,(long)::fabs(value)); } void SetControlWidthInBarsDec(const long value) { this.SetControlledValueDEC(CHART_PROP_WIDTH_IN_BARS,(long)::fabs(value)); } void SetControlWidthInBarsLevel(const long value) { this.SetControlledValueLEVEL(CHART_PROP_WIDTH_IN_BARS,(long)::fabs(value)); } long GetValueChangedWidthInBars(void) const { return this.GetPropLongChangedValue(CHART_PROP_WIDTH_IN_BARS); } bool IsIncreasedWidthInBars(void) const { return (bool)this.GetPropLongFlagINC(CHART_PROP_WIDTH_IN_BARS); } bool IsDecreasedWidthInBars(void) const { return (bool)this.GetPropLongFlagDEC(CHART_PROP_WIDTH_IN_BARS); } //--- Chart width in pixels //--- setting the controlled spread (1) increase, (2) decrease value and (3) reference chart width in pixels //--- getting (4) the chart width change value in pixels, //--- get the flag of the chart width change in pixels exceeding (5) the growth and (6) decrease values void SetControlWidthInPixelsInc(const long value) { this.SetControlledValueINC(CHART_PROP_WIDTH_IN_PIXELS,(long)::fabs(value)); } void SetControlWidthInPixelsDec(const long value) { this.SetControlledValueDEC(CHART_PROP_WIDTH_IN_PIXELS,(long)::fabs(value)); } void SetControlWidthInPixelsLevel(const long value) { this.SetControlledValueLEVEL(CHART_PROP_WIDTH_IN_PIXELS,(long)::fabs(value)); } long GetValueChangedWidthInPixels(void) const { return this.GetPropLongChangedValue(CHART_PROP_WIDTH_IN_PIXELS); } bool IsIncreasedWidthInPixels(void) const { return (bool)this.GetPropLongFlagINC(CHART_PROP_WIDTH_IN_PIXELS); } bool IsDecreasedWidthInPixels(void) const { return (bool)this.GetPropLongFlagDEC(CHART_PROP_WIDTH_IN_PIXELS); } //--- Chart height in pixels //--- setting the controlled spread (1) increase, (2) decrease value and (3) reference chart height in pixels //--- get (4) the chart height change in pixels, //--- get the flag of the chart height change in pixels exceeding (5) the growth and (6) decrease values void SetControlHeightInPixelsInc(const long value) { this.SetControlledValueINC(CHART_PROP_HEIGHT_IN_PIXELS,(long)::fabs(value)); } void SetControlHeightInPixelsDec(const long value) { this.SetControlledValueDEC(CHART_PROP_HEIGHT_IN_PIXELS,(long)::fabs(value)); } void SetControlHeightInPixelsLevel(const long value) { this.SetControlledValueLEVEL(CHART_PROP_HEIGHT_IN_PIXELS,(long)::fabs(value)); } long GetValueChangedHeightInPixels(void) const { return this.GetPropLongChangedValue(CHART_PROP_HEIGHT_IN_PIXELS); } bool IsIncreasedHeightInPixels(void) const { return (bool)this.GetPropLongFlagINC(CHART_PROP_HEIGHT_IN_PIXELS); } bool IsDecreasedHeightInPixels(void) const { return (bool)this.GetPropLongFlagDEC(CHART_PROP_HEIGHT_IN_PIXELS); } //CHART_PROP_COLOR_BACKGROUND, // Chart background color //CHART_PROP_COLOR_FOREGROUND, // Color of axes, scale and OHLC line //CHART_PROP_COLOR_GRID, // Grid color //CHART_PROP_COLOR_VOLUME, // Color of volumes and position opening levels //CHART_PROP_COLOR_CHART_UP, // Color for the up bar, shadows and body borders of bull candlesticks //CHART_PROP_COLOR_CHART_DOWN, // Color of down bar, its shadow and border of body of the bullish candlestick //CHART_PROP_COLOR_CHART_LINE, // Color of the chart line and the Doji candlesticks //CHART_PROP_COLOR_CANDLE_BULL, // Bullish candlestick body color //CHART_PROP_COLOR_CANDLE_BEAR, // Bearish candlestick body color //CHART_PROP_COLOR_BID, // Color of the Bid price line //CHART_PROP_COLOR_ASK, // Color of the Ask price line //CHART_PROP_COLOR_LAST, // Color of the last performed deal's price line (Last) //CHART_PROP_COLOR_STOP_LEVEL, // Color of stop order levels (Stop Loss and Take Profit) //CHART_PROP_SHOW_TRADE_LEVELS, // Display trade levels on the chart (levels of open positions, Stop Loss, Take Profit and pending orders) //CHART_PROP_DRAG_TRADE_LEVELS, // Enable the ability to drag trading levels on a chart using mouse //CHART_PROP_SHOW_DATE_SCALE, // Display the time scale on a chart //CHART_PROP_SHOW_PRICE_SCALE, // Display a price scale on a chart //CHART_PROP_SHOW_ONE_CLICK, // Display the quick trading panel on the chart //CHART_PROP_IS_MAXIMIZED, // Chart window maximized //CHART_PROP_IS_MINIMIZED, // Chart window minimized //CHART_PROP_IS_DOCKED, // Chart window docked //--- The left coordinate of the undocked chart window relative to the virtual screen //--- setting the controlled spread (1) increase, (2) decrease value and (3) reference level of the left coordinate of the undocked chart relative to the virtual screen //--- getting (4) the change value of the left coordinate of the undocked chart relative to the virtual screen, //--- getting the flag of changing the left coordinate of the undocked chart relative to the virtual screen exceeding the (5) increase and (6) decrease values void SetControlFloatLeftInc(const long value) { this.SetControlledValueINC(CHART_PROP_FLOAT_LEFT,(long)::fabs(value)); } void SetControlFloatLeftDec(const long value) { this.SetControlledValueDEC(CHART_PROP_FLOAT_LEFT,(long)::fabs(value)); } void SetControlFloatLeftLevel(const long value) { this.SetControlledValueLEVEL(CHART_PROP_FLOAT_LEFT,(long)::fabs(value)); } long GetValueChangedFloatLeft(void) const { return this.GetPropLongChangedValue(CHART_PROP_FLOAT_LEFT); } bool IsIncreasedFloatLeft(void) const { return (bool)this.GetPropLongFlagINC(CHART_PROP_FLOAT_LEFT); } bool IsDecreasedFloatLeft(void) const { return (bool)this.GetPropLongFlagDEC(CHART_PROP_FLOAT_LEFT); } //--- Upper coordinate of the undocked chart window relative to the virtual screen //--- setting the controlled spread (1) increase, (2) decrease value and (3) reference level of the upper coordinate of the undocked chart relative to the virtual screen //--- getting (4) the change value of the upper coordinate of the undocked chart relative to the virtual screen, //--- getting the flag of changing the upper coordinate of the undocked chart relative to the virtual screen exceeding the (5) increase and (6) decrease values void SetControlFloatTopInc(const long value) { this.SetControlledValueINC(CHART_PROP_FLOAT_TOP,(long)::fabs(value)); } void SetControlFloatTopDec(const long value) { this.SetControlledValueDEC(CHART_PROP_FLOAT_TOP,(long)::fabs(value)); } void SetControlFloatTopLevel(const long value) { this.SetControlledValueLEVEL(CHART_PROP_FLOAT_TOP,(long)::fabs(value)); } long GetValueChangedFloatTop(void) const { return this.GetPropLongChangedValue(CHART_PROP_FLOAT_TOP); } bool IsIncreasedFloatTop(void) const { return (bool)this.GetPropLongFlagINC(CHART_PROP_FLOAT_TOP); } bool IsDecreasedFloatTop(void) const { return (bool)this.GetPropLongFlagDEC(CHART_PROP_FLOAT_TOP); } //--- The right coordinate of the undocked chart window relative to the virtual screen //--- setting the controlled spread (1) increase, (2) decrease value and (3) reference level of the right coordinate of the undocked chart relative to the virtual screen //--- getting (4) the change value of the right coordinate of the undocked chart relative to the virtual screen, //--- getting the flag of changing the right coordinate of the undocked chart relative to the virtual screen exceeding the (5) increase and (6) decrease values void SetControlFloatRightInc(const long value) { this.SetControlledValueINC(CHART_PROP_FLOAT_RIGHT,(long)::fabs(value)); } void SetControlFloatRightDec(const long value) { this.SetControlledValueDEC(CHART_PROP_FLOAT_RIGHT,(long)::fabs(value)); } void SetControlFloatRightLevel(const long value) { this.SetControlledValueLEVEL(CHART_PROP_FLOAT_RIGHT,(long)::fabs(value)); } long GetValueChangedFloatRight(void) const { return this.GetPropLongChangedValue(CHART_PROP_FLOAT_RIGHT); } bool IsIncreasedFloatRight(void) const { return (bool)this.GetPropLongFlagINC(CHART_PROP_FLOAT_RIGHT); } bool IsDecreasedFloatRight(void) const { return (bool)this.GetPropLongFlagDEC(CHART_PROP_FLOAT_RIGHT); } //--- The bottom coordinate of the undocked chart window relative to the virtual screen //--- setting the controlled spread (1) increase, (2) decrease value and (3) reference level of the lower coordinate of the undocked chart relative to the virtual screen //--- getting (4) the change value of the lower coordinate of the undocked chart relative to the virtual screen, //--- getting the flag of changing the lower coordinate of the undocked chart relative to the virtual screen exceeding the (5) increase and (6) decrease values void SetControlFloatBottomInc(const long value) { this.SetControlledValueINC(CHART_PROP_FLOAT_BOTTOM,(long)::fabs(value)); } void SetControlFloatBottomDec(const long value) { this.SetControlledValueDEC(CHART_PROP_FLOAT_BOTTOM,(long)::fabs(value)); } void SetControlFloatBottomLevel(const long value) { this.SetControlledValueLEVEL(CHART_PROP_FLOAT_BOTTOM,(long)::fabs(value)); } long GetValueChangedFloatBottom(void) const { return this.GetPropLongChangedValue(CHART_PROP_FLOAT_BOTTOM); } bool IsIncreasedFloatBottom(void) const { return (bool)this.GetPropLongFlagINC(CHART_PROP_FLOAT_BOTTOM); } bool IsDecreasedFloatBottom(void) const { return (bool)this.GetPropLongFlagDEC(CHART_PROP_FLOAT_BOTTOM); } //--- Shift size of the zero bar from the right border in % //--- setting (1) increase, (2) decrease and (3) reference level of the shift size of the zero bar from the right border in % //--- getting (4) the change value of the shift of the zero bar from the right border in %, //--- getting the flag of the change value of the shift of the zero bar from the right border in % exceeding (5) the growth and (6) decrease values void SetControlShiftSizeInc(const long value) { this.SetControlledValueINC(CHART_PROP_SHIFT_SIZE,(long)::fabs(value)); } void SetControlShiftSizeDec(const long value) { this.SetControlledValueDEC(CHART_PROP_SHIFT_SIZE,(long)::fabs(value)); } void SetControlShiftSizeLevel(const long value) { this.SetControlledValueLEVEL(CHART_PROP_SHIFT_SIZE,(long)::fabs(value)); } double GetValueChangedShiftSize(void) const { return this.GetPropDoubleChangedValue(CHART_PROP_SHIFT_SIZE); } bool IsIncreasedShiftSize(void) const { return (bool)this.GetPropLongFlagINC(CHART_PROP_SHIFT_SIZE); } bool IsDecreasedShiftSize(void) const { return (bool)this.GetPropLongFlagDEC(CHART_PROP_SHIFT_SIZE); } //--- Chart fixed position from the left border in % //--- setting (1) increase, (2) decrease and (3) reference level of the chart fixed position from the left border in % //--- getting (4) the change value of the chart fixed position from the left border in %, //--- getting the flag of changing the chart fixed position from the left border in % more than by the (5) increase and (6) decrease values void SetControlFixedPositionInc(const long value) { this.SetControlledValueINC(CHART_PROP_FIXED_POSITION,(long)::fabs(value)); } void SetControlFixedPositionDec(const long value) { this.SetControlledValueDEC(CHART_PROP_FIXED_POSITION,(long)::fabs(value)); } void SetControlFixedPositionLevel(const long value) { this.SetControlledValueLEVEL(CHART_PROP_FIXED_POSITION,(long)::fabs(value)); } double GetValueChangedFixedPosition(void) const { return this.GetPropDoubleChangedValue(CHART_PROP_FIXED_POSITION); } bool IsIncreasedFixedPosition(void) const { return (bool)this.GetPropLongFlagINC(CHART_PROP_FIXED_POSITION); } bool IsDecreasedFixedPosition(void) const { return (bool)this.GetPropLongFlagDEC(CHART_PROP_FIXED_POSITION); } //--- Fixed chart maximum //--- setting the fixed chart maximum (1) increase, (2) decrease controlled value and (3) reference level //--- getting (4) the change value of the fixed chart maximum, //--- getting the flag of changing the position of the fixed chart maximum by more than (5) increase and (6) decrease values void SetControlFixedMaxInc(const long value) { this.SetControlledValueINC(CHART_PROP_FIXED_MAX,(long)::fabs(value)); } void SetControlFixedMaxDec(const long value) { this.SetControlledValueDEC(CHART_PROP_FIXED_MAX,(long)::fabs(value)); } void SetControlFixedMaxLevel(const long value) { this.SetControlledValueLEVEL(CHART_PROP_FIXED_MAX,(long)::fabs(value)); } double GetValueChangedFixedMax(void) const { return this.GetPropDoubleChangedValue(CHART_PROP_FIXED_MAX); } bool IsIncreasedFixedMax(void) const { return (bool)this.GetPropLongFlagINC(CHART_PROP_FIXED_MAX); } bool IsDecreasedFixedMax(void) const { return (bool)this.GetPropLongFlagDEC(CHART_PROP_FIXED_MAX); } //--- Fixed chart minimum //--- setting the fixed chart minimum (1) increase, (2) decrease controlled value and (3) reference level //--- getting (4) the change value of the fixed chart minimum, //--- getting the flag of changing the position of the fixed chart minimum by more than (5) increase and (6) decrease values void SetControlFixedMinInc(const long value) { this.SetControlledValueINC(CHART_PROP_FIXED_MIN,(long)::fabs(value)); } void SetControlFixedMinDec(const long value) { this.SetControlledValueDEC(CHART_PROP_FIXED_MIN,(long)::fabs(value)); } void SetControlFixedMinLevel(const long value) { this.SetControlledValueLEVEL(CHART_PROP_FIXED_MIN,(long)::fabs(value)); } double GetValueChangedFixedMin(void) const { return this.GetPropDoubleChangedValue(CHART_PROP_FIXED_MIN); } bool IsIncreasedFixedMin(void) const { return (bool)this.GetPropLongFlagINC(CHART_PROP_FIXED_MIN); } bool IsDecreasedFixedMin(void) const { return (bool)this.GetPropLongFlagDEC(CHART_PROP_FIXED_MIN); } //CHART_PROP_POINTS_PER_BAR, // Scale in points per bar //--- Chart minimum //--- setting the chart minimum (1) increase, (2) decrease controlled value and (3) reference level //--- getting (4) the change value of the chart minimum, //--- getting the flag of changing the position of the chart minimum by more than (5) increase and (6) decrease values void SetControlPriceMinInc(const long value) { this.SetControlledValueINC(CHART_PROP_PRICE_MIN,(long)::fabs(value)); } void SetControlPriceMinDec(const long value) { this.SetControlledValueDEC(CHART_PROP_PRICE_MIN,(long)::fabs(value)); } void SetControlPriceMinLevel(const long value) { this.SetControlledValueLEVEL(CHART_PROP_PRICE_MIN,(long)::fabs(value)); } double GetValueChangedPriceMin(void) const { return this.GetPropDoubleChangedValue(CHART_PROP_PRICE_MIN); } bool IsIncreasedPriceMin(void) const { return (bool)this.GetPropLongFlagINC(CHART_PROP_PRICE_MIN); } bool IsDecreasedPriceMin(void) const { return (bool)this.GetPropLongFlagDEC(CHART_PROP_PRICE_MIN); } //--- Chart maximum //--- setting the chart maximum (1) increase, (2) decrease controlled value and (3) reference level //--- getting (4) the change value of the chart maximum, //--- getting the flag of changing the position of the chart maximum by more than (5) increase and (6) decrease values void SetControlPriceMaxInc(const long value) { this.SetControlledValueINC(CHART_PROP_PRICE_MAX,(long)::fabs(value)); } void SetControlPriceMaxDec(const long value) { this.SetControlledValueDEC(CHART_PROP_PRICE_MAX,(long)::fabs(value)); } void SetControlPriceMaxLevel(const long value) { this.SetControlledValueLEVEL(CHART_PROP_PRICE_MAX,(long)::fabs(value)); } double GetValueChangedPriceMax(void) const { return this.GetPropDoubleChangedValue(CHART_PROP_PRICE_MAX); } bool IsIncreasedPriceMax(void) const { return (bool)this.GetPropLongFlagINC(CHART_PROP_PRICE_MAX); } bool IsDecreasedPriceMax(void) const { return (bool)this.GetPropLongFlagDEC(CHART_PROP_PRICE_MAX); } }; //+------------------------------------------------------------------+
Los métodos nos permiten establecer rápidamente las propiedades del objeto cuyo valor tenemos que monitorear, y también enviar eventos al gráfico del programa de control cuando se superen los valores controlados del aumento o la disminución de dicha propiedad.
Hemos modificado el constructor de la clase de la misma manera que en la clase del objeto de ventana del gráfico analizada anteriormente:
//+------------------------------------------------------------------+
//| Parametric constructor                                           |
//+------------------------------------------------------------------+
CChartObj::CChartObj(const long chart_id,CArrayObj *list_wnd_del,CArrayObj *list_ind_del,CArrayObj *list_ind_param) : m_wnd_time_x(0),m_wnd_price_y(0)
  {
   this.m_list_wnd_del=list_wnd_del;
   this.m_list_ind_del=list_ind_del;
   this.m_list_ind_param=list_ind_param;
//--- Set the chart ID to the base object and set the chart object ID
   CBaseObj::SetChartID(chart_id);
   this.m_type=COLLECTION_CHARTS_ID;

//--- Initialize base object data arrays
   this.SetControlDataArraySizeLong(CHART_PROP_INTEGER_TOTAL);
   this.SetControlDataArraySizeDouble(CHART_PROP_DOUBLE_TOTAL);
   this.ResetChangesParams();
   this.ResetControlsParams();

//--- Chart ID
   this.SetProperty(CHART_PROP_ID,chart_id);
//--- Set integer properties
   this.SetIntegerParameters();
//--- Set real properties
   this.SetDoubleParameters();
//--- Set string properties
   this.SetStringParameters();
//--- Initialize variables and lists
   this.m_digits=(int)::SymbolInfoInteger(this.Symbol(),SYMBOL_DIGITS);
   this.m_list_wnd_del.Sort(SORT_BY_CHART_WINDOW_NUM);
   this.CreateWindowsList();
   this.m_symbol_prev=this.Symbol();
   this.m_timeframe_prev=this.Timeframe();
   this.m_name=this.Header();

//--- Fill in the current chart data
   for(int i=0;i<CHART_PROP_INTEGER_TOTAL;i++)
      this.m_long_prop_event[i][3]=this.m_long_prop[i];
   for(int i=0;i<CHART_PROP_DOUBLE_TOTAL;i++)
      this.m_double_prop_event[i][3]=this.m_double_prop[i];

//--- Update the base object data and search for changes
   CBaseObjExt::Refresh();
  }
//+------------------------------------------------------------------+
Aquí, los valores de los parámetros del gráfico en las propiedades del objeto se escriben usando los tres métodos destinados a ello:
Método que rellena las propiedades enteras del objeto:
//+------------------------------------------------------------------+
//| Fill in integer object properties                                |
//+------------------------------------------------------------------+
bool CChartObj::SetIntegerParameters(void)
  {
   ENUM_TIMEFRAMES timeframe=::ChartPeriod(this.ID());
   if(timeframe==0)
      return false;
   this.SetProperty(CHART_PROP_TIMEFRAME,timeframe);                                                     // Chart timeframe
   this.SetProperty(CHART_PROP_SHOW,::ChartGetInteger(this.ID(),CHART_SHOW));                            // Price chart drawing attribute
   this.SetProperty(CHART_PROP_IS_OBJECT,::ChartGetInteger(this.ID(),CHART_IS_OBJECT));                  // Chart object identification attribute
   this.SetProperty(CHART_PROP_BRING_TO_TOP,::ChartGetInteger(this.ID(),CHART_BRING_TO_TOP));            // Show the chart above all others
   this.SetProperty(CHART_PROP_CONTEXT_MENU,::ChartGetInteger(this.ID(),CHART_CONTEXT_MENU));            // Access to the context menu using the right click
   this.SetProperty(CHART_PROP_CROSSHAIR_TOOL,::ChartGetInteger(this.ID(),CHART_CROSSHAIR_TOOL));        // Access the Crosshair tool by pressing the middle mouse button
   this.SetProperty(CHART_PROP_MOUSE_SCROLL,::ChartGetInteger(this.ID(),CHART_MOUSE_SCROLL));            // Scroll the chart horizontally using the left mouse button
   this.SetProperty(CHART_PROP_EVENT_MOUSE_WHEEL,::ChartGetInteger(this.ID(),CHART_EVENT_MOUSE_WHEEL));  // Send messages about mouse wheel events to all MQL5 programs on a chart
   this.SetProperty(CHART_PROP_EVENT_MOUSE_MOVE,::ChartGetInteger(this.ID(),CHART_EVENT_MOUSE_MOVE));    // Send messages about mouse button click and movement events to all MQL5 programs on a chart
   this.SetProperty(CHART_PROP_EVENT_OBJECT_CREATE,::ChartGetInteger(this.ID(),CHART_EVENT_OBJECT_CREATE)); // Send messages about the graphical object creation event to all MQL5 programs on a chart
   this.SetProperty(CHART_PROP_EVENT_OBJECT_DELETE,::ChartGetInteger(this.ID(),CHART_EVENT_OBJECT_DELETE)); // Send messages about the graphical object destruction event to all MQL5 programs on a chart
   this.SetProperty(CHART_PROP_MODE,::ChartGetInteger(this.ID(),CHART_MODE));                            // Type of the chart (candlesticks, bars or line)
   this.SetProperty(CHART_PROP_FOREGROUND,::ChartGetInteger(this.ID(),CHART_FOREGROUND));                // Price chart in the foreground
   this.SetProperty(CHART_PROP_SHIFT,::ChartGetInteger(this.ID(),CHART_SHIFT));                          // Mode of shift of the price chart from the right border
   this.SetProperty(CHART_PROP_AUTOSCROLL,::ChartGetInteger(this.ID(),CHART_AUTOSCROLL));                // The mode of automatic shift to the right border of the chart
   this.SetProperty(CHART_PROP_KEYBOARD_CONTROL,::ChartGetInteger(this.ID(),CHART_KEYBOARD_CONTROL));    // Allow managing the chart using a keyboard
   this.SetProperty(CHART_PROP_QUICK_NAVIGATION,::ChartGetInteger(this.ID(),CHART_QUICK_NAVIGATION));    // Allow the chart to intercept Space and Enter key strokes to activate the quick navigation bar
   this.SetProperty(CHART_PROP_SCALE,::ChartGetInteger(this.ID(),CHART_SCALE));                          // Scale
   this.SetProperty(CHART_PROP_SCALEFIX,::ChartGetInteger(this.ID(),CHART_SCALEFIX));                    // Fixed scale mode
   this.SetProperty(CHART_PROP_SCALEFIX_11,::ChartGetInteger(this.ID(),CHART_SCALEFIX_11));              // 1:1 scale mode
   this.SetProperty(CHART_PROP_SCALE_PT_PER_BAR,::ChartGetInteger(this.ID(),CHART_SCALE_PT_PER_BAR));    // Mode for specifying the scale in points per bar
   this.SetProperty(CHART_PROP_SHOW_TICKER,::ChartGetInteger(this.ID(),CHART_SHOW_TICKER));              // Display a symbol ticker in the upper left corner
   this.SetProperty(CHART_PROP_SHOW_OHLC,::ChartGetInteger(this.ID(),CHART_SHOW_OHLC));                  // Display OHLC values in the upper left corner
   this.SetProperty(CHART_PROP_SHOW_BID_LINE,::ChartGetInteger(this.ID(),CHART_SHOW_BID_LINE));          // Display Bid value as a horizontal line on the chart
   this.SetProperty(CHART_PROP_SHOW_ASK_LINE,::ChartGetInteger(this.ID(),CHART_SHOW_ASK_LINE));          // Display Ask value as a horizontal line on the chart
   this.SetProperty(CHART_PROP_SHOW_LAST_LINE,::ChartGetInteger(this.ID(),CHART_SHOW_LAST_LINE));        // Display Last value as a horizontal line on the chart
   this.SetProperty(CHART_PROP_SHOW_PERIOD_SEP,::ChartGetInteger(this.ID(),CHART_SHOW_PERIOD_SEP));      // Display vertical separators between adjacent periods
   this.SetProperty(CHART_PROP_SHOW_GRID,::ChartGetInteger(this.ID(),CHART_SHOW_GRID));                  // Display the chart grid
   this.SetProperty(CHART_PROP_SHOW_VOLUMES,::ChartGetInteger(this.ID(),CHART_SHOW_VOLUMES));            // Display volumes on the chart
   this.SetProperty(CHART_PROP_SHOW_OBJECT_DESCR,::ChartGetInteger(this.ID(),CHART_SHOW_OBJECT_DESCR));  // Display text descriptions of the objects
   this.SetProperty(CHART_PROP_VISIBLE_BARS,::ChartGetInteger(this.ID(),CHART_VISIBLE_BARS));            // Number of bars on a chart that are available for display
   this.SetProperty(CHART_PROP_WINDOWS_TOTAL,::ChartGetInteger(this.ID(),CHART_WINDOWS_TOTAL));          // The total number of chart windows including indicator subwindows
   this.SetProperty(CHART_PROP_WINDOW_HANDLE,::ChartGetInteger(this.ID(),CHART_WINDOW_HANDLE));          // Chart window handle
   this.SetProperty(CHART_PROP_FIRST_VISIBLE_BAR,::ChartGetInteger(this.ID(),CHART_FIRST_VISIBLE_BAR));  // Number of the first visible bar on the chart
   this.SetProperty(CHART_PROP_WIDTH_IN_BARS,::ChartGetInteger(this.ID(),CHART_WIDTH_IN_BARS));          // Chart width in bars
   this.SetProperty(CHART_PROP_WIDTH_IN_PIXELS,::ChartGetInteger(this.ID(),CHART_WIDTH_IN_PIXELS));      // Chart width in pixels
   this.SetProperty(CHART_PROP_COLOR_BACKGROUND,::ChartGetInteger(this.ID(),CHART_COLOR_BACKGROUND));    // Chart background color
   this.SetProperty(CHART_PROP_COLOR_FOREGROUND,::ChartGetInteger(this.ID(),CHART_COLOR_FOREGROUND));    // Color of axes, scale and OHLC line
   this.SetProperty(CHART_PROP_COLOR_GRID,::ChartGetInteger(this.ID(),CHART_COLOR_GRID));                // Grid color
   this.SetProperty(CHART_PROP_COLOR_VOLUME,::ChartGetInteger(this.ID(),CHART_COLOR_VOLUME));            // Color of volumes and position opening levels
   this.SetProperty(CHART_PROP_COLOR_CHART_UP,::ChartGetInteger(this.ID(),CHART_COLOR_CHART_UP));        // Color for the up bar, shadows and body borders of bullish candlesticks
   this.SetProperty(CHART_PROP_COLOR_CHART_DOWN,::ChartGetInteger(this.ID(),CHART_COLOR_CHART_DOWN));    // Color for the down bar, shadows and body borders of bearish candlesticks
   this.SetProperty(CHART_PROP_COLOR_CHART_LINE,::ChartGetInteger(this.ID(),CHART_COLOR_CHART_LINE));    // Color of the chart line and the Doji candlesticks
   this.SetProperty(CHART_PROP_COLOR_CANDLE_BULL,::ChartGetInteger(this.ID(),CHART_COLOR_CANDLE_BULL));  // Color of the bullish candle body
   this.SetProperty(CHART_PROP_COLOR_CANDLE_BEAR,::ChartGetInteger(this.ID(),CHART_COLOR_CANDLE_BEAR));  // Color of the bearish candle body
   this.SetProperty(CHART_PROP_COLOR_BID,::ChartGetInteger(this.ID(),CHART_COLOR_BID));                  // Bid price line color
   this.SetProperty(CHART_PROP_COLOR_ASK,::ChartGetInteger(this.ID(),CHART_COLOR_ASK));                  // Ask price line color
   this.SetProperty(CHART_PROP_COLOR_LAST,::ChartGetInteger(this.ID(),CHART_COLOR_LAST));                // Color of the last performed deal's price line (Last)
   this.SetProperty(CHART_PROP_COLOR_STOP_LEVEL,::ChartGetInteger(this.ID(),CHART_COLOR_STOP_LEVEL));    // Color of stop order levels (Stop Loss and Take Profit)
   this.SetProperty(CHART_PROP_SHOW_TRADE_LEVELS,::ChartGetInteger(this.ID(),CHART_SHOW_TRADE_LEVELS));  // Display trade levels on the chart (levels of open positions, Stop Loss, Take Profit and pending orders)
   this.SetProperty(CHART_PROP_DRAG_TRADE_LEVELS,::ChartGetInteger(this.ID(),CHART_DRAG_TRADE_LEVELS));  // Enable the ability to drag trading levels on a chart using mouse
   this.SetProperty(CHART_PROP_SHOW_DATE_SCALE,::ChartGetInteger(this.ID(),CHART_SHOW_DATE_SCALE));      // Display the time scale on the chart
   this.SetProperty(CHART_PROP_SHOW_PRICE_SCALE,::ChartGetInteger(this.ID(),CHART_SHOW_PRICE_SCALE));    // Display the price scale on the chart
   this.SetProperty(CHART_PROP_SHOW_ONE_CLICK,::ChartGetInteger(this.ID(),CHART_SHOW_ONE_CLICK));        // Display the quick trading panel on the chart
   this.SetProperty(CHART_PROP_IS_MAXIMIZED,::ChartGetInteger(this.ID(),CHART_IS_MAXIMIZED));            // Chart window maximized
   this.SetProperty(CHART_PROP_IS_MINIMIZED,::ChartGetInteger(this.ID(),CHART_IS_MINIMIZED));            // Chart window minimized
   this.SetProperty(CHART_PROP_IS_DOCKED,::ChartGetInteger(this.ID(),CHART_IS_DOCKED));                  // Chart window docked
   this.SetProperty(CHART_PROP_FLOAT_LEFT,::ChartGetInteger(this.ID(),CHART_FLOAT_LEFT));                // Left coordinate of the undocked chart window relative to the virtual screen
   this.SetProperty(CHART_PROP_FLOAT_TOP,::ChartGetInteger(this.ID(),CHART_FLOAT_TOP));                  // Upper coordinate of the undocked chart window relative to the virtual screen
   this.SetProperty(CHART_PROP_FLOAT_RIGHT,::ChartGetInteger(this.ID(),CHART_FLOAT_RIGHT));              // Right coordinate of the undocked chart window relative to the virtual screen
   this.SetProperty(CHART_PROP_FLOAT_BOTTOM,::ChartGetInteger(this.ID(),CHART_FLOAT_BOTTOM));            // Bottom coordinate of the undocked chart window relative to the virtual screen
   this.SetProperty(CHART_PROP_YDISTANCE,::ChartGetInteger(this.ID(),CHART_WINDOW_YDISTANCE,0));         // Distance in Y axis pixels between the upper frame of the indicator subwindow and the upper frame of the chart main window
   this.SetProperty(CHART_PROP_HEIGHT_IN_PIXELS,::ChartGetInteger(this.ID(),CHART_HEIGHT_IN_PIXELS,0));  // Chart height in pixels
   return true;
  }
//+------------------------------------------------------------------+
Método que rellena las propiedades reales del objeto:
//+------------------------------------------------------------------+
//| Fill in real object properties                                   |
//+------------------------------------------------------------------+
void CChartObj::SetDoubleParameters(void)
  {
   this.SetProperty(CHART_PROP_SHIFT_SIZE,::ChartGetDouble(this.ID(),CHART_SHIFT_SIZE));                 // Shift size of the zero bar from the right border in %
   this.SetProperty(CHART_PROP_FIXED_POSITION,::ChartGetDouble(this.ID(),CHART_FIXED_POSITION));         // Chart fixed position from the left border in %
   this.SetProperty(CHART_PROP_FIXED_MAX,::ChartGetDouble(this.ID(),CHART_FIXED_MAX));                   // Fixed chart maximum
   this.SetProperty(CHART_PROP_FIXED_MIN,::ChartGetDouble(this.ID(),CHART_FIXED_MIN));                   // Fixed chart minimum
   this.SetProperty(CHART_PROP_POINTS_PER_BAR,::ChartGetDouble(this.ID(),CHART_POINTS_PER_BAR));         // Scale in points per bar
   this.SetProperty(CHART_PROP_PRICE_MIN,::ChartGetDouble(this.ID(),CHART_PRICE_MIN));                   // Chart minimum
   this.SetProperty(CHART_PROP_PRICE_MAX,::ChartGetDouble(this.ID(),CHART_PRICE_MAX));                   // Chart maximum
  }
//+------------------------------------------------------------------+
Método que rellena las propiedades string del objeto:
//+------------------------------------------------------------------+
//| Fill in string object properties                                 |
//+------------------------------------------------------------------+
bool CChartObj::SetStringParameters(void)
  {
   string symbol=::ChartSymbol(this.ID());
   if(symbol==NULL)
      return false;
   this.SetProperty(CHART_PROP_SYMBOL,symbol);                                                           // Chart symbol
   this.SetProperty(CHART_PROP_COMMENT,::ChartGetString(this.ID(),CHART_COMMENT));                       // Comment text on the chart
   this.SetProperty(CHART_PROP_EXPERT_NAME,::ChartGetString(this.ID(),CHART_EXPERT_NAME));               // name of an EA launched on the chart
   this.SetProperty(CHART_PROP_SCRIPT_NAME,::ChartGetString(this.ID(),CHART_SCRIPT_NAME));               // name of a script launched on the chart
   return true;
  }
//+------------------------------------------------------------------+
Los métodos que rellenan las propiedades de tipo entero y string retornan valores bool porque dentro de los métodos obtenemos el periodo del gráfico y el símbolo del gráfico según su identificador con las funciones ChartPeriod() y ChartSymbol(). Estas funciones pueden retornar cero o una línea vacía. En estos casos, los métodos retornarán false.
En el método que retorna la descripción de una propiedad de tipo entero del objeto, en los bloques de código que retornan la distancia en píxeles entre los marcos de la ventana y la altura de gráfico en píxeles, devolveremos la propiedad directamente del gráfico, y no del objeto:
      property==CHART_PROP_WINDOW_HANDLE  ?  CMessage::Text(MSG_CHART_OBJ_WINDOW_HANDLE)+
         (!this.SupportProperty(property) ?  ": "+CMessage::Text(MSG_LIB_PROP_NOT_SUPPORTED) :
          ": "+(string)this.GetProperty(property)
         )  :
      property==CHART_PROP_YDISTANCE  ?  CMessage::Text(MSG_CHART_OBJ_WINDOW_YDISTANCE)+
         (!this.SupportProperty(property) ?  ": "+CMessage::Text(MSG_LIB_PROP_NOT_SUPPORTED) :
          ": "+(string)::ChartGetInteger(this.m_chart_id,CHART_WINDOW_YDISTANCE,0)
         )  :
      property==CHART_PROP_FIRST_VISIBLE_BAR ?  CMessage::Text(MSG_CHART_OBJ_FIRST_VISIBLE_BAR)+
         (!this.SupportProperty(property) ?  ": "+CMessage::Text(MSG_LIB_PROP_NOT_SUPPORTED) :
          ": "+(string)this.GetProperty(property)
         )  :
      property==CHART_PROP_WIDTH_IN_BARS  ?  CMessage::Text(MSG_CHART_OBJ_WIDTH_IN_BARS)+
         (!this.SupportProperty(property) ?  ": "+CMessage::Text(MSG_LIB_PROP_NOT_SUPPORTED) :
          ": "+(string)this.GetProperty(property)
         )  :
      property==CHART_PROP_WIDTH_IN_PIXELS   ?  CMessage::Text(MSG_CHART_OBJ_WIDTH_IN_PIXELS)+
         (!this.SupportProperty(property) ?  ": "+CMessage::Text(MSG_LIB_PROP_NOT_SUPPORTED) :
          ": "+(string)this.GetProperty(property)
         )  :
      property==CHART_PROP_HEIGHT_IN_PIXELS   ?  CMessage::Text(MSG_CHART_OBJ_HEIGHT_IN_PIXELS)+
         (!this.SupportProperty(property) ?  ": "+CMessage::Text(MSG_LIB_PROP_NOT_SUPPORTED) :
          ": "+(string)::ChartGetInteger(this.m_chart_id,CHART_HEIGHT_IN_PIXELS,0)
         )  :
      property==CHART_PROP_COLOR_BACKGROUND        ?  CMessage::Text(MSG_CHART_OBJ_COLOR_BACKGROUND)+
         (!this.SupportProperty(property) ?  ": "+CMessage::Text(MSG_LIB_PROP_NOT_SUPPORTED) :
          ": "+::ColorToString((color)this.GetProperty(property),true)
         )  :
Simplemente porque, aunque el gráfico tiene dichas propiedades, estas pertenecen a su ventana (en este caso, a la cero), y no al gráfico en sí, y nosotros obtenemos estas propiedades de los objetos de la ventana del gráfico.
El método que actualiza el objeto de gráfico y la lista con sus ventanas también ha sufrido cambios:
//+------------------------------------------------------------------+
//| Update the chart object and its window list                      |
//+------------------------------------------------------------------+
void CChartObj::Refresh(void)
  {
//--- Initialize event data
   this.m_is_event=false;
   this.m_hash_sum=0;
   this.m_list_events.Clear();
   this.m_list_events.Sort();
//--- Update all chart windows
   for(int i=0;i<this.m_list_wnd.Total();i++)
     {
      //--- Get the next chart window object from the list
      CChartWnd *wnd=this.m_list_wnd.At(i);
      if(wnd==NULL)
         continue;
      //--- Update the window and check its event flag
      //--- If the window has no event, move on to the next window
      wnd.Refresh();
      if(!wnd.IsEvent())
         continue;
      //--- Get the list of chart window events
      CArrayObj *list=wnd.GetListEvents();
      if(list==NULL)
         continue;
      //--- Set the chart event flag and get the last event code
      this.m_is_event=true;
      this.m_event_code=wnd.GetEventCode();
      //--- In the loop by the number of chart window events,
      int n=list.Total();
      for(int j=0; j<n; j++)
        {
         //--- get the base event object from the chart window event list
         CEventBaseObj *event=list.At(j);
         if(event==NULL)
            continue;
         //--- Create the chart window event parameters using the base event
         ushort event_id=event.ID();
         this.m_last_event=event_id;
         string sparam=(string)this.GetChartID()+"_"+(string)wnd.WindowNum();
         //--- if the event is on the foreground and the chart window event is added to the chart event list,
         if(::ChartGetInteger(this.ID(),CHART_BRING_TO_TOP) && this.EventAdd((ushort)event.ID(),event.LParam(),event.DParam(),sparam))
           {
            //--- send the newly created chart window event to the control program chart
            ::EventChartCustom(this.m_chart_id_main,(ushort)event_id,event.LParam(),event.DParam(),sparam);
           }
        }
     }

//--- Check changes of a symbol and chart period
   int change=(int)::ChartGetInteger(this.m_chart_id,CHART_WINDOWS_TOTAL)-this.WindowsTotal();
   if(change==0)
     {
      //--- Get a chart symbol and period by its ID
      string symbol=::ChartSymbol(this.ID());
      ENUM_TIMEFRAMES timeframe=::ChartPeriod(this.ID());
      //--- If a symbol and period are received
      if(symbol!=NULL && timeframe!=0)
        {
         //--- create the flags specifying the equality/non-equality of the obtained period symbol with the current ones
         bool symb=symbol!=this.m_symbol_prev;
         bool tf=timeframe!=this.m_timeframe_prev;
         //--- If case of any changes, find out their exact nature:
         if(symb || tf)
           {
            //--- If both a symbol and a timeframe changed
            if(symb && tf)
              {
               //--- Send the CHART_OBJ_EVENT_CHART_SYMB_TF_CHANGE event to the control program chart
               this.SendEvent(CHART_OBJ_EVENT_CHART_SYMB_TF_CHANGE);
               //--- Set a new symbol and a period for the object, and
               this.SetSymbol(symbol);
               this.SetTimeframe(timeframe);
               //--- write the current symbol/period as the previous ones
               this.m_symbol_prev=this.Symbol();
               this.m_timeframe_prev=this.Timeframe();
              }
            //--- If only a chart symbol is changed
            else if(symb)
              {
               //--- Send the CHART_OBJ_EVENT_CHART_SYMB_CHANGE event to the control program chart
               this.SendEvent(CHART_OBJ_EVENT_CHART_SYMB_CHANGE);
               //--- Set a new symbol for the object and write the current symbol as the previous one
               this.SetSymbol(symbol);
               this.m_symbol_prev=this.Symbol();
              }
            //--- If only a chart period is changed
            else if(tf)
              {
               //--- Send the CHART_OBJ_EVENT_CHART_TF_CHANGE event to the control program chart
               this.SendEvent(CHART_OBJ_EVENT_CHART_TF_CHANGE);
               //--- Set a new timeframe for the object and write the current timeframe as the previous one
               this.SetTimeframe(timeframe);
               this.m_timeframe_prev=this.Timeframe();
              }
           }
        }
      //--- Update chart data
      if(this.SetIntegerParameters())
        {
         this.SetDoubleParameters();
         this.SetStringParameters();
        }
      //--- Fill in the current chart data
      for(int i=0;i<CHART_PROP_INTEGER_TOTAL;i++)
         this.m_long_prop_event[i][3]=this.m_long_prop[i];
      for(int i=0;i<CHART_PROP_DOUBLE_TOTAL;i++)
         this.m_double_prop_event[i][3]=this.m_double_prop[i];
      //--- Update the base object data and search for changes
      CBaseObjExt::Refresh();
      this.CheckEvents();
     }
   else
     {
      this.RecreateWindowsList(change);
     }
  }
//+------------------------------------------------------------------+
Hemos comentado todo con detalle en el listado del método. Resumiendo:
Después de actualizar los objetos de la ventana de gráfico, deberemos verificar la bandera de evento de cada ventana. Si la ventana tiene eventos, cada uno de sus eventos deberá enviarse al gráfico del programa de control. Una vez actualizadas las ventanas del gráfico y verificados sus eventos, deberemos comprobar el cambio en el símbolo y/o periodo del gráfico en caso de que no haya más cambios en el gráfico.
En el método encargado de crear y enviar un evento del gráfico al gráfico del programa de control, añadimos el procesamiento del evento de cambio de símbolo y/o periodo del gráfico:
//+------------------------------------------------------------------+
//| Create and send a chart event                                    |
//| to the control program chart                                     |
//+------------------------------------------------------------------+
void CChartObj::SendEvent(ENUM_CHART_OBJ_EVENT event)
  {
   //--- If a window is added
   if(event==CHART_OBJ_EVENT_CHART_WND_ADD)
     {
      //--- Get the last chart window object added to the list
      CChartWnd *wnd=this.GetLastAddedWindow();
      if(wnd==NULL)
         return;
      //--- Send the CHART_OBJ_EVENT_CHART_WND_ADD event to the control program chart
      //--- pass the chart ID to lparam,
      //--- pass the chart window index to dparam,
      //--- pass the chart symbol to sparam
      ::EventChartCustom(this.m_chart_id_main,(ushort)event,this.m_chart_id,wnd.WindowNum(),this.Symbol());
     }
   //--- If the window is removed
   else if(event==CHART_OBJ_EVENT_CHART_WND_DEL)
     {
      //--- Get the last chart window object added to the list of removed windows
      CChartWnd *wnd=this.GetLastDeletedWindow();
      if(wnd==NULL)
         return;
      //--- Send the CHART_OBJ_EVENT_CHART_WND_DEL event to the control program chart
      //--- pass the chart ID to lparam,
      //--- pass the chart window index to dparam,
      //--- pass the chart symbol to sparam
      ::EventChartCustom(this.m_chart_id_main,(ushort)event,this.m_chart_id,wnd.WindowNum(),this.Symbol());
     }
   //--- If symbol and timeframe changed
   else if(event==CHART_OBJ_EVENT_CHART_SYMB_TF_CHANGE)
     {
      //--- Send the CHART_OBJ_EVENT_CHART_SYMB_TF_CHANGE event to the control program chart
      //--- pass the chart ID to lparam,
      //--- pass the previous timeframe to dparam,
      //--- pass the previous chart symbol to sparam
      ::EventChartCustom(this.m_chart_id_main,(ushort)event,this.m_chart_id,this.m_timeframe_prev,this.m_symbol_prev);
     }
   //--- If a symbol changed
   else if(event==CHART_OBJ_EVENT_CHART_SYMB_CHANGE)
     {
      //--- Send the CHART_OBJ_EVENT_CHART_SYMB_CHANGE event to the control program chart
      //--- pass the chart ID to lparam,
      //--- pass the current timeframe to dparam,
      //--- pass the previous chart symbol to sparam
      ::EventChartCustom(this.m_chart_id_main,(ushort)event,this.m_chart_id,this.Timeframe(),this.m_symbol_prev);
     }
   //--- If a timeframe changed
   else if(event==CHART_OBJ_EVENT_CHART_TF_CHANGE)
     {
      //--- Send the CHART_OBJ_EVENT_CHART_TF_CHANGE event to the control program chart
      //--- pass the chart ID to lparam,
      //--- pass the previous timeframe to dparam,
      //--- pass the current chart symbol to sparam
      ::EventChartCustom(this.m_chart_id_main,(ushort)event,this.m_chart_id,this.m_timeframe_prev,this.Symbol());
     }
  }
//+------------------------------------------------------------------+
Aquí tambien detallamos minuciosamente todo en los comentarios al código, así que esperamos que no haya preguntas. En cualquier caso, el lector podrá plantear cualquier duda en los comentarios al artículo.
Ahora, vamos a modificar la clase de colección de objetos de gráfico en el archivo \MQL5\Include\DoEasy\Collections\ChartObjCollection.mqh.
En primer lugar, haremos que herede de la clase del objeto básico ampliado, y luego añadiremos una variable a la sección privada de la clase encargada de guardar el último evento:
//+------------------------------------------------------------------+
//| MQL5 signal object collection                                    |
//+------------------------------------------------------------------+
class CChartObjCollection : public CBaseObjExt
  {
private:
   CListObj                m_list;                                   // List of chart objects
   CListObj                m_list_del;                               // List of deleted chart objects
   CArrayObj               m_list_wnd_del;                           // List of deleted chart window objects
   CArrayObj               m_list_ind_del;                           // List of indicators removed from the indicator window
   CArrayObj               m_list_ind_param;                         // List of changed indicators
   int                     m_charts_total_prev;                      // Previous number of charts in the terminal
   int                     m_last_event;                             // The last event
   //--- Return the number of charts in the terminal
   int                     ChartsTotal(void) const;
   //--- Return the flag indicating the existence of (1) a chart object and (2) a chart
   bool                    IsPresentChartObj(const long chart_id);
   bool                    IsPresentChart(const long chart_id);
   //--- Create a new chart object and add it to the list
   bool                    CreateNewChartObj(const long chart_id,const string source);
   //--- Find the missing chart object, create it and add it to the collection list
   bool                    FindAndCreateMissingChartObj(void);
   //--- Find a chart object not present in the terminal and remove it from the list
   void                    FindAndDeleteExcessChartObj(void);
public:
En la sección pública de la clase, escribimos los tres métodos necesarios para trabajar con la funcionalidad de eventos del objeto básico ampliado y declaramos el método que indica el objeto de ventana (especificado por el índice) del gráfico (especificado por el identificador):
//--- Return (1) the flag event, (2) an event of one of the charts and (3) the last event
   bool                    IsEvent(void)                             const { return this.m_is_event;                                   }
   int                     GetLastEventsCode(void)                   const { return this.m_event_code;                                 }
   int                     GetLastEvent(void)                        const { return this.m_last_event;                                 }

//--- Constructor
                           CChartObjCollection();

//--- Return the list of chart objects by (1) symbol and (2) timeframe
   CArrayObj              *GetChartsList(const string symbol)              { return this.GetList(CHART_PROP_SYMBOL,symbol,EQUAL);      }
   CArrayObj              *GetChartsList(const ENUM_TIMEFRAMES timeframe)  { return this.GetList(CHART_PROP_TIMEFRAME,timeframe,EQUAL);}
//--- Return the pointer to the chart object (1) by ID and (2) by an index in the list
   CChartObj              *GetChart(const long id);
   CChartObj              *GetChart(const int index)                       { return this.m_list.At(index);                             }
//--- Return (1) the last added chart and (2) the last removed chart
   CChartObj              *GetLastAddedChart(void)                         { return this.m_list.At(this.m_list.Total()-1);             }
   CChartObj              *GetLastDeletedChart(void)                       { return this.m_list_del.At(this.m_list_del.Total()-1);     }

//--- Return (1) the last added window on the chart by chart ID and (2) the last removed chart window
   CChartWnd              *GetLastAddedChartWindow(const long chart_id);
   CChartWnd              *GetLastDeletedChartWindow(void)                 { return this.m_list_wnd_del.At(this.m_list_wnd_del.Total()-1);}
//--- Return the window object (specified by index) of the chart (specified by ID)
   CChartWnd              *GetChartWindow(const long chart_id,const int wnd_num);
En el método que actualiza la lista de colección de objetos de gráfico, escribimos el manejador de eventos para los objetos del gráfico:
//+------------------------------------------------------------------+
//| Update the collection list of chart objects                      |
//+------------------------------------------------------------------+
void CChartObjCollection::Refresh(void)
  {
//--- Initialize event data
   this.m_is_event=false;
   this.m_hash_sum=0;
   this.m_list_events.Clear();
   this.m_list_events.Sort();
   //--- In the loop by the number of chart objects in the collection list
   for(int i=0;i<this.m_list.Total();i++)
     {
      //--- get the next chart object and
      CChartObj *chart=this.m_list.At(i);
      if(chart==NULL)
         continue;
      //--- update it
      chart.Refresh();
      //--- If there is no chart event, move on to the next one
      if(!chart.IsEvent())
         continue;
      //--- Get the list of events of a selected chart
      CArrayObj *list=chart.GetListEvents();
      if(list==NULL)
         continue;
      //--- Set the event flag in the chart collection and get the last event code
      this.m_is_event=true;
      this.m_event_code=chart.GetEventCode();
      //--- In the loop by the chart event list,
      int n=list.Total();
      for(int j=0; j<n; j++)
        {
         //--- get the base event object from the chart event list
         CEventBaseObj *event=list.At(j);
         if(event==NULL)
            continue;
         //--- Create the chart event parameters using the base event
         ushort event_id=event.ID();
         this.m_last_event=event_id;
         string sparam=(string)this.GetChartID();
         //--- and, if the chart event is added to the chart event list,
         if(this.EventAdd((ushort)event.ID(),event.LParam(),event.DParam(),sparam))
           {
            //--- send the newly created chart event to the control program chart
            ::EventChartCustom(this.m_chart_id_main,(ushort)event_id,event.LParam(),event.DParam(),sparam);
           }
        }
     }

   //--- Get the number of open charts in the terminal and
   int charts_total=this.ChartsTotal();
   //--- calculate the difference between the number of open charts in the terminal
   //--- and chart objects in the collection list. These values are displayed in the chart comment
   int change=charts_total-this.m_list.Total();
   //--- If there are no changes, leave
   if(change==0)
      return;
   //--- If a chart is added in the terminal
   if(change>0)
     {
      //--- Find the missing chart object, create and add it to the collection list
      this.FindAndCreateMissingChartObj();
      //--- Get the current chart and return to it since
      //--- adding a new chart switches the focus to it
      CChartObj *chart=this.GetChart(GetMainChartID());
      if(chart!=NULL)
         chart.SetBringToTopON(true);
      for(int i=0;i<change;i++)
        {
         chart=m_list.At(m_list.Total()-(1+i));
         if(chart==NULL)
            continue;
         this.SendEvent(CHART_OBJ_EVENT_CHART_OPEN);
        }
     }
   //--- If a chart is removed in the terminal
   else if(change<0)
     {
      //--- Find an extra chart object in the collection list and remove it from the list
      this.FindAndDeleteExcessChartObj();
      for(int i=0;i<-change;i++)
        {
         CChartObj *chart=this.m_list_del.At(this.m_list_del.Total()-(1+i));
         if(chart==NULL)
            continue;
         this.SendEvent(CHART_OBJ_EVENT_CHART_CLOSE);
        }
     }
  }
//+------------------------------------------------------------------+
La lógica aquí es la misma que en los métodos analizados anteriormente para actualizar los objetos de gráfico y los objetos de ventana del gráfico; todo se especifica con detalle en los comentarios.
Método que retorna el objeto de ventana (especificado por el índice) del gráfico (especificado por el identificador):
//+------------------------------------------------------------------+
//| Return the window object (specified by index)                    |
//| of the chart (specified by ID)                                   |
//+------------------------------------------------------------------+
CChartWnd* CChartObjCollection::GetChartWindow(const long chart_id,const int wnd_num)
  {
   CChartObj *chart=this.GetChart(chart_id);
   if(chart==NULL)
      return NULL;
   return chart.GetWindowByNum(wnd_num);
  }
//+------------------------------------------------------------------+
Aquí, obtenemos el objeto de gráfico según su identificador y retornamos la ventana que pertenece al gráfico obtenido según el número de ventana indicado.
Si no se ha obtenido alguno de los objetos, el método retornará NULL.
Ahora, vamos a añadir el mismo método a la clase principal de la biblioteca CEngine, en el archivo \MQL5\Include\DoEasy\Engine.mqh:
//--- Return the object (1) of the last added window of the specified chart and (2) the last removed chart window
   CChartWnd           *ChartGetLastAddedChartWindow(const long chart_id)              { return this.m_charts.GetLastAddedChartWindow(chart_id);}
   CChartWnd           *ChartGetLastDeletedChartWindow(void)                           { return this.m_charts.GetLastDeletedChartWindow();   }
//--- Return the window object (specified by index) of the chart (specified by ID)
   CChartWnd           *ChartGetChartWindow(const long chart_id,const int wnd_num)     { return this.m_charts.GetChartWindow(chart_id,wnd_num);}
El método simplemente retorna el resultado de la llamada al método GetChartWindow() de la clase de colección de objetos de gráfico que hemos analizado antes.
Con esto, damos por finalizados todos los cambios y mejoras. Vamos a ver qué hemos obtenido.
Simulación
Para la simulación, vamos a tomar el asesor del artículo anterior y a guardarlo en la nueva carpeta \MQL5\Experts\TestDoEasy\Part72\ con el nuevo nombre TestDoEasyPart72.mq5.
En el asesor experto, necesitaremos establecer algunas propiedades de los objetos de ventana del gráfico para monitorear y añadir el procesamiento de todos los nuevos eventos entrantes de la colección de objetos de gráfico.
En la función del asesor OnInitDoEasy(), al final, añadimos un bloque de código en el que estableceremos las propiedades de las ventanas de gráfico necesarias para el seguimiento (no mostraremos el código completo de la función, es demasiado voluminoso):
//--- Set controlled values for the current account
   CAccount* account=engine.GetAccountCurrent();
   if(account!=NULL)
     {
      //--- Set control of the profit increase to 10
      account.SetControlledValueINC(ACCOUNT_PROP_PROFIT,10.0);
      //--- Set control of the funds increase to 15
      account.SetControlledValueINC(ACCOUNT_PROP_EQUITY,15.0);
      //--- Set profit control level to 20
      account.SetControlledValueLEVEL(ACCOUNT_PROP_PROFIT,20.0);
     }

//--- Set controlled values for charts
   //--- Get the list of all collection charts
   CArrayObj *list_charts=engine.GetListCharts();
   if(list_charts!=NULL && list_charts.Total()>0)
     {
      //--- In a loop by the list, set the necessary values for tracked chart properties
      //--- By default, the LONG_MAX value is set to all properties, which means "Do not track this property"
      //--- It can be enabled or disabled (by setting the value less than LONG_MAX or vice versa - set the LONG_MAX value) at any time and anywhere in the program
      for(int i=0;i<list_charts.Total();i++)
        {
         CChartObj* chart=list_charts.At(i);
         if(chart==NULL)
            continue;
         //--- Set reference values for the selected chart windows
         int total_wnd=chart.WindowsTotal();
         for(int j=0;j<total_wnd;j++)
           {
            CChartWnd *wnd=engine.ChartGetChartWindow(chart.ID(),j);
            if(wnd==NULL)
               continue;
            //--- Set control of the chart window height increase by 20 pixels
            wnd.SetControlHeightInPixelsInc(20);
            //--- Set control of the chart window height decrease by 20 pixels
            wnd.SetControlHeightInPixelsDec(20);
            //--- Set the control height of the chart window to 50 pixels
            wnd.SetControlledValueLEVEL(CHART_WINDOW_PROP_HEIGHT_IN_PIXELS,50);
           }
        }
     }

//--- Get the end of the library initialization time counting and display it in the journal
   ulong end=GetTickCount();
   Print(TextByLanguage("Время инициализации библиотеки: ","Library initialization time: "),TimeMSCtoString(end-begin,TIME_MINUTES|TIME_SECONDS));
  }
//+------------------------------------------------------------------+
Aquí, estableceremos parámetros tales que:
- Si la altura de la ventana aumenta en más de 20 píxeles, se generará el evento correspondiente,
- Si la altura de la ventana se reduce en más de 20 píxeles, se generará el evento correspondiente,
- Si la altura de la ventana es mayor, menor o igual a 50 píxeles, se generará el evento correspondiente.
En la función del asesor OnDoEasyEvent(), escribimos el procesamiento de todos los nuevos eventos de la biblioteca (solo el bloque completo de código para procesar todos los eventos de la colección de gráficos, incluidos los nuevos):
//--- Handling timeseries events
   else if(idx>SERIES_EVENTS_NO_EVENT && idx<SERIES_EVENTS_NEXT_CODE)
     {
      //--- "New bar" event
      if(idx==SERIES_EVENTS_NEW_BAR)
        {
         Print(TextByLanguage("Новый бар на ","New Bar on "),sparam," ",TimeframeDescription((ENUM_TIMEFRAMES)dparam),": ",TimeToString(lparam));
        }
     }

//--- Handle chart auto events
//--- Handle chart and window events
   if(source==COLLECTION_CHART_WND_ID)
     {
      int pos=StringFind(sparam,"_");
      long chart_id=StringToInteger(StringSubstr(sparam,0,pos));
      int wnd_num=(int)StringToInteger(StringSubstr(sparam,pos+1));

      CChartObj *chart=engine.ChartGetChartObj(chart_id);
      if(chart==NULL)
         return;
      CSymbol *symbol=engine.GetSymbolObjByName(chart.Symbol());
      if(symbol==NULL)
         return;
      CChartWnd *wnd=chart.GetWindowByNum(wnd_num);
      if(wnd==NULL)
         return;
      //--- Number of decimal places in the event value - in case of a 'long' event, it is 0, otherwise - Digits() of a symbol
      int digits=(idx<CHART_WINDOW_PROP_INTEGER_TOTAL ? 0 : symbol.Digits());
      //--- Event text description
      string id_descr=(idx<CHART_WINDOW_PROP_INTEGER_TOTAL ? wnd.GetPropertyDescription((ENUM_CHART_WINDOW_PROP_INTEGER)idx) : wnd.GetPropertyDescription((ENUM_CHART_WINDOW_PROP_DOUBLE)idx));
      //--- Property change text value
      string value=DoubleToString(dparam,digits);

      //--- Check event reasons and display its description in the journal
      if(reason==BASE_EVENT_REASON_INC)
        {
         Print(wnd.EventDescription(idx,(ENUM_BASE_EVENT_REASON)reason,source,value,id_descr,digits));
        }
      if(reason==BASE_EVENT_REASON_DEC)
        {
         Print(wnd.EventDescription(idx,(ENUM_BASE_EVENT_REASON)reason,source,value,id_descr,digits));
        }
      if(reason==BASE_EVENT_REASON_MORE_THEN)
        {
         Print(wnd.EventDescription(idx,(ENUM_BASE_EVENT_REASON)reason,source,value,id_descr,digits));
        }
      if(reason==BASE_EVENT_REASON_LESS_THEN)
        {
         Print(wnd.EventDescription(idx,(ENUM_BASE_EVENT_REASON)reason,source,value,id_descr,digits));
        }
      if(reason==BASE_EVENT_REASON_EQUALS)
        {
         Print(wnd.EventDescription(idx,(ENUM_BASE_EVENT_REASON)reason,source,value,id_descr,digits));
        }
     }
//--- Handle chart auto events
   if(source==COLLECTION_CHARTS_ID)
     {
      long chart_id=StringToInteger(sparam);

      CChartObj *chart=engine.ChartGetChartObj(chart_id);
      if(chart==NULL)
         return;
      Print(DFUN,"chart_id=",chart_id,", chart.Symbol()=",chart.Symbol());
      //--- Number of decimal places in the event value - in case of a 'long' event, it is 0, otherwise - Digits() of a symbol
      int digits=int(idx<CHART_PROP_INTEGER_TOTAL ? 0 : SymbolInfoInteger(chart.Symbol(),SYMBOL_DIGITS));
      //--- Event text description
      string id_descr=(idx<CHART_PROP_INTEGER_TOTAL ? chart.GetPropertyDescription((ENUM_CHART_PROP_INTEGER)idx) : chart.GetPropertyDescription((ENUM_CHART_PROP_DOUBLE)idx));
      //--- Property change text value
      string value=DoubleToString(dparam,digits);

      //--- Check event reasons and display its description in the journal
      if(reason==BASE_EVENT_REASON_INC)
        {
         Print(chart.EventDescription(idx,(ENUM_BASE_EVENT_REASON)reason,source,value,id_descr,digits));
        }
      if(reason==BASE_EVENT_REASON_DEC)
        {
         Print(chart.EventDescription(idx,(ENUM_BASE_EVENT_REASON)reason,source,value,id_descr,digits));
        }
      if(reason==BASE_EVENT_REASON_MORE_THEN)
        {
         Print(chart.EventDescription(idx,(ENUM_BASE_EVENT_REASON)reason,source,value,id_descr,digits));
        }
      if(reason==BASE_EVENT_REASON_LESS_THEN)
        {
         Print(chart.EventDescription(idx,(ENUM_BASE_EVENT_REASON)reason,source,value,id_descr,digits));
        }
      if(reason==BASE_EVENT_REASON_EQUALS)
        {
         Print(chart.EventDescription(idx,(ENUM_BASE_EVENT_REASON)reason,source,value,id_descr,digits));
        }
     }

//--- Handle non-auto chart events
   else if(idx>CHART_OBJ_EVENT_NO_EVENT && idx<CHART_OBJ_EVENTS_NEXT_CODE)
     {
      //--- "New chart opening" event
      if(idx==CHART_OBJ_EVENT_CHART_OPEN)
        {
         //::EventChartCustom(this.m_chart_id_main,(ushort)event,chart.ID(),chart.Timeframe(),chart.Symbol());
         CChartObj *chart=engine.ChartGetLastOpenedChart();
         if(chart!=NULL)
           {
            string symbol=sparam;
            long chart_id=lparam;
            ENUM_TIMEFRAMES timeframe=(ENUM_TIMEFRAMES)dparam;
            string header=symbol+" "+TimeframeDescription(timeframe)+", ID "+(string)chart_id;
            Print(DFUN,CMessage::Text(MSG_CHART_COLLECTION_CHART_OPENED),": ",header);
           }
        }
      //--- "Chart closure" event
      if(idx==CHART_OBJ_EVENT_CHART_CLOSE)
        {
         //::EventChartCustom(this.m_chart_id_main,(ushort)event,chart.ID(),chart.Timeframe(),chart.Symbol());
         CChartObj *chart=engine.ChartGetLastClosedChart();
         if(chart!=NULL)
           {
            string symbol=sparam;
            long   chart_id=lparam;
            ENUM_TIMEFRAMES timeframe=(ENUM_TIMEFRAMES)dparam;
            string header=symbol+" "+TimeframeDescription(timeframe)+", ID "+(string)chart_id;
            Print(DFUN,CMessage::Text(MSG_CHART_COLLECTION_CHART_CLOSED),": ",header);
           }
        }
      //--- "Chart symbol changed" event
      if(idx==CHART_OBJ_EVENT_CHART_SYMB_CHANGE)
        {
         //::EventChartCustom(this.m_chart_id_main,(ushort)event,this.m_chart_id,this.Timeframe(),this.m_symbol_prev);
         long chart_id=lparam;
         ENUM_TIMEFRAMES timeframe=(ENUM_TIMEFRAMES)dparam;
         string symbol_prev=sparam;
         CChartObj *chart=engine.ChartGetChartObj(chart_id);
         if(chart!=NULL)
           {
            string header=chart.Symbol()+" "+TimeframeDescription(timeframe)+", ID "+(string)chart_id;
            Print(DFUN,CMessage::Text(MSG_CHART_COLLECTION_CHART_SYMB_CHANGED),": ",header,": ",symbol_prev," >>> ",chart.Symbol());
           }
        }
      //--- "Chart timeframe changed" event
      if(idx==CHART_OBJ_EVENT_CHART_TF_CHANGE)
        {
         //::EventChartCustom(this.m_chart_id_main,(ushort)event,this.m_chart_id,this.m_timeframe_prev,this.Symbol());
         long chart_id=lparam;
         ENUM_TIMEFRAMES timeframe_prev=(ENUM_TIMEFRAMES)dparam;
         string symbol=sparam;
         CChartObj *chart=engine.ChartGetChartObj(chart_id);
         if(chart!=NULL)
           {
            string header=chart.Symbol()+" "+TimeframeDescription(chart.Timeframe())+", ID "+(string)chart_id;
            Print
              (
               DFUN,CMessage::Text(MSG_CHART_COLLECTION_CHART_TF_CHANGED),": ",header,": ",
               TimeframeDescription(timeframe_prev)," >>> ",TimeframeDescription(chart.Timeframe())
              );
           }
        }
      //--- "Chart symbol and timeframe changed" event
      if(idx==CHART_OBJ_EVENT_CHART_SYMB_TF_CHANGE)
        {
         //::EventChartCustom(this.m_chart_id_main,(ushort)event,this.m_chart_id,this.m_timeframe_prev,this.m_symbol_prev);
         long chart_id=lparam;
         ENUM_TIMEFRAMES timeframe_prev=(ENUM_TIMEFRAMES)dparam;
         string symbol_prev=sparam;
         CChartObj *chart=engine.ChartGetChartObj(chart_id);
         if(chart!=NULL)
           {
            string header=chart.Symbol()+" "+TimeframeDescription(chart.Timeframe())+", ID "+(string)chart_id;
            Print
              (
               DFUN,CMessage::Text(MSG_CHART_COLLECTION_CHART_SYMB_TF_CHANGED),": ",header,": ",
               symbol_prev," >>> ",chart.Symbol(),", ",TimeframeDescription(timeframe_prev)," >>> ",TimeframeDescription(chart.Timeframe())
              );
           }
        }

      //--- "Adding a new window on the chart" event
      if(idx==CHART_OBJ_EVENT_CHART_WND_ADD)
        {
         //::EventChartCustom(this.m_chart_id_main,(ushort)event,this.m_chart_id,wnd.WindowNum(),this.Symbol());
         ENUM_TIMEFRAMES timeframe=WRONG_VALUE;
         string ind_name="";
         string symbol=sparam;
         long   chart_id=lparam;
         int    win_num=(int)dparam;
         string header=symbol+" "+TimeframeDescription(timeframe)+", ID "+(string)chart_id+": ";

         CChartObj *chart=engine.ChartGetLastOpenedChart();
         if(chart!=NULL)
           {
            timeframe=chart.Timeframe();
            CChartWnd *wnd=engine.ChartGetLastAddedChartWindow(chart.ID());
            if(wnd!=NULL)
              {
               CWndInd *ind=wnd.GetLastAddedIndicator();
               if(ind!=NULL)
                  ind_name=ind.Name();
              }
           }
         Print(DFUN,header,CMessage::Text(MSG_CHART_OBJ_WINDOW_ADDED)," ",(string)win_num," ",ind_name);
        }
      //--- "Removing a window from the chart" event
      if(idx==CHART_OBJ_EVENT_CHART_WND_DEL)
        {
         //::EventChartCustom(this.m_chart_id_main,(ushort)event,this.m_chart_id,wnd.WindowNum(),this.Symbol());
         CChartWnd *wnd=engine.ChartGetLastDeletedChartWindow();
         ENUM_TIMEFRAMES timeframe=WRONG_VALUE;
         string symbol=sparam;
         long   chart_id=lparam;
         int    win_num=(int)dparam;
         string header=symbol+" "+TimeframeDescription(timeframe)+", ID "+(string)chart_id+": ";
         Print(DFUN,header,CMessage::Text(MSG_CHART_OBJ_WINDOW_REMOVED)," ",(string)win_num);
        }
      //--- "Adding a new indicator to the chart window" event
      if(idx==CHART_OBJ_EVENT_CHART_WND_IND_ADD)
        {
         //::EventChartCustom(this.m_chart_id_main,(ushort)event,this.m_chart_id,this.WindowNum(),ind.Name());
         ENUM_TIMEFRAMES timeframe=WRONG_VALUE;
         string ind_name=sparam;
         string symbol=NULL;
         long   chart_id=lparam;
         int    win_num=(int)dparam;
         string header=NULL;

         CWndInd *ind=engine.ChartGetLastAddedIndicator(chart_id,win_num);
         if(ind!=NULL)
           {
            CChartObj *chart=engine.ChartGetChartObj(chart_id);
            if(chart!=NULL)
              {
               symbol=chart.Symbol();
               timeframe=chart.Timeframe();
               CChartWnd *wnd=chart.GetWindowByNum(win_num);
               if(wnd!=NULL)
                  header=wnd.Header();
              }
           }
         Print(DFUN,symbol," ",TimeframeDescription(timeframe),", ID ",chart_id,", ",header,": ",CMessage::Text(MSG_CHART_OBJ_INDICATOR_ADDED)," ",ind_name);
        }
      //--- "Removing an indicator from the chart window" event
      if(idx==CHART_OBJ_EVENT_CHART_WND_IND_DEL)
        {
         //::EventChartCustom(this.m_chart_id_main,(ushort)event,this.m_chart_id,this.WindowNum(),ind.Name());
         ENUM_TIMEFRAMES timeframe=WRONG_VALUE;
         string ind_name=sparam;
         string symbol=NULL;
         long   chart_id=lparam;
         int    win_num=(int)dparam;
         string header=NULL;

         CWndInd *ind=engine.ChartGetLastDeletedIndicator();
         if(ind!=NULL)
           {
            CChartObj *chart=engine.ChartGetChartObj(chart_id);
            if(chart!=NULL)
              {
               symbol=chart.Symbol();
               timeframe=chart.Timeframe();
               CChartWnd *wnd=chart.GetWindowByNum(win_num);
               if(wnd!=NULL)
                  header=wnd.Header();
              }
           }
         Print(DFUN,symbol," ",TimeframeDescription(timeframe),", ID ",chart_id,", ",header,": ",CMessage::Text(MSG_CHART_OBJ_INDICATOR_REMOVED)," ",ind_name);
        }
      //--- "Changing indicator parameters in the chart window" event
      if(idx==CHART_OBJ_EVENT_CHART_WND_IND_CHANGE)
        {
         //::EventChartCustom(this.m_chart_id_main,(ushort)event,this.m_chart_id,this.WindowNum(),ind.Name());
         ENUM_TIMEFRAMES timeframe=WRONG_VALUE;
         string ind_name=sparam;
         string symbol=NULL;
         long   chart_id=lparam;
         int    win_num=(int)dparam;
         string header=NULL;

         CWndInd *ind=NULL;
         CWndInd *ind_changed=engine.ChartGetLastChangedIndicator();
         if(ind_changed!=NULL)
           {
            ind=engine.ChartGetIndicator(chart_id,win_num,ind_changed.Index());
            if(ind!=NULL)
              {
               CChartObj *chart=engine.ChartGetChartObj(chart_id);
               if(chart!=NULL)
                 {
                  symbol=chart.Symbol();
                  timeframe=chart.Timeframe();
                  CChartWnd *wnd=chart.GetWindowByNum(win_num);
                  if(wnd!=NULL)
                     header=wnd.Header();
                 }
              }
           }
         Print(DFUN,symbol," ",TimeframeDescription(timeframe),", ID ",chart_id,", ",header,": ",CMessage::Text(MSG_CHART_OBJ_INDICATOR_CHANGED)," ",ind_name," >>> ",ind.Name());
        }
     }

//--- Handling trading events
Estos son todos los cambios necesarios para poner a prueba la funcionalidad de eventos automática creada de la colección de gráficos y monitorear los cambios en los parámetros especificados de los objetos de la colección.
Vamos a compilar el asesor experto e iniciarlo en el gráfico EURUSD, estableciendo previamente la configuración para usar los dos símbolos EURUSD y GBPUSD, y el marco temporal actual:
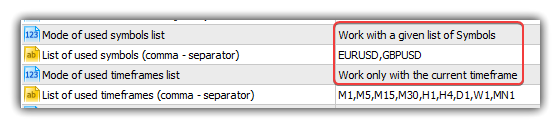
Ambos gráficos deberán estar abiertos de antemano. Iniciamos el asesor en EURUSD, mientras que GBPUSD deberá tener una subventana con cualquier indicador de oscilador; usaremos esta subventana para controlar la funcionalidad de eventos de la clase de colección de gráficos.
Revisamos el funcionamiento de los eventos de cambio de marco temporal del gráfico:
Ahora, comprobamos el cambio del símbolo del gráfico:
Comprobemos el control del cambio de altura de los gráficos (los cambios se aplicarán a dos gráficos: la ventana principal y la subventana del gráfico):

Como podemos ver, aquí han actuado varios criterios: la altura de la ventana es igual al tamaño especificado, la altura de la ventana es mayor/menor que el tamaño especificado y la altura de la ventana aumenta/disminuye en un número de píxeles superior al especificado.
¿Qué es lo próximo?
En el próximo artículo, comenzaremos una nueva etapa en la creación de la biblioteca: el trabajo con los objetos gráficos y los gráficos personalizados.
Más abajo se adjuntan todos los archivos de la versión actual de la biblioteca y el archivo del asesor de prueba para MQL5. Puede descargarlo todo y ponerlo a prueba por sí mismo.
Si tiene preguntas, observaciones o sugerencias, podrá concretarlas en los comentarios al artículo.
*Artículos de esta serie:
Otras clases en la biblioteca DoEasy (Parte 67): Clase de objeto de gráfico
Otras clases en la biblioteca DoEasy (Parte 68): Clase de objeto de ventana de gráfico y clases de objetos de indicador en la ventana del gráfico
Otras clases en la biblioteca DoEasy (Parte 69): Clases de colección de objetos de gráfico
Otras clases en la biblioteca DoEasy (Parte 70): Ampliación de la funcionalidad y actualización automática de la colección de objetos de gráfico
Otras clases en la biblioteca DoEasy (Parte 71): Eventos de la colección de objetos de gráfico
Traducción del ruso hecha por MetaQuotes Ltd.
Artículo original: https://www.mql5.com/ru/articles/9385
Advertencia: todos los derechos de estos materiales pertenecen a MetaQuotes Ltd. Queda totalmente prohibido el copiado total o parcial.
Este artículo ha sido escrito por un usuario del sitio web y refleja su punto de vista personal. MetaQuotes Ltd. no se responsabiliza de la exactitud de la información ofrecida, ni de las posibles consecuencias del uso de las soluciones, estrategias o recomendaciones descritas.

 Consejos de un programador profesional (parte II): Organizando el almacenamiento y el intercambio de parámetros entre el experto, los scripts y los programas externos
 Combinatoria y teoría de la probabilidad en el trading (Parte I): Fundamentos
- Aplicaciones de trading gratuitas
- 8 000+ señales para copiar
- Noticias económicas para analizar los mercados financieros
Usted acepta la política del sitio web y las condiciones de uso
Artem, he leído sus artículos hasta el 34.
En ella ha terminado solicitudes pendientes, el video al final muestra que se abre una orden y hacer una solicitud pendiente para establecer el TP SL, después de lo cual se establece el TP SL, pero SL se elimina después de un segundo.
Poganyal hurgó en el panel, no se puede utilizar simultáneamente la solicitud pendiente tanto en puntos como en tiempo, cuando se activa o detener se elimina o tomar.
He descargado el Asesor de Expertos del artículo 72, lo comprobé, el mismo problema, el primer disparador es el último que se hace clic en el panel.
Artem, he terminado de leer tus artículos hasta el 34.
En ella ha terminado solicitudes pendientes, el video al final muestra que se abre una orden y hacer una solicitud pendiente para establecer un SL TP, después de lo cual se establece un SL TP, pero el SL se elimina después de un segundo.
He husmeado por el panel, no puedo usar la solicitud pendiente tanto en pips como en tiempo al mismo tiempo, o se borra el stop o se borra la toma cuando se activa.
Descargué el Asesor Experto del artículo 72, lo comprobé, el mismo problema, el primero dispara lo último que pulsé en el panel.
Gracias. Tendré tiempo de investigarlo. Lo más probable, a primera vista, es que cuando se dispara una solicitud pendiente, se borren las demás. Echaré un vistazo cuando tenga tiempo. En cualquier caso, la biblioteca aún está en fase de perfeccionamiento, y estos fallos tienen derecho a existir. Lo principal es que haya comentarios de los interesados, y entonces todo se arreglará.
Gracias. Tendré que echar un vistazo cuando tenga tiempo. Lo más probable, a primera vista, es que cuando se activa una solicitud pendiente, las demás se borren también. Echaré un vistazo cuando tenga tiempo. En cualquier caso, la biblioteca todavía está en fase de perfeccionamiento, y estos fallos tienen derecho a existir. Lo principal es que los interesados den su opinión, y entonces todo se arreglará.
Estoy interesado ))) Leer y entender todavía creo que un par de semanas sólo en los artículos que, al menos, en sentido figurado entender cómo todo está organizado y cómo usarlo ... y no puedo imaginar cuánto en la práctica todavía ).
He estado esperando durante mucho tiempo cuando habrá artículos competentes y lo más importante una biblioteca OOP en toda regla con el trabajo en la Bolsa de Moscú. El año pasado yo estaba fuera de la vida y no visitó el recurso, pero aquí vine y me quedé horrorizado por las toneladas de material superior.
Gracias por el trabajo realizado, honestamente hablando encantado de cómo los cerebros de las personas pueden trabajar en este plan
Estoy interesado )) Creo que voy a leer y entender durante un par de semanas sólo en artículos para al menos entender figurativamente cómo funciona todo y cómo usarlo ... y no sé cuánto más en la práctica ).
He estado esperando durante mucho tiempo cuando habrá artículos competentes y lo más importante una biblioteca OOP en toda regla con el trabajo en la Bolsa de Moscú. El año pasado estaba fuera de la vida y no visitó el recurso, pero aquí vine y me quedé horrorizado por las toneladas de material superior.
Gracias por el trabajo realizado, honestamente hablando encantado con cómo los cerebros de las personas pueden trabajar en este plan
Gracias por la evaluación. En realidad, es sólo rutina.
En cuanto a la Bolsa de Moscú, aquí hay que probarlo todo a fondo e identificar los fallos. Igual que en Forex.
Gracias por la valoración. Realmente es sólo una rutina.
En cuanto a la Bolsa de Moscú, aquí hay que probarlo todo a fondo e identificar los fallos. Igual que en forex.
Voy a terminar de leer hasta este punto, voy a ver lo que ya se ha hecho aquí, sólo tengo todas las estrategias de la pila, necesito sus volúmenes, acumulaciones, etc Si la biblioteca le permite trabajar plenamente con la pila, sus índices - precios - volúmenes, entonces voy a reconstruir mi robot en su biblioteca y probarlo ya.
Puede revelar algunos defectos.
Lo principal es no darse por vencido, el contenido es grande.