
Gráficos na biblioteca DoEasy (Parte 90): eventos de objetos gráficos padrão Funcionalidade básica

Sumário
- Ideia
- Aprimorando as classes da biblioteca
- Eventos de objetos gráficos padrão
- Teste
- O que vem agora?
Ideia
Ao trabalhar com objetos gráficos fornecidos pelo terminal do cliente, às vezes nos deparamos com a necessidade para determinar alguns valores das propriedades desses objetos programaticamente. O programa pode rastrear o valor de qualquer uma das linhas de um objeto gráfico e, por exemplo, quando o preço a cruzar, executar seu algoritmo. A linha pode ser deslocada quando o objeto gráfico é movido pelo usuário. Desse modo, o programa deve responder a isso. Mas este deve saber se o valor da linha rastreada mudou ou pesquisar constantemente os valores das propriedades do objeto gráfico. Esta é uma tarefa dispendiosa que é tratada na documentação.
É muito mais conveniente ter uma função que nos informe sobre qualquer mudança de qualquer objeto gráfico. E o manipulador de eventos OnChartEvent() já vem com esse funcional no terminal. Vamos acrescentar a seu arsenal vários eventos que especificarão em nossa biblioteca o que aconteceu com o objeto gráfico. Desse modo, o programa controlado pela biblioteca saberá exatamente o que aconteceu com ele e qual das suas propriedades foi alterada.
Vamos dividir a criação da funcionalidade descrita em duas etapas. Primeiro, vamos criar eventos gerais que podem acontecer com objetos gráficos e, em seguida, vamos adicionar a funcionalidade que especifica o que aconteceu com o objeto e que permite encontrá-lo rapidamente de forma programática. Em princípio, estamos prontos para gerar tal recurso e só precisamos refinar as classes da biblioteca e construir um lugar no manipulador de eventos, que se encarregará dos eventos que ocorram com objetos gráficos.
Os eventos básicos dos objetos gráficos são definidos da seguinte forma
- Criação de um novo objeto gráfico,
- Alteração das propriedades do objeto gráfico,
- Renomeação do objeto gráfico,
- Exclusão do objeto gráfico,
- Exclusão do objeto gráfico juntamente com a janela do gráfico.
Estes são os eventos que vamos fazer hoje. Eles serão enviados ao manipulador OnChartEvent(). No próximo artigo vamos criar um manipulador para cada um deles para que possamos saber exatamente quais propriedades do objeto gráfico foram alteradas.
Vale notar que a renomeação de um objeto gráfico é, por sua vez, uma mudança nas propriedades do objeto gráfico - alteração da propriedade "Nome". Mas decidi torná-lo um evento separado para simplificar o processamento, pois a mudança de nome desencadeia vários eventos consecutivos - exclusão de objeto gráfico, criação de novo e mudança de suas propriedades. Todos estes estados já são processados na biblioteca e esta calcula corretamente o evento de renomeação. É por isso que o usaremos no processamento posterior deste evento.
Embora a exclusão de um objeto gráfico no momento nos permita descobrir exatamente qual objeto foi excluído e informar seu nome, atualmente só podemos saber o número de objetos gráficos que estão na janela gráfica excluída. Estes dois eventos só nos falarão por enquanto sobre os objetos gráficos eliminados. No futuro, talvez consideremos a vantagem de lembrar as propriedades dos objetos apagados. Por enquanto, não vejo urgência em lembrar as propriedades dos objetos excluídos.
Aprimorando as classes da biblioteca
Para rastrear a seleção de um objeto gráfico, precisamos adicionar um manipulador de eventos de clique ao objeto gráfico. Um duplo clique sobre um objeto gráfico não selecionado o habilita para edição, e um duplo clique sobre um objeto destacado o desmarca. Para processar tal evento de objeto no gráfico atual, precisamos apenas adicionar um novo identificador de evento ao manipulador de eventos, mas para seu processamento em outros gráficos, precisamos modificar o indicador de controle de evento, que definimos automaticamente para cada janela do gráfico recém-aberto.
Abrimos o arquivo deste indicador \MQL5\Indicators\DoEasy\EventControl.mq5 e adicionamos um novo identificador de evento, que será enviado para o gráfico do programa de controle:
//+------------------------------------------------------------------+
//|                                                 EventControl.mq5 |
//|                                  Copyright 2021, MetaQuotes Ltd. |
//|                             https://mql5.com/en/users/artmedia70 |
//+------------------------------------------------------------------+
#property copyright "Copyright 2021, MetaQuotes Ltd."
#property link      "https://mql5.com/en/users/artmedia70"
#property version   "1.00"
#property indicator_chart_window
#property indicator_plots 0
//--- input parameters
input long     InpChartSRC = 0;
input long     InpChartDST = 0;
//+------------------------------------------------------------------+
//| Custom indicator initialization function                         |
//+------------------------------------------------------------------+
int OnInit()
  {
//--- indicator shortname
   IndicatorSetString(INDICATOR_SHORTNAME,"EventSend_From#"+(string)InpChartSRC+"_To#"+(string)InpChartDST);
//---
   return(INIT_SUCCEEDED);
  }
//+------------------------------------------------------------------+
//| Custom indicator iteration function                              |
//+------------------------------------------------------------------+
int OnCalculate(const int rates_total,
                const int prev_calculated,
                const datetime &time[],
                const double &open[],
                const double &high[],
                const double &low[],
                const double &close[],
                const long &tick_volume[],
                const long &volume[],
                const int &spread[])
  {
   return rates_total;
  }
//+------------------------------------------------------------------+
//| ChartEvent function                                              |
//+------------------------------------------------------------------+
void OnChartEvent(const int id,
                  const long &lparam,
                  const double &dparam,
                  const string &sparam)
  {
//---
   if(id==CHARTEVENT_OBJECT_CHANGE || id==CHARTEVENT_OBJECT_DRAG || id==CHARTEVENT_OBJECT_CLICK)
     {
      EventChartCustom(InpChartDST,(ushort)id,InpChartSRC,dparam,sparam);
     }
  }
//+------------------------------------------------------------------+
No arquivo \MQL5\Include\DoEasy\Data.mqh incluímos os índices das novas mensagens:
//--- CGraphElementsCollection
   MSG_GRAPH_OBJ_FAILED_GET_ADDED_OBJ_LIST,           // Failed to get the list of newly added objects
   MSG_GRAPH_OBJ_FAILED_DETACH_OBJ_FROM_LIST,         // Failed to remove a graphical object from the list

   MSG_GRAPH_OBJ_CREATE_EVN_CTRL_INDICATOR,           // Indicator for controlling and sending events created
   MSG_GRAPH_OBJ_FAILED_CREATE_EVN_CTRL_INDICATOR,    // Failed to create the indicator for controlling and sending events
   MSG_GRAPH_OBJ_ADDED_EVN_CTRL_INDICATOR,            // Indicator for controlling and sending events successfully added to the chart
   MSG_GRAPH_OBJ_FAILED_ADD_EVN_CTRL_INDICATOR,       // Failed to add the indicator for controlling and sending events
   MSG_GRAPH_OBJ_CLOSED_CHARTS,                       // Chart windows closed:
   MSG_GRAPH_OBJ_OBJECTS_ON_CLOSED_CHARTS,            // Objects removed together with charts:
   MSG_GRAPH_OBJ_FAILED_CREATE_EVN_OBJ,               // Failed to create the event object for a graphical object
   MSG_GRAPH_OBJ_FAILED_ADD_EVN_OBJ,                  // Failed to add the event object to the list

   MSG_GRAPH_OBJ_EVN_GRAPH_OBJ_CREATE,                // New graphical object created
   MSG_GRAPH_OBJ_EVN_GRAPH_OBJ_CHANGE,                // Changed the graphical object property
   MSG_GRAPH_OBJ_EVN_GRAPH_OBJ_RENAME,                // Graphical object renamed
   MSG_GRAPH_OBJ_EVN_GRAPH_OBJ_DELETE,                // Graphical object removed
   MSG_GRAPH_OBJ_EVN_GRAPH_OBJ_DEL_CHART,             // Graphical object removed together with the chart

  };
//+------------------------------------------------------------------+
e os textos das mensagens, correspondentes aos índices recém-adicionados:
//--- CGraphElementsCollection
   {"Не удалось получить список вновь добавленных объектов","Failed to get the list of newly added objects"},
   {"Не удалось изъять графический объект из списка","Failed to detach graphic object from the list"},

   {"Создан индикатор контроля и отправки событий","An indicator for monitoring and sending events has been created"},
   {"Не удалось создать индикатор контроля и отправки событий","Failed to create indicator for monitoring and sending events"},
   {"Индикатор контроля и отправки событий успешно добавлен на график ","The indicator for monitoring and sending events has been successfully added to the chart"},
   {"Не удалось добавить индикатор контроля и отправки событий на график ","Failed to add the indicator of monitoring and sending events to the chart "},
   {"Закрыто окон графиков: ","Closed chart windows: "},
   {"С ними удалено объектов: ","Objects removed with them: "},
   {"Не удалось создать объект-событие для графического объекта","Failed to create event object for graphic object"},
   {"Не удалось добавить объект-событие в список","Failed to add event object to list"},

   {"Создан новый графический объект","New graphic object created"},
   {"Изменено свойство графического объекта","Changed graphic object property"},
   {"Графический объект переименован","Graphic object renamed"},
   {"Графический объект удалён","Graphic object deleted"},
   {"Графический объект удалён вместе с графиком","The graphic object has been removed along with the chart"},

  };
//+---------------------------------------------------------------------+
Fazemos modificações no arquivo \MQL5\Include\DoEasy\Defines.mqh.
Removemos o evento de movimentação do objeto da lista de possíveis eventos de objetos gráficos, por ser uma mudança de suas propriedades, que já está nesta lista de eventos de objetos gráficos:
//+------------------------------------------------------------------+
//| List of possible graphical object events                         |
//+------------------------------------------------------------------+
enum ENUM_GRAPH_OBJ_EVENT
  {
   GRAPH_OBJ_EVENT_NO_EVENT = CHART_OBJ_EVENTS_NEXT_CODE,// No event
   GRAPH_OBJ_EVENT_CREATE,                            // "Creating a new graphical object" event
   GRAPH_OBJ_EVENT_CHANGE,                            // "Changing graphical object properties" event
   GRAPH_OBJ_EVENT_MOVE,                              // "Moving graphical object" event
   GRAPH_OBJ_EVENT_RENAME,                            // "Renaming graphical object" event
   GRAPH_OBJ_EVENT_DELETE,                            // "Removing graphical object" event
  };
E adicionamos à esta lista a nova constante para o evento de exclusão de objeto gráfico junto com o gráfico:
//+------------------------------------------------------------------+
//| Data for handling graphical elements                             |
//+------------------------------------------------------------------+
//+------------------------------------------------------------------+
//| List of possible graphical object events                         |
//+------------------------------------------------------------------+
enum ENUM_GRAPH_OBJ_EVENT
  {
   GRAPH_OBJ_EVENT_NO_EVENT = CHART_OBJ_EVENTS_NEXT_CODE,// No event
   GRAPH_OBJ_EVENT_CREATE,                            // "Creating a new graphical object" event
   GRAPH_OBJ_EVENT_CHANGE,                            // "Changing graphical object properties" event
   GRAPH_OBJ_EVENT_RENAME,                            // "Renaming graphical object" event
   GRAPH_OBJ_EVENT_DELETE,                            // "Removing graphical object" event
   GRAPH_OBJ_EVENT_DEL_CHART,                         // "Removing a graphical object together with the chart window" event
  };
#define GRAPH_OBJ_EVENTS_NEXT_CODE  (GRAPH_OBJ_EVENT_DEL_CHART+1) // The code of the next event after the last graphical object event code
//+------------------------------------------------------------------+
O código do seguinte evento - após os códigos de eventos dos objetos gráficos - será agora calculado a partir do último valor agregado à enumeração.
Ao criar qualquer objeto gráfico padrão, em seu construtor, lemos os dados do objeto físico no gráfico e os registramos nas propriedades do objeto da classe. Algumas das propriedades dos objetos gráficos são comuns a todos eles - cada objeto os tem, e estão escritos na classe base de todos os objetos gráficos da biblioteca.
O algoritmo é o seguinte: primeiro os parâmetros são lidos a partir do objeto gráfico usando as funções padrão ObjectGetXXX (Integer, Double e String), em seguida, se os dados forem recebidos com sucesso, estes parâmetros serão escritos primeiro na propriedade da classe de objetos do objeto gráfico base CGBaseObj e, depois, nas propriedades de seu herdeiro. Para objetos gráficos padrão, esta é a classe CGStdGraphObj.
E aqui temos um tipo de conflito. Temos métodos para definir parâmetros para um objeto gráfico. E esses métodos devem definir o valor da propriedade passada a eles tanto para o próprio objeto gráfico quanto para a propriedade correspondente do objeto de classe - se o parâmetro for definido com sucesso para o objeto gráfico usando as funções ObjectSetXXX (Integer, Double e String). Mas às vezes só precisamos definir o valor de um parâmetro de objeto gráfico na propriedade da classe. E para fazer isto, não precisamos ler este valor novamente, nem atribuí-lo a um objeto gráfico, mas simplesmente atribuir seu valor a uma variável da classe. Os métodos set do objeto gráfico básico da biblioteca definem primeiro um valor nos parâmetros do objeto gráfico e, depois, os escrevem nas variáveis da classe. Para evitar definir uma propriedade já conhecida de objeto gráfico de volta nele mesmo, vamos apenas registrá-lo em uma variável de classe, adicionaremos a variável bool only_prop a tais métodos, ela indicará a necessidade de ajustar o valor apenas nos valores das variáveis ou nos parâmetros das propriedades do objeto gráfico e do objeto de classe. Se esta variável de entrada tiver o valor true, os parâmetros só serão escritos nas variáveis de classe, caso contrário, o valor será definido primeiro para o objeto gráfico e, em seguida, para as variáveis de classe.
Na classe do objeto base de todos os objetos da biblioteca \MQL5\Include\DoEasy\Objects\Graph\GBaseObj.mqh adicionamos esta variável a esses métodos e alteramos a lógica dos mesmos:
//--- Set the "Background object" flag
   bool              SetFlagBack(const bool flag,const bool only_prop)
                       {
                        ::ResetLastError();
                        if((!only_prop && ::ObjectSetInteger(this.m_chart_id,this.m_name,OBJPROP_BACK,flag)) || only_prop)
                          {
                           this.m_back=flag;
                           return true;
                          }
                        else
                           CMessage::ToLog(DFUN,::GetLastError(),true);
                        return false;
                       }
Aqui: se a variável tiver o valor false e uma propriedade tiver sido atribuída ao objeto gráfico, ou se a variável tiver o valor true,
então registramos o valor passado ao método na variável da classe.
Todos os métodos deste classe são modificados assim:
//--- Set the "Background object" flag
   bool              SetFlagBack(const bool flag,const bool only_prop)
                       {
                        ::ResetLastError();
                        if((!only_prop && ::ObjectSetInteger(this.m_chart_id,this.m_name,OBJPROP_BACK,flag)) || only_prop)
                          {
                           this.m_back=flag;
                           return true;
                          }
                        else
                           CMessage::ToLog(DFUN,::GetLastError(),true);
                        return false;
                       }
//--- Set the "Object selection" flag
   bool              SetFlagSelected(const bool flag,const bool only_prop)
                       {
                        ::ResetLastError();
                        if((!only_prop && ::ObjectSetInteger(this.m_chart_id,this.m_name,OBJPROP_SELECTED,flag)) || only_prop)
                          {
                           this.m_selected=flag;
                           return true;
                          }
                        else
                           CMessage::ToLog(DFUN,::GetLastError(),true);
                        return false;
                       }
//--- Set the "Object selection" flag
   bool              SetFlagSelectable(const bool flag,const bool only_prop)
                       {
                        ::ResetLastError();
                        if((!only_prop && ::ObjectSetInteger(this.m_chart_id,this.m_name,OBJPROP_SELECTABLE,flag)) || only_prop)
                          {
                           this.m_selectable=flag;
                           return true;
                          }
                        else
                           CMessage::ToLog(DFUN,::GetLastError(),true);
                        return false;
                       }
//--- Set the "Disable displaying the name of a graphical object in the terminal object list" flag
   bool              SetFlagHidden(const bool flag,const bool only_prop)
                       {
                        ::ResetLastError();
                        if((!only_prop && ::ObjectSetInteger(this.m_chart_id,this.m_name,OBJPROP_SELECTABLE,flag)) || only_prop)
                          {
                           this.m_hidden=flag;
                           return true;
                          }
                        else
                           CMessage::ToLog(DFUN,::GetLastError(),true);
                        return false;
                       }
//--- Set the priority of a graphical object for receiving the event of clicking on a chart
   bool              SetZorder(const long value,const bool only_prop)
                       {
                        ::ResetLastError();
                        if((!only_prop && ::ObjectSetInteger(this.m_chart_id,this.m_name,OBJPROP_ZORDER,value)) || only_prop)
                          {
                           this.m_zorder=value;
                           return true;
                          }
                        else
                           CMessage::ToLog(DFUN,::GetLastError(),true);
                        return false;
                       }
//--- Set object visibility on all timeframes
   bool              SetVisible(const bool flag,const bool only_prop)
                       {
                        long value=(flag ? OBJ_ALL_PERIODS : OBJ_NO_PERIODS);
                        ::ResetLastError();
                        if((!only_prop && ::ObjectSetInteger(this.m_chart_id,this.m_name,OBJPROP_TIMEFRAMES,value)) || only_prop)
                          {
                           this.m_visible=flag;
                           return true;
                          }
                        else
                           CMessage::ToLog(DFUN,::GetLastError(),true);
                        return false;
                       }
//--- Set visibility flags on timeframes specified as flags
   bool              SetVisibleOnTimeframes(const int flags,const bool only_prop)
                       {
                        ::ResetLastError();
                        if((!only_prop && ::ObjectSetInteger(this.m_chart_id,this.m_name,OBJPROP_TIMEFRAMES,flags)) || only_prop)
                          {
                           this.m_timeframes_visible=flags;
                           return true;
                          }
                        else
                           CMessage::ToLog(DFUN,::GetLastError(),true);
                        return false;
                       }
//--- Add the visibility flag on a specified timeframe
   bool              SetVisibleOnTimeframe(const ENUM_TIMEFRAMES timeframe,const bool only_prop)
                       {
                        int flags=this.m_timeframes_visible;
                        switch(timeframe)
                          {
                           case PERIOD_M1    : flags |= OBJ_PERIOD_M1;  break;
                           case PERIOD_M2    : flags |= OBJ_PERIOD_M2;  break;
                           case PERIOD_M3    : flags |= OBJ_PERIOD_M3;  break;
                           case PERIOD_M4    : flags |= OBJ_PERIOD_M4;  break;
                           case PERIOD_M5    : flags |= OBJ_PERIOD_M5;  break;
                           case PERIOD_M6    : flags |= OBJ_PERIOD_M6;  break;
                           case PERIOD_M10   : flags |= OBJ_PERIOD_M10; break;
                           case PERIOD_M12   : flags |= OBJ_PERIOD_M12; break;
                           case PERIOD_M15   : flags |= OBJ_PERIOD_M15; break;
                           case PERIOD_M20   : flags |= OBJ_PERIOD_M20; break;
                           case PERIOD_M30   : flags |= OBJ_PERIOD_M30; break;
                           case PERIOD_H1    : flags |= OBJ_PERIOD_H1;  break;
                           case PERIOD_H2    : flags |= OBJ_PERIOD_H2;  break;
                           case PERIOD_H3    : flags |= OBJ_PERIOD_H3;  break;
                           case PERIOD_H4    : flags |= OBJ_PERIOD_H4;  break;
                           case PERIOD_H6    : flags |= OBJ_PERIOD_H6;  break;
                           case PERIOD_H8    : flags |= OBJ_PERIOD_H8;  break;
                           case PERIOD_H12   : flags |= OBJ_PERIOD_H12; break;
                           case PERIOD_D1    : flags |= OBJ_PERIOD_D1;  break;
                           case PERIOD_W1    : flags |= OBJ_PERIOD_W1;  break;
                           case PERIOD_MN1   : flags |= OBJ_PERIOD_MN1; break;
                           default           : return true;
                          }
                        ::ResetLastError();
                        if((!only_prop && ::ObjectSetInteger(this.m_chart_id,this.m_name,OBJPROP_TIMEFRAMES,flags)) || only_prop)
                          {
                           this.m_timeframes_visible=flags;
                           return true;
                          }
                        else
                           CMessage::ToLog(DFUN,::GetLastError(),true);
                        return false;
                       }
Agora podemos optar por escrever a propriedade: definir uma nova para o objeto gráfico e a variável de classe (para que corresponda ao novo valor definido) ou definir um valor conhecido de um parâmetro de objeto gráfico para a variável de classe (como feito no construtor de classes ao criar um novo objeto gráfico). Isto nos permitirá evitar o uso desnecessário das funções de objetos gráficos que são bastante lentas devido a sua sincronicidade.
No arquivo \MQL5\Include\DoEasy\Objects\Graph\GCnvElement.mqh ajustamos a chamada dos métodos modificados:
//--- Return (1) the element ID, (2) element index in the list, (3) flag of the form shadow presence and (4) the chart background color
   int               ID(void)                            const { return (int)this.GetProperty(CANV_ELEMENT_PROP_ID);                   }
   int               Number(void)                        const { return (int)this.GetProperty(CANV_ELEMENT_PROP_NUM);                  }
   bool              IsShadow(void)                      const { return this.m_shadow;                                                 }
   color             ChartColorBackground(void)          const { return this.m_chart_color_bg;                                         }
//--- Set the object above all
   void              BringToTop(void)                          { CGBaseObj::SetVisible(false,false); CGBaseObj::SetVisible(true,false);}
//--- (1) Show and (2) hide the element
   virtual void      Show(void)                                { CGBaseObj::SetVisible(true,false);                                    }
   virtual void      Hide(void)                                { CGBaseObj::SetVisible(false,false);                                   }

//+------------------------------------------------------------------+
//| The methods of receiving raster data                             |
//+------------------------------------------------------------------+
No arquivo \MQL5\Include\DoEasy\Objects\Graph\Form.mqh também ajustamos dois métodos:
//+------------------------------------------------------------------+
//| Create the shadow object                                         |
//+------------------------------------------------------------------+
void CForm::CreateShadowObj(const color colour,const uchar opacity)
  {
//--- If the shadow flag is disabled or the shadow object already exists, exit
   if(!this.m_shadow || this.m_shadow_obj!=NULL)
      return;

//--- Calculate the shadow object coordinates according to the offset from the top and left
   int x=this.CoordX()-OUTER_AREA_SIZE;
   int y=this.CoordY()-OUTER_AREA_SIZE;
//--- Calculate the width and height in accordance with the top, bottom, left and right offsets
   int w=this.Width()+OUTER_AREA_SIZE*2;
   int h=this.Height()+OUTER_AREA_SIZE*2;
//--- Create a new shadow object and set the pointer to it in the variable
   this.m_shadow_obj=new CShadowObj(this.ChartID(),this.SubWindow(),this.CreateNameDependentObject("Shadow"),x,y,w,h);
   if(this.m_shadow_obj==NULL)
     {
      ::Print(DFUN,CMessage::Text(MSG_FORM_OBJECT_ERR_FAILED_CREATE_SHADOW_OBJ));
      return;
     }
//--- Set the properties for the created shadow object
   this.m_shadow_obj.SetID(this.ID());
   this.m_shadow_obj.SetNumber(-1);
   this.m_shadow_obj.SetOpacityShadow(opacity);
   this.m_shadow_obj.SetColorShadow(colour);
   this.m_shadow_obj.SetMovable(true);
   this.m_shadow_obj.SetActive(false);
   this.m_shadow_obj.SetVisible(false,false);
//--- Move the form object to the foreground
   this.BringToTop();
  }
//+------------------------------------------------------------------+
//| Draw the shadow                                                  |
//+------------------------------------------------------------------+
void CForm::DrawShadow(const int shift_x,const int shift_y,const color colour,const uchar opacity=127,const uchar blur=4)
  {
//--- If the shadow flag is disabled, exit
   if(!this.m_shadow)
      return;
//--- If there is no shadow object, create it
   if(this.m_shadow_obj==NULL)
      this.CreateShadowObj(colour,opacity);
//--- If the shadow object exists, draw the shadow on it,
//--- set the shadow object visibility flag and
//--- move the form object to the foreground
   if(this.m_shadow_obj!=NULL)
     {
      this.m_shadow_obj.DrawShadow(shift_x,shift_y,blur);
      this.m_shadow_obj.SetVisible(true,false);
      this.BringToTop();
     }
  }
//+------------------------------------------------------------------+
Na classe do objeto gráfico padrão, vamos fazer todos os métodos para definir propriedades de objetos gráficos com valor de retorno booleano (agora os métodos não retornam nenhum valor e, portanto, são do tipo void). Isto é para que seus métodos de classe pai correspondentes, que também têm um tipo de retorno bool, sejam eatribuídos na classe filha, e para que escrever o código não haja dois métodos na dica — com tipo bool do objeto base, e com tipo void do seu herdeiro, o que poderia causar confusão.
Vejamos como exemplo o método para definir o número da subjanela:
//--- Chart subwindow index
   int               SubWindow(void)               const { return (int)this.GetProperty(GRAPH_OBJ_PROP_WND_NUM,0);                        }
   bool              SetSubWindow(void)
                       {
                        if(!CGBaseObj::SetSubwindow(CGBaseObj::ChartID(),CGBaseObj::Name()))
                           return false;
                        this.SetProperty(GRAPH_OBJ_PROP_WND_NUM,0,CGBaseObj::SubWindow());
                        return true;
                       }
Como devemos buscar o número da subjanela pelo ID do gráfico e pelo nome do objeto, simplesmente o ID (do gráfico já armazenado no objeto base ) e o nome do objeto gráfico são passados para o método de classe base para definir o número da subjanela . Se o valor no objeto base não pudesse ser definido, retornamos false, caso contrário, definimos o valor do objeto recém registrado no objeto base na propriedade, e retornamos true.
E com o exemplo do método para definir a visualização de objetos em todos os timeframes:
//--- Object visibility on timeframes
   bool              Visible(void)                 const { return (bool)this.GetProperty(GRAPH_OBJ_PROP_TIMEFRAMES,0);                    }
   bool              SetFlagVisible(const bool flag,const bool only_prop)
                       {
                        if(!CGBaseObj::SetVisible(flag,only_prop))
                           return false;
                        this.SetProperty(GRAPH_OBJ_PROP_TIMEFRAMES,0,flag);
                        return true;
                       }
Aqui ao método é transferido o novo parâmetro previamente adicionado por nós para indicar quais os valores que iremos escrever - somente na propriedade do objeto, ou nos parâmetros do objeto gráfico e propriedades de classe. Em seguida, definimos estas propriedades no objeto base e, se não for possível, retornamos false.
Caso contrário, escrevemos o valor na propriedade do objeto de classe e retornamos true.
Todos os outros métodos são alterados de forma idêntica aos discutidos acima:
//--- Background object bool Back(void) const { return (bool)this.GetProperty(GRAPH_OBJ_PROP_BACK,0); } bool SetFlagBack(const bool flag,const bool only_prop) { if(!CGBaseObj::SetFlagBack(flag,only_prop)) return false; this.SetProperty(GRAPH_OBJ_PROP_BACK,0,flag); return true; } //--- Priority of a graphical object for receiving the event of clicking on a chart long Zorder(void) const { return this.GetProperty(GRAPH_OBJ_PROP_ZORDER,0); } bool SetZorder(const long value,const bool only_prop) { if(!CGBaseObj::SetZorder(value,only_prop)) return false; this.SetProperty(GRAPH_OBJ_PROP_ZORDER,0,value); return true; } //--- Disable displaying the name of a graphical object in the terminal object list bool Hidden(void) const { return (bool)this.GetProperty(GRAPH_OBJ_PROP_HIDDEN,0); } bool SetFlagHidden(const bool flag,const bool only_prop) { if(!CGBaseObj::SetFlagHidden(flag,only_prop)) return false; this.SetProperty(GRAPH_OBJ_PROP_HIDDEN,0,flag); return true; } //--- Object selection bool Selected(void) const { return (bool)this.GetProperty(GRAPH_OBJ_PROP_SELECTED,0); } bool SetFlagSelected(const bool flag,const bool only_prop) { if(!CGBaseObj::SetFlagSelected(flag,only_prop)) return false; this.SetProperty(GRAPH_OBJ_PROP_SELECTED,0,flag); return true; } //--- Object availability bool Selectable(void) const { return (bool)this.GetProperty(GRAPH_OBJ_PROP_SELECTABLE,0); } bool SetFlagSelectable(const bool flag,const bool only_prop) { if(!CGBaseObj::SetFlagSelectable(flag,only_prop)) return false; this.SetProperty(GRAPH_OBJ_PROP_SELECTABLE,0,flag); return true; } //--- Time coordinate datetime Time(const int modifier) const { return (datetime)this.GetProperty(GRAPH_OBJ_PROP_TIME,modifier); } bool SetTime(const datetime time,const int modifier) { if(!::ObjectSetInteger(CGBaseObj::ChartID(),CGBaseObj::Name(),OBJPROP_TIME,modifier,time)) return false; this.SetProperty(GRAPH_OBJ_PROP_TIME,modifier,time); return true; } //--- Color color Color(void) const { return (color)this.GetProperty(GRAPH_OBJ_PROP_COLOR,0); } bool SetColor(const color colour) { if(!::ObjectSetInteger(CGBaseObj::ChartID(),CGBaseObj::Name(),OBJPROP_COLOR,colour)) return false; this.SetProperty(GRAPH_OBJ_PROP_COLOR,0,colour); return true; } //--- Style ENUM_LINE_STYLE Style(void) const { return (ENUM_LINE_STYLE)this.GetProperty(GRAPH_OBJ_PROP_STYLE,0); } bool SetStyle(const ENUM_LINE_STYLE style) { if(!::ObjectSetInteger(CGBaseObj::ChartID(),CGBaseObj::Name(),OBJPROP_STYLE,style)) return false; this.SetProperty(GRAPH_OBJ_PROP_STYLE,0,style); return true; } //--- Line width int Width(void) const { return (int)this.GetProperty(GRAPH_OBJ_PROP_WIDTH,0); } bool SetWidth(const int width) { if(!::ObjectSetInteger(CGBaseObj::ChartID(),CGBaseObj::Name(),OBJPROP_WIDTH,width)) return false; this.SetProperty(GRAPH_OBJ_PROP_WIDTH,0,width); return true; } //--- Object color filling bool Fill(void) const { return (bool)this.GetProperty(GRAPH_OBJ_PROP_FILL,0); } bool SetFlagFill(const bool flag) { if(!::ObjectSetInteger(CGBaseObj::ChartID(),CGBaseObj::Name(),OBJPROP_FILL,flag)) return false; this.SetProperty(GRAPH_OBJ_PROP_FILL,0,flag); return true; } //--- Ability to edit text in the Edit object bool ReadOnly(void) const { return (bool)this.GetProperty(GRAPH_OBJ_PROP_READONLY,0); } bool SetFlagReadOnly(const bool flag) { if(!::ObjectSetInteger(CGBaseObj::ChartID(),CGBaseObj::Name(),OBJPROP_READONLY,flag)) return false; this.SetProperty(GRAPH_OBJ_PROP_READONLY,0,flag); return true; } //--- Number of levels int Levels(void) const { return (int)this.GetProperty(GRAPH_OBJ_PROP_LEVELS,0); } bool SetLevels(const int levels) { if(!::ObjectSetInteger(CGBaseObj::ChartID(),CGBaseObj::Name(),OBJPROP_LEVELS,levels)) return false; this.SetProperty(GRAPH_OBJ_PROP_LEVELS,0,levels); return true; } //--- Line level color color LevelColor(const int modifier) const { return (color)this.GetProperty(GRAPH_OBJ_PROP_LEVELCOLOR,modifier); } bool SetLevelColor(const color colour,const int modifier) { if(!::ObjectSetInteger(CGBaseObj::ChartID(),CGBaseObj::Name(),OBJPROP_LEVELCOLOR,modifier,colour)) return false; this.SetProperty(GRAPH_OBJ_PROP_LEVELCOLOR,modifier,colour); return true; } //--- Level line style ENUM_LINE_STYLE LevelStyle(const int modifier)const { return (ENUM_LINE_STYLE)this.GetProperty(GRAPH_OBJ_PROP_LEVELSTYLE,modifier); } bool SetLevelStyle(const ENUM_LINE_STYLE style,const int modifier) { if(!::ObjectSetInteger(CGBaseObj::ChartID(),CGBaseObj::Name(),OBJPROP_LEVELSTYLE,modifier,style)) return false; this.SetProperty(GRAPH_OBJ_PROP_LEVELSTYLE,modifier,style); return true; } ///--- Level line width int LevelWidth(const int modifier)const { return (int)this.GetProperty(GRAPH_OBJ_PROP_LEVELWIDTH,modifier); } bool SetLevelWidth(const int width,const int modifier) { if(!::ObjectSetInteger(CGBaseObj::ChartID(),CGBaseObj::Name(),OBJPROP_LEVELWIDTH,modifier,width)) return false; this.SetProperty(GRAPH_OBJ_PROP_LEVELWIDTH,modifier,width); return true; } //--- Horizontal text alignment in the Edit object (OBJ_EDIT) ENUM_ALIGN_MODE Align(void) const { return (ENUM_ALIGN_MODE)this.GetProperty(GRAPH_OBJ_PROP_ALIGN,0); } bool SetAlign(const ENUM_ALIGN_MODE align) { if(!::ObjectSetInteger(CGBaseObj::ChartID(),CGBaseObj::Name(),OBJPROP_ALIGN,align)) return false; this.SetProperty(GRAPH_OBJ_PROP_ALIGN,0,align); return true; } //--- Font size int FontSize(void) const { return (int)this.GetProperty(GRAPH_OBJ_PROP_FONTSIZE,0); } bool SetFontSize(const int size) { if(!::ObjectSetInteger(CGBaseObj::ChartID(),CGBaseObj::Name(),OBJPROP_FONTSIZE,size)) return false; this.SetProperty(GRAPH_OBJ_PROP_FONTSIZE,0,size); return true; } //--- Ray goes to the left bool RayLeft(void) const { return (bool)this.GetProperty(GRAPH_OBJ_PROP_RAY_LEFT,0); } bool SetFlagRayLeft(const bool flag) { if(!::ObjectSetInteger(CGBaseObj::ChartID(),CGBaseObj::Name(),OBJPROP_RAY_LEFT,flag)) return false; this.SetProperty(GRAPH_OBJ_PROP_RAY_LEFT,0,flag); return true; } //--- Ray goes to the right bool RayRight(void) const { return (bool)this.GetProperty(GRAPH_OBJ_PROP_RAY_RIGHT,0); } bool SetFlagRayRight(const bool flag) { if(!::ObjectSetInteger(CGBaseObj::ChartID(),CGBaseObj::Name(),OBJPROP_RAY_RIGHT,flag)) return false; this.SetProperty(GRAPH_OBJ_PROP_RAY_RIGHT,0,flag); return true; } //--- Vertical line goes through all windows of a chart bool Ray(void) const { return (bool)this.GetProperty(GRAPH_OBJ_PROP_RAY,0); } bool SetFlagRay(const bool flag) { if(!::ObjectSetInteger(CGBaseObj::ChartID(),CGBaseObj::Name(),OBJPROP_RAY,flag)) return false; this.SetProperty(GRAPH_OBJ_PROP_RAY,0,flag); return true; } //--- Display the full ellipse of the Fibonacci Arc object bool Ellipse(void) const { return (bool)this.GetProperty(GRAPH_OBJ_PROP_ELLIPSE,0); } bool SetFlagEllipse(const bool flag) { if(!::ObjectSetInteger(CGBaseObj::ChartID(),CGBaseObj::Name(),OBJPROP_ELLIPSE,flag)) return false; this.SetProperty(GRAPH_OBJ_PROP_ELLIPSE,0,flag); return true; } //--- Arrow code for the "Arrow" object uchar ArrowCode(void) const { return (uchar)this.GetProperty(GRAPH_OBJ_PROP_ARROWCODE,0); } bool SetArrowCode(const uchar code) { if(!::ObjectSetInteger(CGBaseObj::ChartID(),CGBaseObj::Name(),OBJPROP_ARROWCODE,code)) return false; this.SetProperty(GRAPH_OBJ_PROP_ARROWCODE,0,code); return true; } //--- Position of the graphical object anchor point int Anchor(void) const { return (int)this.GetProperty(GRAPH_OBJ_PROP_ANCHOR,0); } bool SetAnchor(const int anchor) { if(!::ObjectSetInteger(CGBaseObj::ChartID(),CGBaseObj::Name(),OBJPROP_ANCHOR,anchor)) return false; this.SetProperty(GRAPH_OBJ_PROP_ANCHOR,0,anchor); return true; } //--- Distance from the base corner along the X axis in pixels int XDistance(void) const { return (int)this.GetProperty(GRAPH_OBJ_PROP_XDISTANCE,0); } bool SetXDistance(const int distance) { if(!::ObjectSetInteger(CGBaseObj::ChartID(),CGBaseObj::Name(),OBJPROP_XDISTANCE,distance)) return false; this.SetProperty(GRAPH_OBJ_PROP_XDISTANCE,0,distance); return true; } //--- Distance from the base corner along the Y axis in pixels int YDistance(void) const { return (int)this.GetProperty(GRAPH_OBJ_PROP_YDISTANCE,0); } bool SetYDistance(const int distance) { if(!::ObjectSetInteger(CGBaseObj::ChartID(),CGBaseObj::Name(),OBJPROP_YDISTANCE,distance)) return false; this.SetProperty(GRAPH_OBJ_PROP_YDISTANCE,0,distance); return true; } //--- Gann object trend ENUM_GANN_DIRECTION Direction(void) const { return (ENUM_GANN_DIRECTION)this.GetProperty(GRAPH_OBJ_PROP_DIRECTION,0); } bool SetDirection(const ENUM_GANN_DIRECTION direction) { if(!::ObjectSetInteger(CGBaseObj::ChartID(),CGBaseObj::Name(),OBJPROP_DIRECTION,direction)) return false; this.SetProperty(GRAPH_OBJ_PROP_DIRECTION,0,direction); return true; } //--- Elliott wave marking level ENUM_ELLIOT_WAVE_DEGREE Degree(void) const { return (ENUM_ELLIOT_WAVE_DEGREE)this.GetProperty(GRAPH_OBJ_PROP_DEGREE,0); } bool SetDegree(const ENUM_ELLIOT_WAVE_DEGREE degree) { if(!::ObjectSetInteger(CGBaseObj::ChartID(),CGBaseObj::Name(),OBJPROP_DEGREE,degree)) return false; this.SetProperty(GRAPH_OBJ_PROP_DEGREE,0,degree); return true; } //--- Display lines for Elliott wave marking bool DrawLines(void) const { return (bool)this.GetProperty(GRAPH_OBJ_PROP_DRAWLINES,0); } bool SetFlagDrawLines(const bool flag) { if(!::ObjectSetInteger(CGBaseObj::ChartID(),CGBaseObj::Name(),OBJPROP_DRAWLINES,flag)) return false; this.SetProperty(GRAPH_OBJ_PROP_DRAWLINES,0,flag); return true; } //--- Button state (pressed/released) bool State(void) const { return (bool)this.GetProperty(GRAPH_OBJ_PROP_STATE,0); } bool SetFlagState(const bool flag) { if(!::ObjectSetInteger(CGBaseObj::ChartID(),CGBaseObj::Name(),OBJPROP_STATE,flag)) return false; this.SetProperty(GRAPH_OBJ_PROP_STATE,0,flag); return true; } //--- Chart object ID (OBJ_CHART) long ChartObjChartID(void) const { return this.GetProperty(GRAPH_OBJ_PROP_CHART_OBJ_CHART_ID,0); } bool SetChartObjChartID(const long chart_id) { this.SetProperty(GRAPH_OBJ_PROP_CHART_OBJ_CHART_ID,0,chart_id); return true; } //--- Chart object period ENUM_TIMEFRAMES ChartObjPeriod(void) const { return (ENUM_TIMEFRAMES)this.GetProperty(GRAPH_OBJ_PROP_CHART_OBJ_PERIOD,0); } bool SetChartObjPeriod(const ENUM_TIMEFRAMES timeframe) { if(!::ObjectSetInteger(CGBaseObj::ChartID(),CGBaseObj::Name(),OBJPROP_PERIOD,timeframe)) return false; this.SetProperty(GRAPH_OBJ_PROP_CHART_OBJ_PERIOD,0,timeframe); return true; } //--- Time scale display flag for the Chart object bool ChartObjDateScale(void) const { return (bool)this.GetProperty(GRAPH_OBJ_PROP_CHART_OBJ_DATE_SCALE,0); } bool SetFlagChartObjDateScale(const bool flag) { if(!::ObjectSetInteger(CGBaseObj::ChartID(),CGBaseObj::Name(),OBJPROP_DATE_SCALE,flag)) return false; this.SetProperty(GRAPH_OBJ_PROP_CHART_OBJ_DATE_SCALE,0,flag); return true; } //--- Price scale display flag for the Chart object bool ChartObjPriceScale(void) const { return (bool)this.GetProperty(GRAPH_OBJ_PROP_CHART_OBJ_PRICE_SCALE,0); } bool SetFlagPriceScale(const bool flag) { if(!::ObjectSetInteger(CGBaseObj::ChartID(),CGBaseObj::Name(),OBJPROP_PRICE_SCALE,flag)) return false; this.SetProperty(GRAPH_OBJ_PROP_CHART_OBJ_PRICE_SCALE,0,flag); return true; } //--- Chart object scale int ChartObjChartScale(void) const { return (int)this.GetProperty(GRAPH_OBJ_PROP_CHART_OBJ_CHART_SCALE,0); } bool SetChartObjChartScale(const int scale) { if(!::ObjectSetInteger(CGBaseObj::ChartID(),CGBaseObj::Name(),OBJPROP_CHART_SCALE,scale)) return false; this.SetProperty(GRAPH_OBJ_PROP_CHART_OBJ_CHART_SCALE,0,scale); return true; } //--- Object width along the X axis in pixels int XSize(void) const { return (int)this.GetProperty(GRAPH_OBJ_PROP_XSIZE,0); } bool SetXSize(const int size) { if(!::ObjectSetInteger(CGBaseObj::ChartID(),CGBaseObj::Name(),OBJPROP_XSIZE,size)) return false; this.SetProperty(GRAPH_OBJ_PROP_XSIZE,0,size); return true; } //--- Object height along the Y axis in pixels int YSize(void) const { return (int)this.GetProperty(GRAPH_OBJ_PROP_YSIZE,0); } bool SetYSize(const int size) { if(!::ObjectSetInteger(CGBaseObj::ChartID(),CGBaseObj::Name(),OBJPROP_YSIZE,size)) return false; this.SetProperty(GRAPH_OBJ_PROP_YSIZE,0,size); return true; } //--- X coordinate of the upper-left corner of the visibility area int XOffset(void) const { return (int)this.GetProperty(GRAPH_OBJ_PROP_XOFFSET,0); } bool SetXOffset(const int offset) { if(!::ObjectSetInteger(CGBaseObj::ChartID(),CGBaseObj::Name(),OBJPROP_XOFFSET,offset)) return false; this.SetProperty(GRAPH_OBJ_PROP_XOFFSET,0,offset); return true; } //--- Y coordinate of the upper-left corner of the visibility area int YOffset(void) const { return (int)this.GetProperty(GRAPH_OBJ_PROP_YOFFSET,0); } bool SetYOffset(const int offset) { if(!::ObjectSetInteger(CGBaseObj::ChartID(),CGBaseObj::Name(),OBJPROP_YOFFSET,offset)) return false; this.SetProperty(GRAPH_OBJ_PROP_YOFFSET,0,offset); return true; } //--- Background color for OBJ_EDIT, OBJ_BUTTON, OBJ_RECTANGLE_LABEL color BGColor(void) const { return (color)this.GetProperty(GRAPH_OBJ_PROP_BGCOLOR,0); } bool SetBGColor(const color colour) { if(!::ObjectSetInteger(CGBaseObj::ChartID(),CGBaseObj::Name(),OBJPROP_BGCOLOR,colour)) return false; this.SetProperty(GRAPH_OBJ_PROP_BGCOLOR,0,colour); return true; } //--- Chart corner for attaching a graphical object ENUM_BASE_CORNER Corner(void) const { return (ENUM_BASE_CORNER)this.GetProperty(GRAPH_OBJ_PROP_CORNER,0); } bool SetCorner(const ENUM_BASE_CORNER corner) { if(!::ObjectSetInteger(CGBaseObj::ChartID(),CGBaseObj::Name(),OBJPROP_CORNER,corner)) return false; this.SetProperty(GRAPH_OBJ_PROP_CORNER,0,corner); return true; } //--- Border type for the Rectangle label object ENUM_BORDER_TYPE BorderType(void) const { return (ENUM_BORDER_TYPE)this.GetProperty(GRAPH_OBJ_PROP_BORDER_TYPE,0); } bool SetBorderType(const ENUM_BORDER_TYPE type) { if(!::ObjectSetInteger(CGBaseObj::ChartID(),CGBaseObj::Name(),OBJPROP_BORDER_TYPE,type)) return false; this.SetProperty(GRAPH_OBJ_PROP_BORDER_TYPE,0,type); return true; } //--- Border color for OBJ_EDIT and OBJ_BUTTON color BorderColor(void) const { return (color)this.GetProperty(GRAPH_OBJ_PROP_BORDER_COLOR,0); } bool SetBorderColor(const color colour) { if(!::ObjectSetInteger(CGBaseObj::ChartID(),CGBaseObj::Name(),OBJPROP_BORDER_COLOR,colour)) return false; this.SetProperty(GRAPH_OBJ_PROP_BORDER_COLOR,0,colour); return true; } //--- Price coordinate double Price(const int modifier) const { return this.GetProperty(GRAPH_OBJ_PROP_PRICE,modifier); } bool SetPrice(const double price,const int modifier) { if(!::ObjectSetDouble(CGBaseObj::ChartID(),CGBaseObj::Name(),OBJPROP_PRICE,modifier,price)) return false; this.SetProperty(GRAPH_OBJ_PROP_PRICE,modifier,price); return true; } //--- Level value double LevelValue(const int modifier)const { return this.GetProperty(GRAPH_OBJ_PROP_LEVELVALUE,modifier); } bool SetLevelValue(const double value,const int modifier) { if(!::ObjectSetDouble(CGBaseObj::ChartID(),CGBaseObj::Name(),OBJPROP_LEVELVALUE,modifier,value)) return false; this.SetProperty(GRAPH_OBJ_PROP_LEVELVALUE,modifier,value); return true; } //--- Scale double Scale(void) const { return this.GetProperty(GRAPH_OBJ_PROP_SCALE,0); } bool SetScale(const double scale) { if(!::ObjectSetDouble(CGBaseObj::ChartID(),CGBaseObj::Name(),OBJPROP_SCALE,scale)) return false; this.SetProperty(GRAPH_OBJ_PROP_SCALE,0,scale); return true; } //--- Angle double Angle(void) const { return this.GetProperty(GRAPH_OBJ_PROP_ANGLE,0); } bool SetAngle(const double angle) { if(!::ObjectSetDouble(CGBaseObj::ChartID(),CGBaseObj::Name(),OBJPROP_ANGLE,angle)) return false; this.SetProperty(GRAPH_OBJ_PROP_ANGLE,0,angle); return true; } //--- Deviation of the standard deviation channel double Deviation(void) const { return this.GetProperty(GRAPH_OBJ_PROP_DEVIATION,0); } bool SetDeviation(const double deviation) { if(!::ObjectSetDouble(CGBaseObj::ChartID(),CGBaseObj::Name(),OBJPROP_DEVIATION,deviation)) return false; this.SetProperty(GRAPH_OBJ_PROP_DEVIATION,0,deviation); return true; } //--- Object name string Name(void) const { return this.GetProperty(GRAPH_OBJ_PROP_NAME,0); } bool SetName(const string name) { if(CGBaseObj::Name()==name) return true; if(CGBaseObj::Name()=="") { CGBaseObj::SetName(name); this.SetProperty(GRAPH_OBJ_PROP_NAME,0,name); return true; } else { if(!::ObjectSetString(CGBaseObj::ChartID(),CGBaseObj::Name(),OBJPROP_NAME,name)) return false; CGBaseObj::SetName(name); this.SetProperty(GRAPH_OBJ_PROP_NAME,0,name); return true; } } //--- Object description (text contained in the object) string Text(void) const { return this.GetProperty(GRAPH_OBJ_PROP_TEXT,0); } bool SetText(const string text) { if(!::ObjectSetString(CGBaseObj::ChartID(),CGBaseObj::Name(),OBJPROP_TEXT,text)) return false; this.SetProperty(GRAPH_OBJ_PROP_TEXT,0,text); return true; } //--- Tooltip text string Tooltip(void) const { return this.GetProperty(GRAPH_OBJ_PROP_TOOLTIP,0); } bool SetTooltip(const string tooltip) { if(!::ObjectSetString(CGBaseObj::ChartID(),CGBaseObj::Name(),OBJPROP_TOOLTIP,tooltip)) return false; this.SetProperty(GRAPH_OBJ_PROP_TOOLTIP,0,tooltip); return true; } //--- Level description string LevelText(const int modifier) const { return this.GetProperty(GRAPH_OBJ_PROP_LEVELTEXT,modifier); } bool SetLevelText(const string text,const int modifier) { if(!::ObjectSetString(CGBaseObj::ChartID(),CGBaseObj::Name(),OBJPROP_LEVELTEXT,modifier,text)) return false; this.SetProperty(GRAPH_OBJ_PROP_LEVELTEXT,modifier,text); return true; } //--- Font string Font(void) const { return this.GetProperty(GRAPH_OBJ_PROP_FONT,0); } bool SetFont(const string font) { if(!::ObjectSetString(CGBaseObj::ChartID(),CGBaseObj::Name(),OBJPROP_FONT,font)) return false; this.SetProperty(GRAPH_OBJ_PROP_FONT,0,font); return true; } //--- BMP file name for the "Bitmap Level" object string BMPFile(const int modifier) const { return this.GetProperty(GRAPH_OBJ_PROP_BMPFILE,modifier); } bool SetBMPFile(const string bmp_file,const int modifier) { if(!::ObjectSetString(CGBaseObj::ChartID(),CGBaseObj::Name(),OBJPROP_BMPFILE,bmp_file)) return false; this.SetProperty(GRAPH_OBJ_PROP_BMPFILE,modifier,bmp_file); return true; } //--- Symbol for the Chart object string ChartObjSymbol(void) const { return this.GetProperty(GRAPH_OBJ_PROP_CHART_OBJ_SYMBOL,0); } bool SetChartObjSymbol(const string symbol) { if(!::ObjectSetString(CGBaseObj::ChartID(),CGBaseObj::Name(),OBJPROP_SYMBOL,symbol)) return false; this.SetProperty(GRAPH_OBJ_PROP_CHART_OBJ_SYMBOL,0,symbol); return true; }
No método que recebe e armazena propriedades inteiras escrevemos os dados, que estão no objeto base, nas propriedades do mesmo e, em seguida, com ele registramos os valores nas propriedades da classe do objeto gráfico:
//+------------------------------------------------------------------+
//| Get and save the integer properties                              |
//+------------------------------------------------------------------+
void CGStdGraphObj::GetAndSaveINT(void)
  {
   //--- Properties inherent in all graphical objects and present in a graphical object
   CGBaseObj::SetVisibleOnTimeframes((int)::ObjectGetInteger(this.ChartID(),this.Name(),OBJPROP_TIMEFRAMES),true);   // Write Object visibility on timeframes to the base object
   CGBaseObj::SetFlagBack(::ObjectGetInteger(this.ChartID(),this.Name(),OBJPROP_BACK),true);                         // Write Background object flag to the base object
   CGBaseObj::SetZorder(::ObjectGetInteger(this.ChartID(),this.Name(),OBJPROP_ZORDER),true);                         // Write Priority of a graphical object for receiving the event of clicking on a chart to the base object
   CGBaseObj::SetFlagHidden(::ObjectGetInteger(this.ChartID(),this.Name(),OBJPROP_HIDDEN),true);                     // Write Disable displaying the name of a graphical object in the terminal object list to the base object
   CGBaseObj::SetFlagSelectable(::ObjectGetInteger(this.ChartID(),this.Name(),OBJPROP_SELECTABLE),true);             // Write Object availability to the base object
   CGBaseObj::SetFlagSelected(::ObjectGetInteger(this.ChartID(),this.Name(),OBJPROP_SELECTED),true);                 // Write Object selection to the base object

   this.SetProperty(GRAPH_OBJ_PROP_TIMEFRAMES,0,CGBaseObj::VisibleOnTimeframes());                                   // Object visibility on timeframes
   this.SetProperty(GRAPH_OBJ_PROP_BACK,0,CGBaseObj::IsBack());                                                      // Background object
   this.SetProperty(GRAPH_OBJ_PROP_ZORDER,0,CGBaseObj::Zorder());                                                    // Priority of a graphical object for receiving the event of clicking on a chart
   this.SetProperty(GRAPH_OBJ_PROP_HIDDEN,0,CGBaseObj::IsHidden());                                                  // Disable displaying the name of a graphical object in the terminal object list
   this.SetProperty(GRAPH_OBJ_PROP_SELECTABLE,0,CGBaseObj::IsSelectable());                                          // Object availability
   this.SetProperty(GRAPH_OBJ_PROP_SELECTED,0,CGBaseObj::IsSelected());                                              // Object selection

   this.SetProperty(GRAPH_OBJ_PROP_CREATETIME,0,::ObjectGetInteger(this.ChartID(),this.Name(),OBJPROP_CREATETIME));  // Object creation time
   for(int i=0;i<this.m_pivots;i++)                                                                                  // Point time coordinates
      this.SetTimePivot(i);
   this.SetProperty(GRAPH_OBJ_PROP_COLOR,0,::ObjectGetInteger(this.ChartID(),this.Name(),OBJPROP_COLOR));            // Color
   this.SetProperty(GRAPH_OBJ_PROP_STYLE,0,::ObjectGetInteger(this.ChartID(),this.Name(),OBJPROP_STYLE));            // Style
   this.SetProperty(GRAPH_OBJ_PROP_WIDTH,0,::ObjectGetInteger(this.ChartID(),this.Name(),OBJPROP_WIDTH));            // Line width
   //--- Properties belonging to different graphical objects
   this.SetProperty(GRAPH_OBJ_PROP_FILL,0,::ObjectGetInteger(this.ChartID(),this.Name(),OBJPROP_FILL));              // Fill an object with color
   this.SetProperty(GRAPH_OBJ_PROP_READONLY,0,::ObjectGetInteger(this.ChartID(),this.Name(),OBJPROP_READONLY));      // Ability to edit text in the Edit object
   this.SetProperty(GRAPH_OBJ_PROP_LEVELS,0,::ObjectGetInteger(this.ChartID(),this.Name(),OBJPROP_LEVELS));          // Number of levels

   if(this.GetProperty(GRAPH_OBJ_PROP_LEVELS,0)!=this.GetPropertyPrev(GRAPH_OBJ_PROP_LEVELS,0))                      // Check if the number of levels has changed
     {
      this.Prop.SetSizeRange(GRAPH_OBJ_PROP_LEVELCOLOR,this.Levels());
      this.Prop.SetSizeRange(GRAPH_OBJ_PROP_LEVELSTYLE,this.Levels());
      this.Prop.SetSizeRange(GRAPH_OBJ_PROP_LEVELWIDTH,this.Levels());
      this.Prop.SetSizeRange(GRAPH_OBJ_PROP_LEVELVALUE,this.Levels());
      this.Prop.SetSizeRange(GRAPH_OBJ_PROP_LEVELTEXT,this.Levels());
     }
   for(int i=0;i<this.Levels();i++)                                                                                  // Level data
     {
      this.SetLevelColor(i);
      this.SetLevelStyle(i);
      this.SetLevelWidth(i);
     }
   this.SetProperty(GRAPH_OBJ_PROP_ALIGN,0,::ObjectGetInteger(this.ChartID(),this.Name(),OBJPROP_ALIGN));            // Horizontal text alignment in the Edit object (OBJ_EDIT)
   this.SetProperty(GRAPH_OBJ_PROP_FONTSIZE,0,::ObjectGetInteger(this.ChartID(),this.Name(),OBJPROP_FONTSIZE));      // Font size
   this.SetProperty(GRAPH_OBJ_PROP_RAY_LEFT,0,::ObjectGetInteger(this.ChartID(),this.Name(),OBJPROP_RAY_LEFT));      // Ray goes to the left
   this.SetProperty(GRAPH_OBJ_PROP_RAY_RIGHT,0,::ObjectGetInteger(this.ChartID(),this.Name(),OBJPROP_RAY_RIGHT));    // Ray goes to the right
   this.SetProperty(GRAPH_OBJ_PROP_RAY,0,::ObjectGetInteger(this.ChartID(),this.Name(),OBJPROP_RAY));                // Vertical line goes through all windows of a chart
   this.SetProperty(GRAPH_OBJ_PROP_ELLIPSE,0,::ObjectGetInteger(this.ChartID(),this.Name(),OBJPROP_ELLIPSE));        // Display the full ellipse of the Fibonacci Arc object
   this.SetProperty(GRAPH_OBJ_PROP_ARROWCODE,0,::ObjectGetInteger(this.ChartID(),this.Name(),OBJPROP_ARROWCODE));    // Arrow code for the "Arrow" object
   this.SetProperty(GRAPH_OBJ_PROP_ANCHOR,0,::ObjectGetInteger(this.ChartID(),this.Name(),OBJPROP_ANCHOR));          // Position of the binding point of the graphical object
   this.SetProperty(GRAPH_OBJ_PROP_XDISTANCE,0,::ObjectGetInteger(this.ChartID(),this.Name(),OBJPROP_XDISTANCE));    // Distance from the base corner along the X axis in pixels
   this.SetProperty(GRAPH_OBJ_PROP_YDISTANCE,0,::ObjectGetInteger(this.ChartID(),this.Name(),OBJPROP_YDISTANCE));    // Distance from the base corner along the Y axis in pixels
   this.SetProperty(GRAPH_OBJ_PROP_DIRECTION,0,::ObjectGetInteger(this.ChartID(),this.Name(),OBJPROP_DIRECTION));    // Gann object trend
   this.SetProperty(GRAPH_OBJ_PROP_DEGREE,0,::ObjectGetInteger(this.ChartID(),this.Name(),OBJPROP_DEGREE));          // Elliott wave marking level
   this.SetProperty(GRAPH_OBJ_PROP_DRAWLINES,0,::ObjectGetInteger(this.ChartID(),this.Name(),OBJPROP_DRAWLINES));    // Display lines for Elliott wave marking
   this.SetProperty(GRAPH_OBJ_PROP_STATE,0,::ObjectGetInteger(this.ChartID(),this.Name(),OBJPROP_STATE));            // Button state (pressed/released)
   this.SetProperty(GRAPH_OBJ_PROP_CHART_OBJ_CHART_ID,0,::ObjectGetInteger(this.ChartID(),this.Name(),OBJPROP_CHART_ID));// Chart object ID (OBJ_CHART).
   this.SetProperty(GRAPH_OBJ_PROP_CHART_OBJ_PERIOD,0,::ObjectGetInteger(this.ChartID(),this.Name(),OBJPROP_PERIOD));    // Chart object period
   this.SetProperty(GRAPH_OBJ_PROP_CHART_OBJ_DATE_SCALE,0,::ObjectGetInteger(this.ChartID(),this.Name(),OBJPROP_DATE_SCALE));  // Time scale display flag for the Chart object
   this.SetProperty(GRAPH_OBJ_PROP_CHART_OBJ_PRICE_SCALE,0,::ObjectGetInteger(this.ChartID(),this.Name(),OBJPROP_PRICE_SCALE));// Price scale display flag for the Chart object
   this.SetProperty(GRAPH_OBJ_PROP_CHART_OBJ_CHART_SCALE,0,::ObjectGetInteger(this.ChartID(),this.Name(),OBJPROP_CHART_SCALE));// Chart object scale
   this.SetProperty(GRAPH_OBJ_PROP_XSIZE,0,::ObjectGetInteger(this.ChartID(),this.Name(),OBJPROP_XSIZE));            // Object width along the X axis in pixels.
   this.SetProperty(GRAPH_OBJ_PROP_YSIZE,0,::ObjectGetInteger(this.ChartID(),this.Name(),OBJPROP_YSIZE));            // Object height along the Y axis in pixels.
   this.SetProperty(GRAPH_OBJ_PROP_XOFFSET,0,::ObjectGetInteger(this.ChartID(),this.Name(),OBJPROP_XOFFSET));        // X coordinate of the upper-left corner of the visibility area.
   this.SetProperty(GRAPH_OBJ_PROP_YOFFSET,0,::ObjectGetInteger(this.ChartID(),this.Name(),OBJPROP_YOFFSET));        // Y coordinate of the upper-left corner of the visibility area.
   this.SetProperty(GRAPH_OBJ_PROP_BGCOLOR,0,::ObjectGetInteger(this.ChartID(),this.Name(),OBJPROP_BGCOLOR));        // Background color for OBJ_EDIT, OBJ_BUTTON, OBJ_RECTANGLE_LABEL
   this.SetProperty(GRAPH_OBJ_PROP_CORNER,0,::ObjectGetInteger(this.ChartID(),this.Name(),OBJPROP_CORNER));          // Chart corner for binding a graphical object
   this.SetProperty(GRAPH_OBJ_PROP_BORDER_TYPE,0,::ObjectGetInteger(this.ChartID(),this.Name(),OBJPROP_BORDER_TYPE));// Border type for "Rectangle border"
   this.SetProperty(GRAPH_OBJ_PROP_BORDER_COLOR,0,::ObjectGetInteger(this.ChartID(),this.Name(),OBJPROP_BORDER_COLOR));// Border color for OBJ_EDIT and OBJ_BUTTON
  }
//+------------------------------------------------------------------+
Desta forma, preenchemos todas as propriedades que são duplicadas na classe de base e seu herdeiro. Caso contrário, ao recuperar as propriedades do objeto, usamos métodos do objeto base, cabe dizer que nenhum dado do objeto gráfico foi escrito neles.
Consideraremos alumas alterações ao criar a funcionalidade de rastreamento de eventos de objetos gráficos padrão.
Eventos de objetos gráficos padrão
A lógica para lidar com os eventos dos objetos gráficos será baseada no seguinte princípio: já podemos definir quaisquer eventos que ocorram com as propriedades de cada objeto. Vamos criar uma pequena classe de evento básico de objeto gráfico e, ao definir qualquer evento de objeto gráfico, criaremos um novo objeto-evento que conterá:
- ID do evento,
- Identificador do gráfico onde se encontra o objeto gráfico, no qual ocorreu o evento,
- O nome do objeto em que o evento ocorreu.
O evento personalizado enviado ao gráfico especificado pela função EventChartCustom() possui cinco parâmetros:
//+------------------------------------------------------------------+
bool  EventChartCustom(
   long    chart_id,            // event receiving chart ID
   ushort  custom_event_id,     // event ID
   long    lparam,              // long parameter
   double  dparam,              // double parameter
   string  sparam               // event string parameter
   );
//+------------------------------------------------------------------+
Só precisamos de: custom_event_id para indicarmos o identificador de evento do objeto gráfico, lparam para definirmos o identificador do gráfico em que o objeto gráfico está localizado e onde ocorreu o evento, e sparam para indicarmos o nome do objeto gráfico. Ainda temos o parâmetro dparam livre, nele especificaremos quer seja o valor da constante da propriedade alterada quando ela for modificada ou o número de objetos gráficos excluídos que foram eliminados junto com a janela do gráfico.
Para cada evento do objeto, criaremos um objeto-evento e os colocaremos na lista de eventos. Depois de verificar as alterações das propriedades do objeto, teremos uma lista completa contendo todos os eventos que ocorreram com o objeto gráfico. Ao final dos loops de verificação de propriedades do objeto, vamos percorrer a lista de eventos criada e enviaremos cada um para o gráfico do programa de controle, onde, por sua vez, o método-manipulador de eventos OnChartEvent( ) da classe-coleção de elementos gráficos será chamada. No manipulador, poderemos processar cada evento enviado a partir da lista de eventos de objeto gráfico criada. Assim, cada um desses eventos conterá o identificador do evento, o identificador do gráfico no qual o objeto gráfico modificado está localizado e seu nome. Isso apontará exatamente para esse objeto gráfico, e o valor da constante da propriedade alterada indicará exatamente qual propriedade foi alterada, e podemos obter um ponteiro para esse objeto na coleção e ler o novo valor da propriedade alterada. Tudo isso nos permitirá apontar com precisão tanto para o próprio objeto gráfico quanto para a propriedade alterada - para processar ainda mais o evento no programa, pois é inerente à sua lógica.
Hoje faremos apenas a criação de eventos e envio para o manipulador de eventos da coleção de objetos gráficos. Vamos decompor esses eventos no próximo artigo.
No início do arquivo do objeto gráfico base \MQL5\Include\DoEasy\Objects\Graph\GBaseObj.mqh, escreveremos uma nova classe do evento base dos objetos gráficos da biblioteca:
//+------------------------------------------------------------------+
//|                                                     GBaseObj.mqh |
//|                                  Copyright 2021, MetaQuotes Ltd. |
//|                             https://mql5.com/en/users/artmedia70 |
//+------------------------------------------------------------------+
#property copyright "Copyright 2021, MetaQuotes Ltd."
#property link      "https://mql5.com/en/users/artmedia70"
#property version   "1.00"
#property strict    // Necessary for mql4
//+------------------------------------------------------------------+
//| Include files                                                    |
//+------------------------------------------------------------------+
#include "..\..\Services\DELib.mqh"
#include <Graphics\Graphic.mqh>
//+------------------------------------------------------------------+
//| Graphical object event class                                     |
//+------------------------------------------------------------------+
class CGBaseEvent : public CObject
  {
private:
   ushort            m_id;
   long              m_lparam;
   double            m_dparam;
   string            m_sparam;
public:
   void              ID(ushort id)                          { this.m_id=id;         }
   ushort            ID(void)                         const { return this.m_id;     }
   void              LParam(const long value)               { this.m_lparam=value;  }
   long              Lparam(void)                     const { return this.m_lparam; }
   void              DParam(const double value)             { this.m_dparam=value;  }
   double            Dparam(void)                     const { return this.m_dparam; }
   void              SParam(const string value)             { this.m_sparam=value;  }
   string            Sparam(void)                     const { return this.m_sparam; }
   bool              Send(const long chart_id)
                       {
                        ::ResetLastError();
                        return ::EventChartCustom(chart_id,m_id,m_lparam,m_dparam,m_sparam);
                       }
                     CGBaseEvent (const ushort event_id,const long lparam,const double dparam,const string sparam) :
                        m_id(event_id),m_lparam(lparam),m_dparam(dparam),m_sparam(sparam){}
                    ~CGBaseEvent (void){}
  };
//+------------------------------------------------------------------+
//| Class of the base object of the library graphical objects        |
//+------------------------------------------------------------------+
class CGBaseObj : public CObject
Na seção privada da classe, são declaradas variáveis membros da classe para armazenar todas as propriedades acima descritas do objeto-evento, e na seção pública, métodos para definir e retornar os valores dessas variáveis e um método para enviar um evento personalizado para o gráfico especificado são declarados.
Todos os valores que precisam ser atribuídos às variáveis de classe são passados para o construtor de classe, e eles estão na lista de inicialização do construtor e são atribuídos às variáveis.
Na seção protegida da classe base do objeto gráfico, vamos declarar uma lista para armazenar eventos do objeto e escrever métodos para trabalhar com a lista e os eventos do objeto gráfico:
//+------------------------------------------------------------------+
//| Class of the base object of the library graphical objects        |
//+------------------------------------------------------------------+
class CGBaseObj : public CObject
  {
protected:
   CArrayObj         m_list_events;                      // Object event list
   ENUM_OBJECT       m_type_graph_obj;                   // Graphical object type
   ENUM_GRAPH_ELEMENT_TYPE m_type_element;               // Graphical element type
   ENUM_GRAPH_OBJ_BELONG m_belong;                       // Program affiliation
   ENUM_GRAPH_OBJ_GROUP m_group;                         // Graphical object group
   string            m_name_prefix;                      // Object name prefix
   string            m_name;                             // Object name
   long              m_chart_id;                         // Object chart ID
   long              m_object_id;                        // Object ID
   long              m_zorder;                           // Priority of a graphical object for receiving the mouse click event
   int               m_subwindow;                        // Subwindow index
   int               m_shift_y;                          // Subwindow Y coordinate shift
   int               m_type;                             // Object type
   int               m_timeframes_visible;               // Visibility of an object on timeframes (a set of flags)
   int               m_digits;                           // Number of decimal places in a quote
   bool              m_visible;                          // Object visibility
   bool              m_back;                             // "Background object" flag
   bool              m_selected;                         // "Object selection" flag
   bool              m_selectable;                       // "Object availability" flag
   bool              m_hidden;                           // "Disable displaying the name of a graphical object in the terminal object list" flag
   datetime          m_create_time;                      // Object creation time

//--- Create (1) the object structure and (2) the object from the structure
   virtual bool      ObjectToStruct(void)                      { return true; }
   virtual void      StructToObject(void){;}

//--- Return the list of object events
   CArrayObj        *GetListEvents(void)                       { return &this.m_list_events;          }
//--- Create a new object event
   CGBaseEvent      *CreateNewEvent(const ushort event_id,const long lparam,const double dparam,const string sparam)
                       {
                        CGBaseEvent *event=new CGBaseEvent(event_id,lparam,dparam,sparam);
                        return event;
                       }
//--- Create a new object event and add it to the event list
   bool              CreateAndAddNewEvent(const ushort event_id,const long lparam,const double dparam,const string sparam)
                       {
                        return this.AddEvent(new CGBaseEvent(event_id,lparam,dparam,sparam));
                       }
//--- Add an event object to the event list
   bool              AddEvent(CGBaseEvent *event)              { return this.m_list_events.Add(event);}
//--- Clear the event list
   void              ClearEventsList(void)                     { this.m_list_events.Clear();          }
//--- Return the number of events in the list
   int               EventsTotal(void)                         { return this.m_list_events.Total();   }

public:
Todos os métodos escritos são bastante simples e espero que não levantem dúvidas. Em qualquer caso, qualquer pergunta pode ser colocada na discussão do artigo.
No construtor de classe, limpamos a lista de eventos de objeto e definimos o sinalizador de lista classificada::
//+------------------------------------------------------------------+
//| Constructor                                                      |
//+------------------------------------------------------------------+
CGBaseObj::CGBaseObj() : m_shift_y(0),m_visible(false), m_name_prefix(::MQLInfoString(MQL_PROGRAM_NAME)+"_"),m_belong(GRAPH_OBJ_BELONG_PROGRAM)
  {
   this.m_list_events.Clear();                  // Clear the event list
   this.m_list_events.Sort();                   // Sorted list flag
   this.m_type=OBJECT_DE_TYPE_GBASE;            // Object type
   this.m_type_graph_obj=WRONG_VALUE;           // Graphical object type
   this.m_type_element=WRONG_VALUE;             // Graphical object type
   this.m_belong=WRONG_VALUE;                   // Program/terminal affiliation
   this.m_name_prefix="";                       // Object name prefix
   this.m_name="";                              // Object name
   this.m_chart_id=0;                           // Object chart ID
   this.m_object_id=0;                          // Object ID
   this.m_zorder=0;                             // Priority of a graphical object for receiving the mouse click event
   this.m_subwindow=0;                          // Subwindow index
   this.m_shift_y=0;                            // Subwindow Y coordinate shift
   this.m_timeframes_visible=OBJ_ALL_PERIODS;   // Visibility of an object on timeframes (a set of flags)
   this.m_visible=true;                         // Object visibility
   this.m_back=false;                           // "Background object" flag
   this.m_selected=false;                       // "Object selection" flag
   this.m_selectable=false;                     // "Object availability" flag
   this.m_hidden=true;                          // "Disable displaying the name of a graphical object in the terminal object list" flag
   this.m_create_time=0;                        // Object creation time

  }
//+------------------------------------------------------------------+
Na classe do objeto gráfico padrão \MQL5\Include\DoEasy\Objects\Graph\Standard\GStdGraphObj.mqh no método que verifica as mudanças nas propriedades do objeto, limpamos a lista de eventos, escrevemos a criação e adição de objetos de eventos à lista e seu envio ao manipulador de eventos da coleção de objetos gráficos a partir da lista criada:
//+------------------------------------------------------------------+
//| Check object property changes                                    |
//+------------------------------------------------------------------+
void CGStdGraphObj::PropertiesCheckChanged(void)
  {
   CGBaseObj::ClearEventsList();
   bool changed=false;
   int begin=0, end=GRAPH_OBJ_PROP_INTEGER_TOTAL;
   for(int i=begin; i<end; i++)
     {
      ENUM_GRAPH_OBJ_PROP_INTEGER prop=(ENUM_GRAPH_OBJ_PROP_INTEGER)i;
      if(!this.SupportProperty(prop)) continue;
      for(int j=0;j<Prop.CurrSize(prop);j++)
        {
         if(this.GetProperty(prop,j)!=this.GetPropertyPrev(prop,j))
           {
            changed=true;
            this.CreateAndAddNewEvent(GRAPH_OBJ_EVENT_CHANGE,this.ChartID(),prop,this.Name());
           }
        }
     }

   begin=end; end+=GRAPH_OBJ_PROP_DOUBLE_TOTAL;
   for(int i=begin; i<end; i++)
     {
      ENUM_GRAPH_OBJ_PROP_DOUBLE prop=(ENUM_GRAPH_OBJ_PROP_DOUBLE)i;
      if(!this.SupportProperty(prop)) continue;
      for(int j=0;j<Prop.CurrSize(prop);j++)
        {
         if(this.GetProperty(prop,j)!=this.GetPropertyPrev(prop,j))
           {
            changed=true;
            this.CreateAndAddNewEvent(GRAPH_OBJ_EVENT_CHANGE,this.ChartID(),prop,this.Name());
           }
        }
     }

   begin=end; end+=GRAPH_OBJ_PROP_STRING_TOTAL;
   for(int i=begin; i<end; i++)
     {
      ENUM_GRAPH_OBJ_PROP_STRING prop=(ENUM_GRAPH_OBJ_PROP_STRING)i;
      if(!this.SupportProperty(prop)) continue;
      for(int j=0;j<Prop.CurrSize(prop);j++)
        {
         if(this.GetProperty(prop,j)!=this.GetPropertyPrev(prop,j) && prop!=GRAPH_OBJ_PROP_NAME)
           {
            changed=true;
            this.CreateAndAddNewEvent(GRAPH_OBJ_EVENT_CHANGE,this.ChartID(),prop,this.Name());
           }
        }
     }
   if(changed)
     {
      for(int i=0;i<this.m_list_events.Total();i++)
        {
         CGBaseEvent *event=this.m_list_events.At(i);
         if(event==NULL)
            continue;
         ::EventChartCustom(::ChartID(),event.ID(),event.Lparam(),event.Dparam(),event.Sparam());
        }
      PropertiesCopyToPrevData();
     }
  }
//+------------------------------------------------------------------+
Aqui estamos fazemos um loop por todas as propriedades do objeto - inteiros, reais e string, verificamos as alterações em cada próxima propriedade do objeto e, se houver uma alteração, criamos um objeto-evento e o adicionamos ao lista de eventos do objeto. Em seguida, se houver pelo menos uma mudança, então em um loop usando a lista criada, pegamos cada próximo objeto-evento e o enviamos para o gráfico do programa de controle. Além disso, esses eventos cairão no manipulador OnChartEvent() da classe-coleção de elementos gráficos e serão processados lá.
Vamos abrir o arquivo da classe-coleção de elementos gráficos \MQL5\Include\DoEasy\Collections\GraphElementsCollection.mqh. Vamos modificar um pouco o método da classe de controle de objetos gráficos:
//+------------------------------------------------------------------+
//| CChartObjectsControl: Check objects on a chart                   |
//+------------------------------------------------------------------+
void CChartObjectsControl::Refresh(void)
  {
//--- Graphical objects on the chart
   this.m_total_objects=::ObjectsTotal(this.ChartID());
   this.m_delta_graph_obj=this.m_total_objects-this.m_last_objects;

   //--- If an object is added to the chart
   if(this.m_delta_graph_obj>0)
     {
      //--- find the last added graphical object, select it and write its name
      string name=this.LastAddedGraphObjName();
      //--- Handle only non-programmatically created objects
      if(name!="" && ::StringFind(name,m_name_program)==WRONG_VALUE)
        {
         //--- Create the object of the graphical object class corresponding to the added graphical object type
         ENUM_OBJECT type=(ENUM_OBJECT)::ObjectGetInteger(this.ChartID(),name,OBJPROP_TYPE);
         ENUM_OBJECT_DE_TYPE obj_type=ENUM_OBJECT_DE_TYPE(type+OBJECT_DE_TYPE_GSTD_OBJ+1);
         CGStdGraphObj *obj=this.CreateNewGraphObj(type,name);
         if(obj==NULL)
           {
            CMessage::ToLog(DFUN,MSG_GRAPH_STD_OBJ_ERR_FAILED_CREATE_CLASS_OBJ);
            return;
           }
         //--- Set the object affiliation and add the created object to the list of new objects
         obj.SetBelong(GRAPH_OBJ_BELONG_NO_PROGRAM);
         if(this.m_list_new_graph_obj.Search(obj)==WRONG_VALUE)
           {
            //--- If failed to add the object to the list, inform of that, delete the object and leave
            if(!this.m_list_new_graph_obj.Add(obj))
              {
               CMessage::ToLog(DFUN_ERR_LINE,MSG_LIB_SYS_FAILED_OBJ_ADD_TO_LIST);
               delete obj;
               return;
              }
            //--- Send an event to the control program chart
            ::EventChartCustom(this.m_chart_id_main,GRAPH_OBJ_EVENT_CREATE,this.ChartID(),0,obj.Name());
           }
        }
     }

//--- save the index of the last added graphical object and the difference with the last check
   this.m_last_objects=this.m_total_objects;
   this.m_is_graph_obj_event=(bool)this.m_delta_graph_obj;
  }
//+------------------------------------------------------------------+
Aqui adicionamos a exibição de mensagens de erro no log e o envio do evento de criação do objeto no gráfico do programa de controle.
Na seção pública da classe-coleção de elementos gráficos, adicionamos um método que retorne uma lista de objetos de controle de gráficos:
//--- Return the number of new graphical objects, (3) the flag of the occurred change in the list of graphical objects
   int               NewObjects(void)   const                                                            { return this.m_delta_graph_obj;       }
   bool              IsEvent(void) const                                                                 { return this.m_is_graph_obj_event;    }
//--- Return a graphical object by chart name and ID
   CGStdGraphObj    *GetStdGraphObject(const string name,const long chart_id);
//--- Return the chart management object list
   CArrayObj        *GetListChartsControl(void)                                                          { return &this.m_list_charts_control;  }
//--- Constructor
                     CGraphElementsCollection();
Como nos métodos para criar objetos gráficos padrão que criamos no último artigo, temos um bloco de código repetido bastante grande, vamos movê-lo para um método privado separado:
//--- Event handler
   void              OnChartEvent(const int id, const long &lparam, const double &dparam, const string &sparam);

private:
//--- Create a new graphical object, return the pointer to the chart management object
   CChartObjectsControl *CreateNewStdGraphObjectAndGetCtrlObj(const long chart_id,
                                                              const string name,
                                                              int subwindow,
                                                              const ENUM_OBJECT type_object,
                                                              const datetime time1,
                                                              const double price1,
                                                              const datetime time2=0,
                                                              const double price2=0,
                                                              const datetime time3=0,
                                                              const double price3=0,
                                                              const datetime time4=0,
                                                              const double price4=0,
                                                              const datetime time5=0,
                                                              const double price5=0)
                       {
                        //--- If an object with a chart ID and name is already present in the collection, inform of that and return NULL
                        if(this.IsPresentGraphObjInList(chart_id,name))
                          {
                           ::Print(DFUN,CMessage::Text(MSG_GRAPH_ELM_COLLECTION_ERR_GR_OBJ_ALREADY_EXISTS)," ChartID ",(string)chart_id,", ",name);
                           return NULL;
                          }
                        //--- If failed to create a new standard graphical object, inform of that and return NULL
                        if(!this.CreateNewStdGraphObject(chart_id,name,type_object,subwindow,time1,0))
                          {
                           ::Print(DFUN,CMessage::Text(MSG_GRAPH_STD_OBJ_ERR_FAILED_CREATE_STD_GRAPH_OBJ),StdGraphObjectTypeDescription(type_object));
                           CMessage::ToLog(::GetLastError(),true);
                           return NULL;
                          }
                        //--- If failed to get a chart management object, inform of that
                        CChartObjectsControl *ctrl=this.GetChartObjectCtrlObj(chart_id);
                        if(ctrl==NULL)
                           ::Print(DFUN,CMessage::Text(MSG_GRAPH_ELM_COLLECTION_ERR_FAILED_GET_CTRL_OBJ),(string)chart_id);
                        //--- Return the pointer to a chart management object or NULL in case of a failed attempt to get it
                        return ctrl;
                       }
//--- Add a newly created object to the list
   bool              AddCreatedObjToList(const string source,const long chart_id,const string name,CGStdGraphObj *obj)
                       {
                        bool res=true;
                        if(!this.m_list_all_graph_obj.Add(obj))
                          {
                           CMessage::ToLog(source,MSG_LIB_SYS_FAILED_OBJ_ADD_TO_LIST);
                           ::ObjectDelete(chart_id,name);
                           delete obj;
                           res=false;
                          }
                        ::ChartRedraw(chart_id);
                        return res;
                       }
public:
//--- Create the "Vertical line" graphical object
Além disso, em todos os métodos para criar objetos gráficos padrão, retornaremos o resultado deste método:
public:
//--- Create the "Vertical line" graphical object
   bool              CreateLineVertical(const long chart_id,const string name,const int subwindow,const datetime time)
                       {
                        //--- Set the name and type of a created object
                        string nm=this.m_name_program+"_"+name;
                        ENUM_OBJECT type_object=OBJ_VLINE;
                        //--- Create a new graphical object and get the pointer to the chart management object
                        CChartObjectsControl *ctrl=this.CreateNewStdGraphObjectAndGetCtrlObj(chart_id,nm,subwindow,type_object,time,0);
                        if(ctrl==NULL)
                           return false;
                        //--- Create a new class object corresponding to the newly created graphical object
                        CGStdVLineObj *obj=ctrl.CreateNewGraphObj(type_object,nm);
                        if(obj==NULL)
                          {
                           ::Print(DFUN,CMessage::Text(MSG_GRAPH_STD_OBJ_ERR_FAILED_CREATE_CLASS_OBJ),StdGraphObjectTypeDescription(type_object));
                           return false;
                          }
                        //--- Set the necessary minimal parameters for an object
                        obj.SetBelong(GRAPH_OBJ_BELONG_PROGRAM);
                        obj.SetFlagSelectable(true,false);
                        obj.SetFlagSelected(true,false);
                        obj.SetObjectID(this.GetFreeGraphObjID(true));
                        obj.PropertiesCopyToPrevData();
                        //--- Return the result of adding the object to the list
                        return this.AddCreatedObjToList(DFUN,chart_id,nm,obj);
                       }
Aqui também escreveremos os sinalizadores necessários para o correto funcionamento do método alterado hoje que define os valores das propriedades de objeto gráfico.
Todos os outros métodos para criar objetos gráficos padrão foram alterados exatamente da mesma maneira e não os veremos aqui - eles podem ser encontrados nos arquivos anexados ao artigo.
No método que cria um novo objeto para controle de objetos gráficos do gráfico especificado e o adiciona à lista, vamos adicionar a exibição de mensagens no log quando o indicador de controle de eventos for adicionado ao gráfico:
//+------------------------------------------------------------------+
//| Create a new graphical object management object                  |
//| for a specified and add it to the list                           |
//+------------------------------------------------------------------+
CChartObjectsControl *CGraphElementsCollection::CreateChartObjectCtrlObj(const long chart_id)
  {
//--- Create a new object for managing chart objects by ID
   CChartObjectsControl *obj=new CChartObjectsControl(chart_id);
//--- If the object is not created, inform of the error and return NULL
   if(obj==NULL)
     {
      ::Print(DFUN,CMessage::Text(MSG_GRAPH_ELM_COLLECTION_ERR_FAILED_CREATE_CTRL_OBJ),(string)chart_id);
      return NULL;
     }
//--- If failed to add the object to the list, inform of the error, remove the object and return NULL
   if(!this.m_list_charts_control.Add(obj))
     {
      CMessage::ToLog(DFUN,MSG_LIB_SYS_FAILED_OBJ_ADD_TO_LIST);
      delete obj;
      return NULL;
     }
   if(obj.ChartID()!=CBaseObj::GetMainChartID() && obj.CreateEventControlInd(CBaseObj::GetMainChartID()))
      if(!obj.AddEventControlInd())
        {
         CMessage::ToLog(DFUN,MSG_GRAPH_OBJ_FAILED_ADD_EVN_CTRL_INDICATOR);
         CMessage::ToLog(DFUN,::GetLastError(),true);
        }
      else
         ::Print(DFUN,CMessage::Text(MSG_GRAPH_OBJ_ADDED_EVN_CTRL_INDICATOR),obj.Symbol()," #",obj.ChartID());
//--- Return the pointer to the object that was created and added to the list
   return obj;
  }
//+------------------------------------------------------------------+
No método que atualiza a lista de objetos gráficos, ao invés de simplesmente enviar para o log o objeto gráfico deletado encontrado na lista-coleção, agora enviaremos um evento sobre a remoção do objeto gráfico:
//+------------------------------------------------------------------+
//| Update the list of all graphical objects                         |
//+------------------------------------------------------------------+
void CGraphElementsCollection::Refresh(void)
  {
   this.RefreshForExtraObjects();
//--- Declare variables to search for charts
   long chart_id=0;
   int i=0;
//--- In the loop by all open charts in the terminal (no more than 100)
   while(i<CHARTS_MAX)
     {
      //--- Get the chart ID
      chart_id=::ChartNext(chart_id);
      if(chart_id<0)
         break;
      //--- Get the pointer to the object for managing graphical objects
      //--- and update the list of graphical objects by chart ID
      CChartObjectsControl *obj_ctrl=this.RefreshByChartID(chart_id);
      //--- If failed to get the pointer, move on to the next chart
      if(obj_ctrl==NULL)
         continue;
      //--- If the number of objects on the chart changes
      if(obj_ctrl.IsEvent())
        {
         //--- If a graphical object is added to the chart
         if(obj_ctrl.Delta()>0)
           {
            //--- Get the list of added graphical objects and move them to the collection list
            //--- (if failed to move the object to the collection, move on to the next object)
            if(!this.AddGraphObjToCollection(DFUN_ERR_LINE,obj_ctrl))
               continue;
           }
         //--- If the graphical object has been removed
         else if(obj_ctrl.Delta()<0)
           {
            // Find an extra object in the list
            CGStdGraphObj *obj=this.FindMissingObj(chart_id);
            if(obj!=NULL)
              {
               //--- Send an event to the control program chart
               ::EventChartCustom(this.m_chart_id_main,GRAPH_OBJ_EVENT_DELETE,obj.ChartID(),0,obj.Name());
               //--- Remove the class object of a removed graphical object from the collection list
               if(!this.DeleteGraphObjFromList(obj))
                  CMessage::ToLog(DFUN,MSG_GRAPH_OBJ_FAILED_DETACH_OBJ_FROM_LIST);
              }
           }
        }
      //--- Increase the loop index
      i++;
     }
  }
//+------------------------------------------------------------------+
No evento, no parâmetro string, passamos o nome do objeto removido. É bem possível que salvemos os objetos excluídos em uma lista separada, para que, quando um evento de remoção for recebido, possamos ver qual objeto foi excluído e quais propriedades tinha e, se necessário, restaurá-lo programaticamente.
No método que processa a exclusão da janela do gráfico, ao invés de uma simples mensagem no log, agora enviaremos um evento para o gráfico do programa de controle:
//+------------------------------------------------------------------+
//| Handle removing the chart window                                 |
//+------------------------------------------------------------------+
void CGraphElementsCollection::RefreshForExtraObjects(void)
  {
   for(int i=this.m_list_charts_control.Total()-1;i>WRONG_VALUE;i--)
     {
      CChartObjectsControl *obj_ctrl=this.m_list_charts_control.At(i);
      if(obj_ctrl==NULL)
         continue;
      if(!this.IsPresentChartWindow(obj_ctrl.ChartID()))
        {
         long chart_id=obj_ctrl.ChartID();
         string chart_symb=obj_ctrl.Symbol();
         int total_ctrl=this.m_list_charts_control.Total();
         this.DeleteGraphObjCtrlObjFromList(obj_ctrl);
         int total_obj=this.m_list_all_graph_obj.Total();
         this.DeleteGraphObjectsFromList(chart_id);
         int del_ctrl=total_ctrl-this.m_list_charts_control.Total();
         int del_obj=total_obj-this.m_list_all_graph_obj.Total();
         ::EventChartCustom(this.m_chart_id_main,GRAPH_OBJ_EVENT_DEL_CHART,chart_id,del_obj,chart_symb);
        }
     }
  }
//+------------------------------------------------------------------+
Aqui passamos nos parâmetros do evento o identificador do gráfico fechado, o número de objetos gráficos removidos junto com ele e o símbolo do gráfico fechado.
No manipulador de eventos da classe da coleção de elementos gráficos, adicionamos o processamento de eventos básicos de objetos gráficos:
//+------------------------------------------------------------------+
//| Event handler                                                    |
//+------------------------------------------------------------------+
void CGraphElementsCollection::OnChartEvent(const int id, const long &lparam, const double &dparam, const string &sparam)
  {
   CGStdGraphObj *obj=NULL;
   ushort idx=ushort(id-CHARTEVENT_CUSTOM);
   if(id==CHARTEVENT_OBJECT_CHANGE  || id==CHARTEVENT_OBJECT_DRAG    || id==CHARTEVENT_OBJECT_CLICK   ||
      idx==CHARTEVENT_OBJECT_CHANGE || idx==CHARTEVENT_OBJECT_DRAG   || idx==CHARTEVENT_OBJECT_CLICK)
     {
      //--- Calculate the chart ID
      //--- If the event ID corresponds to an event from the current chart, the chart ID is received from ChartID
      //--- If the event ID corresponds to a user event, the chart ID is received from lparam
      //--- Otherwise, the chart ID is assigned to -1
      long param=(id==CHARTEVENT_OBJECT_CLICK ? ::ChartID() : idx==CHARTEVENT_OBJECT_CLICK ? lparam : WRONG_VALUE);
      long chart_id=(param==WRONG_VALUE ? (lparam==0 ? ::ChartID() : lparam) : param);
      //--- Get the object, whose properties were changed or which was relocated,
      //--- from the collection list by its name set in sparam
      obj=this.GetStdGraphObject(sparam,chart_id);

      //--- If failed to get the object by its name, it is not on the list,
      //--- which means its name has been changed
      if(obj==NULL)
        {
         //--- Let's search the list for the object that is not on the chart
         obj=this.FindMissingObj(chart_id);
         //--- If failed to find the object here as well, exit
         if(obj==NULL)
            return;
         //--- Get the name of the renamed graphical object on the chart, which is not in the collection list
         string name_new=this.FindExtraObj(chart_id);
         //--- Send an event with the old name of an object to the control program chart and
         //--- set a new name for the collection list object, which does not correspond to any graphical object on the chart
         ::EventChartCustom(this.m_chart_id_main,GRAPH_OBJ_EVENT_RENAME,obj.ChartID(),0,obj.Name());
         obj.SetName(name_new);
        }
      //--- Update the properties of the obtained object
      //--- and check their change
      obj.PropertiesRefresh();
      obj.PropertiesCheckChanged();
     }
//--- Handle standard graphical object events
   if(idx>GRAPH_OBJ_EVENT_NO_EVENT && idx<GRAPH_OBJ_EVENTS_NEXT_CODE)
     {
      //--- Depending on the event type, display an appropriate message in the journal
      switch(idx)
        {
         case GRAPH_OBJ_EVENT_CREATE   :
           ::Print(DFUN,CMessage::Text(MSG_GRAPH_OBJ_EVN_GRAPH_OBJ_CREATE));
           obj=this.GetStdGraphObject(sparam,lparam);
           if(obj!=NULL)
              obj.PrintShort();
           break;
         case GRAPH_OBJ_EVENT_CHANGE   :
           ::Print(DFUN,CMessage::Text(MSG_GRAPH_OBJ_EVN_GRAPH_OBJ_CHANGE));
           obj=this.GetStdGraphObject(sparam,lparam);
           if(obj!=NULL)
              obj.PrintShort();
           break;
         case GRAPH_OBJ_EVENT_RENAME   :
           ::Print(DFUN,CMessage::Text(MSG_GRAPH_OBJ_EVN_GRAPH_OBJ_RENAME));
           obj=this.GetStdGraphObject(sparam,lparam);
           if(obj!=NULL)
              obj.PrintShort();
           break;
         case GRAPH_OBJ_EVENT_DELETE   :
           ::Print(DFUN,CMessage::Text(MSG_GRAPH_OBJ_EVN_GRAPH_OBJ_DELETE));
           break;
         case GRAPH_OBJ_EVENT_DEL_CHART:
           ::Print(DFUN,CMessage::Text(MSG_GRAPH_OBJ_EVN_GRAPH_OBJ_DEL_CHART),": ChartID: ",lparam,", ChartSymbol: ",sparam);
           break;
         default:
           break;
        }
     }
  }
//+------------------------------------------------------------------+
A lógica do método é descrita nos comentários ao código. Aqui adicionamos uma reação ao evento de click no gráfico, e se houver um duplo clique, o estado de seleção do objeto será alterado, o que levará ao aparecimento de um evento sobre a alteração dos parâmetros do objeto. Assim, poderemos manipular os eventos de seleção e desmarcação do objeto.
Finalmente, os eventos já tratados do objeto gráfico, para os quais os eventos base foram criados, chegam ao mesmo método. Esses eventos básicos são processados em um novo bloco de código. Até agora, temos apenas a saída de mensagens para o log. Nos artigos a seguir, criaremos um processamento completo de cada um desses eventos para que o programa possa conhecer e acessar rapidamente o próprio objeto alterado e suas propriedades.
Criamos métodos para trabalhar usando objetos gráficos na classe principal da biblioteca CEngine em \MQL5\Include\DoEasy\Engine.mqh.
Para determinar quais gráficos abrimos ao usar classes de objetos gráficos padrão, podemos examinar a lista de objetos de controle de gráfico. Nesta lista, podemos pegar os identificadores de todos os gráficos abertos a partir dos objetos, tendo assim a oportunidade de acessá-los. Para simplificar o recebimento de identificadores no programa, vamos criar um método que irá preencher a matriz long passada para ele com os valores dos identificadores dos gráficos abertos para os quais são criados objetos de controle:
//--- Launch the new pause countdown
   void                 Pause(const ulong pause_msc,const datetime time_start=0)
                          {
                           this.PauseSetWaitingMSC(pause_msc);
                           this.PauseSetTimeBegin(time_start*1000);
                           while(!this.PauseIsCompleted() && !::IsStopped()){}
                          }

//--- Return the graphical object collection
   CGraphElementsCollection *GetGraphicObjCollection(void)              { return &this.m_graph_objects; }

//--- Fill in the array with IDs of the charts opened in the terminal
   void              GraphGetArrayChartsID(long &array_charts_id[])
                       {
                        CArrayObj *list=this.m_graph_objects.GetListChartsControl();
                        if(list==NULL)
                           return;
                        ::ArrayResize(array_charts_id,list.Total());
                        ::ArrayInitialize(array_charts_id,WRONG_VALUE);
                        for(int i=0;i<list.Total();i++)
                          {
                           CChartObjectsControl *obj=list.At(i);
                           if(obj==NULL)
                              continue;
                           array_charts_id[i]=obj.ChartID();
                          }
                       }

//--- Create the "Vertical line" graphical object
Aqui imediatamente definimos o tamanho da matriz passada para o método igual ao tamanho da lista de objetos de controle do gráfico e inicializamos a matriz com valores -1. Isso é necessário em caso de erro ao obter o objeto de controle do gráfico em um loop, de modo que o valor -1 seja inserido na célula da matriz correspondente ao índice do objeto de controle do gráfico que não pôde ser obtido, que servirá como sinal de erro.
Claro, podemos aumentar o tamanho da matriz no loop somente se o objeto for obtido com sucesso, mas chamar ArrayResize() dentro do loop não contribui para o desempenho rápido. Portanto, imediatamente aumentamos a matriz para caber na lista e, em caso de erro, a célula da matriz correspondente conterá -1.
Além disso, no loop, de acordo com a lista recebida, obtemos o próximo objeto de controle do gráfico e escrevemos o identificador do gráfico contido no objeto de controle do gráfico na célula da matriz, identificador esse correspondente ao índice do loop.
Para acesso simplificado aos métodos para criar objetos gráficos padrão, vamos escrever métodos para criá-los — existem dois métodos para cada objeto. O primeiro método chamará o método de classe de coleção de elementos gráficos de mesmo nome para criar um objeto gráfico padrão,
e o segundo chamará o primeiro método com o identificador do gráfico atual:
//--- Create the "Vertical line" graphical object bool CreateLineVertical(const long chart_id,const string name,const int subwindow,const datetime time) { return this.m_graph_objects.CreateLineVertical(chart_id,name,subwindow,time); } bool CreateLineVertical(const string name,const int subwindow,const datetime time) { return this.CreateLineVertical(::ChartID(),name,subwindow,time); } //--- Create the "Horizontal line" graphical object bool CreateLineHorizontal(const long chart_id,const string name,const int subwindow,const double price) { return this.m_graph_objects.CreateLineHorizontal(chart_id,name,subwindow,price); } bool CreateLineHorizontal(const string name,const int subwindow,const double price) { return this.CreateLineHorizontal(::ChartID(),name,subwindow,price); } //--- Create the "Trend line" graphical object bool CreateLineTrend(const long chart_id,const string name,const int subwindow, const datetime time1,const double price1,const datetime time2,const double price2) { return this.m_graph_objects.CreateLineTrend(chart_id,name,subwindow,time1,price1,time2,price2); } bool CreateLineTrend(const string name,const int subwindow, const datetime time1,const double price1,const datetime time2,const double price2) { return this.CreateLineTrend(::ChartID(),name,subwindow,time1,price1,time2,price2); } //--- Create the "Trend line by angle" graphical object bool CreateLineTrendByAngle(const long chart_id,const string name,const int subwindow, const datetime time1,const double price1,const datetime time2,const double price2, const double angle) { return this.m_graph_objects.CreateLineTrendByAngle(chart_id,name,subwindow,time1,price1,time2,price2,angle); } bool CreateLineTrendByAngle(const string name,const int subwindow, const datetime time1,const double price1,const datetime time2,const double price2, const double angle) { return this.CreateLineTrendByAngle(::ChartID(),name,subwindow,time1,price1,time2,price2,angle); } //--- Create the "Cyclic lines" graphical object bool CreateLineCycle(const long chart_id,const string name,const int subwindow, const datetime time1,const double price1,const datetime time2,const double price2) { return this.m_graph_objects.CreateLineCycle(chart_id,name,subwindow,time1,price1,time2,price2); } bool CreateLineCycle(const string name,const int subwindow, const datetime time1,const double price1,const datetime time2,const double price2) { return this.CreateLineCycle(::ChartID(),name,subwindow,time1,price1,time2,price2); } //--- Create the "Arrowed line" graphical object bool CreateLineArrowed(const long chart_id,const string name,const int subwindow, const datetime time1,const double price1,const datetime time2,const double price2) { return this.m_graph_objects.CreateLineArrowed(chart_id,name,subwindow,time1,price1,time2,price2); } bool CreateLineArrowed(const string name,const int subwindow, const datetime time1,const double price1,const datetime time2,const double price2) { return this.CreateLineArrowed(::ChartID(),name,subwindow,time1,price1,time2,price2); } //--- Create the "Equidistant channel" graphical object bool CreateChannel(const long chart_id,const string name,const int subwindow, const datetime time1,const double price1,const datetime time2,const double price2, const datetime time3,const double price3) { return this.m_graph_objects.CreateChannel(chart_id,name,subwindow,time1,price1,time2,price2,time3,price3); } bool CreateChannel(const string name,const int subwindow, const datetime time1,const double price1,const datetime time2,const double price2, const datetime time3,const double price3) { return this.CreateChannel(::ChartID(),name,subwindow,time1,price1,time2,price2,time3,price3); } //--- Create the "Standard deviation channel" graphical object bool CreateChannelStdDeviation(const long chart_id,const string name,const int subwindow, const datetime time1,const double price1,const datetime time2,const double price2, const double deviation=1.5) { return this.m_graph_objects.CreateChannelStdDeviation(chart_id,name,subwindow,time1,price1,time2,price2,deviation); } bool CreateChannelStdDeviation(const string name,const int subwindow, const datetime time1,const double price1,const datetime time2,const double price2, const double deviation=1.5) { return this.CreateChannelStdDeviation(::ChartID(),name,subwindow,time1,price1,time2,price2,deviation); } //--- Create the "Linear regression channel" graphical object bool CreateChannelRegression(const long chart_id,const string name,const int subwindow, const datetime time1,const double price1,const datetime time2,const double price2) { return this.m_graph_objects.CreateChannelRegression(chart_id,name,subwindow,time1,price1,time2,price2); } bool CreateChannelRegression(const string name,const int subwindow, const datetime time1,const double price1,const datetime time2,const double price2) { return this.CreateChannelRegression(::ChartID(),name,subwindow,time1,price1,time2,price2); } //--- Create the "Andrews' Pitchfork" graphical object bool CreatePitchforkAndrews(const long chart_id,const string name,const int subwindow, const datetime time1,const double price1,const datetime time2,const double price2, const datetime time3,const double price3) { return this.m_graph_objects.CreatePitchforkAndrews(chart_id,name,subwindow,time1,price1,time2,price2,time3,price3); } bool CreatePitchforkAndrews(const string name,const int subwindow, const datetime time1,const double price1,const datetime time2,const double price2, const datetime time3,const double price3) { return this.CreatePitchforkAndrews(::ChartID(),name,subwindow,time1,price1,time2,price2,time3,price3); } //--- Create the "Gann line" graphical object bool CreateGannLine(const long chart_id,const string name,const int subwindow, const datetime time1,const double price1,const datetime time2,const double price2,const double angle) { return this.m_graph_objects.CreateGannLine(chart_id,name,subwindow,time1,price1,time2,price2,angle); } bool CreateGannLine(const string name,const int subwindow, const datetime time1,const double price1,const datetime time2,const double price2,const double angle) { return this.CreateGannLine(::ChartID(),name,subwindow,time1,price1,time2,price2,angle); } //--- Create the "Gann fan" graphical object bool CreateGannFan(const long chart_id,const string name,const int subwindow, const datetime time1,const double price1,const datetime time2,const double price2, const ENUM_GANN_DIRECTION direction,const double scale) { return this.m_graph_objects.CreateGannFan(chart_id,name,subwindow,time1,price1,time2,price2,direction,scale); } bool CreateGannFan(const string name,const int subwindow, const datetime time1,const double price1,const datetime time2,const double price2, const ENUM_GANN_DIRECTION direction,const double scale) { return this.CreateGannFan(::ChartID(),name,subwindow,time1,price1,time2,price2,direction,scale); } //--- Create the "Gann grid" graphical object bool CreateGannGrid(const long chart_id,const string name,const int subwindow, const datetime time1,const double price1,const datetime time2, const ENUM_GANN_DIRECTION direction,const double scale) { return this.m_graph_objects.CreateGannGrid(chart_id,name,subwindow,time1,price1,time2,direction,scale); } bool CreateGannGrid(const string name,const int subwindow, const datetime time1,const double price1,const datetime time2, const ENUM_GANN_DIRECTION direction,const double scale) { return this.CreateGannGrid(::ChartID(),name,subwindow,time1,price1,time2,direction,scale); } //--- Create the "Fibo levels" graphical object bool CreateFiboLevels(const long chart_id,const string name,const int subwindow, const datetime time1,const double price1,const datetime time2,const double price2) { return this.m_graph_objects.CreateFiboLevels(chart_id,name,subwindow,time1,price1,time2,price2); } bool CreateFiboLevels(const string name,const int subwindow, const datetime time1,const double price1,const datetime time2,const double price2) { return this.CreateFiboLevels(::ChartID(),name,subwindow,time1,price1,time2,price2); } //--- Create the "Fibo Time Zones" graphical object bool CreateFiboTimeZones(const long chart_id,const string name,const int subwindow, const datetime time1,const double price1,const datetime time2,const double price2) { return this.m_graph_objects.CreateFiboTimeZones(chart_id,name,subwindow,time1,price1,time2,price2); } bool CreateFiboTimeZones(const string name,const int subwindow, const datetime time1,const double price1,const datetime time2,const double price2) { return this.CreateFiboTimeZones(::ChartID(),name,subwindow,time1,price1,time2,price2); } //--- Create the "Fibo fan" graphical object bool CreateFiboFan(const long chart_id,const string name,const int subwindow, const datetime time1,const double price1,const datetime time2,const double price2) { return this.m_graph_objects.CreateFiboFan(chart_id,name,subwindow,time1,price1,time2,price2); } bool CreateFiboFan(const string name,const int subwindow, const datetime time1,const double price1,const datetime time2,const double price2) { return this.CreateFiboFan(::ChartID(),name,subwindow,time1,price1,time2,price2); } //--- Create the "Fibo arc" graphical object bool CreateFiboArc(const long chart_id,const string name,const int subwindow, const datetime time1,const double price1,const datetime time2,const double price2, const double scale,const bool ellipse) { return this.m_graph_objects.CreateFiboArc(chart_id,name,subwindow,time1,price1,time2,price2,scale,ellipse); } bool CreateFiboArc(const string name,const int subwindow, const datetime time1,const double price1,const datetime time2,const double price2, const double scale,const bool ellipse) { return this.CreateFiboArc(::ChartID(),name,subwindow,time1,price1,time2,price2,scale,ellipse); } //--- Create the "Fibo channel" graphical object bool CreateFiboChannel(const long chart_id,const string name,const int subwindow, const datetime time1,const double price1,const datetime time2,const double price2,const datetime time3,const double price3) { return this.m_graph_objects.CreateFiboChannel(chart_id,name,subwindow,time1,price1,time2,price2,time3,price3); } bool CreateFiboChannel(const string name,const int subwindow, const datetime time1,const double price1,const datetime time2,const double price2,const datetime time3,const double price3) { return this.CreateFiboChannel(::ChartID(),name,subwindow,time1,price1,time2,price2,time3,price3); } //--- Create the "Fibo extension" graphical object bool CreateFiboExpansion(const long chart_id,const string name,const int subwindow, const datetime time1,const double price1,const datetime time2,const double price2,const datetime time3,const double price3) { return this.m_graph_objects.CreateFiboExpansion(chart_id,name,subwindow,time1,price1,time2,price2,time3,price3); } bool CreateFiboExpansion(const string name,const int subwindow, const datetime time1,const double price1,const datetime time2,const double price2,const datetime time3,const double price3) { return this.CreateFiboExpansion(::ChartID(),name,subwindow,time1,price1,time2,price2,time3,price3); } //--- Create the "Elliott 5 waves" graphical object bool CreateElliothWave5(const long chart_id,const string name,const int subwindow, const datetime time1,const double price1,const datetime time2,const double price2, const datetime time3,const double price3,const datetime time4,const double price4, const datetime time5,const double price5,const ENUM_ELLIOT_WAVE_DEGREE degree, const bool draw_lines) { return this.m_graph_objects.CreateElliothWave5(chart_id,name,subwindow,time1,price1,time2,price2,time3,price3,time4,price4,time5,price5,degree,draw_lines); } bool CreateElliothWave5(const string name,const int subwindow, const datetime time1,const double price1,const datetime time2,const double price2, const datetime time3,const double price3,const datetime time4,const double price4, const datetime time5,const double price5,const ENUM_ELLIOT_WAVE_DEGREE degree, const bool draw_lines) { return this.CreateElliothWave5(::ChartID(),name,subwindow,time1,price1,time2,price2,time3,price3,time4,price4,time5,price5,degree,draw_lines); } //--- Create the "Elliott 3 waves" graphical object bool CreateElliothWave3(const long chart_id,const string name,const int subwindow, const datetime time1,const double price1,const datetime time2, const double price2,const datetime time3,const double price3, const ENUM_ELLIOT_WAVE_DEGREE degree,const bool draw_lines) { return this.m_graph_objects.CreateElliothWave3(chart_id,name,subwindow,time1,price1,time2,price2,time3,price3,degree,draw_lines); } bool CreateElliothWave3(const string name,const int subwindow, const datetime time1,const double price1,const datetime time2, const double price2,const datetime time3,const double price3, const ENUM_ELLIOT_WAVE_DEGREE degree,const bool draw_lines) { return this.CreateElliothWave3(::ChartID(),name,subwindow,time1,price1,time2,price2,time3,price3,degree,draw_lines); } //--- Create the Rectangle graphical object bool CreateRectangle(const long chart_id,const string name,const int subwindow, const datetime time1,const double price1,const datetime time2,const double price2) { return this.m_graph_objects.CreateRectangle(chart_id,name,subwindow,time1,price1,time2,price2); } bool CreateRectangle(const string name,const int subwindow, const datetime time1,const double price1,const datetime time2,const double price2) { return this.CreateRectangle(::ChartID(),name,subwindow,time1,price1,time2,price2); } //--- Create the Triangle graphical object bool CreateTriangle(const long chart_id,const string name,const int subwindow, const datetime time1,const double price1,const datetime time2,const double price2,const datetime time3,const double price3) { return this.m_graph_objects.CreateTriangle(chart_id,name,subwindow,time1,price1,time2,price2,time3,price3); } bool CreateTriangle(const string name,const int subwindow, const datetime time1,const double price1,const datetime time2,const double price2,const datetime time3,const double price3) { return this.CreateTriangle(::ChartID(),name,subwindow,time1,price1,time2,price2,time3,price3); } //--- Create the Ellipse graphical object bool CreateEllipse(const long chart_id,const string name,const int subwindow, const datetime time1,const double price1,const datetime time2,const double price2,const datetime time3,const double price3) { return this.m_graph_objects.CreateEllipse(chart_id,name,subwindow,time1,price1,time2,price2,time3,price3); } bool CreateEllipse(const string name,const int subwindow, const datetime time1,const double price1,const datetime time2,const double price2,const datetime time3,const double price3) { return this.CreateEllipse(::ChartID(),name,subwindow,time1,price1,time2,price2,time3,price3); } //--- Create the "Thumb up" graphical object bool CreateThumbUp(const long chart_id,const string name,const int subwindow,const datetime time,const double price) { return this.m_graph_objects.CreateThumbUp(chart_id,name,subwindow,time,price); } bool CreateThumbUp(const string name,const int subwindow,const datetime time,const double price) { return this.CreateThumbUp(::ChartID(),name,subwindow,time,price); } //--- Create the "Thumb down" graphical object bool CreateThumbDown(const long chart_id,const string name,const int subwindow,const datetime time,const double price) { return this.m_graph_objects.CreateThumbDown(chart_id,name,subwindow,time,price); } bool CreateThumbDown(const string name,const int subwindow,const datetime time,const double price) { return this.CreateThumbDown(::ChartID(),name,subwindow,time,price); } //--- Create the "Arrow up" graphical object bool CreateArrowUp(const long chart_id,const string name,const int subwindow,const datetime time,const double price) { return this.m_graph_objects.CreateArrowUp(chart_id,name,subwindow,time,price); } bool CreateArrowUp(const string name,const int subwindow,const datetime time,const double price) { return this.CreateArrowUp(::ChartID(),name,subwindow,time,price); } //--- Create the "Arrow down" graphical object bool CreateArrowDown(const long chart_id,const string name,const int subwindow,const datetime time,const double price) { return this.m_graph_objects.CreateArrowDown(chart_id,name,subwindow,time,price); } bool CreateArrowDown(const string name,const int subwindow,const datetime time,const double price) { return this.CreateArrowDown(::ChartID(),name,subwindow,time,price); } //--- Create the Stop graphical object bool CreateSignalStop(const long chart_id,const string name,const int subwindow,const datetime time,const double price) { return this.m_graph_objects.CreateSignalStop(chart_id,name,subwindow,time,price); } bool CreateSignalStop(const string name,const int subwindow,const datetime time,const double price) { return this.CreateSignalStop(::ChartID(),name,subwindow,time,price); } //--- Create the "Check mark" graphical object bool CreateSignalCheck(const long chart_id,const string name,const int subwindow,const datetime time,const double price) { return this.m_graph_objects.CreateSignalCheck(chart_id,name,subwindow,time,price); } bool CreateSignalCheck(const string name,const int subwindow,const datetime time,const double price) { return this.CreateSignalCheck(::ChartID(),name,subwindow,time,price); } //--- Create the "Left price label" graphical object bool CreatePriceLabelLeft(const long chart_id,const string name,const int subwindow,const datetime time,const double price) { return this.m_graph_objects.CreatePriceLabelLeft(chart_id,name,subwindow,time,price); } bool CreatePriceLabelLeft(const string name,const int subwindow,const datetime time,const double price) { return this.CreatePriceLabelLeft(::ChartID(),name,subwindow,time,price); } //--- Create the "Right price label" graphical object bool CreatePriceLabelRight(const long chart_id,const string name,const int subwindow,const datetime time,const double price) { return this.m_graph_objects.CreatePriceLabelRight(chart_id,name,subwindow,time,price); } bool CreatePriceLabelRight(const string name,const int subwindow,const datetime time,const double price) { return this.CreatePriceLabelRight(::ChartID(),name,subwindow,time,price); } //--- Create the Buy graphical object bool CreateSignalBuy(const long chart_id,const string name,const int subwindow,const datetime time,const double price) { return this.m_graph_objects.CreateSignalBuy(chart_id,name,subwindow,time,price); } bool CreateSignalBuy(const string name,const int subwindow,const datetime time,const double price) { return this.CreateSignalBuy(::ChartID(),name,subwindow,time,price); } //--- Create the Sell graphical object bool CreateSignalSell(const long chart_id,const string name,const int subwindow,const datetime time,const double price) { return this.m_graph_objects.CreateSignalSell(chart_id,name,subwindow,time,price); } bool CreateSignalSell(const string name,const int subwindow,const datetime time,const double price) { return this.CreateSignalSell(::ChartID(),name,subwindow,time,price); } //--- Create the Arrow graphical object bool CreateArrow(const long chart_id,const string name,const int subwindow,const datetime time,const double price, const uchar arrow_code,const ENUM_ARROW_ANCHOR anchor) { return this.m_graph_objects.CreateArrow(chart_id,name,subwindow,time,price,arrow_code,anchor); } bool CreateArrow(const string name,const int subwindow,const datetime time,const double price, const uchar arrow_code,const ENUM_ARROW_ANCHOR anchor) { return this.CreateArrow(::ChartID(),name,subwindow,time,price,arrow_code,anchor); } //--- Create the Text graphical object bool CreateText(const long chart_id,const string name,const int subwindow,const datetime time,const double price, const string text,const int size,const ENUM_ANCHOR_POINT anchor_point,const double angle) { return this.m_graph_objects.CreateText(chart_id,name,subwindow,time,price,text,size,anchor_point,angle); } bool CreateText(const string name,const int subwindow,const datetime time,const double price, const string text,const int size,const ENUM_ANCHOR_POINT anchor_point,const double angle) { return this.CreateText(::ChartID(),name,subwindow,time,price,text,size,anchor_point,angle); } //--- Create the "Text label" graphical object bool CreateTextLabel(const long chart_id,const string name,const int subwindow,const int x,const int y, const string text,const int size,const ENUM_BASE_CORNER corner, const ENUM_ANCHOR_POINT anchor_point,const double angle) { return this.m_graph_objects.CreateTextLabel(chart_id,name,subwindow,x,y,text,size,corner,anchor_point,angle); } bool CreateTextLabel(const string name,const int subwindow,const int x,const int y, const string text,const int size,const ENUM_BASE_CORNER corner, const ENUM_ANCHOR_POINT anchor_point,const double angle) { return this.CreateTextLabel(::ChartID(),name,subwindow,x,y,text,size,corner,anchor_point,angle); } //--- Create the Button graphical object bool CreateButton(const long chart_id,const string name,const int subwindow,const int x,const int y,const int w,const int h, const ENUM_BASE_CORNER corner,const int font_size,const bool button_state) { return this.m_graph_objects.CreateButton(chart_id,name,subwindow,x,y,w,h,corner,font_size,button_state); } bool CreateButton(const string name,const int subwindow,const int x,const int y,const int w,const int h, const ENUM_BASE_CORNER corner,const int font_size,const bool button_state) { return this.CreateButton(::ChartID(),name,subwindow,x,y,w,h,corner,font_size,button_state); } //--- Create the Chart graphical object bool CreateChart(const long chart_id,const string name,const int subwindow,const int x,const int y,const int w,const int h, const ENUM_BASE_CORNER corner,const int scale,const string symbol,const ENUM_TIMEFRAMES timeframe) { return this.m_graph_objects.CreateChart(chart_id,name,subwindow,x,y,w,h,corner,scale,symbol,timeframe); } bool CreateChart(const string name,const int subwindow,const int x,const int y,const int w,const int h, const ENUM_BASE_CORNER corner,const int scale,const string symbol,const ENUM_TIMEFRAMES timeframe) { return this.CreateChart(::ChartID(),name,subwindow,x,y,w,h,corner,scale,symbol,timeframe); } //--- Create the Bitmap graphical object bool CreateBitmap(const long chart_id,const string name,const int subwindow,const datetime time,const double price, const string image1,const string image2,const ENUM_ANCHOR_POINT anchor) { return this.m_graph_objects.CreateBitmap(chart_id,name,subwindow,time,price,image1,image2,anchor); } bool CreateBitmap(const string name,const int subwindow,const datetime time,const double price, const string image1,const string image2,const ENUM_ANCHOR_POINT anchor) { return this.CreateBitmap(::ChartID(),name,subwindow,time,price,image1,image2,anchor); } //--- Create the "Bitmap label" graphical object bool CreateBitmapLabel(const long chart_id,const string name,const int subwindow,const int x,const int y,const int w,const int h, const string image1,const string image2,const ENUM_BASE_CORNER corner,const ENUM_ANCHOR_POINT anchor, const bool state) { return this.m_graph_objects.CreateBitmapLabel(chart_id,name,subwindow,x,y,w,h,image1,image2,corner,anchor,state); } bool CreateBitmapLabel(const string name,const int subwindow,const int x,const int y,const int w,const int h, const string image1,const string image2,const ENUM_BASE_CORNER corner,const ENUM_ANCHOR_POINT anchor, const bool state) { return this.CreateBitmapLabel(::ChartID(),name,subwindow,x,y,w,h,image1,image2,corner,anchor,state); } //--- Create the "Input field" graphical object bool CreateEditField(const long chart_id,const string name,const int subwindow,const int x,const int y,const int w,const int h, const int font_size,const ENUM_BASE_CORNER corner,const ENUM_ALIGN_MODE align,const bool readonly) { return this.m_graph_objects.CreateEditField(chart_id,name,subwindow,x,y,w,h,font_size,corner,align,readonly); } bool CreateEditField(const string name,const int subwindow,const int x,const int y,const int w,const int h, const int font_size,const ENUM_BASE_CORNER corner,const ENUM_ALIGN_MODE align,const bool readonly) { return this.CreateEditField(::ChartID(),name,subwindow,x,y,w,h,font_size,corner,align,readonly); } //--- Create the "Economic calendar event" graphical object bool CreateCalendarEvent(const long chart_id,const string name,const int subwindow,const datetime time) { return this.m_graph_objects.CreateCalendarEvent(chart_id,name,subwindow,time); } bool CreateCalendarEvent(const string name,const int subwindow,const datetime time) { return this.CreateCalendarEvent(::ChartID(),name,subwindow,time); } //--- Create the "Rectangular label" graphical object bool CreateRectangleLabel(const long chart_id,const string name,const int subwindow,const int x,const int y,const int w,const int h, const ENUM_BASE_CORNER corner,const ENUM_BORDER_TYPE border) { return this.m_graph_objects.CreateRectangleLabel(chart_id,name,subwindow,x,y,w,h,corner,border); } bool CreateRectangleLabel(const string name,const int subwindow,const int x,const int y,const int w,const int h, const ENUM_BASE_CORNER corner,const ENUM_BORDER_TYPE border) { return this.CreateRectangleLabel(::ChartID(),name,subwindow,x,y,w,h,corner,border); } //--- Constructor/destructor CEngine(); ~CEngine();
Hoje, essas são todas as melhorias necessárias para criar a funcionalidade básica de rastreamento de eventos de objetos gráficos.
Teste
Para realizar o teste, vamos pegar o Expert Advisor do artigo anterior e
vamos salvá-lo na nova pasta \MQL5\Experts\TestDoEasy\Part90\ com o nome TestDoEasyPart90.mq5.
Como vamos testar? No último artigo, quando clicamos no gráfico enquanto seguramos a tecla Ctrl, criamos uma linha vertical. Agora também vamos criá-lo, mas em todos os gráficos abertos no terminal.
No manipulador OnChartEvent(), no bloco de código de manipulação de evento de clique no gráfico, adicionamos o código para preencher a matriz com os identificadores de todos os gráficos abertos e, em um loop pela matriz resultante em cada um dos gráficos, criamos uma linha vertical:
   if(id==CHARTEVENT_CLICK)
     {
      if(!IsCtrlKeyPressed())
         return;
      datetime time=0;
      double price=0;
      int sw=0;
      if(ChartXYToTimePrice(ChartID(),(int)lparam,(int)dparam,sw,time,price))
        {
         long array[];
         engine.GraphGetArrayChartsID(array);
         for(int i=0;i<ArraySize(array);i++)
            engine.CreateLineVertical(array[i],"LineVertical",0,time);
        }
     }
   engine.GetGraphicObjCollection().OnChartEvent(id,lparam,dparam,sparam);

  }
//+------------------------------------------------------------------+
Vamos compilar o Expert Advisor e executá-lo no gráfico, depois de abrir outro gráfico e colocá-lo horizontalmente. Quando clicamos em um gráfico com Expert Advisor, em cada um dos gráficos será criada uma linha vertical. Agora vamos alterar suas propriedades e ver como as mensagens sobre os eventos recebidos são exibidas no log:
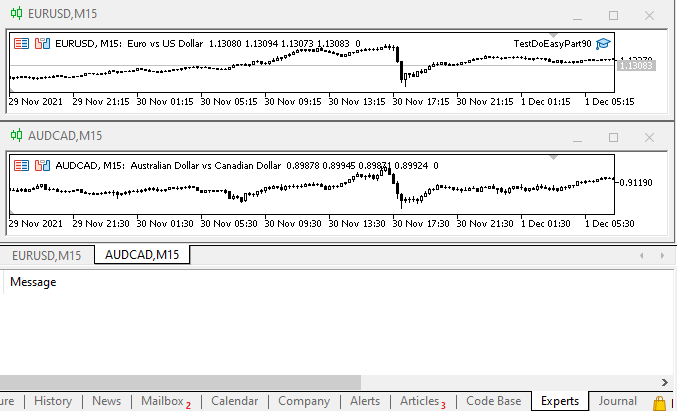
Como se pode ver, as mensagens de eventos do objeto são enviadas para o log. Ao criar objetos programaticamente, o evento de criação de objeto não é criado porque o desenvolvedor já sabe em que momento um objeto gráfico é criado programaticamente. Portanto, considero desnecessário duplicar este fato enviando o evento.
Obviamente, simplesmente registrar mensagens generalizadas sobre o evento que ocorreu não é suficiente para o processamento do mesmo. Mas estas são apenas mensagens sobre eventos básicos, cujos parâmetros contêm todas as informações sobre o evento, que definiremos mais adiante.
O que vem agora?
No próximo artigo vamos continuar trabalhar em eventos de objetos gráfico e criar o processamento de todos os eventos recebidos.
*Artigos desta série:
<a8>Gráficos na biblioteca DoEasy (Parte 86): coleção de objetos gráficos, controlamos a modificação de propriedades
Gráficos na biblioteca DoEasy (Parte 87): coleção de objetos gráficos, controlamos a modificação de propriedades de objetos em todos os gráficos abertos>
/> Gráficos na biblioteca DoEasy (Parte 88): coleção de objetos gráficos, matriz dinâmica bidimensional para armazenar propriedades de objetos que mudam dinamicamente
Gráficos na biblioteca DoEasy (Parte 89): programando objetos gráficos padrão. Funcionalidade básica
Traduzido do russo pela MetaQuotes Ltd.
Artigo original: https://www.mql5.com/ru/articles/10139
Aviso: Todos os direitos sobre esses materiais pertencem à MetaQuotes Ltd. É proibida a reimpressão total ou parcial.
Esse artigo foi escrito por um usuário do site e reflete seu ponto de vista pessoal. A MetaQuotes Ltd. não se responsabiliza pela precisão das informações apresentadas nem pelas possíveis consequências decorrentes do uso das soluções, estratégias ou recomendações descritas.

 Matrizes e vetores em MQL5
 Indicadores múltiplos em um gráfico (Parte 05): Transformando o MetaTrader 5 em um sistema RAD (I)
 Usando o AutoIt com MQL5
- Aplicativos de negociação gratuitos
- 8 000+ sinais para cópia
- Notícias econômicas para análise dos mercados financeiros
Você concorda com a política do site e com os termos de uso