
Grafiken in der DoEasy-Bibliothek (Teil 90): Standard-Ereignisse für grafische Objekte. grundlegende Funktionsweise

Inhalt
- Konzept
- Verbesserung der Klassenbibliothek
- Standardereignisse für grafische Objekte
- Test
- Was kommt als Nächstes?
Konzept
Bei der Arbeit mit grafischen Objekten, die vom Client-Terminal bereitgestellt werden, kann es erforderlich sein, einige Eigenschaftswerte dieser Objekte programmatisch zu definieren. Das Programm kann den Wert einer Linie eines grafischen Objekts verfolgen und den eingebetteten Algorithmus ausführen, z. B. wenn die Linie vom Preis überschritten wird. Die Linie kann verschoben werden, wenn das grafische Objekt vom Terminalnutzer bewegt wird. Entsprechend sollte das Programm darauf reagieren. Aber das Programm muss entweder wissen, dass sich der Wert der verfolgten Linie geändert hat, oder es muss ständig die Eigenschaftswerte des grafischen Objekts überprüfen, was eine ressourcenintensive Aktion ist. Diese Tatsache wird in der Hilfe deutlich gemacht.
Es ist viel bequemer, über eine Funktion zu verfügen, die jede Änderung an einem grafischen Objekt meldet. Eine solche Funktionsweise ist im Terminal in Form der Funktion OnChartEvent() vorhanden. Ergänzen wir dessen Toolkit um einige Ereignisse, die in unserer Bibliothek verdeutlichen, was genau mit einem grafischen Objekt passiert ist. Ein bibliotheksgesteuertes Programm wird in der Lage sein, genau zu wissen, was mit einem grafischen Objekt passiert ist und welche Eigenschaft geändert wurde.
Unterteilen wir die Entwicklung der Funktionsweise in zwei Phasen: Zunächst erstellen wir allgemeine Ereignisse, die mit grafischen Objekten auftreten können. Als Nächstes fügen wir die Funktion hinzu, die klärt, was genau mit dem Objekt passiert ist, und die es den Benutzern ermöglicht, dies schnell programmatisch herauszufinden. Fast alles ist bereit für die Erstellung einer solchen Funktionsweise. Alles, was wir tun müssen, ist, die Bibliotheksklassen geringfügig zu verbessern und einen Platz im Event-Handler zu schaffen, in dem Ereignisse, die bei grafischen Objekten auftreten, behandelt werden.
Die grundlegenden Ereignisse für grafische Objekte sind wie folgt definiert:
- Erstellen eines neuen grafischen Objekts,
- Ändern der Eigenschaften eines grafischen Objekts,
- Umbenennen eines grafischen Objekts,
- Entfernen eines grafischen Objekts,
- Entfernen eines grafischen Objekts zusammen mit dem Chartfenster.
Dies sind die Ereignisse, die ich in diesem Artikel implementieren werde. Sie sollen an die Ereignisfunktion OnChartEvent() gesendet werden. Im nächsten Artikel werde ich die Behandlung der einzelnen Ereignisse implementieren, damit wir genau wissen, welche Eigenschaften des grafischen Objekts geändert wurden.
Beachten Sie, dass das Umbenennen eines grafischen Objekts wiederum eine Änderung der Eigenschaft Name nach sich zieht. Ich habe mich jedoch entschieden, dies in ein separates Ereignis zu packen, um die Handhabung zu vereinfachen, da die Änderung des Namens mehrere Ereignisse hintereinander auslöst — das Entfernen eines grafischen Objekts, das Erstellen eines neuen und die Änderung seiner Eigenschaften. Alle diese Zustände wurden bereits in der Bibliothek behandelt. Das Umbenennungsereignis wird korrekt berechnet. Daher werden wir es zur weiteren programmatischen Behandlung des Ereignisses senden.
So können wir beim Löschen eines grafischen Objekts derzeit genau feststellen, welches Objekt gelöscht wurde, und dessen Namen melden. Beim Löschen eines Chartfensters, das grafische Objekte enthielt, können wir jedoch nach wie vor nur die Anzahl der grafischen Objekte ermitteln, die sich auf dem gelöschten Chart befinden. Im Moment informieren uns diese beiden Ereignisse nur über die Löschung von grafischen Objekten. Vielleicht werde ich in Zukunft die Notwendigkeit in Betracht ziehen, die Eigenschaften der gelöschten Objekte zu speichern. Im Moment sehe ich keine dringende Notwendigkeit, diese Funktion zu implementieren.
Verbesserung der Klassenbibliothek
Um die Zuweisung von grafischen Objekten zu verfolgen, müssen wir einen Handler für ein Klick-Ereignis für grafische Objekte hinzufügen. Ein Doppelklick auf ein nicht ausgewähltes grafisches Objekt wählt dieses zur Bearbeitung aus, während ein Doppelklick auf ein ausgewähltes Objekt dieses wieder abwählt. solches Objektereignis auf dem aktuellen Chart zu Um ein solches Objektereignis auf dem aktuellen Chart zu behandeln, müssen wir der Ereignisbehandlung eine neue Ereignis-ID hinzufügen. Um ein solches Ereignis auf anderen Charts zu behandeln, müssen wir den Ereignissteuerungsindikator verbessern, der automatisch auf jedes neu geöffnete Chart-Fenster gesetzt wird.
Wir öffnen die Indikatordatei \MQL5\Indikatoren\DoEasy\EventControl.mq5 und fügen eine neue Ereignis-ID hinzu, die an das Kontrollprogramm Chart gesendet wird:
//+------------------------------------------------------------------+
//|                                                 EventControl.mq5 |
//|                                  Copyright 2021, MetaQuotes Ltd. |
//|                             https://mql5.com/en/users/artmedia70 |
//+------------------------------------------------------------------+
#property copyright "Copyright 2021, MetaQuotes Ltd."
#property link      "https://mql5.com/en/users/artmedia70"
#property version   "1.00"
#property indicator_chart_window
#property indicator_plots 0
//--- input parameters
input long     InpChartSRC = 0;
input long     InpChartDST = 0;
//+------------------------------------------------------------------+
//| Custom indicator initialization function                         |
//+------------------------------------------------------------------+
int OnInit()
  {
//--- indicator shortname
   IndicatorSetString(INDICATOR_SHORTNAME,"EventSend_From#"+(string)InpChartSRC+"_To#"+(string)InpChartDST);
//---
   return(INIT_SUCCEEDED);
  }
//+------------------------------------------------------------------+
//| Custom indicator iteration function                              |
//+------------------------------------------------------------------+
int OnCalculate(const int rates_total,
                const int prev_calculated,
                const datetime &time[],
                const double &open[],
                const double &high[],
                const double &low[],
                const double &close[],
                const long &tick_volume[],
                const long &volume[],
                const int &spread[])
  {
   return rates_total;
  }
//+------------------------------------------------------------------+
//| ChartEvent function                                              |
//+------------------------------------------------------------------+
void OnChartEvent(const int id,
                  const long &lparam,
                  const double &dparam,
                  const string &sparam)
  {
//---
   if(id==CHARTEVENT_OBJECT_CHANGE || id==CHARTEVENT_OBJECT_DRAG || id==CHARTEVENT_OBJECT_CLICK)
     {
      EventChartCustom(InpChartDST,(ushort)id,InpChartSRC,dparam,sparam);
     }
  }
//+------------------------------------------------------------------+
In \MQL5\Include\DoEasy\Data.mqh, fügen wir die neue Nachrichtenindizes hinzu:
//--- CGraphElementsCollection
   MSG_GRAPH_OBJ_FAILED_GET_ADDED_OBJ_LIST,           // Failed to get the list of newly added objects
   MSG_GRAPH_OBJ_FAILED_DETACH_OBJ_FROM_LIST,         // Failed to remove a graphical object from the list

   MSG_GRAPH_OBJ_CREATE_EVN_CTRL_INDICATOR,           // Indicator for controlling and sending events created
   MSG_GRAPH_OBJ_FAILED_CREATE_EVN_CTRL_INDICATOR,    // Failed to create the indicator for controlling and sending events
   MSG_GRAPH_OBJ_ADDED_EVN_CTRL_INDICATOR,            // Indicator for controlling and sending events successfully added to the chart
   MSG_GRAPH_OBJ_FAILED_ADD_EVN_CTRL_INDICATOR,       // Failed to add the indicator for controlling and sending events
   MSG_GRAPH_OBJ_CLOSED_CHARTS,                       // Chart windows closed:
   MSG_GRAPH_OBJ_OBJECTS_ON_CLOSED_CHARTS,            // Objects removed together with charts:
   MSG_GRAPH_OBJ_FAILED_CREATE_EVN_OBJ,               // Failed to create the event object for a graphical object
   MSG_GRAPH_OBJ_FAILED_ADD_EVN_OBJ,                  // Failed to add the event object to the list

   MSG_GRAPH_OBJ_EVN_GRAPH_OBJ_CREATE,                // New graphical object created
   MSG_GRAPH_OBJ_EVN_GRAPH_OBJ_CHANGE,                // Changed the graphical object property
   MSG_GRAPH_OBJ_EVN_GRAPH_OBJ_RENAME,                // Graphical object renamed
   MSG_GRAPH_OBJ_EVN_GRAPH_OBJ_DELETE,                // Graphical object removed
   MSG_GRAPH_OBJ_EVN_GRAPH_OBJ_DEL_CHART,             // Graphical object removed together with the chart

  };
//+------------------------------------------------------------------+
und die Nachrichtentexte entsprechend den neu hinzugefügten Indizes:
//--- CGraphElementsCollection
   {"Не удалось получить список вновь добавленных объектов","Failed to get the list of newly added objects"},
   {"Не удалось изъять графический объект из списка","Failed to detach graphic object from the list"},

   {"Создан индикатор контроля и отправки событий","An indicator for monitoring and sending events has been created"},
   {"Не удалось создать индикатор контроля и отправки событий","Failed to create indicator for monitoring and sending events"},
   {"Индикатор контроля и отправки событий успешно добавлен на график ","The indicator for monitoring and sending events has been successfully added to the chart"},
   {"Не удалось добавить индикатор контроля и отправки событий на график ","Failed to add the indicator of monitoring and sending events to the chart "},
   {"Закрыто окон графиков: ","Closed chart windows: "},
   {"С ними удалено объектов: ","Objects removed with them: "},
   {"Не удалось создать объект-событие для графического объекта","Failed to create event object for graphic object"},
   {"Не удалось добавить объект-событие в список","Failed to add event object to list"},

   {"Создан новый графический объект","New graphic object created"},
   {"Изменено свойство графического объекта","Changed graphic object property"},
   {"Графический объект переименован","Graphic object renamed"},
   {"Графический объект удалён","Graphic object deleted"},
   {"Графический объект удалён вместе с графиком","The graphic object has been removed along with the chart"},

  };
//+---------------------------------------------------------------------+
Lassen Sie uns die Korrekturen in \MQL5\Include\DoEasy\Defines.mqh vornehmen.
Wir entfernen das Objektverschiebungsereignis aus der Liste der möglichen grafischen Objektereignisse, da diese Eigenschaftsänderung bereits in der Enumeration der grafischen Objektereignisse vorhanden ist:
//+------------------------------------------------------------------+
//| List of possible graphical object events                         |
//+------------------------------------------------------------------+
enum ENUM_GRAPH_OBJ_EVENT
  {
   GRAPH_OBJ_EVENT_NO_EVENT = CHART_OBJ_EVENTS_NEXT_CODE,// No event
   GRAPH_OBJ_EVENT_CREATE,                            // "Creating a new graphical object" event
   GRAPH_OBJ_EVENT_CHANGE,                            // "Changing graphical object properties" event
   GRAPH_OBJ_EVENT_MOVE,                              // "Moving graphical object" event
   GRAPH_OBJ_EVENT_RENAME,                            // "Renaming graphical object" event
   GRAPH_OBJ_EVENT_DELETE,                            // "Removing graphical object" event
  };
Wir fügen eine neue Konstante zur Liste hinzu für den Fall, dass ein grafisches Objekt zusammen mit einem Chart entfernt wird:
//+------------------------------------------------------------------+
//| Data for handling graphical elements                             |
//+------------------------------------------------------------------+
//+------------------------------------------------------------------+
//| List of possible graphical object events                         |
//+------------------------------------------------------------------+
enum ENUM_GRAPH_OBJ_EVENT
  {
   GRAPH_OBJ_EVENT_NO_EVENT = CHART_OBJ_EVENTS_NEXT_CODE,// No event
   GRAPH_OBJ_EVENT_CREATE,                            // "Creating a new graphical object" event
   GRAPH_OBJ_EVENT_CHANGE,                            // "Changing graphical object properties" event
   GRAPH_OBJ_EVENT_RENAME,                            // "Renaming graphical object" event
   GRAPH_OBJ_EVENT_DELETE,                            // "Removing graphical object" event
   GRAPH_OBJ_EVENT_DEL_CHART,                         // "Removing a graphical object together with the chart window" event
  };
#define GRAPH_OBJ_EVENTS_NEXT_CODE  (GRAPH_OBJ_EVENT_DEL_CHART+1) // The code of the next event after the last graphical object event code
//+------------------------------------------------------------------+
Der Code des nächsten Ereignisses nach den Codes der Ereignisse des grafischen Objekts wird nun aus dem letzten zur Enumeration hinzugefügten Wert berechnet.
Bei der Erstellung eines beliebigen grafischen Standardobjekts werden im Konstruktor Daten aus dem physischen Objekt auf dem Chart gelesen und in die Eigenschaften des Klassenobjekts geschrieben. Einige der Eigenschaften des grafischen Objekts werden für alle grafischen Objekte gemeinsam festgelegt. Sie sind in jedem Objekt zu finden und werden in der Basisklasse aller grafischen Bibliotheksobjekte festgelegt.
Der Algorithmus sieht wie folgt aus: Die Parameter werden zunächst mit den Standardfunktionen von ObjectGetXXX aus einem grafischen Objekt gelesen (Integer, Double und String). Wenn die Daten erfolgreich empfangen wurden, werden diese Parameter zunächst in der Eigenschaft des grafischen Basisobjekts der Klasse CGBaseObj gesetzt. Danach werden sie in den Eigenschaften seiner Nachkommen gesetzt. Im Falle von grafischen Standardobjekten ist dies die Klasse CGStdGraphObj.
Hier stehen wir vor einem gewissen Konflikt. Wir haben die Methoden zum Setzen von Parametern für grafische Objekte. Diese Methoden sollen den ihnen übergebenen Eigenschaftswert auf das grafische Objekt selbst und auf die entsprechende Klassenobjekteigenschaft setzen — für den Fall, dass der Parameter für das grafische Objekt mit den ObjectSetXXX-Funktionen (Integer, Double und String) erfolgreich gesetzt wurde. Aber manchmal müssen wir einfach einen bereits bekannten Wert eines Parameters eines grafischen Objekts auf eine Klasseneigenschaft setzen. Um dies zu erreichen, müssen wir diesen Wert nicht noch einmal auslesen oder ihn dem grafischen Objekt zuweisen. Stattdessen sollten wir seinen Wert einfach der Klassenvariablen zuweisen. Die Set-Methoden des grafischen Basisobjekts der Bibliothek setzen den Wert zunächst auf die Parameter des grafischen Objekts und schreiben sie anschließend in die Klassenvariablen. Um das Setzen der bereits bekannten Eigenschaft des grafischen Objekts zu vermeiden und sie stattdessen in die Klassenvariable zu setzen, fügen wir die bool-Variable only_prop zu solchen Methoden hinzu. Die Variable zeigt an, dass der Wert entweder nur auf die Variablenwerte, auf die grafischen Objektparameter oder auf die Klassenobjekteigenschaften gesetzt werden muss. Wenn die Eingabe true ist, werden die Parameter zunächst nur in den Klassenvariablen gesetzt. Andernfalls wird der Wert zuerst auf das grafische Objekt gesetzt. An zweiter Stelle stehen die Klassenvariablen.
In der Basisobjektklasse aller grafischen Objekte der Bibliothek \MQL5\Include\DoEasy\Objects\Graph\GBaseObj.mqh fügen wir die Variable zu solchen Methoden hinzu und ändern die Methodenlogik:
//--- Set the "Background object" flag
   bool              SetFlagBack(const bool flag,const bool only_prop)
                       {
                        ::ResetLastError();
                        if((!only_prop && ::ObjectSetInteger(this.m_chart_id,this.m_name,OBJPROP_BACK,flag)) || only_prop)
                          {
                           this.m_back=flag;
                           return true;
                          }
                        else
                           CMessage::ToLog(DFUN,::GetLastError(),true);
                        return false;
                       }
Hier, wenn die Variable false und die Eigenschaft für das grafische Objekt gesetzt ist, oder wenn die Variable true ist, schreiben wir den an die Methode übergebenen Wert in die Klassenvariable.
Alle Klassenmethoden werden auf diese Weise geändert:
//--- Set the "Background object" flag
   bool              SetFlagBack(const bool flag,const bool only_prop)
                       {
                        ::ResetLastError();
                        if((!only_prop && ::ObjectSetInteger(this.m_chart_id,this.m_name,OBJPROP_BACK,flag)) || only_prop)
                          {
                           this.m_back=flag;
                           return true;
                          }
                        else
                           CMessage::ToLog(DFUN,::GetLastError(),true);
                        return false;
                       }
//--- Set the "Object selection" flag
   bool              SetFlagSelected(const bool flag,const bool only_prop)
                       {
                        ::ResetLastError();
                        if((!only_prop && ::ObjectSetInteger(this.m_chart_id,this.m_name,OBJPROP_SELECTED,flag)) || only_prop)
                          {
                           this.m_selected=flag;
                           return true;
                          }
                        else
                           CMessage::ToLog(DFUN,::GetLastError(),true);
                        return false;
                       }
//--- Set the "Object selection" flag
   bool              SetFlagSelectable(const bool flag,const bool only_prop)
                       {
                        ::ResetLastError();
                        if((!only_prop && ::ObjectSetInteger(this.m_chart_id,this.m_name,OBJPROP_SELECTABLE,flag)) || only_prop)
                          {
                           this.m_selectable=flag;
                           return true;
                          }
                        else
                           CMessage::ToLog(DFUN,::GetLastError(),true);
                        return false;
                       }
//--- Set the "Disable displaying the name of a graphical object in the terminal object list" flag
   bool              SetFlagHidden(const bool flag,const bool only_prop)
                       {
                        ::ResetLastError();
                        if((!only_prop && ::ObjectSetInteger(this.m_chart_id,this.m_name,OBJPROP_SELECTABLE,flag)) || only_prop)
                          {
                           this.m_hidden=flag;
                           return true;
                          }
                        else
                           CMessage::ToLog(DFUN,::GetLastError(),true);
                        return false;
                       }
//--- Set the priority of a graphical object for receiving the event of clicking on a chart
   bool              SetZorder(const long value,const bool only_prop)
                       {
                        ::ResetLastError();
                        if((!only_prop && ::ObjectSetInteger(this.m_chart_id,this.m_name,OBJPROP_ZORDER,value)) || only_prop)
                          {
                           this.m_zorder=value;
                           return true;
                          }
                        else
                           CMessage::ToLog(DFUN,::GetLastError(),true);
                        return false;
                       }
//--- Set object visibility on all timeframes
   bool              SetVisible(const bool flag,const bool only_prop)
                       {
                        long value=(flag ? OBJ_ALL_PERIODS : OBJ_NO_PERIODS);
                        ::ResetLastError();
                        if((!only_prop && ::ObjectSetInteger(this.m_chart_id,this.m_name,OBJPROP_TIMEFRAMES,value)) || only_prop)
                          {
                           this.m_visible=flag;
                           return true;
                          }
                        else
                           CMessage::ToLog(DFUN,::GetLastError(),true);
                        return false;
                       }
//--- Set visibility flags on timeframes specified as flags
   bool              SetVisibleOnTimeframes(const int flags,const bool only_prop)
                       {
                        ::ResetLastError();
                        if((!only_prop && ::ObjectSetInteger(this.m_chart_id,this.m_name,OBJPROP_TIMEFRAMES,flags)) || only_prop)
                          {
                           this.m_timeframes_visible=flags;
                           return true;
                          }
                        else
                           CMessage::ToLog(DFUN,::GetLastError(),true);
                        return false;
                       }
//--- Add the visibility flag on a specified timeframe
   bool              SetVisibleOnTimeframe(const ENUM_TIMEFRAMES timeframe,const bool only_prop)
                       {
                        int flags=this.m_timeframes_visible;
                        switch(timeframe)
                          {
                           case PERIOD_M1    : flags |= OBJ_PERIOD_M1;  break;
                           case PERIOD_M2    : flags |= OBJ_PERIOD_M2;  break;
                           case PERIOD_M3    : flags |= OBJ_PERIOD_M3;  break;
                           case PERIOD_M4    : flags |= OBJ_PERIOD_M4;  break;
                           case PERIOD_M5    : flags |= OBJ_PERIOD_M5;  break;
                           case PERIOD_M6    : flags |= OBJ_PERIOD_M6;  break;
                           case PERIOD_M10   : flags |= OBJ_PERIOD_M10; break;
                           case PERIOD_M12   : flags |= OBJ_PERIOD_M12; break;
                           case PERIOD_M15   : flags |= OBJ_PERIOD_M15; break;
                           case PERIOD_M20   : flags |= OBJ_PERIOD_M20; break;
                           case PERIOD_M30   : flags |= OBJ_PERIOD_M30; break;
                           case PERIOD_H1    : flags |= OBJ_PERIOD_H1;  break;
                           case PERIOD_H2    : flags |= OBJ_PERIOD_H2;  break;
                           case PERIOD_H3    : flags |= OBJ_PERIOD_H3;  break;
                           case PERIOD_H4    : flags |= OBJ_PERIOD_H4;  break;
                           case PERIOD_H6    : flags |= OBJ_PERIOD_H6;  break;
                           case PERIOD_H8    : flags |= OBJ_PERIOD_H8;  break;
                           case PERIOD_H12   : flags |= OBJ_PERIOD_H12; break;
                           case PERIOD_D1    : flags |= OBJ_PERIOD_D1;  break;
                           case PERIOD_W1    : flags |= OBJ_PERIOD_W1;  break;
                           case PERIOD_MN1   : flags |= OBJ_PERIOD_MN1; break;
                           default           : return true;
                          }
                        ::ResetLastError();
                        if((!only_prop && ::ObjectSetInteger(this.m_chart_id,this.m_name,OBJPROP_TIMEFRAMES,flags)) || only_prop)
                          {
                           this.m_timeframes_visible=flags;
                           return true;
                          }
                        else
                           CMessage::ToLog(DFUN,::GetLastError(),true);
                        return false;
                       }
Jetzt können wir wählen, wie die Eigenschaft geschrieben werden soll — entweder wir setzen eine neue Eigenschaft für das grafische Objekt und die Klassenvariable (so dass sie einem neu gesetzten Wert entspricht), oder wir setzen den bereits bekannten Parameterwert des grafischen Objekts für die Klassenvariable (wie es im Klassenkonstruktor bei der Erstellung eines neuen grafischen Objekts geschieht). Auf diese Weise lässt sich ein übermäßiger Zugriff auf die aufgrund ihrer Synchronität recht langsamen Funktionen zur Behandlung grafischer Objekte vermeiden.
In \MQL5\Include\DoEasy\Objects\Graph\GCnvElement.mqh, korrigieren wir den Aufruf von verbesserten Methoden:
//--- Return (1) the element ID, (2) element index in the list, (3) flag of the form shadow presence and (4) the chart background color
   int               ID(void)                            const { return (int)this.GetProperty(CANV_ELEMENT_PROP_ID);                   }
   int               Number(void)                        const { return (int)this.GetProperty(CANV_ELEMENT_PROP_NUM);                  }
   bool              IsShadow(void)                      const { return this.m_shadow;                                                 }
   color             ChartColorBackground(void)          const { return this.m_chart_color_bg;                                         }
//--- Set the object above all
   void              BringToTop(void)                          { CGBaseObj::SetVisible(false,false); CGBaseObj::SetVisible(true,false);}
//--- (1) Show and (2) hide the element
   virtual void      Show(void)                                { CGBaseObj::SetVisible(true,false);                                    }
   virtual void      Hide(void)                                { CGBaseObj::SetVisible(false,false);                                   }

//+------------------------------------------------------------------+
//| The methods of receiving raster data                             |
//+------------------------------------------------------------------+
In \MQL5\Include\DoEasy\Objects\Graph\Form.mqh, korrigieren wir zwei Methoden:
//+------------------------------------------------------------------+
//| Create the shadow object                                         |
//+------------------------------------------------------------------+
void CForm::CreateShadowObj(const color colour,const uchar opacity)
  {
//--- If the shadow flag is disabled or the shadow object already exists, exit
   if(!this.m_shadow || this.m_shadow_obj!=NULL)
      return;

//--- Calculate the shadow object coordinates according to the offset from the top and left
   int x=this.CoordX()-OUTER_AREA_SIZE;
   int y=this.CoordY()-OUTER_AREA_SIZE;
//--- Calculate the width and height in accordance with the top, bottom, left and right offsets
   int w=this.Width()+OUTER_AREA_SIZE*2;
   int h=this.Height()+OUTER_AREA_SIZE*2;
//--- Create a new shadow object and set the pointer to it in the variable
   this.m_shadow_obj=new CShadowObj(this.ChartID(),this.SubWindow(),this.CreateNameDependentObject("Shadow"),x,y,w,h);
   if(this.m_shadow_obj==NULL)
     {
      ::Print(DFUN,CMessage::Text(MSG_FORM_OBJECT_ERR_FAILED_CREATE_SHADOW_OBJ));
      return;
     }
//--- Set the properties for the created shadow object
   this.m_shadow_obj.SetID(this.ID());
   this.m_shadow_obj.SetNumber(-1);
   this.m_shadow_obj.SetOpacityShadow(opacity);
   this.m_shadow_obj.SetColorShadow(colour);
   this.m_shadow_obj.SetMovable(true);
   this.m_shadow_obj.SetActive(false);
   this.m_shadow_obj.SetVisible(false,false);
//--- Move the form object to the foreground
   this.BringToTop();
  }
//+------------------------------------------------------------------+
//| Draw the shadow                                                  |
//+------------------------------------------------------------------+
void CForm::DrawShadow(const int shift_x,const int shift_y,const color colour,const uchar opacity=127,const uchar blur=4)
  {
//--- If the shadow flag is disabled, exit
   if(!this.m_shadow)
      return;
//--- If there is no shadow object, create it
   if(this.m_shadow_obj==NULL)
      this.CreateShadowObj(colour,opacity);
//--- If the shadow object exists, draw the shadow on it,
//--- set the shadow object visibility flag and
//--- move the form object to the foreground
   if(this.m_shadow_obj!=NULL)
     {
      this.m_shadow_obj.DrawShadow(shift_x,shift_y,blur);
      this.m_shadow_obj.SetVisible(true,false);
      this.BringToTop();
     }
  }
//+------------------------------------------------------------------+
In der Standardklasse für grafische Objekte sollten alle Methoden, die Eigenschaften grafischer Objekte setzen, einen Rückgabewert vom Typ boolean haben (derzeit geben die Methoden keinen Wert zurück und haben den Typ void). Dies ist notwendig, damit die entsprechenden Methoden der Elternklasse, die ebenfalls den Rückgabetyp bool haben, in der Kindklasse neu zugewiesen werden. In diesem Fall können wir Verwirrung beim Schreiben des Codes vermeiden, da der Hinweis nicht zwei Methoden vom Typ bool aus dem Basisobjekt und vom Typ void aus seinem Nachkommen enthält.
Betrachten wir dies am Beispiel der Methode zum Setzen des Indexes eines Unterfenster:
//--- Chart subwindow index
   int               SubWindow(void)               const { return (int)this.GetProperty(GRAPH_OBJ_PROP_WND_NUM,0);                        }
   bool              SetSubWindow(void)
                       {
                        if(!CGBaseObj::SetSubwindow(CGBaseObj::ChartID(),CGBaseObj::Name()))
                           return false;
                        this.SetProperty(GRAPH_OBJ_PROP_WND_NUM,0,CGBaseObj::SubWindow());
                        return true;
                       }
Da ein Subfenster-Index über eine Chart-ID und einen Objektnamen gesucht wird, werden die bereits im Basisobjekt gesetzte Chart-ID und der grafische Objektname einfach an die Basisklassenmethode zum Setzen des Subfenster-Indexes übergeben. Wenn der Wert im Basisobjekt nicht gesetzt werden konnte, wird false zurückgegeben, andernfalls wird der im Basisobjekt neu gesetzte Wert auf die Objekteigenschaft gesetzt und true zurückgegeben.
Betrachten wir dies am Beispiel der Methode zum Einstellen der Objektsichtbarkeit auf allen Zeitskalen:
//--- Object visibility on timeframes
   bool              Visible(void)                 const { return (bool)this.GetProperty(GRAPH_OBJ_PROP_TIMEFRAMES,0);                    }
   bool              SetFlagVisible(const bool flag,const bool only_prop)
                       {
                        if(!CGBaseObj::SetVisible(flag,only_prop))
                           return false;
                        this.SetProperty(GRAPH_OBJ_PROP_TIMEFRAMES,0,flag);
                        return true;
                       }
Hier erhält die Methode einen neuen Parameter, den ich zuvor hinzugefügt habe, um die Werte anzugeben, auf die der Parameter gesetzt werden soll — nur die Objekteigenschaft oder die grafischen Objektparameter und die Klasseneigenschaft. Als Nächstes setzen wir diese Eigenschaften auf das Basisobjekt. Wenn das fehlgeschlagen ist, geben wir falsezurück.
Ansonsten schreiben wir den Wert in die Klassenobjekt-Eigenschaft und gebe true zurück.
Die übrigen Methoden sind identisch mit den oben vorgestellten geändert.
//--- Background object bool Back(void) const { return (bool)this.GetProperty(GRAPH_OBJ_PROP_BACK,0); } bool SetFlagBack(const bool flag,const bool only_prop) { if(!CGBaseObj::SetFlagBack(flag,only_prop)) return false; this.SetProperty(GRAPH_OBJ_PROP_BACK,0,flag); return true; } //--- Priority of a graphical object for receiving the event of clicking on a chart long Zorder(void) const { return this.GetProperty(GRAPH_OBJ_PROP_ZORDER,0); } bool SetZorder(const long value,const bool only_prop) { if(!CGBaseObj::SetZorder(value,only_prop)) return false; this.SetProperty(GRAPH_OBJ_PROP_ZORDER,0,value); return true; } //--- Disable displaying the name of a graphical object in the terminal object list bool Hidden(void) const { return (bool)this.GetProperty(GRAPH_OBJ_PROP_HIDDEN,0); } bool SetFlagHidden(const bool flag,const bool only_prop) { if(!CGBaseObj::SetFlagHidden(flag,only_prop)) return false; this.SetProperty(GRAPH_OBJ_PROP_HIDDEN,0,flag); return true; } //--- Object selection bool Selected(void) const { return (bool)this.GetProperty(GRAPH_OBJ_PROP_SELECTED,0); } bool SetFlagSelected(const bool flag,const bool only_prop) { if(!CGBaseObj::SetFlagSelected(flag,only_prop)) return false; this.SetProperty(GRAPH_OBJ_PROP_SELECTED,0,flag); return true; } //--- Object availability bool Selectable(void) const { return (bool)this.GetProperty(GRAPH_OBJ_PROP_SELECTABLE,0); } bool SetFlagSelectable(const bool flag,const bool only_prop) { if(!CGBaseObj::SetFlagSelectable(flag,only_prop)) return false; this.SetProperty(GRAPH_OBJ_PROP_SELECTABLE,0,flag); return true; } //--- Time coordinate datetime Time(const int modifier) const { return (datetime)this.GetProperty(GRAPH_OBJ_PROP_TIME,modifier); } bool SetTime(const datetime time,const int modifier) { if(!::ObjectSetInteger(CGBaseObj::ChartID(),CGBaseObj::Name(),OBJPROP_TIME,modifier,time)) return false; this.SetProperty(GRAPH_OBJ_PROP_TIME,modifier,time); return true; } //--- Color color Color(void) const { return (color)this.GetProperty(GRAPH_OBJ_PROP_COLOR,0); } bool SetColor(const color colour) { if(!::ObjectSetInteger(CGBaseObj::ChartID(),CGBaseObj::Name(),OBJPROP_COLOR,colour)) return false; this.SetProperty(GRAPH_OBJ_PROP_COLOR,0,colour); return true; } //--- Style ENUM_LINE_STYLE Style(void) const { return (ENUM_LINE_STYLE)this.GetProperty(GRAPH_OBJ_PROP_STYLE,0); } bool SetStyle(const ENUM_LINE_STYLE style) { if(!::ObjectSetInteger(CGBaseObj::ChartID(),CGBaseObj::Name(),OBJPROP_STYLE,style)) return false; this.SetProperty(GRAPH_OBJ_PROP_STYLE,0,style); return true; } //--- Line width int Width(void) const { return (int)this.GetProperty(GRAPH_OBJ_PROP_WIDTH,0); } bool SetWidth(const int width) { if(!::ObjectSetInteger(CGBaseObj::ChartID(),CGBaseObj::Name(),OBJPROP_WIDTH,width)) return false; this.SetProperty(GRAPH_OBJ_PROP_WIDTH,0,width); return true; } //--- Object color filling bool Fill(void) const { return (bool)this.GetProperty(GRAPH_OBJ_PROP_FILL,0); } bool SetFlagFill(const bool flag) { if(!::ObjectSetInteger(CGBaseObj::ChartID(),CGBaseObj::Name(),OBJPROP_FILL,flag)) return false; this.SetProperty(GRAPH_OBJ_PROP_FILL,0,flag); return true; } //--- Ability to edit text in the Edit object bool ReadOnly(void) const { return (bool)this.GetProperty(GRAPH_OBJ_PROP_READONLY,0); } bool SetFlagReadOnly(const bool flag) { if(!::ObjectSetInteger(CGBaseObj::ChartID(),CGBaseObj::Name(),OBJPROP_READONLY,flag)) return false; this.SetProperty(GRAPH_OBJ_PROP_READONLY,0,flag); return true; } //--- Number of levels int Levels(void) const { return (int)this.GetProperty(GRAPH_OBJ_PROP_LEVELS,0); } bool SetLevels(const int levels) { if(!::ObjectSetInteger(CGBaseObj::ChartID(),CGBaseObj::Name(),OBJPROP_LEVELS,levels)) return false; this.SetProperty(GRAPH_OBJ_PROP_LEVELS,0,levels); return true; } //--- Line level color color LevelColor(const int modifier) const { return (color)this.GetProperty(GRAPH_OBJ_PROP_LEVELCOLOR,modifier); } bool SetLevelColor(const color colour,const int modifier) { if(!::ObjectSetInteger(CGBaseObj::ChartID(),CGBaseObj::Name(),OBJPROP_LEVELCOLOR,modifier,colour)) return false; this.SetProperty(GRAPH_OBJ_PROP_LEVELCOLOR,modifier,colour); return true; } //--- Level line style ENUM_LINE_STYLE LevelStyle(const int modifier)const { return (ENUM_LINE_STYLE)this.GetProperty(GRAPH_OBJ_PROP_LEVELSTYLE,modifier); } bool SetLevelStyle(const ENUM_LINE_STYLE style,const int modifier) { if(!::ObjectSetInteger(CGBaseObj::ChartID(),CGBaseObj::Name(),OBJPROP_LEVELSTYLE,modifier,style)) return false; this.SetProperty(GRAPH_OBJ_PROP_LEVELSTYLE,modifier,style); return true; } ///--- Level line width int LevelWidth(const int modifier)const { return (int)this.GetProperty(GRAPH_OBJ_PROP_LEVELWIDTH,modifier); } bool SetLevelWidth(const int width,const int modifier) { if(!::ObjectSetInteger(CGBaseObj::ChartID(),CGBaseObj::Name(),OBJPROP_LEVELWIDTH,modifier,width)) return false; this.SetProperty(GRAPH_OBJ_PROP_LEVELWIDTH,modifier,width); return true; } //--- Horizontal text alignment in the Edit object (OBJ_EDIT) ENUM_ALIGN_MODE Align(void) const { return (ENUM_ALIGN_MODE)this.GetProperty(GRAPH_OBJ_PROP_ALIGN,0); } bool SetAlign(const ENUM_ALIGN_MODE align) { if(!::ObjectSetInteger(CGBaseObj::ChartID(),CGBaseObj::Name(),OBJPROP_ALIGN,align)) return false; this.SetProperty(GRAPH_OBJ_PROP_ALIGN,0,align); return true; } //--- Font size int FontSize(void) const { return (int)this.GetProperty(GRAPH_OBJ_PROP_FONTSIZE,0); } bool SetFontSize(const int size) { if(!::ObjectSetInteger(CGBaseObj::ChartID(),CGBaseObj::Name(),OBJPROP_FONTSIZE,size)) return false; this.SetProperty(GRAPH_OBJ_PROP_FONTSIZE,0,size); return true; } //--- Ray goes to the left bool RayLeft(void) const { return (bool)this.GetProperty(GRAPH_OBJ_PROP_RAY_LEFT,0); } bool SetFlagRayLeft(const bool flag) { if(!::ObjectSetInteger(CGBaseObj::ChartID(),CGBaseObj::Name(),OBJPROP_RAY_LEFT,flag)) return false; this.SetProperty(GRAPH_OBJ_PROP_RAY_LEFT,0,flag); return true; } //--- Ray goes to the right bool RayRight(void) const { return (bool)this.GetProperty(GRAPH_OBJ_PROP_RAY_RIGHT,0); } bool SetFlagRayRight(const bool flag) { if(!::ObjectSetInteger(CGBaseObj::ChartID(),CGBaseObj::Name(),OBJPROP_RAY_RIGHT,flag)) return false; this.SetProperty(GRAPH_OBJ_PROP_RAY_RIGHT,0,flag); return true; } //--- Vertical line goes through all windows of a chart bool Ray(void) const { return (bool)this.GetProperty(GRAPH_OBJ_PROP_RAY,0); } bool SetFlagRay(const bool flag) { if(!::ObjectSetInteger(CGBaseObj::ChartID(),CGBaseObj::Name(),OBJPROP_RAY,flag)) return false; this.SetProperty(GRAPH_OBJ_PROP_RAY,0,flag); return true; } //--- Display the full ellipse of the Fibonacci Arc object bool Ellipse(void) const { return (bool)this.GetProperty(GRAPH_OBJ_PROP_ELLIPSE,0); } bool SetFlagEllipse(const bool flag) { if(!::ObjectSetInteger(CGBaseObj::ChartID(),CGBaseObj::Name(),OBJPROP_ELLIPSE,flag)) return false; this.SetProperty(GRAPH_OBJ_PROP_ELLIPSE,0,flag); return true; } //--- Arrow code for the "Arrow" object uchar ArrowCode(void) const { return (uchar)this.GetProperty(GRAPH_OBJ_PROP_ARROWCODE,0); } bool SetArrowCode(const uchar code) { if(!::ObjectSetInteger(CGBaseObj::ChartID(),CGBaseObj::Name(),OBJPROP_ARROWCODE,code)) return false; this.SetProperty(GRAPH_OBJ_PROP_ARROWCODE,0,code); return true; } //--- Position of the graphical object anchor point int Anchor(void) const { return (int)this.GetProperty(GRAPH_OBJ_PROP_ANCHOR,0); } bool SetAnchor(const int anchor) { if(!::ObjectSetInteger(CGBaseObj::ChartID(),CGBaseObj::Name(),OBJPROP_ANCHOR,anchor)) return false; this.SetProperty(GRAPH_OBJ_PROP_ANCHOR,0,anchor); return true; } //--- Distance from the base corner along the X axis in pixels int XDistance(void) const { return (int)this.GetProperty(GRAPH_OBJ_PROP_XDISTANCE,0); } bool SetXDistance(const int distance) { if(!::ObjectSetInteger(CGBaseObj::ChartID(),CGBaseObj::Name(),OBJPROP_XDISTANCE,distance)) return false; this.SetProperty(GRAPH_OBJ_PROP_XDISTANCE,0,distance); return true; } //--- Distance from the base corner along the Y axis in pixels int YDistance(void) const { return (int)this.GetProperty(GRAPH_OBJ_PROP_YDISTANCE,0); } bool SetYDistance(const int distance) { if(!::ObjectSetInteger(CGBaseObj::ChartID(),CGBaseObj::Name(),OBJPROP_YDISTANCE,distance)) return false; this.SetProperty(GRAPH_OBJ_PROP_YDISTANCE,0,distance); return true; } //--- Gann object trend ENUM_GANN_DIRECTION Direction(void) const { return (ENUM_GANN_DIRECTION)this.GetProperty(GRAPH_OBJ_PROP_DIRECTION,0); } bool SetDirection(const ENUM_GANN_DIRECTION direction) { if(!::ObjectSetInteger(CGBaseObj::ChartID(),CGBaseObj::Name(),OBJPROP_DIRECTION,direction)) return false; this.SetProperty(GRAPH_OBJ_PROP_DIRECTION,0,direction); return true; } //--- Elliott wave marking level ENUM_ELLIOT_WAVE_DEGREE Degree(void) const { return (ENUM_ELLIOT_WAVE_DEGREE)this.GetProperty(GRAPH_OBJ_PROP_DEGREE,0); } bool SetDegree(const ENUM_ELLIOT_WAVE_DEGREE degree) { if(!::ObjectSetInteger(CGBaseObj::ChartID(),CGBaseObj::Name(),OBJPROP_DEGREE,degree)) return false; this.SetProperty(GRAPH_OBJ_PROP_DEGREE,0,degree); return true; } //--- Display lines for Elliott wave marking bool DrawLines(void) const { return (bool)this.GetProperty(GRAPH_OBJ_PROP_DRAWLINES,0); } bool SetFlagDrawLines(const bool flag) { if(!::ObjectSetInteger(CGBaseObj::ChartID(),CGBaseObj::Name(),OBJPROP_DRAWLINES,flag)) return false; this.SetProperty(GRAPH_OBJ_PROP_DRAWLINES,0,flag); return true; } //--- Button state (pressed/released) bool State(void) const { return (bool)this.GetProperty(GRAPH_OBJ_PROP_STATE,0); } bool SetFlagState(const bool flag) { if(!::ObjectSetInteger(CGBaseObj::ChartID(),CGBaseObj::Name(),OBJPROP_STATE,flag)) return false; this.SetProperty(GRAPH_OBJ_PROP_STATE,0,flag); return true; } //--- Chart object ID (OBJ_CHART) long ChartObjChartID(void) const { return this.GetProperty(GRAPH_OBJ_PROP_CHART_OBJ_CHART_ID,0); } bool SetChartObjChartID(const long chart_id) { this.SetProperty(GRAPH_OBJ_PROP_CHART_OBJ_CHART_ID,0,chart_id); return true; } //--- Chart object period ENUM_TIMEFRAMES ChartObjPeriod(void) const { return (ENUM_TIMEFRAMES)this.GetProperty(GRAPH_OBJ_PROP_CHART_OBJ_PERIOD,0); } bool SetChartObjPeriod(const ENUM_TIMEFRAMES timeframe) { if(!::ObjectSetInteger(CGBaseObj::ChartID(),CGBaseObj::Name(),OBJPROP_PERIOD,timeframe)) return false; this.SetProperty(GRAPH_OBJ_PROP_CHART_OBJ_PERIOD,0,timeframe); return true; } //--- Time scale display flag for the Chart object bool ChartObjDateScale(void) const { return (bool)this.GetProperty(GRAPH_OBJ_PROP_CHART_OBJ_DATE_SCALE,0); } bool SetFlagChartObjDateScale(const bool flag) { if(!::ObjectSetInteger(CGBaseObj::ChartID(),CGBaseObj::Name(),OBJPROP_DATE_SCALE,flag)) return false; this.SetProperty(GRAPH_OBJ_PROP_CHART_OBJ_DATE_SCALE,0,flag); return true; } //--- Price scale display flag for the Chart object bool ChartObjPriceScale(void) const { return (bool)this.GetProperty(GRAPH_OBJ_PROP_CHART_OBJ_PRICE_SCALE,0); } bool SetFlagPriceScale(const bool flag) { if(!::ObjectSetInteger(CGBaseObj::ChartID(),CGBaseObj::Name(),OBJPROP_PRICE_SCALE,flag)) return false; this.SetProperty(GRAPH_OBJ_PROP_CHART_OBJ_PRICE_SCALE,0,flag); return true; } //--- Chart object scale int ChartObjChartScale(void) const { return (int)this.GetProperty(GRAPH_OBJ_PROP_CHART_OBJ_CHART_SCALE,0); } bool SetChartObjChartScale(const int scale) { if(!::ObjectSetInteger(CGBaseObj::ChartID(),CGBaseObj::Name(),OBJPROP_CHART_SCALE,scale)) return false; this.SetProperty(GRAPH_OBJ_PROP_CHART_OBJ_CHART_SCALE,0,scale); return true; } //--- Object width along the X axis in pixels int XSize(void) const { return (int)this.GetProperty(GRAPH_OBJ_PROP_XSIZE,0); } bool SetXSize(const int size) { if(!::ObjectSetInteger(CGBaseObj::ChartID(),CGBaseObj::Name(),OBJPROP_XSIZE,size)) return false; this.SetProperty(GRAPH_OBJ_PROP_XSIZE,0,size); return true; } //--- Object height along the Y axis in pixels int YSize(void) const { return (int)this.GetProperty(GRAPH_OBJ_PROP_YSIZE,0); } bool SetYSize(const int size) { if(!::ObjectSetInteger(CGBaseObj::ChartID(),CGBaseObj::Name(),OBJPROP_YSIZE,size)) return false; this.SetProperty(GRAPH_OBJ_PROP_YSIZE,0,size); return true; } //--- X coordinate of the upper-left corner of the visibility area int XOffset(void) const { return (int)this.GetProperty(GRAPH_OBJ_PROP_XOFFSET,0); } bool SetXOffset(const int offset) { if(!::ObjectSetInteger(CGBaseObj::ChartID(),CGBaseObj::Name(),OBJPROP_XOFFSET,offset)) return false; this.SetProperty(GRAPH_OBJ_PROP_XOFFSET,0,offset); return true; } //--- Y coordinate of the upper-left corner of the visibility area int YOffset(void) const { return (int)this.GetProperty(GRAPH_OBJ_PROP_YOFFSET,0); } bool SetYOffset(const int offset) { if(!::ObjectSetInteger(CGBaseObj::ChartID(),CGBaseObj::Name(),OBJPROP_YOFFSET,offset)) return false; this.SetProperty(GRAPH_OBJ_PROP_YOFFSET,0,offset); return true; } //--- Background color for OBJ_EDIT, OBJ_BUTTON, OBJ_RECTANGLE_LABEL color BGColor(void) const { return (color)this.GetProperty(GRAPH_OBJ_PROP_BGCOLOR,0); } bool SetBGColor(const color colour) { if(!::ObjectSetInteger(CGBaseObj::ChartID(),CGBaseObj::Name(),OBJPROP_BGCOLOR,colour)) return false; this.SetProperty(GRAPH_OBJ_PROP_BGCOLOR,0,colour); return true; } //--- Chart corner for attaching a graphical object ENUM_BASE_CORNER Corner(void) const { return (ENUM_BASE_CORNER)this.GetProperty(GRAPH_OBJ_PROP_CORNER,0); } bool SetCorner(const ENUM_BASE_CORNER corner) { if(!::ObjectSetInteger(CGBaseObj::ChartID(),CGBaseObj::Name(),OBJPROP_CORNER,corner)) return false; this.SetProperty(GRAPH_OBJ_PROP_CORNER,0,corner); return true; } //--- Border type for the Rectangle label object ENUM_BORDER_TYPE BorderType(void) const { return (ENUM_BORDER_TYPE)this.GetProperty(GRAPH_OBJ_PROP_BORDER_TYPE,0); } bool SetBorderType(const ENUM_BORDER_TYPE type) { if(!::ObjectSetInteger(CGBaseObj::ChartID(),CGBaseObj::Name(),OBJPROP_BORDER_TYPE,type)) return false; this.SetProperty(GRAPH_OBJ_PROP_BORDER_TYPE,0,type); return true; } //--- Border color for OBJ_EDIT and OBJ_BUTTON color BorderColor(void) const { return (color)this.GetProperty(GRAPH_OBJ_PROP_BORDER_COLOR,0); } bool SetBorderColor(const color colour) { if(!::ObjectSetInteger(CGBaseObj::ChartID(),CGBaseObj::Name(),OBJPROP_BORDER_COLOR,colour)) return false; this.SetProperty(GRAPH_OBJ_PROP_BORDER_COLOR,0,colour); return true; } //--- Price coordinate double Price(const int modifier) const { return this.GetProperty(GRAPH_OBJ_PROP_PRICE,modifier); } bool SetPrice(const double price,const int modifier) { if(!::ObjectSetDouble(CGBaseObj::ChartID(),CGBaseObj::Name(),OBJPROP_PRICE,modifier,price)) return false; this.SetProperty(GRAPH_OBJ_PROP_PRICE,modifier,price); return true; } //--- Level value double LevelValue(const int modifier)const { return this.GetProperty(GRAPH_OBJ_PROP_LEVELVALUE,modifier); } bool SetLevelValue(const double value,const int modifier) { if(!::ObjectSetDouble(CGBaseObj::ChartID(),CGBaseObj::Name(),OBJPROP_LEVELVALUE,modifier,value)) return false; this.SetProperty(GRAPH_OBJ_PROP_LEVELVALUE,modifier,value); return true; } //--- Scale double Scale(void) const { return this.GetProperty(GRAPH_OBJ_PROP_SCALE,0); } bool SetScale(const double scale) { if(!::ObjectSetDouble(CGBaseObj::ChartID(),CGBaseObj::Name(),OBJPROP_SCALE,scale)) return false; this.SetProperty(GRAPH_OBJ_PROP_SCALE,0,scale); return true; } //--- Angle double Angle(void) const { return this.GetProperty(GRAPH_OBJ_PROP_ANGLE,0); } bool SetAngle(const double angle) { if(!::ObjectSetDouble(CGBaseObj::ChartID(),CGBaseObj::Name(),OBJPROP_ANGLE,angle)) return false; this.SetProperty(GRAPH_OBJ_PROP_ANGLE,0,angle); return true; } //--- Deviation of the standard deviation channel double Deviation(void) const { return this.GetProperty(GRAPH_OBJ_PROP_DEVIATION,0); } bool SetDeviation(const double deviation) { if(!::ObjectSetDouble(CGBaseObj::ChartID(),CGBaseObj::Name(),OBJPROP_DEVIATION,deviation)) return false; this.SetProperty(GRAPH_OBJ_PROP_DEVIATION,0,deviation); return true; } //--- Object name string Name(void) const { return this.GetProperty(GRAPH_OBJ_PROP_NAME,0); } bool SetName(const string name) { if(CGBaseObj::Name()==name) return true; if(CGBaseObj::Name()=="") { CGBaseObj::SetName(name); this.SetProperty(GRAPH_OBJ_PROP_NAME,0,name); return true; } else { if(!::ObjectSetString(CGBaseObj::ChartID(),CGBaseObj::Name(),OBJPROP_NAME,name)) return false; CGBaseObj::SetName(name); this.SetProperty(GRAPH_OBJ_PROP_NAME,0,name); return true; } } //--- Object description (text contained in the object) string Text(void) const { return this.GetProperty(GRAPH_OBJ_PROP_TEXT,0); } bool SetText(const string text) { if(!::ObjectSetString(CGBaseObj::ChartID(),CGBaseObj::Name(),OBJPROP_TEXT,text)) return false; this.SetProperty(GRAPH_OBJ_PROP_TEXT,0,text); return true; } //--- Tooltip text string Tooltip(void) const { return this.GetProperty(GRAPH_OBJ_PROP_TOOLTIP,0); } bool SetTooltip(const string tooltip) { if(!::ObjectSetString(CGBaseObj::ChartID(),CGBaseObj::Name(),OBJPROP_TOOLTIP,tooltip)) return false; this.SetProperty(GRAPH_OBJ_PROP_TOOLTIP,0,tooltip); return true; } //--- Level description string LevelText(const int modifier) const { return this.GetProperty(GRAPH_OBJ_PROP_LEVELTEXT,modifier); } bool SetLevelText(const string text,const int modifier) { if(!::ObjectSetString(CGBaseObj::ChartID(),CGBaseObj::Name(),OBJPROP_LEVELTEXT,modifier,text)) return false; this.SetProperty(GRAPH_OBJ_PROP_LEVELTEXT,modifier,text); return true; } //--- Font string Font(void) const { return this.GetProperty(GRAPH_OBJ_PROP_FONT,0); } bool SetFont(const string font) { if(!::ObjectSetString(CGBaseObj::ChartID(),CGBaseObj::Name(),OBJPROP_FONT,font)) return false; this.SetProperty(GRAPH_OBJ_PROP_FONT,0,font); return true; } //--- BMP file name for the "Bitmap Level" object string BMPFile(const int modifier) const { return this.GetProperty(GRAPH_OBJ_PROP_BMPFILE,modifier); } bool SetBMPFile(const string bmp_file,const int modifier) { if(!::ObjectSetString(CGBaseObj::ChartID(),CGBaseObj::Name(),OBJPROP_BMPFILE,bmp_file)) return false; this.SetProperty(GRAPH_OBJ_PROP_BMPFILE,modifier,bmp_file); return true; } //--- Symbol for the Chart object string ChartObjSymbol(void) const { return this.GetProperty(GRAPH_OBJ_PROP_CHART_OBJ_SYMBOL,0); } bool SetChartObjSymbol(const string symbol) { if(!::ObjectSetString(CGBaseObj::ChartID(),CGBaseObj::Name(),OBJPROP_SYMBOL,symbol)) return false; this.SetProperty(GRAPH_OBJ_PROP_CHART_OBJ_SYMBOL,0,symbol); return true; }
In der Methode zum Empfangen und Speichern von Integer-Eigenschaften, schreiben wir zuerst die im Basisobjekt vorhandenen Daten in die Eigenschaften des Basisobjekts. Als Nächstes schreiben wir die Werte aus diesem Objekt in die Eigenschaften der grafischen Objektklasse:
//+------------------------------------------------------------------+
//| Get and save the integer properties                              |
//+------------------------------------------------------------------+
void CGStdGraphObj::GetAndSaveINT(void)
  {
   //--- Properties inherent in all graphical objects and present in a graphical object
   CGBaseObj::SetVisibleOnTimeframes((int)::ObjectGetInteger(this.ChartID(),this.Name(),OBJPROP_TIMEFRAMES),true);   // Write Object visibility on timeframes to the base object
   CGBaseObj::SetFlagBack(::ObjectGetInteger(this.ChartID(),this.Name(),OBJPROP_BACK),true);                         // Write Background object flag to the base object
   CGBaseObj::SetZorder(::ObjectGetInteger(this.ChartID(),this.Name(),OBJPROP_ZORDER),true);                         // Write Priority of a graphical object for receiving the event of clicking on a chart to the base object
   CGBaseObj::SetFlagHidden(::ObjectGetInteger(this.ChartID(),this.Name(),OBJPROP_HIDDEN),true);                     // Write Disable displaying the name of a graphical object in the terminal object list to the base object
   CGBaseObj::SetFlagSelectable(::ObjectGetInteger(this.ChartID(),this.Name(),OBJPROP_SELECTABLE),true);             // Write Object availability to the base object
   CGBaseObj::SetFlagSelected(::ObjectGetInteger(this.ChartID(),this.Name(),OBJPROP_SELECTED),true);                 // Write Object selection to the base object

   this.SetProperty(GRAPH_OBJ_PROP_TIMEFRAMES,0,CGBaseObj::VisibleOnTimeframes());                                   // Object visibility on timeframes
   this.SetProperty(GRAPH_OBJ_PROP_BACK,0,CGBaseObj::IsBack());                                                      // Background object
   this.SetProperty(GRAPH_OBJ_PROP_ZORDER,0,CGBaseObj::Zorder());                                                    // Priority of a graphical object for receiving the event of clicking on a chart
   this.SetProperty(GRAPH_OBJ_PROP_HIDDEN,0,CGBaseObj::IsHidden());                                                  // Disable displaying the name of a graphical object in the terminal object list
   this.SetProperty(GRAPH_OBJ_PROP_SELECTABLE,0,CGBaseObj::IsSelectable());                                          // Object availability
   this.SetProperty(GRAPH_OBJ_PROP_SELECTED,0,CGBaseObj::IsSelected());                                              // Object selection

   this.SetProperty(GRAPH_OBJ_PROP_CREATETIME,0,::ObjectGetInteger(this.ChartID(),this.Name(),OBJPROP_CREATETIME));  // Object creation time
   for(int i=0;i<this.m_pivots;i++)                                                                                  // Point time coordinates
      this.SetTimePivot(i);
   this.SetProperty(GRAPH_OBJ_PROP_COLOR,0,::ObjectGetInteger(this.ChartID(),this.Name(),OBJPROP_COLOR));            // Color
   this.SetProperty(GRAPH_OBJ_PROP_STYLE,0,::ObjectGetInteger(this.ChartID(),this.Name(),OBJPROP_STYLE));            // Style
   this.SetProperty(GRAPH_OBJ_PROP_WIDTH,0,::ObjectGetInteger(this.ChartID(),this.Name(),OBJPROP_WIDTH));            // Line width
   //--- Properties belonging to different graphical objects
   this.SetProperty(GRAPH_OBJ_PROP_FILL,0,::ObjectGetInteger(this.ChartID(),this.Name(),OBJPROP_FILL));              // Fill an object with color
   this.SetProperty(GRAPH_OBJ_PROP_READONLY,0,::ObjectGetInteger(this.ChartID(),this.Name(),OBJPROP_READONLY));      // Ability to edit text in the Edit object
   this.SetProperty(GRAPH_OBJ_PROP_LEVELS,0,::ObjectGetInteger(this.ChartID(),this.Name(),OBJPROP_LEVELS));          // Number of levels

   if(this.GetProperty(GRAPH_OBJ_PROP_LEVELS,0)!=this.GetPropertyPrev(GRAPH_OBJ_PROP_LEVELS,0))                      // Check if the number of levels has changed
     {
      this.Prop.SetSizeRange(GRAPH_OBJ_PROP_LEVELCOLOR,this.Levels());
      this.Prop.SetSizeRange(GRAPH_OBJ_PROP_LEVELSTYLE,this.Levels());
      this.Prop.SetSizeRange(GRAPH_OBJ_PROP_LEVELWIDTH,this.Levels());
      this.Prop.SetSizeRange(GRAPH_OBJ_PROP_LEVELVALUE,this.Levels());
      this.Prop.SetSizeRange(GRAPH_OBJ_PROP_LEVELTEXT,this.Levels());
     }
   for(int i=0;i<this.Levels();i++)                                                                                  // Level data
     {
      this.SetLevelColor(i);
      this.SetLevelStyle(i);
      this.SetLevelWidth(i);
     }
   this.SetProperty(GRAPH_OBJ_PROP_ALIGN,0,::ObjectGetInteger(this.ChartID(),this.Name(),OBJPROP_ALIGN));            // Horizontal text alignment in the Edit object (OBJ_EDIT)
   this.SetProperty(GRAPH_OBJ_PROP_FONTSIZE,0,::ObjectGetInteger(this.ChartID(),this.Name(),OBJPROP_FONTSIZE));      // Font size
   this.SetProperty(GRAPH_OBJ_PROP_RAY_LEFT,0,::ObjectGetInteger(this.ChartID(),this.Name(),OBJPROP_RAY_LEFT));      // Ray goes to the left
   this.SetProperty(GRAPH_OBJ_PROP_RAY_RIGHT,0,::ObjectGetInteger(this.ChartID(),this.Name(),OBJPROP_RAY_RIGHT));    // Ray goes to the right
   this.SetProperty(GRAPH_OBJ_PROP_RAY,0,::ObjectGetInteger(this.ChartID(),this.Name(),OBJPROP_RAY));                // Vertical line goes through all windows of a chart
   this.SetProperty(GRAPH_OBJ_PROP_ELLIPSE,0,::ObjectGetInteger(this.ChartID(),this.Name(),OBJPROP_ELLIPSE));        // Display the full ellipse of the Fibonacci Arc object
   this.SetProperty(GRAPH_OBJ_PROP_ARROWCODE,0,::ObjectGetInteger(this.ChartID(),this.Name(),OBJPROP_ARROWCODE));    // Arrow code for the "Arrow" object
   this.SetProperty(GRAPH_OBJ_PROP_ANCHOR,0,::ObjectGetInteger(this.ChartID(),this.Name(),OBJPROP_ANCHOR));          // Position of the binding point of the graphical object
   this.SetProperty(GRAPH_OBJ_PROP_XDISTANCE,0,::ObjectGetInteger(this.ChartID(),this.Name(),OBJPROP_XDISTANCE));    // Distance from the base corner along the X axis in pixels
   this.SetProperty(GRAPH_OBJ_PROP_YDISTANCE,0,::ObjectGetInteger(this.ChartID(),this.Name(),OBJPROP_YDISTANCE));    // Distance from the base corner along the Y axis in pixels
   this.SetProperty(GRAPH_OBJ_PROP_DIRECTION,0,::ObjectGetInteger(this.ChartID(),this.Name(),OBJPROP_DIRECTION));    // Gann object trend
   this.SetProperty(GRAPH_OBJ_PROP_DEGREE,0,::ObjectGetInteger(this.ChartID(),this.Name(),OBJPROP_DEGREE));          // Elliott wave marking level
   this.SetProperty(GRAPH_OBJ_PROP_DRAWLINES,0,::ObjectGetInteger(this.ChartID(),this.Name(),OBJPROP_DRAWLINES));    // Display lines for Elliott wave marking
   this.SetProperty(GRAPH_OBJ_PROP_STATE,0,::ObjectGetInteger(this.ChartID(),this.Name(),OBJPROP_STATE));            // Button state (pressed/released)
   this.SetProperty(GRAPH_OBJ_PROP_CHART_OBJ_CHART_ID,0,::ObjectGetInteger(this.ChartID(),this.Name(),OBJPROP_CHART_ID));// Chart object ID (OBJ_CHART).
   this.SetProperty(GRAPH_OBJ_PROP_CHART_OBJ_PERIOD,0,::ObjectGetInteger(this.ChartID(),this.Name(),OBJPROP_PERIOD));    // Chart object period
   this.SetProperty(GRAPH_OBJ_PROP_CHART_OBJ_DATE_SCALE,0,::ObjectGetInteger(this.ChartID(),this.Name(),OBJPROP_DATE_SCALE));  // Time scale display flag for the Chart object
   this.SetProperty(GRAPH_OBJ_PROP_CHART_OBJ_PRICE_SCALE,0,::ObjectGetInteger(this.ChartID(),this.Name(),OBJPROP_PRICE_SCALE));// Price scale display flag for the Chart object
   this.SetProperty(GRAPH_OBJ_PROP_CHART_OBJ_CHART_SCALE,0,::ObjectGetInteger(this.ChartID(),this.Name(),OBJPROP_CHART_SCALE));// Chart object scale
   this.SetProperty(GRAPH_OBJ_PROP_XSIZE,0,::ObjectGetInteger(this.ChartID(),this.Name(),OBJPROP_XSIZE));            // Object width along the X axis in pixels.
   this.SetProperty(GRAPH_OBJ_PROP_YSIZE,0,::ObjectGetInteger(this.ChartID(),this.Name(),OBJPROP_YSIZE));            // Object height along the Y axis in pixels.
   this.SetProperty(GRAPH_OBJ_PROP_XOFFSET,0,::ObjectGetInteger(this.ChartID(),this.Name(),OBJPROP_XOFFSET));        // X coordinate of the upper-left corner of the visibility area.
   this.SetProperty(GRAPH_OBJ_PROP_YOFFSET,0,::ObjectGetInteger(this.ChartID(),this.Name(),OBJPROP_YOFFSET));        // Y coordinate of the upper-left corner of the visibility area.
   this.SetProperty(GRAPH_OBJ_PROP_BGCOLOR,0,::ObjectGetInteger(this.ChartID(),this.Name(),OBJPROP_BGCOLOR));        // Background color for OBJ_EDIT, OBJ_BUTTON, OBJ_RECTANGLE_LABEL
   this.SetProperty(GRAPH_OBJ_PROP_CORNER,0,::ObjectGetInteger(this.ChartID(),this.Name(),OBJPROP_CORNER));          // Chart corner for binding a graphical object
   this.SetProperty(GRAPH_OBJ_PROP_BORDER_TYPE,0,::ObjectGetInteger(this.ChartID(),this.Name(),OBJPROP_BORDER_TYPE));// Border type for "Rectangle border"
   this.SetProperty(GRAPH_OBJ_PROP_BORDER_COLOR,0,::ObjectGetInteger(this.ChartID(),this.Name(),OBJPROP_BORDER_COLOR));// Border color for OBJ_EDIT and OBJ_BUTTON
  }
//+------------------------------------------------------------------+
So füllen wir alle Eigenschaften aus, die in der Basisklasse und ihrer Nachkommenschaft dupliziert werden. Ansonsten verwenden wir beim Empfang von Objekteigenschaften die Methoden des Basisobjekts. In ihnen sind keine grafischen Objektdaten gespeichert.
Ich werde einige Verbesserungen bei der Erstellung der Funktionsweise zur Verfolgung von Standardereignissen für grafische Objekte in Betracht ziehen.
Standardereignisse für grafische Objekte
Die Logik der Behandlung von Ereignissen für grafische Objekte soll auf dem folgenden Konzept beruhen: Wir können beliebige Ereignisse definieren, die bei Objekteigenschaften auftreten. Lassen Sie uns eine kleine Klasse des Basisereignisses für grafische Objekte erstellen. Bei der Definition eines Ereignisses für ein grafisches Objekt wird ein neues Ereignisobjekt erstellt, das folgende Daten erhält:
- Ereignis-ID,
- ID des Charts, das ein grafisches Objekt enthält, bei dem ein Ereignis aufgetreten ist,
- Name des Objekts, bei dem ein Ereignis aufgetreten ist.
Ein nutzerdefiniertes Ereignis, das mit der Funktion EventChartCustom() an ein bestimmtes Chart gesendet wird, hat fünf Parameter:
//+------------------------------------------------------------------+
bool  EventChartCustom(
   long    chart_id,            // event receiving chart ID
   ushort  custom_event_id,     // event ID
   long    lparam,              // long parameter
   double  dparam,              // double parameter
   string  sparam               // event string parameter
   );
//+------------------------------------------------------------------+
Die auszufüllenden IDs sind custom_event_id für die Ereignis-ID des grafischen Objekts, lparam für die ID des Charts, das ein grafisches Objekt enthält, bei dem ein Ereignis aufgetreten ist, und sparam für den Namen eines grafischen Objekts. Wir haben auch einen freien Parameter dparam. Wir werden ihn verwenden, um den Wert der Konstante einer geänderten Eigenschaft anzugeben, wenn sie geändert wird, oder die Anzahl der grafischen Objekte, die zusammen mit einem geschlossenen Chart-Fenster entfernt werden.
Für jedes Objektereignis muss ein Ereignisobjekt erstellt (und in die Ereignisliste eingetragen) werden. Nachdem die Objekteigenschaften auf Änderungen überprüft wurden, haben wir eine vollständige Liste aller Ereignisse, die bei einem grafischen Objekt aufgetreten sind. Nach Abschluss der Überprüfung aller Objekteigenschaften wird die neu erstellte Ereignisliste abgearbeitet, indem jedes Ereignis an das Kontrollprogramm Chart gesendet wird, wo wiederum die Ereignisbehandlung von OnChartEvent() der Klasse der grafischen Elementsammlung aufgerufen wird. Die Ereignisbehandlung ermöglicht die Verarbeitung jedes Ereignisses, das aus der erstellten Liste der Ereignisse der grafischen Objekte gesendet wird. Jedes dieser Ereignisse enthält die Ereignis-ID, die ID des Charts, in dem sich das geänderte grafische Objekt befindet, und seinen Namen. Dadurch wird das grafische Objekt genau definiert, während die Kenntnis der Konstante der geänderten Eigenschaft genau auf eine geänderte Eigenschaft hinweist, sodass wir in der Lage sind, den Zeiger auf das Objekt in der Sammlung zu erhalten und einen neuen Wert der geänderten Eigenschaft zu lesen. All dies ermöglicht es uns, sowohl auf das grafische Objekt selbst als auch auf die geänderte Eigenschaft zu verweisen, um das Ereignis im Programm gemäß der ihm innewohnenden Logik weiter zu behandeln.
In diesem Artikel werde ich nur die Erzeugung von Ereignissen und deren Weiterleitung an den Handler von Ereignissen der grafischen Objektsammlung implementieren. Diese Ereignisse werden im nächsten Artikel in ihre Komponenten zerlegt.
Wir fügen ganz am Anfang der grafischen Basisobjektdatei \MQL5\Include\DoEasy\Objects\Graph\GBaseObj.mqh die neue Klasse des Basisereignisses der grafischen Bibliotheksobjekte hinzu:
//+------------------------------------------------------------------+
//|                                                     GBaseObj.mqh |
//|                                  Copyright 2021, MetaQuotes Ltd. |
//|                             https://mql5.com/en/users/artmedia70 |
//+------------------------------------------------------------------+
#property copyright "Copyright 2021, MetaQuotes Ltd."
#property link      "https://mql5.com/en/users/artmedia70"
#property version   "1.00"
#property strict    // Necessary for mql4
//+------------------------------------------------------------------+
//| Include files                                                    |
//+------------------------------------------------------------------+
#include "..\..\Services\DELib.mqh"
#include <Graphics\Graphic.mqh>
//+------------------------------------------------------------------+
//| Graphical object event class                                     |
//+------------------------------------------------------------------+
class CGBaseEvent : public CObject
  {
private:
   ushort            m_id;
   long              m_lparam;
   double            m_dparam;
   string            m_sparam;
public:
   void              ID(ushort id)                          { this.m_id=id;         }
   ushort            ID(void)                         const { return this.m_id;     }
   void              LParam(const long value)               { this.m_lparam=value;  }
   long              Lparam(void)                     const { return this.m_lparam; }
   void              DParam(const double value)             { this.m_dparam=value;  }
   double            Dparam(void)                     const { return this.m_dparam; }
   void              SParam(const string value)             { this.m_sparam=value;  }
   string            Sparam(void)                     const { return this.m_sparam; }
   bool              Send(const long chart_id)
                       {
                        ::ResetLastError();
                        return ::EventChartCustom(chart_id,m_id,m_lparam,m_dparam,m_sparam);
                       }
                     CGBaseEvent (const ushort event_id,const long lparam,const double dparam,const string sparam) :
                        m_id(event_id),m_lparam(lparam),m_dparam(dparam),m_sparam(sparam){}
                    ~CGBaseEvent (void){}
  };
//+------------------------------------------------------------------+
//| Class of the base object of the library graphical objects        |
//+------------------------------------------------------------------+
class CGBaseObj : public CObject
Die Klassenvariablen zum Speichern aller oben beschriebenen Eigenschaften des Ereignisobjekts werden im privaten Abschnitt der Klasse deklariert, während der öffentliche Abschnitt die Methoden zum Setzen und Zurückgeben der Werte der Variablen und die Methode zum Senden eines benutzerdefinierten Ereignisses an einen bestimmten Chart enthält.
Der Klassenkonstruktor empfängt alle Werte, die den Klassenvariablen zugewiesen werden sollen. Die Werte werden den Variablen in der Initialisierungsliste des Konstruktors sofort zugewiesen.
Im geschützten Bereich der grafischen Basisobjektklasse deklarieren wir die Liste zur Speicherung von Objektereignissen und schreiben die Methoden zur Behandlung der Liste und der grafischen Objektereignisse:
//+------------------------------------------------------------------+
//| Class of the base object of the library graphical objects        |
//+------------------------------------------------------------------+
class CGBaseObj : public CObject
  {
protected:
   CArrayObj         m_list_events;                      // Object event list
   ENUM_OBJECT       m_type_graph_obj;                   // Graphical object type
   ENUM_GRAPH_ELEMENT_TYPE m_type_element;               // Graphical element type
   ENUM_GRAPH_OBJ_BELONG m_belong;                       // Program affiliation
   ENUM_GRAPH_OBJ_GROUP m_group;                         // Graphical object group
   string            m_name_prefix;                      // Object name prefix
   string            m_name;                             // Object name
   long              m_chart_id;                         // Object chart ID
   long              m_object_id;                        // Object ID
   long              m_zorder;                           // Priority of a graphical object for receiving the mouse click event
   int               m_subwindow;                        // Subwindow index
   int               m_shift_y;                          // Subwindow Y coordinate shift
   int               m_type;                             // Object type
   int               m_timeframes_visible;               // Visibility of an object on timeframes (a set of flags)
   int               m_digits;                           // Number of decimal places in a quote
   bool              m_visible;                          // Object visibility
   bool              m_back;                             // "Background object" flag
   bool              m_selected;                         // "Object selection" flag
   bool              m_selectable;                       // "Object availability" flag
   bool              m_hidden;                           // "Disable displaying the name of a graphical object in the terminal object list" flag
   datetime          m_create_time;                      // Object creation time

//--- Create (1) the object structure and (2) the object from the structure
   virtual bool      ObjectToStruct(void)                      { return true; }
   virtual void      StructToObject(void){;}

//--- Return the list of object events
   CArrayObj        *GetListEvents(void)                       { return &this.m_list_events;          }
//--- Create a new object event
   CGBaseEvent      *CreateNewEvent(const ushort event_id,const long lparam,const double dparam,const string sparam)
                       {
                        CGBaseEvent *event=new CGBaseEvent(event_id,lparam,dparam,sparam);
                        return event;
                       }
//--- Create a new object event and add it to the event list
   bool              CreateAndAddNewEvent(const ushort event_id,const long lparam,const double dparam,const string sparam)
                       {
                        return this.AddEvent(new CGBaseEvent(event_id,lparam,dparam,sparam));
                       }
//--- Add an event object to the event list
   bool              AddEvent(CGBaseEvent *event)              { return this.m_list_events.Add(event);}
//--- Clear the event list
   void              ClearEventsList(void)                     { this.m_list_events.Clear();          }
//--- Return the number of events in the list
   int               EventsTotal(void)                         { return this.m_list_events.Total();   }

public:
Alle angebotenen Methoden sind recht einfach und leicht zu verstehen. Wenn Sie Fragen haben, können Sie diese gerne im Kommentarteil unten stellen.
Im Klassenkonstruktor, löschen wir die Liste der Objekt-Ereignisse und setzen das Flag für die sortierte Liste:
//+------------------------------------------------------------------+
//| Constructor                                                      |
//+------------------------------------------------------------------+
CGBaseObj::CGBaseObj() : m_shift_y(0),m_visible(false), m_name_prefix(::MQLInfoString(MQL_PROGRAM_NAME)+"_"),m_belong(GRAPH_OBJ_BELONG_PROGRAM)
  {
   this.m_list_events.Clear();                  // Clear the event list
   this.m_list_events.Sort();                   // Sorted list flag
   this.m_type=OBJECT_DE_TYPE_GBASE;            // Object type
   this.m_type_graph_obj=WRONG_VALUE;           // Graphical object type
   this.m_type_element=WRONG_VALUE;             // Graphical object type
   this.m_belong=WRONG_VALUE;                   // Program/terminal affiliation
   this.m_name_prefix="";                       // Object name prefix
   this.m_name="";                              // Object name
   this.m_chart_id=0;                           // Object chart ID
   this.m_object_id=0;                          // Object ID
   this.m_zorder=0;                             // Priority of a graphical object for receiving the mouse click event
   this.m_subwindow=0;                          // Subwindow index
   this.m_shift_y=0;                            // Subwindow Y coordinate shift
   this.m_timeframes_visible=OBJ_ALL_PERIODS;   // Visibility of an object on timeframes (a set of flags)
   this.m_visible=true;                         // Object visibility
   this.m_back=false;                           // "Background object" flag
   this.m_selected=false;                       // "Object selection" flag
   this.m_selectable=false;                     // "Object availability" flag
   this.m_hidden=true;                          // "Disable displaying the name of a graphical object in the terminal object list" flag
   this.m_create_time=0;                        // Object creation time

  }
//+------------------------------------------------------------------+
In der Standard-Grafikobjektklasse \MQL5\Include\DoEasy\Objects\Graph\Standard\GStdGraphObj.mqh, und zwar in der Methode zur Überprüfung der Änderung der Objekteigenschaften, Löschen der Ereignisliste, Erzeugen und Hinzufügen von Ereignisobjekten zur Liste und Senden an den Handler für Ereignisse der Grafikobjektsammlung aus der erzeugten Liste:
//+------------------------------------------------------------------+
//| Check object property changes                                    |
//+------------------------------------------------------------------+
void CGStdGraphObj::PropertiesCheckChanged(void)
  {
   CGBaseObj::ClearEventsList();
   bool changed=false;
   int begin=0, end=GRAPH_OBJ_PROP_INTEGER_TOTAL;
   for(int i=begin; i<end; i++)
     {
      ENUM_GRAPH_OBJ_PROP_INTEGER prop=(ENUM_GRAPH_OBJ_PROP_INTEGER)i;
      if(!this.SupportProperty(prop)) continue;
      for(int j=0;j<Prop.CurrSize(prop);j++)
        {
         if(this.GetProperty(prop,j)!=this.GetPropertyPrev(prop,j))
           {
            changed=true;
            this.CreateAndAddNewEvent(GRAPH_OBJ_EVENT_CHANGE,this.ChartID(),prop,this.Name());
           }
        }
     }

   begin=end; end+=GRAPH_OBJ_PROP_DOUBLE_TOTAL;
   for(int i=begin; i<end; i++)
     {
      ENUM_GRAPH_OBJ_PROP_DOUBLE prop=(ENUM_GRAPH_OBJ_PROP_DOUBLE)i;
      if(!this.SupportProperty(prop)) continue;
      for(int j=0;j<Prop.CurrSize(prop);j++)
        {
         if(this.GetProperty(prop,j)!=this.GetPropertyPrev(prop,j))
           {
            changed=true;
            this.CreateAndAddNewEvent(GRAPH_OBJ_EVENT_CHANGE,this.ChartID(),prop,this.Name());
           }
        }
     }

   begin=end; end+=GRAPH_OBJ_PROP_STRING_TOTAL;
   for(int i=begin; i<end; i++)
     {
      ENUM_GRAPH_OBJ_PROP_STRING prop=(ENUM_GRAPH_OBJ_PROP_STRING)i;
      if(!this.SupportProperty(prop)) continue;
      for(int j=0;j<Prop.CurrSize(prop);j++)
        {
         if(this.GetProperty(prop,j)!=this.GetPropertyPrev(prop,j) && prop!=GRAPH_OBJ_PROP_NAME)
           {
            changed=true;
            this.CreateAndAddNewEvent(GRAPH_OBJ_EVENT_CHANGE,this.ChartID(),prop,this.Name());
           }
        }
     }
   if(changed)
     {
      for(int i=0;i<this.m_list_events.Total();i++)
        {
         CGBaseEvent *event=this.m_list_events.At(i);
         if(event==NULL)
            continue;
         ::EventChartCustom(::ChartID(),event.ID(),event.Lparam(),event.Dparam(),event.Sparam());
        }
      PropertiesCopyToPrevData();
     }
  }
//+------------------------------------------------------------------+
Hier wird für jede Objekteigenschaft in der Schleife durch alle Objekteigenschaften geprüft, ob es Änderungen gibt. Wenn eine Änderung festgestellt wurde, erstellen wir ein Ereignisobjekt und fügen es der Liste der Objektereignisse hinzu. Wenn es mindestens eine Änderung gibt, wird jedes Ereignisobjekt abgerufen und anhand der erstellten Liste an das Kontrollprogramm Chart in der Schleife gesendet. Anschließend werden diese Ereignisse gesendet und in der Ereignisbehandlung von OnChartEvent() der Klasse der grafischen Elementsammlung behandelt.
Wir öffnen die Datei der Kollektionsklasse der grafischen Elemente \MQL5\Include\DoEasy\Collections\GraphElementsCollection.mqh. Verbessern wir noch die Methode der Klasse zur Verwaltung grafischer Objekte, die die Chart-Objekte überprüft:
//+------------------------------------------------------------------+
//| CChartObjectsControl: Check objects on a chart                   |
//+------------------------------------------------------------------+
void CChartObjectsControl::Refresh(void)
  {
//--- Graphical objects on the chart
   this.m_total_objects=::ObjectsTotal(this.ChartID());
   this.m_delta_graph_obj=this.m_total_objects-this.m_last_objects;

   //--- If an object is added to the chart
   if(this.m_delta_graph_obj>0)
     {
      //--- find the last added graphical object, select it and write its name
      string name=this.LastAddedGraphObjName();
      //--- Handle only non-programmatically created objects
      if(name!="" && ::StringFind(name,m_name_program)==WRONG_VALUE)
        {
         //--- Create the object of the graphical object class corresponding to the added graphical object type
         ENUM_OBJECT type=(ENUM_OBJECT)::ObjectGetInteger(this.ChartID(),name,OBJPROP_TYPE);
         ENUM_OBJECT_DE_TYPE obj_type=ENUM_OBJECT_DE_TYPE(type+OBJECT_DE_TYPE_GSTD_OBJ+1);
         CGStdGraphObj *obj=this.CreateNewGraphObj(type,name);
         if(obj==NULL)
           {
            CMessage::ToLog(DFUN,MSG_GRAPH_STD_OBJ_ERR_FAILED_CREATE_CLASS_OBJ);
            return;
           }
         //--- Set the object affiliation and add the created object to the list of new objects
         obj.SetBelong(GRAPH_OBJ_BELONG_NO_PROGRAM);
         if(this.m_list_new_graph_obj.Search(obj)==WRONG_VALUE)
           {
            //--- If failed to add the object to the list, inform of that, delete the object and leave
            if(!this.m_list_new_graph_obj.Add(obj))
              {
               CMessage::ToLog(DFUN_ERR_LINE,MSG_LIB_SYS_FAILED_OBJ_ADD_TO_LIST);
               delete obj;
               return;
              }
            //--- Send an event to the control program chart
            ::EventChartCustom(this.m_chart_id_main,GRAPH_OBJ_EVENT_CREATE,this.ChartID(),0,obj.Name());
           }
        }
     }

//--- save the index of the last added graphical object and the difference with the last check
   this.m_last_objects=this.m_total_objects;
   this.m_is_graph_obj_event=(bool)this.m_delta_graph_obj;
  }
//+------------------------------------------------------------------+
Hier habe ich die Anzeige von Fehlermeldungen im Journal und das Senden eines Objekterzeugungsereignisses an das Kontrollprogramm Chart hinzugefügt.
Wir fügen im öffentlichen Abschnitt der Klasse für die Sammlung grafischer Elemente die Methode hinzu, die die Objektliste der Chart-Verwaltung zurückgibt:
//--- Return the number of new graphical objects, (3) the flag of the occurred change in the list of graphical objects
   int               NewObjects(void)   const                                                            { return this.m_delta_graph_obj;       }
   bool              IsEvent(void) const                                                                 { return this.m_is_graph_obj_event;    }
//--- Return a graphical object by chart name and ID
   CGStdGraphObj    *GetStdGraphObject(const string name,const long chart_id);
//--- Return the chart management object list
   CArrayObj        *GetListChartsControl(void)                                                          { return &this.m_list_charts_control;  }
//--- Constructor
                     CGraphElementsCollection();
Die Methoden zum Erstellen von Standard-Grafikobjekten, die im vorherigen Artikel erstellt wurden, enthalten einen großen, sich wiederholenden Codeblock. Verschieben wir den in eine separate private Methode verschieben:
//--- Event handler
   void              OnChartEvent(const int id, const long &lparam, const double &dparam, const string &sparam);

private:
//--- Create a new graphical object, return the pointer to the chart management object
   CChartObjectsControl *CreateNewStdGraphObjectAndGetCtrlObj(const long chart_id,
                                                              const string name,
                                                              int subwindow,
                                                              const ENUM_OBJECT type_object,
                                                              const datetime time1,
                                                              const double price1,
                                                              const datetime time2=0,
                                                              const double price2=0,
                                                              const datetime time3=0,
                                                              const double price3=0,
                                                              const datetime time4=0,
                                                              const double price4=0,
                                                              const datetime time5=0,
                                                              const double price5=0)
                       {
                        //--- If an object with a chart ID and name is already present in the collection, inform of that and return NULL
                        if(this.IsPresentGraphObjInList(chart_id,name))
                          {
                           ::Print(DFUN,CMessage::Text(MSG_GRAPH_ELM_COLLECTION_ERR_GR_OBJ_ALREADY_EXISTS)," ChartID ",(string)chart_id,", ",name);
                           return NULL;
                          }
                        //--- If failed to create a new standard graphical object, inform of that and return NULL
                        if(!this.CreateNewStdGraphObject(chart_id,name,type_object,subwindow,time1,0))
                          {
                           ::Print(DFUN,CMessage::Text(MSG_GRAPH_STD_OBJ_ERR_FAILED_CREATE_STD_GRAPH_OBJ),StdGraphObjectTypeDescription(type_object));
                           CMessage::ToLog(::GetLastError(),true);
                           return NULL;
                          }
                        //--- If failed to get a chart management object, inform of that
                        CChartObjectsControl *ctrl=this.GetChartObjectCtrlObj(chart_id);
                        if(ctrl==NULL)
                           ::Print(DFUN,CMessage::Text(MSG_GRAPH_ELM_COLLECTION_ERR_FAILED_GET_CTRL_OBJ),(string)chart_id);
                        //--- Return the pointer to a chart management object or NULL in case of a failed attempt to get it
                        return ctrl;
                       }
//--- Add a newly created object to the list
   bool              AddCreatedObjToList(const string source,const long chart_id,const string name,CGStdGraphObj *obj)
                       {
                        bool res=true;
                        if(!this.m_list_all_graph_obj.Add(obj))
                          {
                           CMessage::ToLog(source,MSG_LIB_SYS_FAILED_OBJ_ADD_TO_LIST);
                           ::ObjectDelete(chart_id,name);
                           delete obj;
                           res=false;
                          }
                        ::ChartRedraw(chart_id);
                        return res;
                       }
public:
//--- Create the "Vertical line" graphical object
In allen Methoden zur Erstellung von Standard-Grafikobjekten wird das Operationsergebnis der Methode zurückgegeben:
public:
//--- Create the "Vertical line" graphical object
   bool              CreateLineVertical(const long chart_id,const string name,const int subwindow,const datetime time)
                       {
                        //--- Set the name and type of a created object
                        string nm=this.m_name_program+"_"+name;
                        ENUM_OBJECT type_object=OBJ_VLINE;
                        //--- Create a new graphical object and get the pointer to the chart management object
                        CChartObjectsControl *ctrl=this.CreateNewStdGraphObjectAndGetCtrlObj(chart_id,nm,subwindow,type_object,time,0);
                        if(ctrl==NULL)
                           return false;
                        //--- Create a new class object corresponding to the newly created graphical object
                        CGStdVLineObj *obj=ctrl.CreateNewGraphObj(type_object,nm);
                        if(obj==NULL)
                          {
                           ::Print(DFUN,CMessage::Text(MSG_GRAPH_STD_OBJ_ERR_FAILED_CREATE_CLASS_OBJ),StdGraphObjectTypeDescription(type_object));
                           return false;
                          }
                        //--- Set the necessary minimal parameters for an object
                        obj.SetBelong(GRAPH_OBJ_BELONG_PROGRAM);
                        obj.SetFlagSelectable(true,false);
                        obj.SetFlagSelected(true,false);
                        obj.SetObjectID(this.GetFreeGraphObjID(true));
                        obj.PropertiesCopyToPrevData();
                        //--- Return the result of adding the object to the list
                        return this.AddCreatedObjToList(DFUN,chart_id,nm,obj);
                       }
Außerdem setzen wir die Flags, die für das korrekte Funktionieren der neu geänderten Methode zum Setzen der Werte von grafischen Objekteigenschaften erforderlich sind.
Alle anderen Methoden zur Erstellung von grafischen Standardobjekten werden auf die gleiche Weise geändert. Es macht keinen Sinn, sie hier zu besprechen. Sie finden sie in den Anhängen unten.
In der Methode, die ein neues Objekt zur Verwaltung grafischer Objekte eines bestimmten Charts erstellt und zur Liste hinzufügt, implementieren Sie das Hinzufügen von Nachrichten zum Journal, wenn der Ereignissteuerungsindikator zum Chart hinzugefügt wird:
//+------------------------------------------------------------------+
//| Create a new graphical object management object                  |
//| for a specified and add it to the list                           |
//+------------------------------------------------------------------+
CChartObjectsControl *CGraphElementsCollection::CreateChartObjectCtrlObj(const long chart_id)
  {
//--- Create a new object for managing chart objects by ID
   CChartObjectsControl *obj=new CChartObjectsControl(chart_id);
//--- If the object is not created, inform of the error and return NULL
   if(obj==NULL)
     {
      ::Print(DFUN,CMessage::Text(MSG_GRAPH_ELM_COLLECTION_ERR_FAILED_CREATE_CTRL_OBJ),(string)chart_id);
      return NULL;
     }
//--- If failed to add the object to the list, inform of the error, remove the object and return NULL
   if(!this.m_list_charts_control.Add(obj))
     {
      CMessage::ToLog(DFUN,MSG_LIB_SYS_FAILED_OBJ_ADD_TO_LIST);
      delete obj;
      return NULL;
     }
   if(obj.ChartID()!=CBaseObj::GetMainChartID() && obj.CreateEventControlInd(CBaseObj::GetMainChartID()))
      if(!obj.AddEventControlInd())
        {
         CMessage::ToLog(DFUN,MSG_GRAPH_OBJ_FAILED_ADD_EVN_CTRL_INDICATOR);
         CMessage::ToLog(DFUN,::GetLastError(),true);
        }
      else
         ::Print(DFUN,CMessage::Text(MSG_GRAPH_OBJ_ADDED_EVN_CTRL_INDICATOR),obj.Symbol()," #",obj.ChartID());
//--- Return the pointer to the object that was created and added to the list
   return obj;
  }
//+------------------------------------------------------------------+
In der Methode, die die Liste aller grafischen Objekte aktualisiert, senden wir ein Ereignis zum Entfernen von grafischen Objekten, anstatt einfach im Journal das erkannte Objekt der Kollektionsliste anzuzeigen, das entfernt wurde:
//+------------------------------------------------------------------+
//| Update the list of all graphical objects                         |
//+------------------------------------------------------------------+
void CGraphElementsCollection::Refresh(void)
  {
   this.RefreshForExtraObjects();
//--- Declare variables to search for charts
   long chart_id=0;
   int i=0;
//--- In the loop by all open charts in the terminal (no more than 100)
   while(i<CHARTS_MAX)
     {
      //--- Get the chart ID
      chart_id=::ChartNext(chart_id);
      if(chart_id<0)
         break;
      //--- Get the pointer to the object for managing graphical objects
      //--- and update the list of graphical objects by chart ID
      CChartObjectsControl *obj_ctrl=this.RefreshByChartID(chart_id);
      //--- If failed to get the pointer, move on to the next chart
      if(obj_ctrl==NULL)
         continue;
      //--- If the number of objects on the chart changes
      if(obj_ctrl.IsEvent())
        {
         //--- If a graphical object is added to the chart
         if(obj_ctrl.Delta()>0)
           {
            //--- Get the list of added graphical objects and move them to the collection list
            //--- (if failed to move the object to the collection, move on to the next object)
            if(!this.AddGraphObjToCollection(DFUN_ERR_LINE,obj_ctrl))
               continue;
           }
         //--- If the graphical object has been removed
         else if(obj_ctrl.Delta()<0)
           {
            // Find an extra object in the list
            CGStdGraphObj *obj=this.FindMissingObj(chart_id);
            if(obj!=NULL)
              {
               //--- Send an event to the control program chart
               ::EventChartCustom(this.m_chart_id_main,GRAPH_OBJ_EVENT_DELETE,obj.ChartID(),0,obj.Name());
               //--- Remove the class object of a removed graphical object from the collection list
               if(!this.DeleteGraphObjFromList(obj))
                  CMessage::ToLog(DFUN,MSG_GRAPH_OBJ_FAILED_DETACH_OBJ_FROM_LIST);
              }
           }
        }
      //--- Increase the loop index
      i++;
     }
  }
//+------------------------------------------------------------------+
Im Ereignis-String-Parameter übergeben wir den Namen eines entfernten Objekts. Vielleicht werde ich das Speichern von entfernten Objekten in einer separaten Liste implementieren, sodass wir beim Empfang eines Entfernungsereignisses in der Lage sind, ein entferntes Objekt und seine Eigenschaften zu definieren, sowie es programmatisch wiederherzustellen.
In der Methode, die das Entfernen eines Chart-Fensters behandelt, sende ich auch ein Ereignis an das Kontrollprogramm Chart anstelle einer einfachen Journalmeldung:
//+------------------------------------------------------------------+
//| Handle removing the chart window                                 |
//+------------------------------------------------------------------+
void CGraphElementsCollection::RefreshForExtraObjects(void)
  {
   for(int i=this.m_list_charts_control.Total()-1;i>WRONG_VALUE;i--)
     {
      CChartObjectsControl *obj_ctrl=this.m_list_charts_control.At(i);
      if(obj_ctrl==NULL)
         continue;
      if(!this.IsPresentChartWindow(obj_ctrl.ChartID()))
        {
         long chart_id=obj_ctrl.ChartID();
         string chart_symb=obj_ctrl.Symbol();
         int total_ctrl=this.m_list_charts_control.Total();
         this.DeleteGraphObjCtrlObjFromList(obj_ctrl);
         int total_obj=this.m_list_all_graph_obj.Total();
         this.DeleteGraphObjectsFromList(chart_id);
         int del_ctrl=total_ctrl-this.m_list_charts_control.Total();
         int del_obj=total_obj-this.m_list_all_graph_obj.Total();
         ::EventChartCustom(this.m_chart_id_main,GRAPH_OBJ_EVENT_DEL_CHART,chart_id,del_obj,chart_symb);
        }
     }
  }
//+------------------------------------------------------------------+
Hier übergeben wir die ID des geschlossenen Charts, die Anzahl der mit diesem Chart entfernten grafischen Objekte und das Symbol des geschlossenen Charts in Form von Parametern.
In der Ereignisbehandlung fügen wir für die Ereignisse der Klasse der Kollektion der grafischen Elemente die Behandlung der Basisereignisse der grafischen Objekte hinzu:
//+------------------------------------------------------------------+
//| Event handler                                                    |
//+------------------------------------------------------------------+
void CGraphElementsCollection::OnChartEvent(const int id, const long &lparam, const double &dparam, const string &sparam)
  {
   CGStdGraphObj *obj=NULL;
   ushort idx=ushort(id-CHARTEVENT_CUSTOM);
   if(id==CHARTEVENT_OBJECT_CHANGE  || id==CHARTEVENT_OBJECT_DRAG    || id==CHARTEVENT_OBJECT_CLICK   ||
      idx==CHARTEVENT_OBJECT_CHANGE || idx==CHARTEVENT_OBJECT_DRAG   || idx==CHARTEVENT_OBJECT_CLICK)
     {
      //--- Calculate the chart ID
      //--- If the event ID corresponds to an event from the current chart, the chart ID is received from ChartID
      //--- If the event ID corresponds to a user event, the chart ID is received from lparam
      //--- Otherwise, the chart ID is assigned to -1
      long param=(id==CHARTEVENT_OBJECT_CLICK ? ::ChartID() : idx==CHARTEVENT_OBJECT_CLICK ? lparam : WRONG_VALUE);
      long chart_id=(param==WRONG_VALUE ? (lparam==0 ? ::ChartID() : lparam) : param);
      //--- Get the object, whose properties were changed or which was relocated,
      //--- from the collection list by its name set in sparam
      obj=this.GetStdGraphObject(sparam,chart_id);

      //--- If failed to get the object by its name, it is not on the list,
      //--- which means its name has been changed
      if(obj==NULL)
        {
         //--- Let's search the list for the object that is not on the chart
         obj=this.FindMissingObj(chart_id);
         //--- If failed to find the object here as well, exit
         if(obj==NULL)
            return;
         //--- Get the name of the renamed graphical object on the chart, which is not in the collection list
         string name_new=this.FindExtraObj(chart_id);
         //--- Send an event with the old name of an object to the control program chart and
         //--- set a new name for the collection list object, which does not correspond to any graphical object on the chart
         ::EventChartCustom(this.m_chart_id_main,GRAPH_OBJ_EVENT_RENAME,obj.ChartID(),0,obj.Name());
         obj.SetName(name_new);
        }
      //--- Update the properties of the obtained object
      //--- and check their change
      obj.PropertiesRefresh();
      obj.PropertiesCheckChanged();
     }
//--- Handle standard graphical object events
   if(idx>GRAPH_OBJ_EVENT_NO_EVENT && idx<GRAPH_OBJ_EVENTS_NEXT_CODE)
     {
      //--- Depending on the event type, display an appropriate message in the journal
      switch(idx)
        {
         case GRAPH_OBJ_EVENT_CREATE   :
           ::Print(DFUN,CMessage::Text(MSG_GRAPH_OBJ_EVN_GRAPH_OBJ_CREATE));
           obj=this.GetStdGraphObject(sparam,lparam);
           if(obj!=NULL)
              obj.PrintShort();
           break;
         case GRAPH_OBJ_EVENT_CHANGE   :
           ::Print(DFUN,CMessage::Text(MSG_GRAPH_OBJ_EVN_GRAPH_OBJ_CHANGE));
           obj=this.GetStdGraphObject(sparam,lparam);
           if(obj!=NULL)
              obj.PrintShort();
           break;
         case GRAPH_OBJ_EVENT_RENAME   :
           ::Print(DFUN,CMessage::Text(MSG_GRAPH_OBJ_EVN_GRAPH_OBJ_RENAME));
           obj=this.GetStdGraphObject(sparam,lparam);
           if(obj!=NULL)
              obj.PrintShort();
           break;
         case GRAPH_OBJ_EVENT_DELETE   :
           ::Print(DFUN,CMessage::Text(MSG_GRAPH_OBJ_EVN_GRAPH_OBJ_DELETE));
           break;
         case GRAPH_OBJ_EVENT_DEL_CHART:
           ::Print(DFUN,CMessage::Text(MSG_GRAPH_OBJ_EVN_GRAPH_OBJ_DEL_CHART),": ChartID: ",lparam,", ChartSymbol: ",sparam);
           break;
         default:
           break;
        }
     }
  }
//+------------------------------------------------------------------+
Die Logik der Methode wird in den Code-Kommentaren beschrieben. Hier habe ich eine Reaktion auf das Anklicken eines Charts hinzugefügt. Im Falle eines Doppelklicks ändert ein Objekt seinen Selektionsstatus, was zu einem Objektparameter-Änderungsereignis führt. Auf diese Weise sind wir in der Lage, Ereignisse für die Auswahl und Abwahl von Objekten zu behandeln.
Schließlich werden die bereits behandelten Ereignisse für grafische Objekte (für die Basisereignisse erstellt wurden) an dieselbe Methode weitergeleitet. Diese Basisereignisse werden im neuen Codeblock behandelt. Im Moment haben wir hier nur das Senden von Nachrichten an das Journal. In späteren Artikeln werde ich eine vollwertige Behandlung der einzelnen Ereignisse erstellen, damit das Programm in der Lage ist, das geänderte Objekt und seine Eigenschaften zu kennen und schnell darauf zuzugreifen.
Um den Umgang mit grafischen Objekten zu vereinfachen, erstellen wir die Methoden für den Umgang mit grafischen Objekten in der Hauptklasse der CEngine-Bibliothek in \MQL5\Include\DoEasy\Engine.mqh.
Um offene Charts unter Verwendung von Standard-Grafikobjektklassen zu definieren, können wir uns die Liste der Chart-Verwaltungsobjekte ansehen. Die Liste ermöglicht es uns, die IDs aller geöffneten Charts von den Objekten abzurufen und so die Möglichkeit zu erhalten, auf sie zuzugreifen. Um den Empfang der IDs im Programm zu vereinfachen, erstellen wir die Methode und füllen das ihr übergebene Array vom Typ long mit den IDs der offenen Charts, für die Kontrollobjekte erstellt werden:
//--- Launch the new pause countdown
   void                 Pause(const ulong pause_msc,const datetime time_start=0)
                          {
                           this.PauseSetWaitingMSC(pause_msc);
                           this.PauseSetTimeBegin(time_start*1000);
                           while(!this.PauseIsCompleted() && !::IsStopped()){}
                          }

//--- Return the graphical object collection
   CGraphElementsCollection *GetGraphicObjCollection(void)              { return &this.m_graph_objects; }

//--- Fill in the array with IDs of the charts opened in the terminal
   void              GraphGetArrayChartsID(long &array_charts_id[])
                       {
                        CArrayObj *list=this.m_graph_objects.GetListChartsControl();
                        if(list==NULL)
                           return;
                        ::ArrayResize(array_charts_id,list.Total());
                        ::ArrayInitialize(array_charts_id,WRONG_VALUE);
                        for(int i=0;i<list.Total();i++)
                          {
                           CChartObjectsControl *obj=list.At(i);
                           if(obj==NULL)
                              continue;
                           array_charts_id[i]=obj.ChartID();
                          }
                       }

//--- Create the "Vertical line" graphical object
Hier setzen wir sofort die Größe des übergebenen Arrays gleich der Größe der Liste der Chart-Management-Objekte und initialisieren das Array mit -1 Werten. Dies ist im Falle eines Fehlers beim Empfang des Chart-Management-Objekts in der Schleife notwendig, um -1 in der Array-Zelle zu setzen, die dem Index des Chart-Management-Objekts entspricht, das wir nicht erhalten konnten. Dies dient als Fehlersignal beim Abrufen des Objekts.
Natürlich kann ich die Array-Größe in der Schleife nur erhöhen, wenn ein Objekt erfolgreich empfangen wurde, aber der Aufruf von ArrayResize() innerhalb der Schleife verlangsamt die Leistung. Vergrößern Sie daher das Array gleich entsprechend der Listengröße. Im Falle eines Fehlers wird die entsprechende Arrayzelle -1 enthalten.
Danach wird in der Schleife durch die erhaltene Liste das nächste Chart-Verwaltungsobjekt geholt und die Chart-ID (die im Chart-Verwaltungsobjekt enthalten ist) in die Array-Zelle geschrieben, die dem Schleifenindex entspricht.
Für einen vereinfachten Zugriff auf die Methoden zur Erstellung von Standardgrafikobjekten schreiben wir die Methoden für deren Erstellung — zwei Methoden pro Objekt. Die erste Methode ruft die gleichnamige grafische Elementsammelklasse zur Erstellung eines grafischen Standardobjekts auf, während die zweite die erste Methode aufruft die aktuelle Chart ID angibt:
//--- Create the "Vertical line" graphical object bool CreateLineVertical(const long chart_id,const string name,const int subwindow,const datetime time) { return this.m_graph_objects.CreateLineVertical(chart_id,name,subwindow,time); } bool CreateLineVertical(const string name,const int subwindow,const datetime time) { return this.CreateLineVertical(::ChartID(),name,subwindow,time); } //--- Create the "Horizontal line" graphical object bool CreateLineHorizontal(const long chart_id,const string name,const int subwindow,const double price) { return this.m_graph_objects.CreateLineHorizontal(chart_id,name,subwindow,price); } bool CreateLineHorizontal(const string name,const int subwindow,const double price) { return this.CreateLineHorizontal(::ChartID(),name,subwindow,price); } //--- Create the "Trend line" graphical object bool CreateLineTrend(const long chart_id,const string name,const int subwindow, const datetime time1,const double price1,const datetime time2,const double price2) { return this.m_graph_objects.CreateLineTrend(chart_id,name,subwindow,time1,price1,time2,price2); } bool CreateLineTrend(const string name,const int subwindow, const datetime time1,const double price1,const datetime time2,const double price2) { return this.CreateLineTrend(::ChartID(),name,subwindow,time1,price1,time2,price2); } //--- Create the "Trend line by angle" graphical object bool CreateLineTrendByAngle(const long chart_id,const string name,const int subwindow, const datetime time1,const double price1,const datetime time2,const double price2, const double angle) { return this.m_graph_objects.CreateLineTrendByAngle(chart_id,name,subwindow,time1,price1,time2,price2,angle); } bool CreateLineTrendByAngle(const string name,const int subwindow, const datetime time1,const double price1,const datetime time2,const double price2, const double angle) { return this.CreateLineTrendByAngle(::ChartID(),name,subwindow,time1,price1,time2,price2,angle); } //--- Create the "Cyclic lines" graphical object bool CreateLineCycle(const long chart_id,const string name,const int subwindow, const datetime time1,const double price1,const datetime time2,const double price2) { return this.m_graph_objects.CreateLineCycle(chart_id,name,subwindow,time1,price1,time2,price2); } bool CreateLineCycle(const string name,const int subwindow, const datetime time1,const double price1,const datetime time2,const double price2) { return this.CreateLineCycle(::ChartID(),name,subwindow,time1,price1,time2,price2); } //--- Create the "Arrowed line" graphical object bool CreateLineArrowed(const long chart_id,const string name,const int subwindow, const datetime time1,const double price1,const datetime time2,const double price2) { return this.m_graph_objects.CreateLineArrowed(chart_id,name,subwindow,time1,price1,time2,price2); } bool CreateLineArrowed(const string name,const int subwindow, const datetime time1,const double price1,const datetime time2,const double price2) { return this.CreateLineArrowed(::ChartID(),name,subwindow,time1,price1,time2,price2); } //--- Create the "Equidistant channel" graphical object bool CreateChannel(const long chart_id,const string name,const int subwindow, const datetime time1,const double price1,const datetime time2,const double price2, const datetime time3,const double price3) { return this.m_graph_objects.CreateChannel(chart_id,name,subwindow,time1,price1,time2,price2,time3,price3); } bool CreateChannel(const string name,const int subwindow, const datetime time1,const double price1,const datetime time2,const double price2, const datetime time3,const double price3) { return this.CreateChannel(::ChartID(),name,subwindow,time1,price1,time2,price2,time3,price3); } //--- Create the "Standard deviation channel" graphical object bool CreateChannelStdDeviation(const long chart_id,const string name,const int subwindow, const datetime time1,const double price1,const datetime time2,const double price2, const double deviation=1.5) { return this.m_graph_objects.CreateChannelStdDeviation(chart_id,name,subwindow,time1,price1,time2,price2,deviation); } bool CreateChannelStdDeviation(const string name,const int subwindow, const datetime time1,const double price1,const datetime time2,const double price2, const double deviation=1.5) { return this.CreateChannelStdDeviation(::ChartID(),name,subwindow,time1,price1,time2,price2,deviation); } //--- Create the "Linear regression channel" graphical object bool CreateChannelRegression(const long chart_id,const string name,const int subwindow, const datetime time1,const double price1,const datetime time2,const double price2) { return this.m_graph_objects.CreateChannelRegression(chart_id,name,subwindow,time1,price1,time2,price2); } bool CreateChannelRegression(const string name,const int subwindow, const datetime time1,const double price1,const datetime time2,const double price2) { return this.CreateChannelRegression(::ChartID(),name,subwindow,time1,price1,time2,price2); } //--- Create the "Andrews' Pitchfork" graphical object bool CreatePitchforkAndrews(const long chart_id,const string name,const int subwindow, const datetime time1,const double price1,const datetime time2,const double price2, const datetime time3,const double price3) { return this.m_graph_objects.CreatePitchforkAndrews(chart_id,name,subwindow,time1,price1,time2,price2,time3,price3); } bool CreatePitchforkAndrews(const string name,const int subwindow, const datetime time1,const double price1,const datetime time2,const double price2, const datetime time3,const double price3) { return this.CreatePitchforkAndrews(::ChartID(),name,subwindow,time1,price1,time2,price2,time3,price3); } //--- Create the "Gann line" graphical object bool CreateGannLine(const long chart_id,const string name,const int subwindow, const datetime time1,const double price1,const datetime time2,const double price2,const double angle) { return this.m_graph_objects.CreateGannLine(chart_id,name,subwindow,time1,price1,time2,price2,angle); } bool CreateGannLine(const string name,const int subwindow, const datetime time1,const double price1,const datetime time2,const double price2,const double angle) { return this.CreateGannLine(::ChartID(),name,subwindow,time1,price1,time2,price2,angle); } //--- Create the "Gann fan" graphical object bool CreateGannFan(const long chart_id,const string name,const int subwindow, const datetime time1,const double price1,const datetime time2,const double price2, const ENUM_GANN_DIRECTION direction,const double scale) { return this.m_graph_objects.CreateGannFan(chart_id,name,subwindow,time1,price1,time2,price2,direction,scale); } bool CreateGannFan(const string name,const int subwindow, const datetime time1,const double price1,const datetime time2,const double price2, const ENUM_GANN_DIRECTION direction,const double scale) { return this.CreateGannFan(::ChartID(),name,subwindow,time1,price1,time2,price2,direction,scale); } //--- Create the "Gann grid" graphical object bool CreateGannGrid(const long chart_id,const string name,const int subwindow, const datetime time1,const double price1,const datetime time2, const ENUM_GANN_DIRECTION direction,const double scale) { return this.m_graph_objects.CreateGannGrid(chart_id,name,subwindow,time1,price1,time2,direction,scale); } bool CreateGannGrid(const string name,const int subwindow, const datetime time1,const double price1,const datetime time2, const ENUM_GANN_DIRECTION direction,const double scale) { return this.CreateGannGrid(::ChartID(),name,subwindow,time1,price1,time2,direction,scale); } //--- Create the "Fibo levels" graphical object bool CreateFiboLevels(const long chart_id,const string name,const int subwindow, const datetime time1,const double price1,const datetime time2,const double price2) { return this.m_graph_objects.CreateFiboLevels(chart_id,name,subwindow,time1,price1,time2,price2); } bool CreateFiboLevels(const string name,const int subwindow, const datetime time1,const double price1,const datetime time2,const double price2) { return this.CreateFiboLevels(::ChartID(),name,subwindow,time1,price1,time2,price2); } //--- Create the "Fibo Time Zones" graphical object bool CreateFiboTimeZones(const long chart_id,const string name,const int subwindow, const datetime time1,const double price1,const datetime time2,const double price2) { return this.m_graph_objects.CreateFiboTimeZones(chart_id,name,subwindow,time1,price1,time2,price2); } bool CreateFiboTimeZones(const string name,const int subwindow, const datetime time1,const double price1,const datetime time2,const double price2) { return this.CreateFiboTimeZones(::ChartID(),name,subwindow,time1,price1,time2,price2); } //--- Create the "Fibo fan" graphical object bool CreateFiboFan(const long chart_id,const string name,const int subwindow, const datetime time1,const double price1,const datetime time2,const double price2) { return this.m_graph_objects.CreateFiboFan(chart_id,name,subwindow,time1,price1,time2,price2); } bool CreateFiboFan(const string name,const int subwindow, const datetime time1,const double price1,const datetime time2,const double price2) { return this.CreateFiboFan(::ChartID(),name,subwindow,time1,price1,time2,price2); } //--- Create the "Fibo arc" graphical object bool CreateFiboArc(const long chart_id,const string name,const int subwindow, const datetime time1,const double price1,const datetime time2,const double price2, const double scale,const bool ellipse) { return this.m_graph_objects.CreateFiboArc(chart_id,name,subwindow,time1,price1,time2,price2,scale,ellipse); } bool CreateFiboArc(const string name,const int subwindow, const datetime time1,const double price1,const datetime time2,const double price2, const double scale,const bool ellipse) { return this.CreateFiboArc(::ChartID(),name,subwindow,time1,price1,time2,price2,scale,ellipse); } //--- Create the "Fibo channel" graphical object bool CreateFiboChannel(const long chart_id,const string name,const int subwindow, const datetime time1,const double price1,const datetime time2,const double price2,const datetime time3,const double price3) { return this.m_graph_objects.CreateFiboChannel(chart_id,name,subwindow,time1,price1,time2,price2,time3,price3); } bool CreateFiboChannel(const string name,const int subwindow, const datetime time1,const double price1,const datetime time2,const double price2,const datetime time3,const double price3) { return this.CreateFiboChannel(::ChartID(),name,subwindow,time1,price1,time2,price2,time3,price3); } //--- Create the "Fibo extension" graphical object bool CreateFiboExpansion(const long chart_id,const string name,const int subwindow, const datetime time1,const double price1,const datetime time2,const double price2,const datetime time3,const double price3) { return this.m_graph_objects.CreateFiboExpansion(chart_id,name,subwindow,time1,price1,time2,price2,time3,price3); } bool CreateFiboExpansion(const string name,const int subwindow, const datetime time1,const double price1,const datetime time2,const double price2,const datetime time3,const double price3) { return this.CreateFiboExpansion(::ChartID(),name,subwindow,time1,price1,time2,price2,time3,price3); } //--- Create the "Elliott 5 waves" graphical object bool CreateElliothWave5(const long chart_id,const string name,const int subwindow, const datetime time1,const double price1,const datetime time2,const double price2, const datetime time3,const double price3,const datetime time4,const double price4, const datetime time5,const double price5,const ENUM_ELLIOT_WAVE_DEGREE degree, const bool draw_lines) { return this.m_graph_objects.CreateElliothWave5(chart_id,name,subwindow,time1,price1,time2,price2,time3,price3,time4,price4,time5,price5,degree,draw_lines); } bool CreateElliothWave5(const string name,const int subwindow, const datetime time1,const double price1,const datetime time2,const double price2, const datetime time3,const double price3,const datetime time4,const double price4, const datetime time5,const double price5,const ENUM_ELLIOT_WAVE_DEGREE degree, const bool draw_lines) { return this.CreateElliothWave5(::ChartID(),name,subwindow,time1,price1,time2,price2,time3,price3,time4,price4,time5,price5,degree,draw_lines); } //--- Create the "Elliott 3 waves" graphical object bool CreateElliothWave3(const long chart_id,const string name,const int subwindow, const datetime time1,const double price1,const datetime time2, const double price2,const datetime time3,const double price3, const ENUM_ELLIOT_WAVE_DEGREE degree,const bool draw_lines) { return this.m_graph_objects.CreateElliothWave3(chart_id,name,subwindow,time1,price1,time2,price2,time3,price3,degree,draw_lines); } bool CreateElliothWave3(const string name,const int subwindow, const datetime time1,const double price1,const datetime time2, const double price2,const datetime time3,const double price3, const ENUM_ELLIOT_WAVE_DEGREE degree,const bool draw_lines) { return this.CreateElliothWave3(::ChartID(),name,subwindow,time1,price1,time2,price2,time3,price3,degree,draw_lines); } //--- Create the Rectangle graphical object bool CreateRectangle(const long chart_id,const string name,const int subwindow, const datetime time1,const double price1,const datetime time2,const double price2) { return this.m_graph_objects.CreateRectangle(chart_id,name,subwindow,time1,price1,time2,price2); } bool CreateRectangle(const string name,const int subwindow, const datetime time1,const double price1,const datetime time2,const double price2) { return this.CreateRectangle(::ChartID(),name,subwindow,time1,price1,time2,price2); } //--- Create the Triangle graphical object bool CreateTriangle(const long chart_id,const string name,const int subwindow, const datetime time1,const double price1,const datetime time2,const double price2,const datetime time3,const double price3) { return this.m_graph_objects.CreateTriangle(chart_id,name,subwindow,time1,price1,time2,price2,time3,price3); } bool CreateTriangle(const string name,const int subwindow, const datetime time1,const double price1,const datetime time2,const double price2,const datetime time3,const double price3) { return this.CreateTriangle(::ChartID(),name,subwindow,time1,price1,time2,price2,time3,price3); } //--- Create the Ellipse graphical object bool CreateEllipse(const long chart_id,const string name,const int subwindow, const datetime time1,const double price1,const datetime time2,const double price2,const datetime time3,const double price3) { return this.m_graph_objects.CreateEllipse(chart_id,name,subwindow,time1,price1,time2,price2,time3,price3); } bool CreateEllipse(const string name,const int subwindow, const datetime time1,const double price1,const datetime time2,const double price2,const datetime time3,const double price3) { return this.CreateEllipse(::ChartID(),name,subwindow,time1,price1,time2,price2,time3,price3); } //--- Create the "Thumb up" graphical object bool CreateThumbUp(const long chart_id,const string name,const int subwindow,const datetime time,const double price) { return this.m_graph_objects.CreateThumbUp(chart_id,name,subwindow,time,price); } bool CreateThumbUp(const string name,const int subwindow,const datetime time,const double price) { return this.CreateThumbUp(::ChartID(),name,subwindow,time,price); } //--- Create the "Thumb down" graphical object bool CreateThumbDown(const long chart_id,const string name,const int subwindow,const datetime time,const double price) { return this.m_graph_objects.CreateThumbDown(chart_id,name,subwindow,time,price); } bool CreateThumbDown(const string name,const int subwindow,const datetime time,const double price) { return this.CreateThumbDown(::ChartID(),name,subwindow,time,price); } //--- Create the "Arrow up" graphical object bool CreateArrowUp(const long chart_id,const string name,const int subwindow,const datetime time,const double price) { return this.m_graph_objects.CreateArrowUp(chart_id,name,subwindow,time,price); } bool CreateArrowUp(const string name,const int subwindow,const datetime time,const double price) { return this.CreateArrowUp(::ChartID(),name,subwindow,time,price); } //--- Create the "Arrow down" graphical object bool CreateArrowDown(const long chart_id,const string name,const int subwindow,const datetime time,const double price) { return this.m_graph_objects.CreateArrowDown(chart_id,name,subwindow,time,price); } bool CreateArrowDown(const string name,const int subwindow,const datetime time,const double price) { return this.CreateArrowDown(::ChartID(),name,subwindow,time,price); } //--- Create the Stop graphical object bool CreateSignalStop(const long chart_id,const string name,const int subwindow,const datetime time,const double price) { return this.m_graph_objects.CreateSignalStop(chart_id,name,subwindow,time,price); } bool CreateSignalStop(const string name,const int subwindow,const datetime time,const double price) { return this.CreateSignalStop(::ChartID(),name,subwindow,time,price); } //--- Create the "Check mark" graphical object bool CreateSignalCheck(const long chart_id,const string name,const int subwindow,const datetime time,const double price) { return this.m_graph_objects.CreateSignalCheck(chart_id,name,subwindow,time,price); } bool CreateSignalCheck(const string name,const int subwindow,const datetime time,const double price) { return this.CreateSignalCheck(::ChartID(),name,subwindow,time,price); } //--- Create the "Left price label" graphical object bool CreatePriceLabelLeft(const long chart_id,const string name,const int subwindow,const datetime time,const double price) { return this.m_graph_objects.CreatePriceLabelLeft(chart_id,name,subwindow,time,price); } bool CreatePriceLabelLeft(const string name,const int subwindow,const datetime time,const double price) { return this.CreatePriceLabelLeft(::ChartID(),name,subwindow,time,price); } //--- Create the "Right price label" graphical object bool CreatePriceLabelRight(const long chart_id,const string name,const int subwindow,const datetime time,const double price) { return this.m_graph_objects.CreatePriceLabelRight(chart_id,name,subwindow,time,price); } bool CreatePriceLabelRight(const string name,const int subwindow,const datetime time,const double price) { return this.CreatePriceLabelRight(::ChartID(),name,subwindow,time,price); } //--- Create the Buy graphical object bool CreateSignalBuy(const long chart_id,const string name,const int subwindow,const datetime time,const double price) { return this.m_graph_objects.CreateSignalBuy(chart_id,name,subwindow,time,price); } bool CreateSignalBuy(const string name,const int subwindow,const datetime time,const double price) { return this.CreateSignalBuy(::ChartID(),name,subwindow,time,price); } //--- Create the Sell graphical object bool CreateSignalSell(const long chart_id,const string name,const int subwindow,const datetime time,const double price) { return this.m_graph_objects.CreateSignalSell(chart_id,name,subwindow,time,price); } bool CreateSignalSell(const string name,const int subwindow,const datetime time,const double price) { return this.CreateSignalSell(::ChartID(),name,subwindow,time,price); } //--- Create the Arrow graphical object bool CreateArrow(const long chart_id,const string name,const int subwindow,const datetime time,const double price, const uchar arrow_code,const ENUM_ARROW_ANCHOR anchor) { return this.m_graph_objects.CreateArrow(chart_id,name,subwindow,time,price,arrow_code,anchor); } bool CreateArrow(const string name,const int subwindow,const datetime time,const double price, const uchar arrow_code,const ENUM_ARROW_ANCHOR anchor) { return this.CreateArrow(::ChartID(),name,subwindow,time,price,arrow_code,anchor); } //--- Create the Text graphical object bool CreateText(const long chart_id,const string name,const int subwindow,const datetime time,const double price, const string text,const int size,const ENUM_ANCHOR_POINT anchor_point,const double angle) { return this.m_graph_objects.CreateText(chart_id,name,subwindow,time,price,text,size,anchor_point,angle); } bool CreateText(const string name,const int subwindow,const datetime time,const double price, const string text,const int size,const ENUM_ANCHOR_POINT anchor_point,const double angle) { return this.CreateText(::ChartID(),name,subwindow,time,price,text,size,anchor_point,angle); } //--- Create the "Text label" graphical object bool CreateTextLabel(const long chart_id,const string name,const int subwindow,const int x,const int y, const string text,const int size,const ENUM_BASE_CORNER corner, const ENUM_ANCHOR_POINT anchor_point,const double angle) { return this.m_graph_objects.CreateTextLabel(chart_id,name,subwindow,x,y,text,size,corner,anchor_point,angle); } bool CreateTextLabel(const string name,const int subwindow,const int x,const int y, const string text,const int size,const ENUM_BASE_CORNER corner, const ENUM_ANCHOR_POINT anchor_point,const double angle) { return this.CreateTextLabel(::ChartID(),name,subwindow,x,y,text,size,corner,anchor_point,angle); } //--- Create the Button graphical object bool CreateButton(const long chart_id,const string name,const int subwindow,const int x,const int y,const int w,const int h, const ENUM_BASE_CORNER corner,const int font_size,const bool button_state) { return this.m_graph_objects.CreateButton(chart_id,name,subwindow,x,y,w,h,corner,font_size,button_state); } bool CreateButton(const string name,const int subwindow,const int x,const int y,const int w,const int h, const ENUM_BASE_CORNER corner,const int font_size,const bool button_state) { return this.CreateButton(::ChartID(),name,subwindow,x,y,w,h,corner,font_size,button_state); } //--- Create the Chart graphical object bool CreateChart(const long chart_id,const string name,const int subwindow,const int x,const int y,const int w,const int h, const ENUM_BASE_CORNER corner,const int scale,const string symbol,const ENUM_TIMEFRAMES timeframe) { return this.m_graph_objects.CreateChart(chart_id,name,subwindow,x,y,w,h,corner,scale,symbol,timeframe); } bool CreateChart(const string name,const int subwindow,const int x,const int y,const int w,const int h, const ENUM_BASE_CORNER corner,const int scale,const string symbol,const ENUM_TIMEFRAMES timeframe) { return this.CreateChart(::ChartID(),name,subwindow,x,y,w,h,corner,scale,symbol,timeframe); } //--- Create the Bitmap graphical object bool CreateBitmap(const long chart_id,const string name,const int subwindow,const datetime time,const double price, const string image1,const string image2,const ENUM_ANCHOR_POINT anchor) { return this.m_graph_objects.CreateBitmap(chart_id,name,subwindow,time,price,image1,image2,anchor); } bool CreateBitmap(const string name,const int subwindow,const datetime time,const double price, const string image1,const string image2,const ENUM_ANCHOR_POINT anchor) { return this.CreateBitmap(::ChartID(),name,subwindow,time,price,image1,image2,anchor); } //--- Create the "Bitmap label" graphical object bool CreateBitmapLabel(const long chart_id,const string name,const int subwindow,const int x,const int y,const int w,const int h, const string image1,const string image2,const ENUM_BASE_CORNER corner,const ENUM_ANCHOR_POINT anchor, const bool state) { return this.m_graph_objects.CreateBitmapLabel(chart_id,name,subwindow,x,y,w,h,image1,image2,corner,anchor,state); } bool CreateBitmapLabel(const string name,const int subwindow,const int x,const int y,const int w,const int h, const string image1,const string image2,const ENUM_BASE_CORNER corner,const ENUM_ANCHOR_POINT anchor, const bool state) { return this.CreateBitmapLabel(::ChartID(),name,subwindow,x,y,w,h,image1,image2,corner,anchor,state); } //--- Create the "Input field" graphical object bool CreateEditField(const long chart_id,const string name,const int subwindow,const int x,const int y,const int w,const int h, const int font_size,const ENUM_BASE_CORNER corner,const ENUM_ALIGN_MODE align,const bool readonly) { return this.m_graph_objects.CreateEditField(chart_id,name,subwindow,x,y,w,h,font_size,corner,align,readonly); } bool CreateEditField(const string name,const int subwindow,const int x,const int y,const int w,const int h, const int font_size,const ENUM_BASE_CORNER corner,const ENUM_ALIGN_MODE align,const bool readonly) { return this.CreateEditField(::ChartID(),name,subwindow,x,y,w,h,font_size,corner,align,readonly); } //--- Create the "Economic calendar event" graphical object bool CreateCalendarEvent(const long chart_id,const string name,const int subwindow,const datetime time) { return this.m_graph_objects.CreateCalendarEvent(chart_id,name,subwindow,time); } bool CreateCalendarEvent(const string name,const int subwindow,const datetime time) { return this.CreateCalendarEvent(::ChartID(),name,subwindow,time); } //--- Create the "Rectangular label" graphical object bool CreateRectangleLabel(const long chart_id,const string name,const int subwindow,const int x,const int y,const int w,const int h, const ENUM_BASE_CORNER corner,const ENUM_BORDER_TYPE border) { return this.m_graph_objects.CreateRectangleLabel(chart_id,name,subwindow,x,y,w,h,corner,border); } bool CreateRectangleLabel(const string name,const int subwindow,const int x,const int y,const int w,const int h, const ENUM_BASE_CORNER corner,const ENUM_BORDER_TYPE border) { return this.CreateRectangleLabel(::ChartID(),name,subwindow,x,y,w,h,corner,border); } //--- Constructor/destructor CEngine(); ~CEngine();
Dies sind derzeit alle Verbesserungen, die für die Schaffung der grundlegenden Funktionen zur Verfolgung von Ereignissen in grafischen Objekten erforderlich sind.
Test
Um den Test durchzuführen, verwende ich den EA aus dem vorherigen Artikel und speichere ihn in \MQL5\Experts\TestDoEasy\Part90\ als TestDoEasyPart90.mq5.
Im vorherigen Artikel haben wir eine vertikale Linie erstellt, wenn wir bei gedrückter Strg-Taste auf einen Chart klicken. Jetzt werden wir sie für alle geöffneten Charts im Terminal erstellen.
In den Code-Block für die Chart-Klickbehandlung durch OnChartEvent() fügen wir den Code zum Füllen des Arrays mit den IDs aller offenen Charts ein. In der Schleife durch das erhaltene Array, erstellen wir eine vertikale Linie auf jedem der Charts:
   if(id==CHARTEVENT_CLICK)
     {
      if(!IsCtrlKeyPressed())
         return;
      datetime time=0;
      double price=0;
      int sw=0;
      if(ChartXYToTimePrice(ChartID(),(int)lparam,(int)dparam,sw,time,price))
        {
         long array[];
         engine.GraphGetArrayChartsID(array);
         for(int i=0;i<ArraySize(array);i++)
            engine.CreateLineVertical(array[i],"LineVertical",0,time);
        }
     }
   engine.GetGraphicObjCollection().OnChartEvent(id,lparam,dparam,sparam);

  }
//+------------------------------------------------------------------+
Kompilieren Sie den EA und starten Sie ihn auf dem Chart, nachdem Sie einen anderen Chart geöffnet und beide Charts horizontal platziert haben. Wenn Sie auf einen Chart mit einem EA klicken, werden vertikale Linien erzeugt — eine Linie für jeden Chart. Ändern Sie nun die Eigenschaften der Linien und sehen Sie sich an, wie die Meldungen über erhaltene Ereignisse im Journal angezeigt werden:
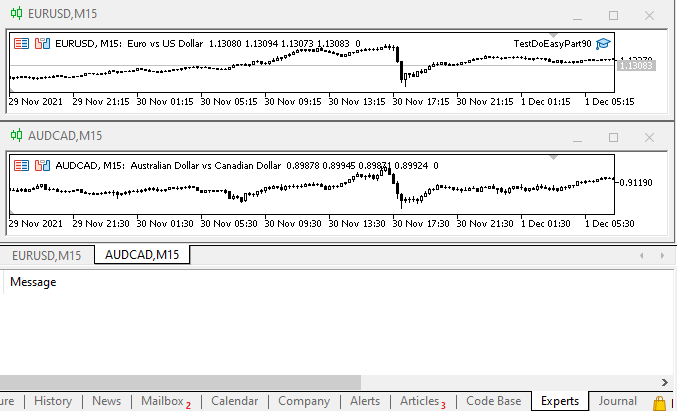
Wie wir sehen können, werden Meldungen zu Objektereignissen im Journal angezeigt. Bei der programmatischen Erstellung von Objekten wird das Objekterstellungsereignis nicht erzeugt, da der Programmierer bereits weiß, zu welchem Zeitpunkt ein grafisches Objekt erstellt wird. Es besteht daher keine Notwendigkeit, diesen Umstand durch Senden des Ereignisses zu duplizieren.
Natürlich ist eine einfache Darstellung der allgemeinen Meldungen im Journal für die Behandlung von Ereignissen nicht ausreichend. Aber das sind nur die Meldungen über Basisereignisse, deren Parameter alle Daten über ein später definiertes Ereignis enthalten.
Was kommt als Nächstes?
Im nächsten Artikel werde ich meine Arbeit an grafischen Objektereignissen fortsetzen und die Behandlung jedes erhaltenen Ereignisses implementieren.
*Frühere Artikel dieser Serie:
Grafiken in der Bibliothek DoEasy (Teil 86): Grafische Objektkollektion - Verwaltung der Eigenschaftsänderungen
Grafiken in der Bibliothek DoEasy (Teil 87): Grafische Kollektion - Verwaltung der Änderungen von Eigenschaften von Objekten auf allen offenen Charts
Grafiken in der Bibliothek DoEasy (Teil 88): Grafische Objektkollektion — zweidimensionales dynamisches Array zur Speicherung der sich dynamisch ändernden Objekteigenschaften
Grafiken in der Bibliothek DoEasy (Teil 89): Programmieren von grafischen Standardobjekten, grundlegende Funktionsweise
Übersetzt aus dem Russischen von MetaQuotes Ltd.
Originalartikel: https://www.mql5.com/ru/articles/10139
Warnung: Alle Rechte sind von MetaQuotes Ltd. vorbehalten. Kopieren oder Vervielfältigen untersagt.
Dieser Artikel wurde von einem Nutzer der Website verfasst und gibt dessen persönliche Meinung wieder. MetaQuotes Ltd übernimmt keine Verantwortung für die Richtigkeit der dargestellten Informationen oder für Folgen, die sich aus der Anwendung der beschriebenen Lösungen, Strategien oder Empfehlungen ergeben.

 Kombinatorik und Wahrscheinlichkeitsrechnung für den Handel (Teil V): Kurvenanalyse
 Kombinatorik und Wahrscheinlichkeitsrechnung für den Handel (Teil IV): Bernoulli-Logik
 Matrizen und Vektoren in MQL5
- Freie Handelsapplikationen
- Über 8.000 Signale zum Kopieren
- Wirtschaftsnachrichten für die Lage an den Finanzmärkte
Sie stimmen der Website-Richtlinie und den Nutzungsbedingungen zu.