
3つのラインブレイクチャートを作成するためのインディケータ
はじめに
先行記事では ポイント&フィギュア、カギ足およびレンコチャートを考察しました。20世紀のチャートについてのシリーズを続け、今回は3つのラインブレイクチャート、正確には、プログラムコードを用いたその実装についてお話します。このチャートの出自についてはほとんど情報がありません。私は日本で始まったのではないかと思っています。USA では人は1994年に出版された Steve Nison 氏の著書"Beyond Candlesticks" by からそれを学びました
上記チャート同様、3つのラインブレイクチャートを作成する際、時間範囲は考慮されません。新たに形成される特定のタイムフレームの終値を基にしており、それにより前の変動に関して価格のマイナー変動にフィルターを描けることができるのです。
Steve Nison 氏は著書 "Beyond Candlesticks"の中でこのチャートをプロットするうえで11の原則を説明しています(p. 185)。それを私は3個にまとめました。
- 原則 No.1:作成のために開始価格を選択し、マーケットの上下により上昇線または下降線を引く。それが新しい最大値、最小値をマークします。
- 原則 No.2:新しい価格が最低値より落ちる、または最大値を超えるとき、下降線または上昇線を描く。
- 原則 No.3:前回の動きと逆方向の線を引くには、最小値または最大値を横切る必要がある。同時に、複数の同一ラインがある場合、最小値/最大値はそのうちの2つ(連続した同一ラインが2本ある場合)または3つ(連続した同一ラインが3本以上ある場合)を基に計算されます。
履歴データに基づく古典的チャートの作成例を詳しくみます(図1)。
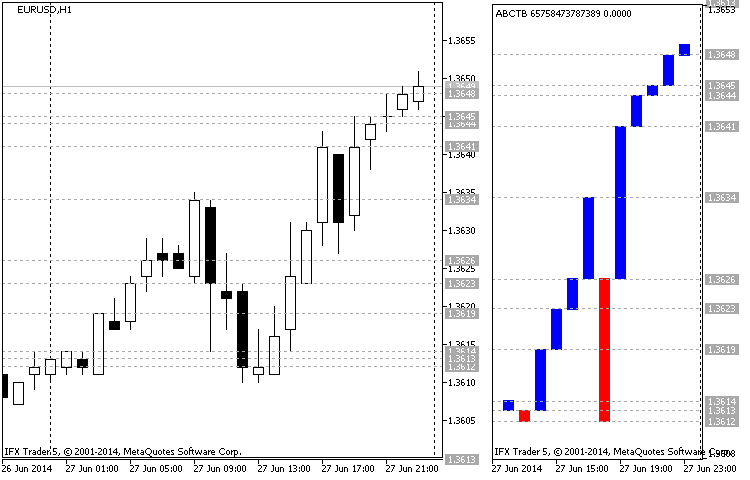
図1 3つのラインブレイクチャート例(EURUSD H1 27.06.2014)
図1は左側にろうそく足チャートを、右側に3つのラインブレイクチャートを表示しています。これはEURUSD についてタイムフレーム H1 の チャートです。チャートの開始日は2014年6月27日、価格は 1.3613(ろうそくのクロース時刻は 00:00)、ろうそく(01:00)は1.3614でクローズしています。このとき3つのラインブレイクチャートの最初の下降線を形成しています。続くベア方向のろうそく(02:00)は上昇ラインを形成し、1.3612(終値は前回の最小値より低くなっています) でクローズしています。
それからブルのろうそく足が価格を 1.3619 (03:00) マークに向かって動かしています。このとき新しい最大値とラインを形成しています。04:00 のろうそくは最小値より下がらず構成に影響はありませんでした。05:00 のろうそくは1.3623 でクローズし、新しい最大値(新しい上昇ライン)をマークしています。
ここで下降トレンドを伸ばすために、2つの最小値(1.3613)を渡す必要がありますが、ブルは叔父ションをあきらめず、新しい最大値1.3626 (06:00)を形成します。それからブルは2時間上昇トレンドを逆行しようとしていますが、1.3634 (09:00)で達成された新しい最大値を持つ同じトレンドが継続します。ブルが牽引しています。ここで下降ラインを描くためには3つの最小値(1.3626;1.3623 と 1.3619)が渡される必要があります。
みてのとおり、次の3時間はベアがマーケットを引継ぎ、1.3612 (12:00)ポイントまで下げています。それは新しい上昇ラインに反映されています。ただし、次の5時間、ブルがポジションを奪い返し、マーケットを1.3641ポイントまで戻し、前回の最大値を 1.3626で渡し、17:00に新しい上昇ラインを形成しています。ベアは 18:00 に前回の最小値を渡すのを失敗し、続く5時間にブルが1.3649ポイントまでマーケットを上げ、毎時新しい上昇ラインを形成しています。
チャート作成の基礎
コードを取得する前に、インディケータそのものについてお話し、その他との差別化のポイントとどのようにそれを行うか明確にします。その他のインディケータ同様、3つのラインブレイクが効率的なマーケット分析を促し新しい戦略を模索するために作られたのは明白です。みなさんが、何か変わっている点があるのか知りたいとお思いなのはわかっています。実際数点あります。このインディケータでは計算のために価格タイプを変更できます。それは4つのバー価格すべてに対応しています。古いタイプは1つの価格タイプ対応でチャート構成がなされていますが、最新のものは4つの価格タイプ(open、high、low、close)すべてに対応するようになっています。それはラインに『ヒゲ』を追加し、日本式のろうそく足のように見せることで古典的なチャート構造の外観を変えます。それによりチャートの視覚に加わるものです。
近代化されたバージョンは優先価格で不足価格を代用するオンタイムのデータ同期化の設定機能を備えています。
近代化されたチャートタイプの構造は図2に表示しています。
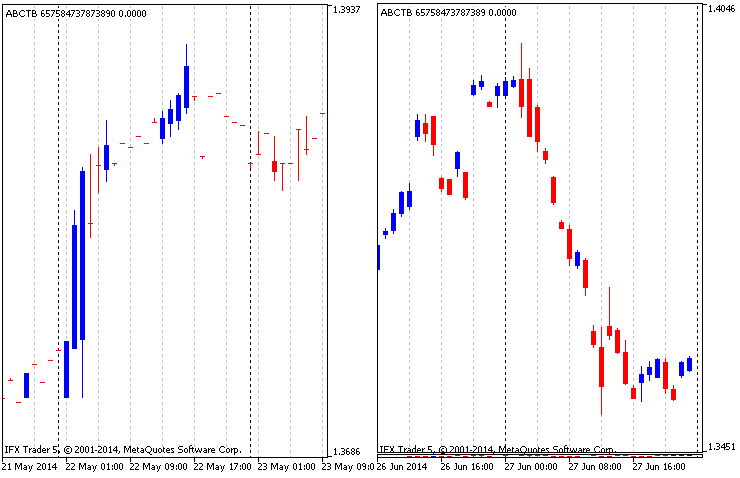
図2 4つの価格タイプに基づく修正済みチャート
近代化された構造は異なる価格タイプの3つのラインブレイクチャートを4つ組み合わせているので、価格間の不一致を見つけるのは当然です。それを避けるには、オンタイムの同期が必要となります。価格同期化のバリエーションは2つあります。完全同期(図2の右)と部分同期(図2の左)です。完全同期はフィルターにかけられた部分同期です。ここえデータはすべてチャート上に描かれ、不足データは設定で指定される優先価格で代用されます。完全同期モードでは不足データはただ省略され、完全なデータセットを持つろうそく足だけが描かれます。
その他の改良点はピリオドセパレータです。これはシグナルの分割が便利なように導入されました。ご承知のとおり、ピリオドセパレータはチャート設定で有効にすることができます。インディケータではそれは設定で指定されるタイムフレームによって変化します。期間が縦の破線で分けられる MetaTrader 5チャートとは異なり、このインディケータでは新しい期間はライン色(図3のろうそく)を変えることで表現されます。
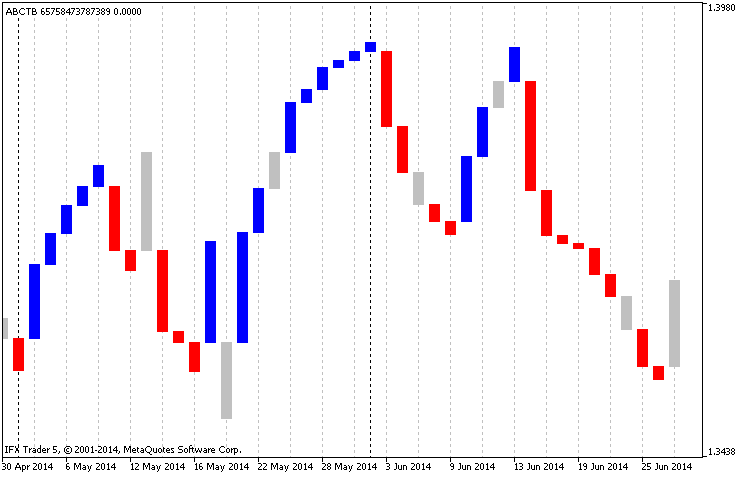
図3 インディケータのピリオドセパレータ
もう一つの追加事項は、テクニカルインディケータr iMAの導入です。それはメインチャートの価格を基に構築されますが、オンタイムでインディケータデータと同期します。そのためデータは移動平均によってフィルターにかけられます(図4)。
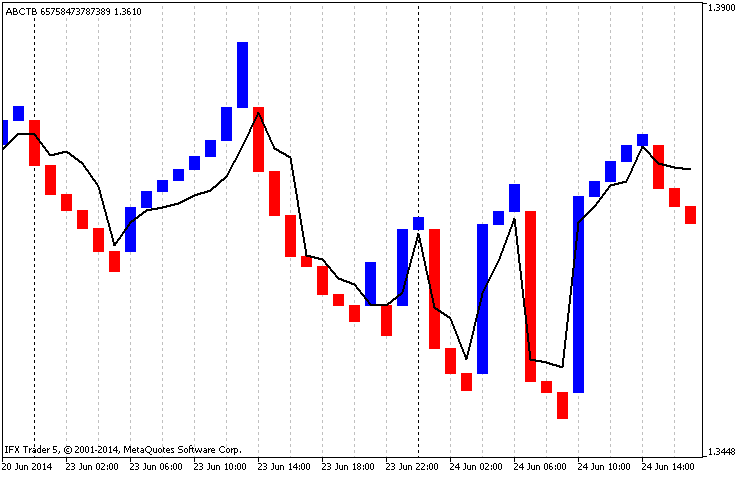
図4 内部移動平均
このインディケータはラインを描くポイントの最小の移動と逆転に必要なライン数を設定する機能も備えています。それはフィルターの役目をします。
インディケータコード
インディケータのアルゴリズムはかなりシンプルで、3段階です。データのコピー、コピーされたデータを基にした計算、インディケータバッファの書き込み(受け取りデータを基にチャート作成)です。コードは関数同士または入力データと相互連携する関数に分けられます。コードを詳しくみていきます。
1. インディケータの入力パラメータ
インディケータのプリアンブルにはグラフィック構成の宣言が入っています。インディケータにはそれが2つあります。:チャート"ABCTB" (DRAW_COLOR_CANDLES) と追加の移動平均"LINE_TLB" (DRAW_LINE)です。したがって、バッファは6個ということです。それからインターフェースの設定とそれ自体の設定を改善する enumタイプのデータが続きます。
- magic_numb -マジックナンバーのタイプは longです。それはインディケータを表記するユニークな数字です。必要に応じ、いくつかの修正で string タイプに変換可能です。
- time_frame -計算時間範囲はENUM_TIMEFRAMESタイプで、メインパラメータ(インディケータのタイムフレーム)です。
- time_redraw ―チャート更新間隔。タイプは ENUM_TIMEFRAMESです。それはチャート再計算が行われる間のタイムフレームです。チャートを速く再作成するにはキーボードの "R" キーを押します。インディケータの統合制御です。
- first_date_start -開始日付。タイプは datetime。これはデータコピーとチャート化を開始するポイントであるメインパラメータです。
- chart_price-計算用の価格タイプ(0-クローズ、1-オープン、2-高、3-低)。古いタイプのチャート構造では価格タイプを一つ選択する必要があります。すでにお話したとおり、このパラメータは修正済み構造が有効な場合無視されます。
- step_min_f -新しい行(>0, type int)に対する最小ステップまたはライン描写のために必要なジャンプ。
- line_to_back_f -逆転を表示するライン数(>0, type int) 。古いタイプは逆転を表示するのに3本のラインを提案します。
- chart_type-チャート構造タイプ(0-古い、1-修正後)、タイプ 選択。それは構造タイプ間の切り替えです。
- chart_color_period-新しい期間開始時の色変更(booleanタイプ)。新しい期間開始時にライン色変更に使用します。
- chart_synchronization -完全同期でのみチャートを作成(boolean タイプ。真であればチャート作成前に不足値をすべてドロップして完全同期が起こります)。
- chart_priority_close-終値の優先順位(タイプselect、4つのバリエーションがあります)。これは部分同期で終値の優先順位を指摘し、完全同期では無視されます。
- chart_priority_open -始値の優先順位ここでも同様です。
- chart_priority_high -高値の優先順位ここでも同様です。
- chart_priority_low-安値の優先順位ここでも同様です。
- ma_draw-平均値を描きます(booleanタイプ。真であれば移動平均を描きます。)
- ma_price-平均を構築するための価格タイプ。 ENUM_APPLIED_PRICEの一つの可能性があります。
- ma_method-構造タイプ。 ENUM_MA_METHODの一つの可能性があります。
- ma_period-移動平均期間を平均化します。
それからバッファ配列、変数、計算に必要なストラクチャを宣言します。
//+------------------------------------------------------------------+
//|                                                        ABCTB.mq5 |
//|                                 "Azotskiy Aktiniy ICQ:695710750" |
//|                        "" |
//+------------------------------------------------------------------+
// ABCTB - Auto Build Chart Three Line Break
#property copyright "Azotskiy Aktiniy ICQ:695710750"
#property link      ""
#property version   "1.00"
#property indicator_separate_window
#property indicator_buffers 6
#property indicator_plots   2
//--- plot ABCTB
#property indicator_label1  "ABCTB"
#property indicator_type1   DRAW_COLOR_CANDLES
#property indicator_color1  clrBlue,clrRed,clrGreenYellow
#property indicator_style1  STYLE_SOLID
#property indicator_width1  1
//--- plot LINE_TLB
#property indicator_label2  "LINE_TLB"
#property indicator_type2   DRAW_LINE
#property indicator_color2  clrRed
#property indicator_style2  STYLE_SOLID
#property indicator_width2  1
//--- Price type for calculation
enum type_price
  {
   close=0, // Close
   open=1,  // Open
   high=2,  // Hight
   low=3,   // Low
  };
//--- type of chart construction
enum type_build
  {
   classic=0,  // Classic
   modified=1, // Modified
  };
//--- priority
enum priority
  {
   highest_t=4, // Highest
   high_t=3,    // High
   medium_t=2,  // Medium
   low_t=1,     // Low
  };
//--- input parameters
input long               magic_numb=65758473787389;                // Magic number
input ENUM_TIMEFRAMES    time_frame=PERIOD_CURRENT;                // Calculation time range
input ENUM_TIMEFRAMES    time_redraw=PERIOD_M1;                    // Period of chart updates
input datetime           first_date_start=D'2013.03.13 00:00:00';  // Start date
input type_price         chart_price=close;                        // Price type for calculation (0-Close, 1-Open, 2-High, 3-Low)
input int                step_min_f=4;                             // Minimum step for a new column (>0)
input int                line_to_back_f=3;                         // Number of lines to display a reversal(>0)
input type_build         chart_type=classic;                       // Type of chart construction (0-classic, 1-modified)
input bool               chart_color_period=true;                  // Changing color for a new period
input bool               chart_synchronization=true;               // Constructing a chart only upon complete synchronization
input priority           chart_priority_close=highest_t;           // Priority of the closing price
input priority           chart_priority_open=highest_t;            // Priority of the opening price
input priority           chart_priority_high=highest_t;            // Priority of the maximum price
input priority           chart_priority_low=highest_t;             // Priority of the minimum price
input bool               ma_draw=true;                             // Draw the average
input ENUM_APPLIED_PRICE ma_price=PRICE_CLOSE;                     // Price type for constructing the average
input ENUM_MA_METHOD     ma_method=MODE_EMA;                       // Construction type
input int                ma_period=14;                             // Averaging period
//--- indicator buffers
//--- buffer of the chart
double         ABCTBBuffer1[];
double         ABCTBBuffer2[];
double         ABCTBBuffer3[];
double         ABCTBBuffer4[];
double         ABCTBColors[];
//--- buffer of the average
double         LINE_TLBBuffer[];
//--- variables
MqlRates rates_array[];// bar data array for analysis
datetime date_stop;    // current date
datetime date_start;   // start date variable for calculation
//+------------------------------------------------------------------+
//| Struct Line Price                                                |
//+------------------------------------------------------------------+
struct line_price// structure for storing information about the past lines
  {
   double            up;  // value of the high price
   double            down;// value of the low price
  };
//+------------------------------------------------------------------+
//| Struct Line Information                                          |
//+------------------------------------------------------------------+
struct line_info// structure for storing information about the shared lines
  {
   double            up;
   double            down;
   char              type;
   datetime          time;
  };
line_info line_main_open[];  // data on the opening prices chart
line_info line_main_high[];  // data on the maximum prices chart
line_info line_main_low[];   // data on the minimum prices chart
line_info line_main_close[]; // data on the closing prices chart
//+------------------------------------------------------------------+
//| Struct Buffer Info                                               |
//+------------------------------------------------------------------+
struct buffer_info// structure for storing data for filling a buffer
  {
   double            open;
   double            high;
   double            low;
   double            close;
   char              type;
   datetime          time;
  };
buffer_info data_for_buffer[];// data for filling the modified construction buffer
datetime array_datetime[];    // array for storing information of the time for every line
int time_array[3];            // array for the function func_date_color
datetime time_variable;       // variable for the function func_date_color
bool latch=false;             // variable-latch for the function func_date_color
int handle;                   // handle of the indicator iMA
int step_min;                 // variable of the minimum step
int line_to_back;             // variable of the number of lines to display a reversal
2. 関数 OnInit
インディケータバッファはすべて関数OnInit 内で宣言され、配列表示はtimeseriesのようにセットアップされます。
それからチャートに反映されないインディケータ値を設定し、 名前を設定し、精度を指定し、チャートをオーバーロードさせるため現在値を消去します。ここでインディケータ iMA のハンドルを設定し入力したデータが正確か確認します。エラーが発生した場合はメッセージが表示され、値が最小値に変更されます。
//+------------------------------------------------------------------+
//| Custom indicator initialization function                         |
//+------------------------------------------------------------------+
int OnInit()
  {
//--- indicator buffers mapping
//--- buffers for a chart
   SetIndexBuffer(0,ABCTBBuffer1,INDICATOR_DATA);
   ArraySetAsSeries(ABCTBBuffer1,true);
   SetIndexBuffer(1,ABCTBBuffer2,INDICATOR_DATA);
   ArraySetAsSeries(ABCTBBuffer2,true);
   SetIndexBuffer(2,ABCTBBuffer3,INDICATOR_DATA);
   ArraySetAsSeries(ABCTBBuffer3,true);
   SetIndexBuffer(3,ABCTBBuffer4,INDICATOR_DATA);
   ArraySetAsSeries(ABCTBBuffer4,true);
   SetIndexBuffer(4,ABCTBColors,INDICATOR_COLOR_INDEX);
   ArraySetAsSeries(ABCTBColors,true);
//--- buffer for constructing the average
   SetIndexBuffer(5,LINE_TLBBuffer,INDICATOR_DATA);
   ArraySetAsSeries(LINE_TLBBuffer,true);
//--- set the values that are not going to be reflected on the chart
   PlotIndexSetDouble(0,PLOT_EMPTY_VALUE,0); // for the chart
   PlotIndexSetDouble(1,PLOT_EMPTY_VALUE,0); // for the average
//--- set the indicator appearance
   IndicatorSetString(INDICATOR_SHORTNAME,"ABCTB "+IntegerToString(magic_numb)); // name of the indicator
//--- accuracy of display
   IndicatorSetInteger(INDICATOR_DIGITS,_Digits);
//--- prohibit displaying the results of the indicator current value
   PlotIndexSetInteger(0,PLOT_SHOW_DATA,false);
   PlotIndexSetInteger(1,PLOT_SHOW_DATA,false);
//---
   handle=iMA(_Symbol,time_frame,ma_period,0,ma_method,ma_price);
   if(step_min_f<1)
     {
      step_min=1;
      Alert("Minimum step for a new column must be greater than zero");
     }
   else step_min=step_min_f;
//---
   if(line_to_back_f<1)
     {
      line_to_back=1;
      Alert("The number of lines to display a reversal must be greater than zero");
     }
   else line_to_back=line_to_back_f;
//---
   return(INIT_SUCCEEDED);
  }
3. データコピーを行う関数
インディケータは価格の4タイプすべてを処理するようにできているため、データすべてをコピーするのは基本です。これには時間のコピーも含まれます。MQL5 では MqlRatesと呼ばれるストラクチャがあります。それはトレードセッション開始時刻、価格、ボリューム、スプレッドに関する情報を格納するのに使用されます。
この関数の入力パラメータは開始日と終了日、タイムフレーム、MqlRatesタイプの対象配列です。この関数はコピーが正常に行われると真を返します。データは内部配列にコピーされます。計算された不足データプラス1セッションはそこにコピーされ、データは永久に更新され続けます。内部配列へのコピーが正常に行われれば、データは配列にコピーされ、関数の正常な動作を確認するため渡されます。
//+------------------------------------------------------------------+
//| Func All Copy                                                    |
//+------------------------------------------------------------------+
bool func_all_copy(MqlRates &result_array[],// response array
                   ENUM_TIMEFRAMES period,  // timeframe
                   datetime data_start,     // start date
                   datetime data_stop)      // end date
  {
//--- declaration of auxiliary variables
   bool x=false;       // variable for the function response
   int result_copy=-1; // copied data count
//--- adding variables and arrays for calculation
   static MqlRates interim_array[]; // temporary dynamic array for storing copied data
   static int bars_to_copy;         // number of bars for copying
   static int bars_copied;          // number of copied bars since the start date
//--- find out the current number of bars in the time range
   bars_to_copy=Bars(_Symbol,period,data_start,data_stop);
//--- count the number of bars to be copied
   bars_to_copy-=bars_copied;
//--- if it is not the first time when data is being copied
   if(bars_copied>0)
     {
      bars_copied--;
      bars_to_copy++;
     }
//--- change the size of the receiving array
   ArrayResize(interim_array,bars_to_copy);
//--- copy data to a temporary array
   result_copy=CopyRates(_Symbol,period,0,bars_to_copy,interim_array);
//--- check the result of copying data
   if(result_copy!=-1) // if copying to the temporary array was successful
     {
      ArrayCopy(result_array,interim_array,bars_copied,0,WHOLE_ARRAY); // copy the data from the temporary array to the main one
      x=true;                   // assign the positive response to the function
      bars_copied+=result_copy; // increase the value of the copied data
     }
//---
   return(x);
  }
4. データ計算を行う関数う
この関数は3つのラインブレイクチャートの古い構造についてデータを計算するプロトタイプです。すでにお話しましたが、この関数はデータ計算のみ行い、それをコードの最初に宣言されるストラクチャタイプ line_info の特殊配列にそれを構成します。
この関数には他に2つの関数を持ちます。:func_regrouping(関数の再グループ化を行います)とfunc_insert(関数を挿入します)がそれです。それらを最初からみていきます。
4.1. グループか関数
この関数は同方向の連続ラインについての情報をグループ化します。それはそれに渡される配列サイズ、または正確にはインディケータ設定のパラメータline_to_back_f(逆転を表示するライン数)によって制限されています。この関数にコントロールが渡されるたびに、同一ラインについて受け取られたデータはすべて最後に向かって1ポイント下がり、新しい値によってインデックス0が埋められます。
これはブレイクに必要なラインに関する情報が格納される方法です(古い構造ではブレイクのラインは3本です)。
//+------------------------------------------------------------------+
// Func Regrouping                                                   |
//+------------------------------------------------------------------+
void func_regrouping(line_price &input_array[],// array for regrouping
                     double new_price,         // new price value
                     char type)                // type of movement
  {
   int x=ArraySize(input_array);// find out the size of the array for regrouping
   for(x--; x>0; x--)           // regrouping loop
     {
      input_array[x].up=input_array[x-1].up;
      input_array[x].down=input_array[x-1].down;
     }
   if(type==1)
     {
      input_array[0].up=new_price;
      input_array[0].down=input_array[1].up;
     }
   if(type==-1)
     {
      input_array[0].down=new_price;
      input_array[0].up=input_array[1].down;
     }
  }
4.2. 挿入を行う関数
この関数は応答配列に値を挿入します。オードはシンプルですから細かい説明は必要ありません。
//+------------------------------------------------------------------+
// Func Insert                                                       |
//+------------------------------------------------------------------+
void func_insert(line_info &line_m[],  // target array
                 line_price &line_i[], // source array
                 int index,            // array element being inserted
                 char type,            // type of the target column
                 datetime time)        // date
  {
   line_m[index].up=line_i[0].up;
   line_m[index].down=line_i[0].down;
   line_m[index].type=type;
   line_m[index].time=time;
  }
データ計算用の関数は従来3つの部分に分けられます。最初の部分はオペレータ switch.の助けを借りて分析中のデータを中間配列にコピーします。関連する価格のみコピーされます。2番目の部分はデータ配列にスペースが必要とされる計算のテスト実行を行います。それから応答のために最初に関数に渡されるデータ配列line_main_array[]に変更が加えられます。3番目の部分は今度は調整済みデータ配列に書き込みを行います。
//+------------------------------------------------------------------+
//| Func Build Three Line Break                                      |
//+------------------------------------------------------------------+
void func_build_three_line_break(MqlRates &input_array[],      // array for analysis
                                 char price_type,              // type of the price under analysis (0-Close, 1-Open, 2-High, 3-Low)
                                 int min_step,                 // minimum step for drawing a line
                                 int line_back,                // number of lines for a reversal
                                 line_info &line_main_array[]) // array for return (response) of the function
  {
//--- calculate the size of the array for analysis
   int array_size=ArraySize(input_array);
//--- extract data required for calculation to an intermediate array
   double interim_array[];// intermediate array
   ArrayResize(interim_array,array_size);// adjust the intermediate array to the size of the data
   switch(price_type)
     {
      case 0: // Close
        {
         for(int x=0; x<array_size; x++)
           {
            interim_array[x]=input_array[x].close;
           }
        }
      break;
      case 1: // Open
        {
         for(int x=0; x<array_size; x++)
           {
            interim_array[x]=input_array[x].open;
           }
        }
      break;
      case 2: // High
        {
         for(int x=0; x<array_size; x++)
           {
            interim_array[x]=input_array[x].high;
           }
        }
      break;
      case 3: // Low
        {
         for(int x=0; x<array_size; x++)
           {
            interim_array[x]=input_array[x].low;
           }
        }
      break;
     }
//--- enter the variables for storing information about current situation
   line_price passed_line[];// array for storing information about the latest prices of the lines (type structure line_price)
   ArrayResize(passed_line,line_back+1);
   int line_calc=0;// number of lines
   int line_up=0;// number of the last ascending lines
   int line_down=0;// number of the last descending lines
   double limit_up=0;// upper limit necessary to pass
   double limit_down=0;// lower limit necessary to pass
/* Fill variables informing of the current situation with the first values */
   passed_line[0].up=interim_array[0];
   passed_line[0].down=interim_array[0];
//--- start the first loop to calculate received data for filling a buffer for drawing
   for(int x=0; x<array_size; x++)
     {
      if(line_calc==0)// no lines have been drawn
        {
         limit_up=passed_line[0].up;
         limit_down=passed_line[0].down;
         if(interim_array[x]>=limit_up+min_step*_Point)// the upper limit has been passed
           {
            func_regrouping(passed_line,interim_array[x],1);// regroup
            line_calc++;// update the line counter
            line_up++;
           }
         if(interim_array[x]<=limit_down-min_step*_Point)// the lower limit has been passed
           {
            func_regrouping(passed_line,interim_array[x],-1);// regroup
            line_calc++;// update the line counter
            line_down++;
           }
        }
      if(line_up>line_down)// last ascending line (lines)
        {
         limit_up=passed_line[0].up;
         limit_down=passed_line[(int)MathMin(line_up,line_back-1)].down;
         if(interim_array[x]>=limit_up+min_step*_Point)// the upper limit has been passed
           {
            func_regrouping(passed_line,interim_array[x],1);// regroup
            line_calc++;// update the line counter
            line_up++;
           }
         if(interim_array[x]<limit_down)// the lower limit has been passed
           {
            func_regrouping(passed_line,interim_array[x],-1);// regroup
            line_calc++;// update the line counter
            line_up=0;
            line_down++;
           }
        }
      if(line_down>line_up)// last descending line (lines)
        {
         limit_up=passed_line[(int)MathMin(line_down,line_back-1)].up;
         limit_down=passed_line[0].down;
         if(interim_array[x]>limit_up)// the upper limit has been passed
           {
            func_regrouping(passed_line,interim_array[x],1);// regroup
            line_calc++;// update the line counter
            line_down=0;
            line_up++;
           }
         if(interim_array[x]<=limit_down-min_step*_Point)// the lower limit has been passed
           {
            func_regrouping(passed_line,interim_array[x],-1);// regroup
            line_calc++;// update the line counter
            line_down++;
           }
        }
     }
   ArrayResize(line_main_array,line_calc);// change the size of the target array
//--- zeroise variables and fill with the the initial data
   line_calc=0;
   line_up=0;
   line_down=0;
   passed_line[0].up=interim_array[0];
   passed_line[0].down=interim_array[0];
//--- start the second loop to fill a buffer for drawing
   for(int x=0; x<array_size; x++)
     {
      if(line_calc==0)// no lines have been drawn
        {
         limit_up=passed_line[0].up;
         limit_down=passed_line[0].down;
         if(interim_array[x]>=limit_up+min_step*_Point)// the upper limit has been passed
           {
            func_regrouping(passed_line,interim_array[x],1);// regroup
            func_insert(line_main_array,passed_line,line_calc,1,input_array[x].time);
            line_calc++;// update the line counter
            line_up++;
           }
         if(interim_array[x]<=limit_down-min_step*_Point)// the lower limit has been passed
           {
            func_regrouping(passed_line,interim_array[x],-1);// regroup
            func_insert(line_main_array,passed_line,line_calc,-1,input_array[x].time);
            line_calc++;// update the line counter
            line_down++;
           }
        }
      if(line_up>line_down)// last ascending line (lines)
        {
         limit_up=passed_line[0].up;
         limit_down=passed_line[(int)MathMin(line_up,line_back-1)].down;
         if(interim_array[x]>=limit_up+min_step*_Point)// the upper limit has been passed
           {
            func_regrouping(passed_line,interim_array[x],1);// regroup
            func_insert(line_main_array,passed_line,line_calc,1,input_array[x].time);
            line_calc++;// update the line counter
            line_up++;
           }
         if(interim_array[x]<limit_down)// the lower limit has been passed
           {
            func_regrouping(passed_line,interim_array[x],-1);// regroup
            func_insert(line_main_array,passed_line,line_calc,-1,input_array[x].time);
            line_calc++;// update the line counter
            line_up=0;
            line_down++;
           }
        }
      if(line_down>line_up)// last descending line (lines)
        {
         limit_up=passed_line[(int)MathMin(line_down,line_back-1)].up;
         limit_down=passed_line[0].down;
         if(interim_array[x]>limit_up)// the upper limit has been passed
           {
            func_regrouping(passed_line,interim_array[x],1);// regroup
            func_insert(line_main_array,passed_line,line_calc,1,input_array[x].time);
            line_calc++;// update the line counter
            line_down=0;
            line_up++;
           }
         if(interim_array[x]<=limit_down-min_step*_Point)// the lower limit has been passed
           {
            func_regrouping(passed_line,interim_array[x],-1);// regroup
            func_insert(line_main_array,passed_line,line_calc,-1,input_array[x].time);
            line_calc++;// update the line counter
            line_down++;
           }
        }
     }
  }
5. チャート作成を行う関数
選択された作成パラメータ(古いものまたは改善後)を基にチャートのためのデータを計算し、表示データでインディケータバッファに書き込みを行うのがこの関数の目的です。前出の関数同様、チャート作成関数にもあと3つの関数があります。それらは色、同期、移動平均の関数です。それらについて詳しくお話します。
5.1. 色関数
この関数には入力パラメータが1つしかありません。時間です。この関数の応答はブール変数です。渡されたデータが期間の境界であれば、この関数は真を返します。期間は選択されたタイムフレームに依存するため、この関数は条件演算子 ifによる内蔵期間分離を持ちます。期間が選択されると、それは新しい期間がもう開始されたか確認されます。それは日付をクトラクチャMqlDateTimeに変換し比較することで行われます。 H2を含むここまでのタイムフレームに対しては、日付の値における変更は新しい期間の始まりを示します。H12 ~ D1 のタイムフレームは包括的に月間の変更、W1 と MN の間では変更を年間で確認します。
残念ながらストラクチャMqlDateTime は現週の情報を持ちません。この問題は変数time_variableで表される初期ポイントを作成することで解決されました。さらにラインについては、週の秒数がこの日付から差し引かれます。
//+------------------------------------------------------------------+
// Func Date Color                                                   |
//+------------------------------------------------------------------+
bool func_date_color(datetime date_time) // input date
  {
   bool x=false;// response variable
   int seconds=PeriodSeconds(time_frame);// find out the calculation time range
   MqlDateTime date;
   TimeToStruct(date_time,date);// convert data
   if(latch==false) // check the state of the latch
     {
      MqlDateTime date_0;
      date_0=date;
      date_0.hour=0;
      date_0.min=0;
      date_0.sec=0;
      int difference=date_0.day_of_week-1;
      datetime date_d=StructToTime(date_0);
      date_d=date_d-86400*difference;
      time_variable=date_d;
      latch=true;// lock the latch
     }
   if(seconds<=7200)// period is less than or equal to H2
     {
      if(time_array[0]!=date.day)
        {
         x=true;
         time_array[0]=date.day;
        }
     }
   if(seconds>7200 && seconds<=43200)// period is greater than H2 but less than or equal to H12
     {
      if(time_variable>=date_time)
        {
         x=true;
         time_variable=time_variable-604800;
        }
     }
   if(seconds>43200 && seconds<=86400)// period is greater than H12 but less than or equal to D1
     {
      if(time_array[1]!=date.mon)
        {
         x=true;
         time_array[1]=date.mon;
        }
     }
   if(seconds>86400)// period W1 or MN
     {
      if(time_array[2]!=date.year)
        {
         x=true;
         time_array[2]=date.year;
        }
     }
   return(x);
  }
5.2. 同期の関数
同期の関数には入力パラメータが6個あります。:4個は価格優先順位、完全同期または部分同期のブールタイプパラメータ、分析中の配列そのものです。この関数は2つの部分に分かれます。:完全同期と部分同期の場合です。
完全同期は3段階で行われます。
- 配列エレメントの計算、4つの価格タイプすべてのデータを持つ条件を満たすこと。
- 同上ケンカの中間配列にエレメントをコピー。
- 中間配列からパラメータによって渡される配列へのコピー。
部分同期はもっと複雑です。
渡される一次元ストラクチャ配列は二次元配列に変換されます。ここで最初のインデックスは注文を2番目のインデックスは価格タイプを示します。それから取り入れられるのは、エレメントを4つ持つ一次元配列です。価格優先レベルはこの配列にコピーされ、そうすると配列は優先順位を特定するためにソートされます。その後、ループforと条件演算子 ifにより優先順位に従って分配を行います。同時に、優先順位が同じ場合は、価格シーケンスは次のようになります。:終わり、始め、高、低。オペレータifが優先順位1番の値をみつけるとすぐに、ループ for が先に作成された二次元配列内のゼロデータすべてに優先順位1の値などを代入します。
//+------------------------------------------------------------------+
// Func Synchronization                                              |
//+------------------------------------------------------------------+
void func_synchronization(buffer_info &info[],
                          bool synchronization,
                          char close,
                          char open,
                          char high,
                          char low)
  {
   if(synchronization==true)// carry out a complete synchronization
     {
      int calc=0;// count variable
      for(int x=0; x<ArraySize(info); x++)// count complete data
        {
         if(info[x].close!=0 && info[x].high!=0 && info[x].low!=0 && info[x].open!=0)calc++;
        }
      buffer_info i_info[];    // enter a temporary array for copying
      ArrayResize(i_info,calc);// change the size of the temporary array
      calc=0;
      for(int x=0; x<ArraySize(info); x++)// copy data into the temporary array
        {
         if(info[x].close!=0 && info[x].high!=0 && info[x].low!=0 && info[x].open!=0)
           {
            i_info[calc]=info[x];
            calc++;
           }
        }
      ZeroMemory(info);        // clear the target array
      ArrayResize(info,calc);  // change the size of the main array
      for(int x=0; x<calc; x++)// copy data from the temporary array to the main one
        {
         info[x]=i_info[x];
        }
     }
   if(synchronization==false)  // change zero values to priority ones
     {
      int size=ArraySize(info); // measure the size of the array
      double buffer[][4];       // create a temporary array for calculation
      ArrayResize(buffer,size); // change the size of the temporary array
      for(int x=0; x<size; x++) // copy data into the temporary array
        {
         buffer[x][0]=info[x].close;
         buffer[x][1]=info[x].open;
         buffer[x][2]=info[x].high;
         buffer[x][3]=info[x].low;
        }
      char p[4];// enter an array for sorting by the order
      p[0]=close; p[1]=open; p[2]=high; p[3]=low;// assign variables for further sorting
      ArraySort(p); // sort
      int z=0,v=0;  // initialize frequently used variables
      for(int x=0; x<4; x++)// taking into account the results of the sorting, look through all variables and substitute them according to the priority
        {
         if(p[x]==close)// priority is for the closing prices
           {
            for(z=0; z<size; z++)
              {
               for(v=1; v<4; v++)
                 {
                  if(buffer[z][v]==0)buffer[z][v]=buffer[z][0];
                 }
              }
           }
         if(p[x]==open)// priority is for the opening prices
           {
            for(z=0; z<size; z++)
              {
               for(v=0; v<4; v++)
                 {
                  if(v!=1 && buffer[z][v]==0)buffer[z][v]=buffer[z][1];
                 }
              }
           }
         if(p[x]==high)// priority is for the maximum prices
           {
            for(z=0; z<size; z++)
              {
               for(v=0; v<4; v++)
                 {
                  if(v!=2 && buffer[z][v]==0)buffer[z][v]=buffer[z][2];
                 }
              }
           }
         if(p[x]==low)// priority is for the minimum prices
           {
            for(z=0; z<size; z++)
              {
               for(v=0; v<3; v++)
                 {
                  if(buffer[z][v]==0)buffer[z][v]=buffer[z][3];
                 }
              }
           }
        }
      for(int x=0; x<size; x++)// copy data from the temporary array back
        {
         info[x].close=buffer[x][0];
         info[x].open=buffer[x][1];
         info[x].high=buffer[x][2];
         info[x].low=buffer[x][3];
        }
     }
  }
5.3. 移動平均の関数
もっともシンプルな関数です。インディケータハンドルを用い、関数で受け取られると、関数のパラメータで渡されるデータに相当する値をコピーします。そうするとこの関数の応答としてその値が返されます。
//+------------------------------------------------------------------+
// Func MA                                                           |
//+------------------------------------------------------------------+
double func_ma(datetime date)
  {
   double x[1];
   CopyBuffer(handle,0,date,1,x);
   return(x[0]);
  }
チャートをプロットする関数は従来2つの部分に分けられます。:古いタイプのプロットと改善後のププロットです。この関数は入力パラメータを2つ持ちます。:構造用価格タイプ(改善後の構造では無視されます)と構造タイプ(古いタイプと改善後)です。
一番最初にインディケータバッファが消去され、それから構造タイプによって二分割されます。最初の部分(改善後構造について話しています)は4つの価格タイプすべてを計算する関数を呼びだすことで始まります。それから共通データ配列を作成し、そこにデータ計算関数を呼ぶときに受け取られる使用中のデータをコピーします。それから取得したデータ配列はソートされ、複製データから消去されます。その後、グル―バルレベルで宣言される配列に以下のデータ同期化を持つ連続データを基に書き込みが行われます。インディケータバッファへの書き込みは改善後構造では最終段階です。
2番目の部分(古い構造)はもっとシンプルです。最初にデータ計算関数が呼びだされ、それからインディケータバッファの書き込みが行われます。
//+------------------------------------------------------------------+
//| Func Chart Build                                                 |
//+------------------------------------------------------------------+
void func_chart_build(char price, // price type for chart construction
                      char type)  // type of chart construction
  {
//--- Zeroise the buffers
   ZeroMemory(ABCTBBuffer1);
   ZeroMemory(ABCTBBuffer2);
   ZeroMemory(ABCTBBuffer3);
   ZeroMemory(ABCTBBuffer4);
   ZeroMemory(ABCTBColors);
   ZeroMemory(LINE_TLBBuffer);
   if(type==1)// construct a modified chart (based on all price types)
     {
      func_build_three_line_break(rates_array,0,step_min,line_to_back,line_main_close);// data on closing prices
      func_build_three_line_break(rates_array,1,step_min,line_to_back,line_main_open);// data on opening prices
      func_build_three_line_break(rates_array,2,step_min,line_to_back,line_main_high);// data on maximum prices
      func_build_three_line_break(rates_array,3,step_min,line_to_back,line_main_low);// data on minimum prices
      //--- calculate data arrays
      int line_main_calc[4];
      line_main_calc[0]=ArraySize(line_main_close);
      line_main_calc[1]=ArraySize(line_main_open);
      line_main_calc[2]=ArraySize(line_main_high);
      line_main_calc[3]=ArraySize(line_main_low);
      //--- gather the date array
      int all_elements=line_main_calc[0]+line_main_calc[1]+line_main_calc[2]+line_main_calc[3];// find out the number of all elements
      datetime datetime_array[];// enter the array for copying
      ArrayResize(datetime_array,all_elements);
      int y[4];
      ZeroMemory(y);
      for(int x=0;x<ArraySize(datetime_array);x++)// copy data into the array
        {
         if(x<line_main_calc[0])
           {
            datetime_array[x]=line_main_close[y[0]].time;
            y[0]++;
           }
         if(x<line_main_calc[0]+line_main_calc[1] && x>=line_main_calc[0])
           {
            datetime_array[x]=line_main_open[y[1]].time;
            y[1]++;
           }
         if(x<line_main_calc[0]+line_main_calc[1]+line_main_calc[2] && x>=line_main_calc[0]+line_main_calc[1])
           {
            datetime_array[x]=line_main_high[y[2]].time;
            y[2]++;
           }
         if(x>=line_main_calc[0]+line_main_calc[1]+line_main_calc[2])
           {
            datetime_array[x]=line_main_low[y[3]].time;
            y[3]++;
           }
        }
      ArraySort(datetime_array);// sort the array
      //--- delete replicated data from the array
      int good_info=1;
      for(int x=1;x<ArraySize(datetime_array);x++)// count useful information
        {
         if(datetime_array[x-1]!=datetime_array[x])good_info++;
        }
      ArrayResize(array_datetime,good_info);
      array_datetime[0]=datetime_array[0];// copy the first element as it is the pattern in the beginning of comparison
      good_info=1;
      for(int x=1;x<ArraySize(datetime_array);x++)// fill the new array with useful data
        {
         if(datetime_array[x-1]!=datetime_array[x])
           {
            array_datetime[good_info]=datetime_array[x];
            good_info++;
           }
        }
      //--- fill the buffer for drawing (colored candles)
      int end_of_calc[4];// variables of storing information about the last comparison
      ZeroMemory(end_of_calc);
      ZeroMemory(data_for_buffer);
      ArrayResize(data_for_buffer,ArraySize(array_datetime));// change the size of the declared global array for storing data before passing it to a buffer
      for(int x=0; x<ArraySize(array_datetime); x++)
        {
         data_for_buffer[x].time=array_datetime[x];
         for(int s=end_of_calc[0]; s<line_main_calc[0]; s++)
           {
            if(array_datetime[x]==line_main_close[s].time)
              {
               end_of_calc[0]=s;
               if(line_main_close[s].type==1)data_for_buffer[x].close=line_main_close[s].up;
               else data_for_buffer[x].close=line_main_close[s].down;
               break;
              }
           }
         for(int s=end_of_calc[1]; s<line_main_calc[1]; s++)
           {
            if(array_datetime[x]==line_main_open[s].time)
              {
               end_of_calc[1]=s;
               if(line_main_open[s].type==1)data_for_buffer[x].open=line_main_open[s].down;
               else data_for_buffer[x].open=line_main_open[s].up;
               break;
              }
           }
         for(int s=end_of_calc[2]; s<line_main_calc[2]; s++)
           {
            if(array_datetime[x]==line_main_high[s].time)
              {
               end_of_calc[2]=s;
               data_for_buffer[x].high=line_main_high[s].up;
               break;
              }
           }
         for(int s=end_of_calc[3]; s<line_main_calc[3]; s++)
           {
            if(array_datetime[x]==line_main_low[s].time)
              {
               end_of_calc[3]=s;
               data_for_buffer[x].low=line_main_low[s].down;
               break;
              }
           }
        }
      //--- start the function of synchronizing data
      func_synchronization(data_for_buffer,chart_synchronization,chart_priority_close,chart_priority_open,chart_priority_high,chart_priority_low);
      //--- preparatory actions before starting the function func_date_color
      ZeroMemory(time_array);
      time_variable=0;
      latch=false;
      //--- fill the buffer for drawing candles
      for(int x=ArraySize(data_for_buffer)-1,z=0; x>=0; x--)
        {
         ABCTBBuffer1[z]=data_for_buffer[x].open;
         ABCTBBuffer2[z]=data_for_buffer[x].high;
         ABCTBBuffer3[z]=data_for_buffer[x].low;
         ABCTBBuffer4[z]=data_for_buffer[x].close;
         if(ABCTBBuffer1[z]<=ABCTBBuffer4[z])ABCTBColors[z]=0;
         if(ABCTBBuffer1[z]>=ABCTBBuffer4[z])ABCTBColors[z]=1;
         if(func_date_color(data_for_buffer[x].time)==true && chart_color_period==true)ABCTBColors[z]=2;
         if(ma_draw==true)LINE_TLBBuffer[z]=func_ma(data_for_buffer[x].time);
         z++;
        }
     }
   else// construct a classic chart (based on one price type)
     {
      func_build_three_line_break(rates_array,price,step_min,line_to_back,line_main_close);// find data on selected prices
      ArrayResize(array_datetime,ArraySize(line_main_close));
      //--- preparatory actions before starting the function func_date_color
      ZeroMemory(time_array);
      time_variable=0;
      latch=false;
      //--- the buffer for drawing candles
      for(int x=ArraySize(line_main_close)-1,z=0; x>=0; x--)
        {
         ABCTBBuffer1[z]=line_main_close[x].up;
         ABCTBBuffer2[z]=line_main_close[x].up;
         ABCTBBuffer3[z]=line_main_close[x].down;
         ABCTBBuffer4[z]=line_main_close[x].down;
         if(line_main_close[x].type==1)ABCTBColors[z]=0;
         else ABCTBColors[z]=1;
         if(func_date_color(line_main_close[x].time)==true && chart_color_period==true)ABCTBColors[z]=2;
         if(ma_draw==true)LINE_TLBBuffer[z]=func_ma(line_main_close[x].time);
         z++;
        }
     }
  }
6. 連結の関数
この関数はすべての制御インディケータエレメントを統合します。まず、現データが決定され、それからデータコピーを行う関数とチャート作成関数が呼ばれます。
//+------------------------------------------------------------------+
//| Func Consolidation                                               |
//+------------------------------------------------------------------+
void func_consolidation()
  {
//--- defining the current date
   date_stop=TimeCurrent();
//--- copying data for analysis
   func_all_copy(rates_array,time_frame,first_date_start,date_stop);
//--- basic construction of the chart
   func_chart_build(chart_price,chart_type);
   ChartRedraw();
  }
7. キー制御および自動制御構造の関数
これら関数はキーボードの "R" キー(OnChartEvent)を押す、または選択された時間範囲に従ってそれを自動で行う(OnCalculate)ことでインディケータを再描画するために作成されています。王者は新規バー関数(func_new_bar)によって分析されます。それは IsNewBarで説明されている関数のシンプルバージョンです。
//+------------------------------------------------------------------+
//| Custom indicator iteration function                              |
//+------------------------------------------------------------------+
int OnCalculate(const int rates_total,
                const int prev_calculated,
                const int begin,
                const double &price[])
  {
//---
   if(func_new_bar(time_redraw)==true)
     {
      func_consolidation();
     };
//--- return value of prev_calculated for next call
   return(rates_total);
  }
//+------------------------------------------------------------------+
//| ChartEvent function                                              |
//+------------------------------------------------------------------+
void OnChartEvent(const int id,
                  const long &lparam,
                  const double &dparam,
                  const string &sparam)
  {
//--- event of a keystroke
   if(id==CHARTEVENT_KEYDOWN)
     {
      if(lparam==82) //--- the key "R" has been pressed
        {
         func_consolidation();
        }
     }
  }
//+------------------------------------------------------------------+
//| Func New Bar                                                     |
//+------------------------------------------------------------------+
bool func_new_bar(ENUM_TIMEFRAMES period_time)
  {
//---
   static datetime old_times; // variable of storing old values
   bool res=false;            // variable of the analysis result
   datetime new_time[1];      // time of a new bar
//---
   int copied=CopyTime(_Symbol,period_time,0,1,new_time); // copy the time of the last bar to the cell new_time
//---
   if(copied>0) // everything is ок. data copied
     {
      if(old_times!=new_time[0]) // if the old time of the bar is not equal to the new one
        {
         if(old_times!=0) res=true; // if it is not the first start, then new bar = true
         old_times=new_time[0];     // remember the time of the bar
        }
     }
//---
   return(res);
  }
展示店ではインディケータコードの説明は終わりとし、その使用方法についてお話します。
インディケータ使用例とトレーディング戦略
古いチャート構造を基にした主要な分析戦略を始めます。
1. 買いと売りのサインとしての白と黒のライン
おおまかに2つのルールがあります。
- ルールNo.1:3本連続した上昇ラインがあれば買い3本連続した下降ラインがあれば売り。連続する3本ラインは傾向の出現を示します。
- ルールNo.2:逆転ラインが3本の連続ラインより下がったら売り、逆転ラインが3本の連続ラインより上がったら買い。
図6を見ます。これは2013年の初めから(分析の時間範囲は図5にあります)EURUSD H1 に対して古い構造を表しています。
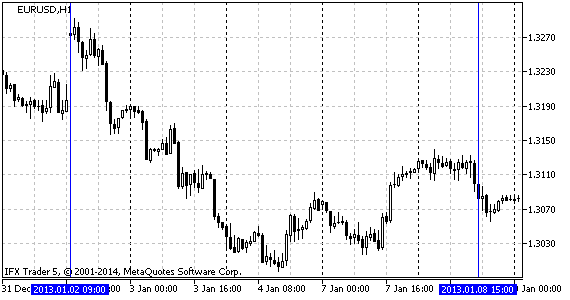
図5 分析された時間範囲 EURUSD H1
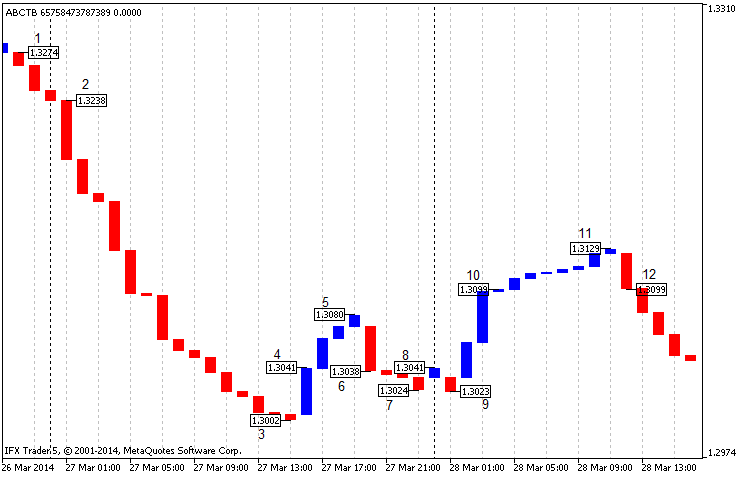
図6 2013年初頭、EURUSD H1について終値の3つのラインブレイクチャートF
チャート(図6)では、ポイント1とポイント2の間に明らかにサイン(ルールNo.1)が見られます。それは売りの開始ポイントです。この場合、収益は4桁に対して200ポイント以上です。次のポイント4は買いの有利な状況(ルールNo.2のように)を示しています。ポイント5での終了時、収益は40ポイントでポイント6の終了ととんとんです。
ポイント6では、売りのサインが見えます(ルールNo.2)。ポイント7で終了するとき10ポイントの収益得、ポイント8の終了ととんとんです。 ポイント8とポイント8は考慮に入れません。シグナルがルールNo.1もルールNo.2も満たしていないからです。ポイント10で買うことができます(ルールNo.1)。またポイント11の終了時に20ポイントの収益を得る、またはポイント12とトントンとなります。数字はすべて四捨五入されています。
最高のシナリオでは、この戦略を使うことで270ポイントの収益を上げることです。これはすばらしい数字です。同時に指定の時間範囲で収益に影響を与える激しい動きがあります。最悪の場合、トレードはとんとんの結果となりこれも悪くはありません。
状況がルールNo.1かルールNo.2を満たしている場合、傾向としての同じ方向のライン1本で表される傾向の反転確認を待つ必要があります。
2. 等距離チャンネル、サポートラインとレジスタンスライン
もう一つのトレーディング戦略は3つのラインブレイクチャートにテクニカル分析を適用することです。図7を見ます。
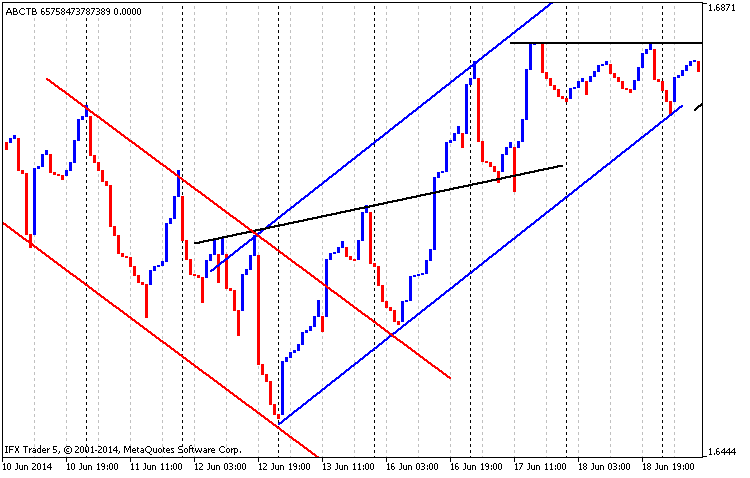
図7 等距離チャンネル、サポートラインとレジスタンスライン: GBPUSD H1、時間範囲2014.03.01~2014.05.01
図7では下降等距離チャンネルが赤いラインで、上昇チャンネルはブルーで、サポートラインとレジスタンスラインは黒で描かれているのを確認することができます。最初のレジスタンスラインがサポートラインに変わっていることは明らかです。
3. ろうそく足パターン
2013年初頭のペア USDCAD についてタイムフレーム M30 での改善後のチャート(2つのラインブレイク)はかなりい興味深く見えます。
それらのシグナルを正当化日本式のろうそく足パターンを識別することができます(図8)。

図8 改善後の3つのラインブレイクチャートGBPUSD M30、2013年初め、2つのラインブレイク
チャートの初めでNo.1 の『巻き込み』の反転パターンが確認できます。それは2本のろうそくで構成されています。:赤とそれの前のブルーです。上昇トレンドラインの後、マーケットはNo.2に転じました。それは1本分のろうそくの反転パターン "Hammer"です。この時点でマーケットは方向を変えます。同様の事柄がパターンNo.3で起こっています("Spinning Top")。続く反転パターン "Kharami"(No.4)はろうそく4で法事され、その次に大きな下降があります。パターンNo.6 も2本のろうそく足で構成され(『巻き込み』パターン)ていますが、最初に似たモデルと異なり、それはマーケットを逆方向に向けています。
よってこの類の分析にインディケータを使用することはできますが、稀なシグナル発生や大きなドローダウンの可能性などデメリットが伴います。この戦略には一層の進展が必要なのは確かです。
4. 移動平均
ラインを描くためだけに移動平均を追加するといった部分的修正により分析に新たなチャンスが提供されます。
図9を見ましょう。
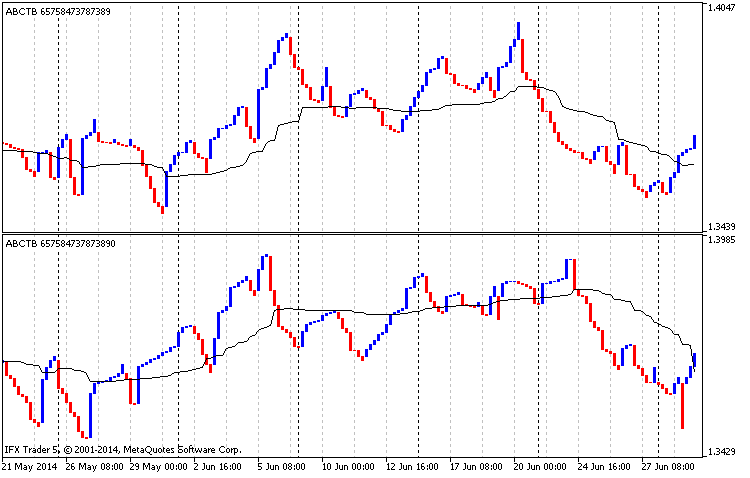
図9 移動平均分析: EURUSD H4、期間2014.01.01~2014.07.01、3つのラインブレイクチャート、古い構造
図9の上側は移動平均を伴う高い価格に基づく古い構造を表示しています(平均期間は90。低い価格、平滑化された平均)。下側は移動平均を伴う低い価格に基づく古い構造を表示しています(平均期間は90。高い価格、平滑化された平均)。
図9の上部分では移動平均はサポートラインとみなされ、下部では逆にレジスタンスラインとみなされます。両チャートの価格が平均より低ければ、マーケットには下降トレンドがあり、売る方がよいとなります。価格が平均より上がると、それは買い時です。この戦略のデメリットは長期戦略を意味することです。
おわりに
結論として、3つのラインブレイクにより一貫して良好なシグナルが提供されるか、悪くてとんとんであると言えます。実践によりこれは長期トレンドに取り入れるのがベストであることがわかり、そのため短期トレードにはお薦めしません。それをトレードで利用する方法について新しい発想のある方がいれば、ぜひお話したいと思います。
いつもどおり、コードを詳しくみようとしました。これを拡げる、再加工する、最適化する方法についてアイデアがあれば、本稿に対するコメントをお願いします。
MetaQuotes Ltdによってロシア語から翻訳されました。
元の記事: https://www.mql5.com/ru/articles/902
警告: これらの資料についてのすべての権利はMetaQuotes Ltd.が保有しています。これらの資料の全部または一部の複製や再プリントは禁じられています。
この記事はサイトのユーザーによって執筆されたものであり、著者の個人的な見解を反映しています。MetaQuotes Ltdは、提示された情報の正確性や、記載されているソリューション、戦略、または推奨事項の使用によって生じたいかなる結果についても責任を負いません。
 売買ロボット物語:余計なものがない方がいい?
 MQL5 (MQL4)から MySQL データベースにアクセスする方法
 安くて楽しいニューラルネットワーク - MetaTrader 5 でNeuroPro へリンク
- 無料取引アプリ
- 8千を超えるシグナルをコピー
- 金融ニュースで金融マーケットを探索
こんにちは。この記事をC#言語に変換することは可能でしょうか?よろしくお願いします。
インジケーターは時間スケールを無視する。何が起きているかをより正確に診断するには、使用されている設定を分析する必要があります。マークされた上側の断片は、下側のチャートの一番右のセクタ ーにあり、マークされた中央にはないと推測できます。下段に表示されているチャートの断片は1.330付近の価格水準で、上段に表示されている断片のピークは1.315付近です。
MT4でも同じようなことができますか?
2085ビルドで動作しないのですが、コードをリフレッシュできますか?記事からダウンロードし、コンパイルして、すべてうまくいったよ。