
ポイントおよびグラフチャート化インディケータ
はじめに
現在マーケットの状況に関する情報を提供するチャートは数多くあります。 「ポイント」や「グラフ」チャートのようにそれらの多くは遠い過去の遺産です。
このチャートタイプは16世紀の終わりから知られています。最初に述べられたのはチャールズ・ダウにより『ブック』法とラベルを付けられた1901年7月20日版の「ウォールストリートジャーナル」掲載の社説でした。ダウ氏は1886年にさかのぼって『ブック』法を参照したにもかかわらず、正式にその使用を定めたのは彼が最初でそれが今日まで受け継がれています。
ダウ氏はただ社説でこの手法をのべただけでしたが、今では同じテーマの本を数多く見つけることができます。初心者トレーダーにお薦めの本の1冊は Thomas J. Dorsey 著 "Point and Figure Charting: The Essential Application for Forecasting and Tracking Market Prices"です。
記述
ポイントとグラフチャートは縦列のセットです。Xの列は上昇する価格でOの列は下降する価格です。時間ではなく価格の変動を基にプロットされているのがユニークな点です。よってチャートデータからある値(時間)を消去することで、45°の角度でプロットされるトレンドラインのチャートを取得します。
ポイントとグラフチャートは定義済みの値を2個用いてプロットされます。
- ボックスサイズは X または O に追加を要求される価格変動の数量です(元はその値は株式ごとのドル金額として表されていましたが、時間の経過とともにわれわれのインディケータで使用するポイントに発展しました)。
- 逆転額は逆向きの価格額で「ボックスサイズ」単位で表されており、X の列から O へまたはその逆へ列を変更することを要求されます(たとえば 3 という逆転額とボックスサイズ10ポイントは30ポイントに対応します)。
そのため「逆転額」をかけた「ボックスサイズ」に等しい値分価格が変更したとしてfスタート点を選択し X を価格増加に O を減少にいれます。そして価格が「ボックスサイズ」分変更する同じ方向に変動し続けると、それぞれ上昇に対し X 列の一番上に Xを、または減少に対しては O 列の一番下に Oを追加します。価格が「逆金額」をかけた「ボックスサイズ」の値分逆方向に変動すると、価格上昇に対して X を、価格下降に対して O を入れ、それぞれ新しい X列か O列をスタートします。
便宜上、ポイントとグラフチャートは通常方眼紙にプロットされます。理解しやすいように、ポイントとグラフチャートのちょっとした例を概説します。次のデータがあるとします。
| 日付 | 高値 | 安値 |
|---|---|---|
| 07.03.2013 12:00 - 07.03.2013 20:00 | 1.3117 | 1.2989 |
| 07.03.2013 20:00 - 08.03.2013 04:00 | 1.3118 | 1.3093 |
| 08.03.2013 04:00 - 08.03.2013 12:00 | 1.3101 | 1.3080 |
| 08.03.2013 12:00 - 08.03.2013 20:00 | 1.3134 | 1.2955 |
「ボックスサイズ」が10、「逆転額」が3とし、ポイントとグラフチャートをプロットしま。
- まず1.2989 から 1.3117へ128ポイントの価格上昇を確認します。よって12 Xを描きます。
- 価格はその後1.3118 から 1.3093 へ25 ポイント下降します。これは逆転には十分ではないのでそれはそのままとします。
- さらに価格が 1.3080まで下降し続けるのを見ることができます。前回値が 1.3118だとすると、それは今 38 ポイント分変化しました。これで Oを2個追加することで新規列をスタートすることができます(価格変動が「ボックスサイズ」3個分を越えていても、続く Oの列はつねに1ボックスサイズ小さい値からスタートするため Oを2個だけ入れます)。
- そうすると価格は 1.3080 から 1.3134 とby 54 ポイント分の上昇となり、続いて 1.2955まで 179 ポイント分下降します。これで次の列はX4個で構成され、それに16 個のOが続きます。
以下のように描かれたものを確認しましょう。

図1 日本式ろうそく足チャート(左)とポイントとグラフチャート(右)
上記のポイントとグラフチャート例はひじょうに雑なものでここでは初心者の方がコンセプトを理解しやすいように表示しています。
チャート化原則
ポイントとグラフチャートのテクニックは複数あります。うちの一つはすでに上で述べています。チャートのテクニックは使用するデータによって異なります。たとえば一日の中での変動は考慮せずに日次データを使うことができます。がここからは粗いプロットを取得することとなります。または、一日の間の価格変動データに配慮することができ、そうするとより詳しいなめらかなプロットを取得します。
なめらかでより正確なイントとグラフチャートを得るには、計算とチャート化に分データを使用することとしました。これは分刻みの価格変動はひじょうに有意で通常6ポイントまでとなり、2ポイントや3ポイントは稀ではないからです。よって分足バーごとに始値データを使用します。
このようにチャート化原則はひじょうにシンプルです。
- スタートポイントを取ります。すなわち最初の1分の始値です。
- そうして価格が逆転額を掛けたボックスサイズに等しい距離かそれ以上変動すれば、それぞれに対応するシンボルを描写します(下向き変動にはO、上向き変動には Xです)。最後のシンボル価格データはのちのチャート化のため格納されます。
- 価格がボックスサイズ分同じ方向に変動する場合、対応するシンボルが描写されます。
- そして価格が逆行する場合、最後のシンボル価格、ペアの高値を基に計算が行われまず。別の言い方をすると、価格変動がボックスサイズの 50% を越えなければ、それは無視されます。
ここでポイントとグラフチャートのスタイルを決めます。MQL5 言語は7種類のインディケータプロットスタイルをサポとしています。:線、セクション(セグメント)、ヒストグラム、矢印(シンボル)、塗りつぶされた領域(塗りつぶされたチャネル)、バー、日本式ろうそく足です。
矢印(シンボル)は理想的な視覚表現にはぴったりですが、このスタイルには多様な数のインディケータバッファ、または巨大な数量が必要となり、よって 列に X 1個や O 1個を1個ずつプロットするのに別個のインディケータバッファが必要となります。それは、このスタイルを使おうと決めたら、予想変動率を定義し十分なメモリリソースを準備しる必要があるということです。
そこでわれわれは日本式のろうそく足をチャートスタイルに決めました。正確に言うと、色付の日本式のろうそく足です。X列を O列から区別するために異なる色が使用されます。よってインディケータにはバッファが5個だけ必要で、これで利用可能なリソースの有効な活用ができます。
列は横線によってボックスサイズに分けられます。 入手する結果はひじょうに妥当なものです。
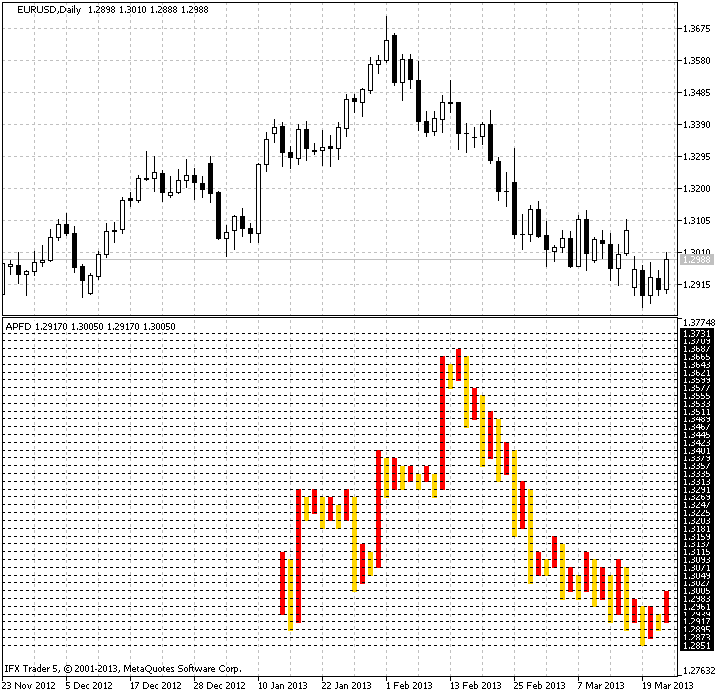
図2 日次タイムフレームで EURUSD に対するインディケータを用いたチャート化
インディケータのアルゴリズム
まず、インディケータの入力パラメータを決める必要があります。ポイントとグラフチャートは時間を考慮せず、分足バーからプロット用データを使用するため、システムリソースを不必要に使用しないよう処理対象データの分量を決める必要があります。また履歴全体を使ってポイントとグラフチャートをプロットする必要はありません。よって最初のパラメータは履歴とします。分足バーの数量を計算に考慮します。
そしてボックスサイズと逆転額を決めます。このためにそれぞれに対して変数 Cell および CellForChangeを採用します。また色パラメータを X列に ColorUpそして O列に ColorDownとします。最後のパラメータは線色でLineColorです。
// +++ Program start +++
//+------------------------------------------------------------------+
//|                                                         APFD.mq5 |
//|                                            Aktiniy ICQ:695710750 |
//|                                                    ICQ:695710750 |
//+------------------------------------------------------------------+
#property copyright "Aktiniy ICQ:695710750"
#property link      "ICQ:695710750"
#property version   "1.00"
//--- Indicator plotting in a separate window
#property indicator_separate_window
#property indicator_buffers 5
#property indicator_plots   1
//--- plot Label1
#property indicator_label1  "APFD"
#property indicator_type1   DRAW_COLOR_CANDLES
#property indicator_style1  STYLE_SOLID
#property indicator_color1  clrRed,clrGold
#property indicator_width1  1
//--- Set the input parameters
input int   History=10000;
input int   Cell=5;
input int   CellForChange=3;
input color ColorUp=clrRed;
input color ColorDown=clrGold;
input color LineColor=clrAqua;
//--- Declare indicator buffers
double CandlesBufferOpen[];
double CandlesBufferHigh[];
double CandlesBufferLow[];
double CandlesBufferClose[];
double CandlesBufferColor[];
//--- Array for copying calculation data from the minute bars
double OpenPrice[];
// Variables for calculations
double PriceNow=0;
double PriceBefore=0;
//--- Introduce auxiliary variables
char   Trend=0;      // Direction of the price trend
double BeginPrice=0; // Starting price for the calculation
char   FirstTrend=0; // Direction of the initial market trend
int    Columns=0;    // Variable for the calculation of columns
double InterimOpenPrice=0;
double InterimClosePrice=0;
double NumberCell=0; // Variable for the calculation of cells
double Tick=0;       // Tick size
double OldPrice=0;   // Value of the last calculation price
//--- Create arrays to temporary store data on column opening and closing prices
double InterimOpen[];
double InterimClose[];
// +++ Program start +++
ここで OnInit() 関数を考察します。この関数はインディケータバッファを一次元配列にバインドします。またより正確な表示のためにレンダーリングはせずにインディケータ値を設定し、
計算のための補助変数 Tick(ティックサイズ)値を計算します。さらに時系列としてインディケータバッファに色スキームとインデックス順序を設定します。これはインディケータ値を都合よく計算するのに必要です。
// +++ The OnInit function +++
//+------------------------------------------------------------------+
//| Custom indicator initialization function                         |
//+------------------------------------------------------------------+
int OnInit()
  {
//--- indicator buffers mapping
   SetIndexBuffer(0,CandlesBufferOpen,INDICATOR_DATA);
   SetIndexBuffer(1,CandlesBufferHigh,INDICATOR_DATA);
   SetIndexBuffer(2,CandlesBufferLow,INDICATOR_DATA);
   SetIndexBuffer(3,CandlesBufferClose,INDICATOR_DATA);
   SetIndexBuffer(4,CandlesBufferColor,INDICATOR_COLOR_INDEX);
//--- Set the value of the indicator without rendering
   PlotIndexSetDouble(0,PLOT_EMPTY_VALUE,0);
//--- Calculate the size of one tick
   Tick=SymbolInfoDouble(Symbol(),SYMBOL_TRADE_TICK_SIZE);
//--- Set the color scheme
   PlotIndexSetInteger(0,PLOT_LINE_COLOR,0,ColorUp);
   PlotIndexSetInteger(0,PLOT_LINE_COLOR,1,ColorDown);
//--- Set the indexing order in arrays as time series
   ArraySetAsSeries(CandlesBufferClose,true);
   ArraySetAsSeries(CandlesBufferColor,true);
   ArraySetAsSeries(CandlesBufferHigh,true);
   ArraySetAsSeries(CandlesBufferLow,true);
   ArraySetAsSeries(CandlesBufferOpen,true);
//--- Check the input parameter for correctness
   if(CellForChange<2)
      Alert("The CellForChange parameter must be more than 1 due to plotting peculiarities");
//---
   return(0);
  }
// +++ The OnInit function +++
インディケータの『心臓部』に到達しました。OnCalculate() 関数でここでは計算が行われます。インディケータ値の計算は OnCalculate()から呼ばれる基本的な6個の関数に分割されます。ではそれらを見ていきます。
1. データコピー用関数
この関数は分足バーから計算用配列にデータをコピーします。まず受け取る配列のサイズを変更し、そこに CopyOpen() 関数を用いて始値をコピーします。
//+------------------------------------------------------------------+
//| Function for copying data for the calculation                    |
//+------------------------------------------------------------------+
int FuncCopy(int HistoryInt)
  {
//--- Resize the array for copying calculation data
   ArrayResize(OpenPrice,(HistoryInt));
//--- Copy data from the minute bars to the array
   int Open=CopyOpen(Symbol(),PERIOD_M1,0,(HistoryInt),OpenPrice);
//---
   return(Open);
  }
2. 列番号計算用関数
この関数はポイントとグラフチャートの列番号を計算します。
計算は上記関数でコピーされた分足のタイムフレーム上のバー番号をとおしてループで反復して行われます。ループ自体は異なるトレンドタイプに対するメインブロック3つで構成されています。
- 0 -不定のトレンド
- 1 -上昇トレンド
- -1 -下降トレンド
不定トレンドは初期価格変動を決定するとき一度だけ使用されます。現在マーケットとと初期価格との差の絶対値が逆転額を掛けたボックスサイズの値を超えるとき価格変動方向が決定されます。
下降ブレークアウトがあれば、初期トレンドは下降トレンドとして特定され、Trend 変数に対して対応する入力が行われます。上昇トレンドはちょうど逆の方法で特定されます。その上、列番号にたいする変数値ColumnsIntは増加します。
現在トレンドが特定されると、各方向に対して2つの条件を設定します。価格がボックスサイズ分現トレンド方向に変動し続けると、ColumnsInt 変数は変化せずにとどまります。逆転額を掛けたボックスサイズ分価格が逆転すると、新しい列が表示され ColumnsInt 変数は1増加します。
列がすべて特性されるまでこれが繰り返されます。
ループ内でセル数を四捨五入するには、計算結果値を一番近い整数に四捨五入することのできる MathRound() 関数を使用します。この関数は必要なプロットに応じて MathFloor() 関数(一番近い整数に切り捨てる)、または MathCeil() 関数(一番近い整数に切り上げる)と置き換え可能です。
//+------------------------------------------------------------------+
//| Function for calculating the number of columns                   |
//+------------------------------------------------------------------+
int FuncCalculate(int HistoryInt)
  {
   int ColumnsInt=0;

//--- Zero out auxiliary variables
   Trend=0;                 // Direction of the price trend
   BeginPrice=OpenPrice[0]; // Starting price for the calculation
   FirstTrend=0;            // Direction of the initial market trend
   Columns=0;               // Variable for the calculation of columns
   InterimOpenPrice=0;
   InterimClosePrice=0;
   NumberCell=0;            // Variable for the calculation of cells
//--- Loop for the calculation of the number of main buffers (column opening and closing prices)
   for(int x=0; x<HistoryInt; x++)
     {
      if(Trend==0 && (Cell*CellForChange)<fabs((BeginPrice-OpenPrice[x])/Tick))
        {
         //--- Downtrend
         if(((BeginPrice-OpenPrice[x])/Tick)>0)
           {
            NumberCell=fabs((BeginPrice-OpenPrice[x])/Tick)/Cell;
            NumberCell=MathRound(NumberCell);
            InterimOpenPrice=BeginPrice;
            InterimClosePrice=BeginPrice-(NumberCell*Cell*Tick);
            InterimClosePrice=NormalizeDouble(InterimClosePrice,Digits());
            Trend=-1;
           }
         //--- Uptrend
         if(((BeginPrice-OpenPrice[x])/Tick)<0)
           {
            NumberCell=fabs((BeginPrice-OpenPrice[x])/Tick)/Cell;
            NumberCell=MathRound(NumberCell);
            InterimOpenPrice=BeginPrice;
            InterimClosePrice=BeginPrice+(NumberCell*Cell*Tick);
            InterimClosePrice=NormalizeDouble(InterimClosePrice,Digits());
            Trend=1;
           }
         BeginPrice=InterimClosePrice;
         ColumnsInt++;
         FirstTrend=Trend;
        }
      //--- Determine further actions in case of the downtrend
      if(Trend==-1)
        {
         if(((BeginPrice-OpenPrice[x])/Tick)>0 && (Cell)<fabs((BeginPrice-OpenPrice[x])/Tick))
           {
            NumberCell=fabs((BeginPrice-OpenPrice[x])/Tick)/Cell;
            NumberCell=MathRound(NumberCell);
            InterimClosePrice=BeginPrice-(NumberCell*Cell*Tick);
            InterimClosePrice=NormalizeDouble(InterimClosePrice,Digits());
            Trend=-1;
            BeginPrice=InterimClosePrice;
           }
         if(((BeginPrice-OpenPrice[x])/Tick)<0 && (Cell*CellForChange)<fabs((BeginPrice-OpenPrice[x])/Tick))
           {
            ColumnsInt++;
            NumberCell=fabs((BeginPrice-OpenPrice[x])/Tick)/Cell;
            NumberCell=MathRound(NumberCell);
            InterimOpenPrice=BeginPrice+(Cell*Tick);
            InterimClosePrice=BeginPrice+(NumberCell*Cell*Tick);
            InterimClosePrice=NormalizeDouble(InterimClosePrice,Digits());
            Trend=1;
            BeginPrice=InterimClosePrice;
           }
        }
      //--- Determine further actions in case of the uptrend
      if(Trend==1)
        {
         if(((BeginPrice-OpenPrice[x])/Tick)>0 && (Cell*CellForChange)<fabs((BeginPrice-OpenPrice[x])/Tick))
           {
            ColumnsInt++;
            NumberCell=fabs((BeginPrice-OpenPrice[x])/Tick)/Cell;
            NumberCell=MathRound(NumberCell);
            InterimOpenPrice=BeginPrice-(Cell*Tick);
            InterimClosePrice=BeginPrice-(NumberCell*Cell*Tick);
            InterimClosePrice=NormalizeDouble(InterimClosePrice,Digits());
            Trend=-1;
            BeginPrice=InterimClosePrice;
           }
         if(((BeginPrice-OpenPrice[x])/Tick)<0 && (Cell)<fabs((BeginPrice-OpenPrice[x])/Tick))
           {
            NumberCell=fabs((BeginPrice-OpenPrice[x])/Tick)/Cell;
            NumberCell=MathRound(NumberCell);
            InterimClosePrice=BeginPrice+(NumberCell*Cell*Tick);
            InterimClosePrice=NormalizeDouble(InterimClosePrice,Digits());
            Trend=1;
            BeginPrice=InterimClosePrice;
           }
        }
     }
//---
   return(ColumnsInt);
  }
3. 列に着色する関数
この関数は設定済みの色スキームを用いて必要に応じ列に色を付けます。これには、列数について反復するループを下記、偶数列および奇数列に適切な色を設定します。その際、初期トレンド値(最初の列)に配慮します。
//+------------------------------------------------------------------+
//| Function for coloring columns                                    |
//+------------------------------------------------------------------+
int FuncColor(int ColumnsInt)
  {
   int x;
//--- Fill the buffer of colors for drawing
   for(x=0; x<ColumnsInt; x++)
     {
      if(FirstTrend==-1)
        {
         if(x%2==0) CandlesBufferColor[x]=1; // All even buffers of color 1
         if(x%2>0) CandlesBufferColor[x]=0;  // All odd buffers of color 0
        }
      if(FirstTrend==1)
        {
         if(x%2==0) CandlesBufferColor[x]=0; // All odd buffers of color 0
         if(x%2>0) CandlesBufferColor[x]=1;  // All even buffers of color 1
        }
     }
//---
   return(x);
  }
4. 列サイズを決定する関数
使用する列の数量を決め必要な色を設定したら、列の高さを決める必要があります。このために一時的な配列 InterimOpen[] および InterimClose[]を作成します。これに各列の始値と終値を格納します。これら配列のサイズは列数と等しくなります。
FuncCalculate() 関数からのループとほとんど同じループを取得します。上記の相違とは離れ、それはまた各列の始値と終値を格納します。この分離はまえもってチャート内の列数を知るために実装されます。理論的には最初に配列メモリ割り当てのための列の分かっている大きな数を設定しループ1個だけでこれを行います。しかしその場合、メモリリソースをかなり費やすこととなりかねません。
それでは列の高さ決定を詳しくみていきましょう。必要なボックスサイズに等しい距離を価格が変動したら、その数を計算し一番近い整数に四捨五入します。それから現在列のボックスサイズのトータル数を列の始値に加えます。これで言わり根の列を取得します。それはまた使用される最後の価格となります。それは後の処理に使用されます。
//+------------------------------------------------------------------+
//| Function for determining the column size                         |
//+------------------------------------------------------------------+
int FuncDraw(int HistoryInt)
  {
//--- Determine the sizes of temporary arrays
   ArrayResize(InterimOpen,Columns);
   ArrayResize(InterimClose,Columns);
//--- Zero out auxiliary variables
   Trend=0;                 // Direction of the price trend
   BeginPrice=OpenPrice[0]; // Starting price for the calculation
   NumberCell=0;            // Variable for the calculation of cells
   int z=0;                 // Variable for indices of temporary arrays
//--- Loop for filling the main buffers (column opening and closing prices)
   for(int x=0; x<HistoryInt; x++)
     {
      if(Trend==0 && (Cell*CellForChange)<fabs((BeginPrice-OpenPrice[x])/Tick))
        {
         //--- Downtrend
         if(((BeginPrice-OpenPrice[x])/Tick)>0)
           {
            NumberCell=fabs((BeginPrice-OpenPrice[x])/Tick)/Cell;
            NumberCell=MathRound(NumberCell);
            InterimOpen[z]=BeginPrice;
            InterimClose[z]=BeginPrice-(NumberCell*Cell*Tick);
            InterimClose[z]=NormalizeDouble(InterimClose[z],Digits());
            Trend=-1;
           }
         //--- Uptrend
         if(((BeginPrice-OpenPrice[x])/Tick)<0)
           {
            NumberCell=fabs((BeginPrice-OpenPrice[x])/Tick)/Cell;
            NumberCell=MathRound(NumberCell);
            InterimOpen[z]=BeginPrice;
            InterimClose[z]=BeginPrice+(NumberCell*Cell*Tick);
            InterimClose[z]=NormalizeDouble(InterimClose[z],Digits()); // Normalize the number of decimal places
            Trend=1;
           }
         BeginPrice=InterimClose[z];
        }
      //--- Determine further actions in case of the downtrend
      if(Trend==-1)
        {
         if(((BeginPrice-OpenPrice[x])/Tick)>0 && (Cell)<fabs((BeginPrice-OpenPrice[x])/Tick))
           {
            NumberCell=fabs((BeginPrice-OpenPrice[x])/Tick)/Cell;
            NumberCell=MathRound(NumberCell);
            InterimClose[z]=BeginPrice-(NumberCell*Cell*Tick);
            InterimClose[z]=NormalizeDouble(InterimClose[z],Digits());
            Trend=-1;
            BeginPrice=InterimClose[z];
           }
         if(((BeginPrice-OpenPrice[x])/Tick)<0 && (Cell*CellForChange)<fabs((BeginPrice-OpenPrice[x])/Tick))
           {
            z++;
            NumberCell=fabs((BeginPrice-OpenPrice[x])/Tick)/Cell;
            NumberCell=MathRound(NumberCell);
            InterimOpen[z]=BeginPrice+(Cell*Tick);
            InterimClose[z]=BeginPrice+(NumberCell*Cell*Tick);
            InterimClose[z]=NormalizeDouble(InterimClose[z],Digits());
            Trend=1;
            BeginPrice=InterimClose[z];
           }
        }
      //--- Determine further actions in case of the uptrend
      if(Trend==1)
        {
         if(((BeginPrice-OpenPrice[x])/Tick)>0 && (Cell*CellForChange)<fabs((BeginPrice-OpenPrice[x])/Tick))
           {
            z++;
            NumberCell=fabs((BeginPrice-OpenPrice[x])/Tick)/Cell;
            NumberCell=MathRound(NumberCell);
            InterimOpen[z]=BeginPrice-(Cell*Tick);
            InterimClose[z]=BeginPrice-(NumberCell*Cell*Tick);
            InterimClose[z]=NormalizeDouble(InterimClose[z],Digits());
            Trend=-1;
            BeginPrice=InterimClose[z];
           }
         if(((BeginPrice-OpenPrice[x])/Tick)<0 && (Cell)<fabs((BeginPrice-OpenPrice[x])/Tick))
           {
            NumberCell=fabs((BeginPrice-OpenPrice[x])/Tick)/Cell;
            NumberCell=MathRound(NumberCell);
            InterimClose[z]=BeginPrice+(NumberCell*Cell*Tick);
            InterimClose[z]=NormalizeDouble(InterimClose[z],Digits());
            Trend=1;
            BeginPrice=InterimClose[z];
           }
        }
     }
//---
   return(z);
  }
5. 配列逆転のための関数
この関数は取得された列配列データを逆転させます。それにより右から左にプログラムによってチャートが表示されます。配列逆転はループ内でろうそく足に割り当てられる高値 および 低値 を用いて行われます。すべてのインディケータバッファ値がゼロであるそうろく足に対して表示されるためこれが行われます。
//+------------------------------------------------------------------+
//| Function for array reversal                                      |
//+------------------------------------------------------------------+
int FuncTurnArray(int ColumnsInt)
  {
//--- Variable for array reversal
   int d=ColumnsInt;
   for(int x=0; x<ColumnsInt; x++)
     {
      d--;
      CandlesBufferOpen[x]=InterimOpen[d];
      CandlesBufferClose[x]=InterimClose[d];
      if(CandlesBufferClose[x]>CandlesBufferOpen[x])
        {
         CandlesBufferHigh[x]=CandlesBufferClose[x];
         CandlesBufferLow[x]=CandlesBufferOpen[x];
        }
      if(CandlesBufferOpen[x]>CandlesBufferClose[x])
        {
         CandlesBufferHigh[x]=CandlesBufferOpen[x];
         CandlesBufferLow[x]=CandlesBufferClose[x];
        }
     }
//---
   return(d);
  }
6. 水平線を引くための関数
この関数は水平線(オブジェクト)を用いて『ボックス』のグリッドを作成します。関数の冒頭では計算データの配列から最大および最小価格を決定します。これら値はのちにスタート点からラインを次第に上下にプロットするために使用します。
//+------------------------------------------------------------------+
//| Function for drawing horizontal lines                            |
//+------------------------------------------------------------------+
int FuncDrawHorizontal(bool Draw)
  {
   int Horizontal=0;
   if(Draw==true)
     {
      //--- Create horizontal lines (lines for separation of columns)
      ObjectsDeleteAll(0,ChartWindowFind(),OBJ_HLINE); // Delete all old horizontal lines
      int MaxPriceElement=ArrayMaximum(OpenPrice);     // Determine the maximum price level
      int MinPriceElement=ArrayMinimum(OpenPrice);     // Determine the minimum price level
      for(double x=OpenPrice[0]; x<=OpenPrice[MaxPriceElement]+(Cell*Tick); x=x+(Cell*Tick))
        {
         ObjectCreate(0,DoubleToString(x,Digits()),OBJ_HLINE,ChartWindowFind(),0,NormalizeDouble(x,Digits()));
         ObjectSetInteger(0,DoubleToString(x,Digits()),OBJPROP_COLOR,LineColor);
         ObjectSetInteger(0,DoubleToString(x,Digits()),OBJPROP_STYLE,STYLE_DOT);
         ObjectSetInteger(0,DoubleToString(x,Digits()),OBJPROP_SELECTED,false);
         ObjectSetInteger(0,DoubleToString(x,Digits()),OBJPROP_WIDTH,1);
         Horizontal++;
        }
      for(double x=OpenPrice[0]-(Cell*Tick); x>=OpenPrice[MinPriceElement]; x=x-(Cell*Tick))
        {
         ObjectCreate(0,DoubleToString(x,Digits()),OBJ_HLINE,ChartWindowFind(),0,NormalizeDouble(x,Digits()));
         ObjectSetInteger(0,DoubleToString(x,Digits()),OBJPROP_COLOR,LineColor);
         ObjectSetInteger(0,DoubleToString(x,Digits()),OBJPROP_STYLE,STYLE_DOT);
         ObjectSetInteger(0,DoubleToString(x,Digits()),OBJPROP_SELECTED,false);
         ObjectSetInteger(0,DoubleToString(x,Digits()),OBJPROP_WIDTH,1);
         Horizontal++;
        }
      ChartRedraw();
     }
//---
   return(Horizontal);
  }
これですべての基本関数を記述しました。それでは OnCalculate()内で呼ぶ順序を確認しましょう。
- 計算データコピー用関数から始めます(まだ計算バーはないとします)。
- 列数を計算する関数を呼びます。
- 列の色を決めます。
- 列のサイズを決めます。
- 配列内でデータを逆転する関数を呼びます。
- 列を『ボックス』に分ける水平線を引く関数を呼びます。
// +++ Main calculations and plotting +++
//+------------------------------------------------------------------+
//| Custom indicator iteration function                              |
//+------------------------------------------------------------------+
int OnCalculate(const int rates_total,
                const int prev_calculated,
                const datetime &time[],
                const double &open[],
                const double &high[],
                const double &low[],
                const double &close[],
                const long &tick_volume[],
                const long &volume[],
                const int &spread[])
  {
//--- Reverse the array to conveniently get the last price value
   ArraySetAsSeries(close,true);
//---
   if(prev_calculated==0)
     {
      //--- Start the function for copying data for the calculation
      int ErrorCopy=FuncCopy(History);
      //--- In case of error, print the message
      if(ErrorCopy==-1)
        {
         Alert("Failed to copy. Data is still loading.");
         return(0);
        }
      //--- Call the function for calculating the number of columns
      Columns=FuncCalculate(History);
      //--- Call the function for coloring columns
      int ColorCalculate=FuncColor(Columns);
      //--- Call the function for determining column sizes
      int z=FuncDraw(History);
      //--- Start the function for array reversal
      int Turn=FuncTurnArray(Columns);
      //--- Start the function for drawing horizontal lines
      int Horizontal=FuncDrawHorizontal(true);
      //--- Store the value of the last closing price in the variable
      OldPrice=close[0];
     }
//--- If the price is one box size different from the previous one,
//--- the indicator is recalculated
   if(fabs((OldPrice-close[0])/Tick)>Cell)
      return(0);
//--- return value of prev_calculated for next call
   return(rates_total);
  }
// +++ Main calculations and plotting +++
これがインディケータコードのコア部分の終わりです。ただインディケータはそれ自体複雑な配列を持つデメリットがあります。その配列は再ロードする必要がある場合があるのです。
これを実装するには、消去の "С" キーと再描写の "R" を押すイベントを処理する関数OnChartEvent() を使用します。消去にはインディケータバッファの一つにゼロ値を割り当てます。チャート再描写用関数は前回計算の繰り返しとインディケータバッファへの値割当てを表します。
// +++ Secondary actions for the "С" key - clear and the "R" key - redraw +++
//+------------------------------------------------------------------+
//| ChartEvent function                                              |
//+------------------------------------------------------------------+
void OnChartEvent(const int id,
                  const long &lparam,
                  const double &dparam,
                  const string &sparam)
  {
//---
   if(id==CHARTEVENT_KEYDOWN)
     {
      //--- 67 - The "C" key code clears the indicator buffer
      if(lparam==67)
        {
         for(int x=0; x<Bars(Symbol(),PERIOD_CURRENT); x++)
            CandlesBufferOpen[x]=0;
         ChartRedraw();
        }
      // 82 - The "R" key code redraws the indicator
      if(lparam==82)
        {
         //--- Start the copying function
         int ErrorCopy=FuncCopy(History);
         //--- In case of error, print the message
         if(ErrorCopy==-1)
            Alert("Failed to copy data.");
         //--- Call the function for calculating the number of columns
         Columns=FuncCalculate(History);
         //--- Call the function for coloring columns
         int ColorCalculate=FuncColor(Columns);
         //--- Call the function for determining column sizes
         int z=FuncDraw(History);
         //--- Start the function for array reversal
         int Turn=FuncTurnArray(Columns);
         //--- Start the function for drawing horizontal lines
         int Horizontal=FuncDrawHorizontal(true);
        }
     }
  }
//+------------------------------------------------------------------+
// +++ Secondary actions for the "С" key - clear and the "R" key - redraw +++
アルゴリズムとインディケータの記述を終えこれで一息つくことができます。またトレード実行のためのシグナルを作成するポイントとグラフチャートパターンをいくらか見ることができます。
標準シグナル
ポイントとグラフチャートを分析する方法は2とおりあります。パターンに基づく方法とサポートラインおよびレジスタンスラインに基づく方法です。後者はサポートラインおよびレジスタンスラインが45°の角度でプロットされる点で特殊です(これはデザインされるインディケータ内でつねにそうなっているわけではありません。というのもメインチャートのサイズによってサイズが変化する日本式ろうそく足を医療してプロットされているからです。それは角度のばらつきを招きます)。
ではパターンそのものを考察していきましょう。
-
"Double Top" パターンと"Double Bottom" パターン
"Double Top" は価格が上がるときに起こり、その後Oの特定の列を形成しながら下がり、再び上がります。その際1ボックスサイズ分前回の X列を越えます。このパターンは買いのシグナルです。
"Double Bottom" は "Double Top" と正反対のパターンです。価格下降( O列)があり、 X列が続き、前回Oを1ボックス下回るもう一つ別の Oが来ます。これは売りシグナルです。
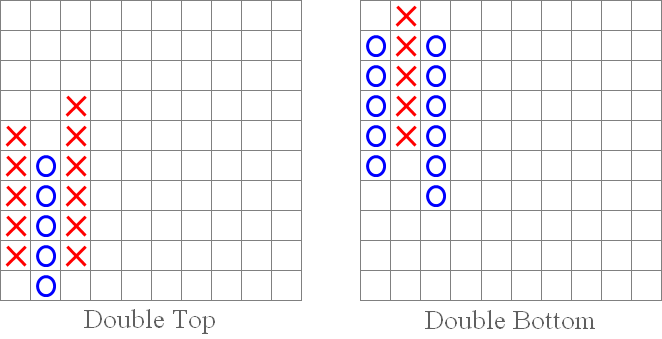
図3 "Double Top" パターンと"Double Bottom" パターン
-
"Triple Top" パターンと"Triple Bottom" パターン
これらは頻度は低いですがひじょうに強いシグナルを表します。基本的にそれらは"Double Top" パターンと"Double Bottom" パターンに似ており、それらの継続です。それらはシグナルを表す前に上記2パターンの動きを繰り返します。
"Triple Top" パターンが起こるのは、価格が二度同じレベルに到達し、それからそのレベルをこえるときで、これは買いシグナルを表します。
"Triple Bottom" パターンは"Triple Top"と逆で、これが起こるのは、価格が二度同じレベルに落ち込み、それからそのレベル以下に落ちるときで、これは売りシグナルを表します。
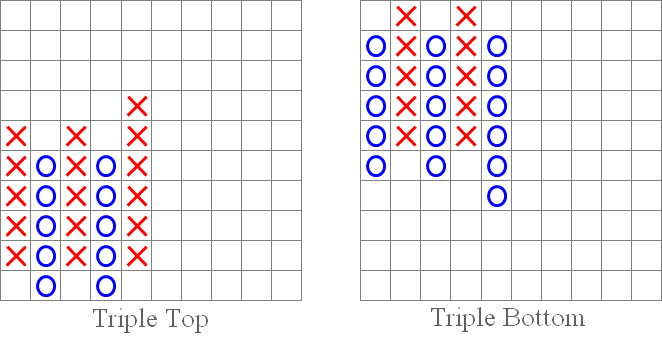
図4 "Triple Top" パターンと"Triple Bottom" パターン
-
"対称的 Triangle Breakout" パターン:上側と下側
テクニカル分析パターンについて思い出します。テクニカル分析では"対照的Triangle Breakout" パターンは"対照的Triangle"パターンに類似しています。 上側のブレークアウト(左側の図の下に表示されているように)は買いシグナルです。逆に下側のブレークダウンは売りシグナルです(右の図)。
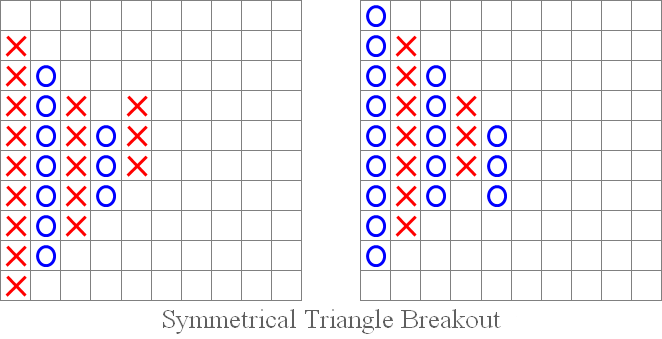
図5 "対照的トライアングル発生":上側と下側
-
"強気のカタパルト" パターンと "弱気のカタパルト" パターン
"カタパルト" はある部分テクニカル分析の "アセンディングトライアングル" や "ディセンディングトライアングル" パターンに似ています。それらシグナルは基本的に似通っています。価格が三角形の平衡側の上または下を超えるとすぐにそれぞれ買いまたは売りシグナルが発生します。"強気のカタパルト"の場合、価格ブレークアウトは上でそれは買いシグナル(左の図)です。一方 ">弱気のカタパルト" の場合、価格は下を割り込みそれは売りシグナル(右の図)です。
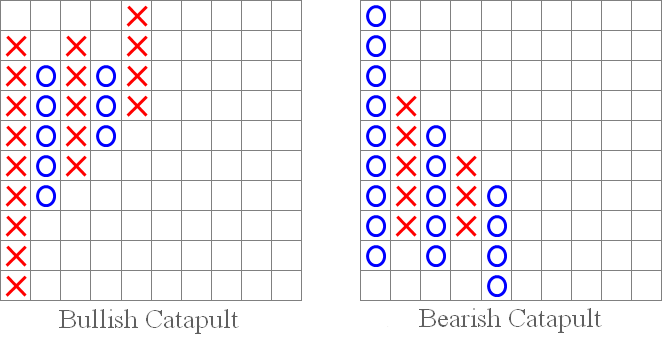
図6 "強気のカタパルト" パターンと "弱気のカタパルト" パターン
-
"45°トレンドライン" パターン
『45°トレンドライン』 パターンはサポートラインまたはレジスタンスラインを作成します。そのラインを越えれば、売りシグナル(右図に示されるように)か買いシグナル(左図)を取得します。
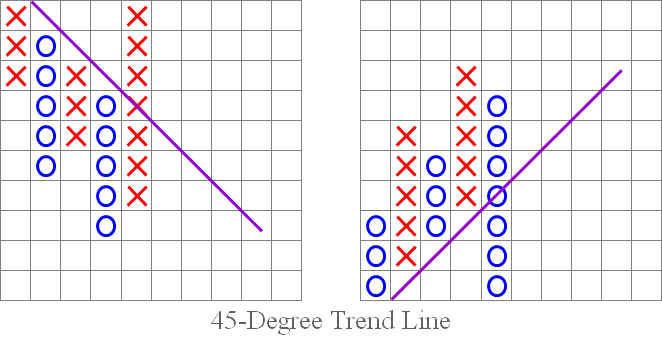
図7 "45°トレンドライン" パターン
標準的なポイントとグラフチャートのパターンとシグナルを考察しました。ここから本稿冒頭で述べたインディケータチャートでそれらを確認します。
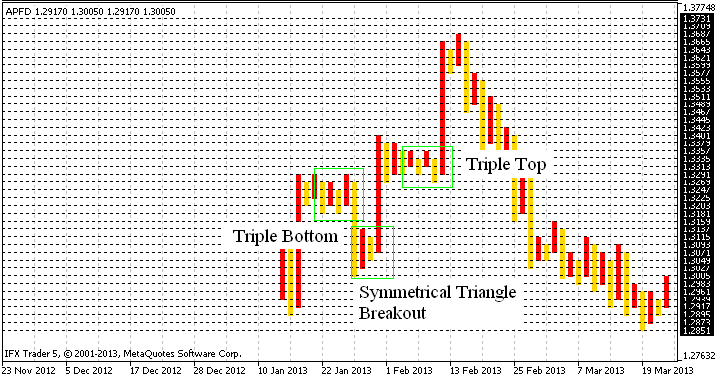
図8 ポイントとグラフチャートでのパターン特定
おわりに
本稿の最終段階に参りました。ここではポイントとグラフチャートは時間の経過とともに失われることはなく、まだ活発に使用されています。それはまたその価値があることを証明していることをお話したいと思います。
作成されたインディケータは、通常のXや Oの代わりにチャート化をブロックし「ストラテジーテスタ」での検証を無効にする(むしろ正しくない処理)など欠点は否めませんが、かなり正確なチャート化結果をもたらします。
また、このアルゴリズムはわずかな修正バージョンではありますが、Renko チャートに使用できる可能性があります。またメニューオプションを用いて両方のチャートタイプを1つのコードに統合するのにも利用できます。これは必要に応じて選択が可能です。メインウィンドウで直接チャートをプロットする機能は除外しません。それはまたややコードの変更を必要とします。
一般的に本稿の目的はインディケータ開発に関する私の考え方を共有することでした。私の初稿についてコメントやフィードバックをいただけると助かります。私の記事に興味をもっていただきありがとうございました!
MetaQuotes Ltdによってロシア語から翻訳されました。
元の記事: https://www.mql5.com/ru/articles/656
警告: これらの資料についてのすべての権利はMetaQuotes Ltd.が保有しています。これらの資料の全部または一部の複製や再プリントは禁じられています。
この記事はサイトのユーザーによって執筆されたものであり、著者の個人的な見解を反映しています。MetaQuotes Ltdは、提示された情報の正確性や、記載されているソリューション、戦略、または推奨事項の使用によって生じたいかなる結果についても責任を負いません。
 指数平滑化を利用した時系列予測(続編)
 マシンラーニング:サポートベクターマシンをトレーディングで利用する方法
 EX5 ライブラリ使用による開発プロジェクトの促進
- 無料取引アプリ
- 8千を超えるシグナルをコピー
- 金融ニュースで金融マーケットを探索
MT5用の他のP&Fインジケータ(もちろん無料!)を知っていますか?
https://www.mql5.com/ja/code/954
https://www.mql5.com/ja/articles/368
取引、自動取引システム、取引戦略のテストに関するフォーラム
インジケーターポイント・アンド・フィギュア
ニューデジタル, 2013.09.12 16:29
ポイント&フィギュア・チャート
ポイント&フィギュア・チャートは、チャート上の時間の重要性を減らし、代わりに価格の動きに焦点を当てます。ポイント&フィギュア・チャートはXとOで構成され、Xは新高値、Oは新安値です。ポイント&フィギュア・チャートには2つのインプットがあります:
ポイント・アンド・フィギュア・チャートの主な用途のひとつで、このセクションで強調されているのは、ポイント・アンド・フィギュア・チャートによって、トレーダーが古典的なチャート・パターンを見やすくなるということです。下のE-ミニS&P500フューチャーのチャートでは、ポイント&フィギュア・チャートはサポート・ラインとレジスタンス・ライン、そして価格ブレイクアウトのエリアを強調している:
ここでも、ポイント&フィギュア・チャートは、EミニS&P500先物のチャートにおけるダブルボトム・パターンをトレーダーに見やすくしている:
上のE-miniチャートは、ダブルボトムパターンの2つのボトムと、突き抜けた確認ラインを示し、結果として買いの機会をもたらしている。
ポイント&フィギュアは、マーケットアクションをプロットする非常にユニークな方法です。ポイント&フィギュア・チャートの特長は、時間の要素を排除し、真に重要なもの、すなわち価格に焦点を当てることです。試してみたところ、カラムの色のエラーはカラムの定義に関連していることが理解できました。
一つの列ではなく、列が連続したブロックで区切られ、すべての列がくっつくのが良い(弱気な列が次の強気な列にくっつくなど)。
試してみたところ、列の色の誤差は列の定義に関係していることがわかった。