
세줄 브레이크 차트(Three Line Break Chart)를 구성하기 위한 지시자
소개
이전 기사에서는 Point and Figure, Kagi and Renko 차트를 고려했습니다. 20세기 차트에 대한 일련의 기사에 이어서, 이번에는 Three Line Break 차트에 대해 말씀드리고 또는, 정확히 말하면, 프로그램 코드를 통한 구현에 대한 것입니다. 이 차트의 출처에 대한 정보는 거의 없습니다. 일본에서 시작된 것 같아요. 미국에서는 스티브 니슨이 1994년에 출판한 "캔들스틱 그 너머"에서 이 사실을 알게 되었습니다.
위에서 언급한 차트뿐만 아니라 "Three Line Break chart"를 구성할 때도 시간 범위가 고려되지 않습니다. 그것은 이전 이동과 관련하여 가격의 사소한 변동을 필터링할 수 있는 특정 기간의 새로 형성된 종가를 기반으로 합니다.
Steve Nison은 그의 책 "캔들스틱 그 너머(Beyond Candlesticks)"에서 이 차트를 그리는 11가지 원리를 설명했습니다. (페이지. 185). 그것들을 셋으로 통합했습니다.
- 원리 №1: 구성의 경우 초기 가격을 선택한 후 시장이 상승 또는 하락하는지 여부에 따라 오름선을 그립니다. 새 최소값 또는 최대값으로 표시됩니다.
- 원리 №2: 신규 가격이 최저 가격 이하로 떨어지거나 최고 가격을 초과할 때 내림선 또는 상승선을 그릴 수 있습니다.
- 원리 №3: 이전 동작과 반대 방향으로 선을 긋기 위해서는 최소 또는 최대값을 통과해야 합니다. 동시에 둘 이상의 동일한 선이 있는 경우 최소 또는 최대값은 두 개(연속적으로 동일한 선이 두 개 있는 경우) 또는 세 개(연속적으로 동일한 선이 세 개 이상 있는 경우)를 기준으로 계산됩니다.
과거 데이터를 기반으로 한 고전적인 차트 구성의 예를 자세히 살펴보겠습니다(그림 1).
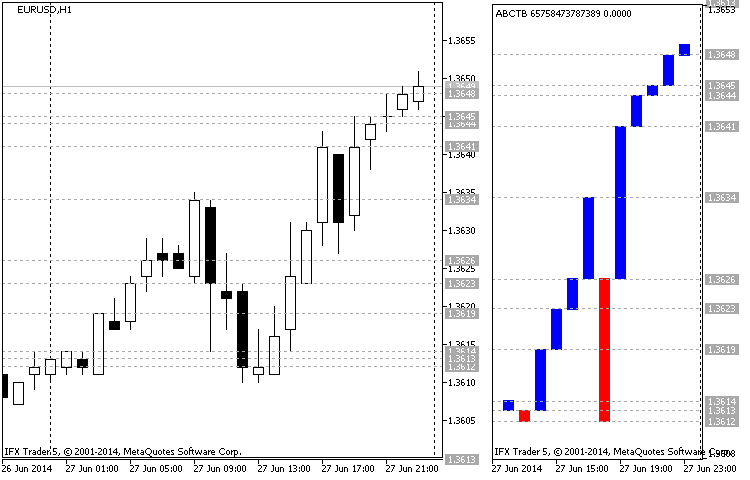
그림.1 3행 브레이크 차트(Three Line Break chart) 구성 예제 (EURUSD H1 27.06.2014)
그림 1은 왼쪽에 있는 캔들스틱(Candlestick) 차트와 오른쪽에 있는 세 줄 브레이크(Three Line Break) 차트를 나타냅니다. 이것은 EURUSD, 타임프레임 H1의 차트입니다. 차트의 시작일은 가격 1.3613(캔들 마감 시간은 00:00)으로 27.06.2014이며, 그 후 캔들(01:00)은 1.3614로 마감되어 세줄 브레이크(Three Line Break) 차트의 첫 번째 상승선을 형성합니다. 약세 방향(02:00)의 다음 캔들은 1.3612로 마감되는 상승선을 형성합니다(마감가는 이전 최소값보다 낮음).
그런 다음, 강세 캔들이 1.3619 (03:00) 선을 향해 새로운 최고점과 선을 형성하며 가격을 올리고 있습니다. 04:00의 캔들이 최소치 이하로 떨어지지 않아 구성에 영향을 미치지 않았습니다. 05:00의 캔들은 1.3623에서 닫히며, 새 최대값(새 오름차순)을 표시합니다.
이제 하락세를 연장하기 위해서는 최소치(1.3613)를 두 번 넘어야 하지만, 황소(bulls)는 포지션을 포기하지 않고 최고치인 1.3626(06:00)을 형성할 것입니다. 그러면 황소(bulls)가 두 시간 동안 상승 추세를 되돌리려고 하지만 1.3634(09:00)이라는 새로운 최대치를 달성하면서 같은 추세가 계속됩니다. 황소(Bulls)들이 앞서고 있습니다. 이제 오름선을 그리려면, 세 개의 최소값(1.3626; 1.3623 및 1.3619)을 통과해야 합니다.
우리가 볼 수 있는 바와 같이, 다음 세 시간 동안 곰들이 시장을 장악하고 1.3612(12:00)까지 하락하고 있습니다. 새로운 오름선에 반영됩니다. 하지만, 다음 5시간 동안, 황소들은 그들의 위치를 되찾고 1.3641의 지점으로 시장을 되돌리고, 1.3626의 이전 최고치를 지나 17:00에 새로운 상승선을 형성하고 있다는 것을 보여줍니다. 곰들은 18:00에 이전 최소치를 통과하지 못했고, 이후 5시간 동안 장세가 1.3649까지 치솟아 매시간 새로운 상승선을 형성하고 있습니다.
차트 구성의 기본 사항
코드에 대해 살펴보기 전에 지시자 자체에 대해 이야기하면서 지시자가 다른 지시자와 어떻게 다른지 알아보겠습니다. 다른 지표와 마찬가지로, 세줄 브레이크(Three Line Break)는 효율적인 시장 분석과 새로운 전략의 검색을 촉진하기 위해 고안된 것이 분명합니다. 저는 여러분이 새로운 점이 있는지 알고 싶어할 것이라고 확신합니다. 사실 그 중 몇 가지가 있습니다. 이 지표를 통해 계산을 위해 가격 유형을 변경할 수 있습니다. 네 가지 기준 가격을 모두 충족합니다. 클래식 유형은 현대화된 한 가지 가격 유형이 네 가지 가격 유형(open, high, low и close)을 모두 사용할 경우, 한 가지 가격 유형에 대해서만 차트를 작성하도록 설계되었습니다. 선에 "그림자"를 추가하고 일본 캔들스틱처럼 보이게 하여 차트의 시각적 인식을 추가함으로써 클래식 차트 구성의 모양을 수정합니다.
또한 현대화된 버전에서는 가격 데이터를 제 시간에 동기화하여 누락된 가격을 우선 순위로 대체하는 설정을 제공합니다.
도표 구성의 현대화 유형은 그림. 2에서 확인할 수 있습니다:
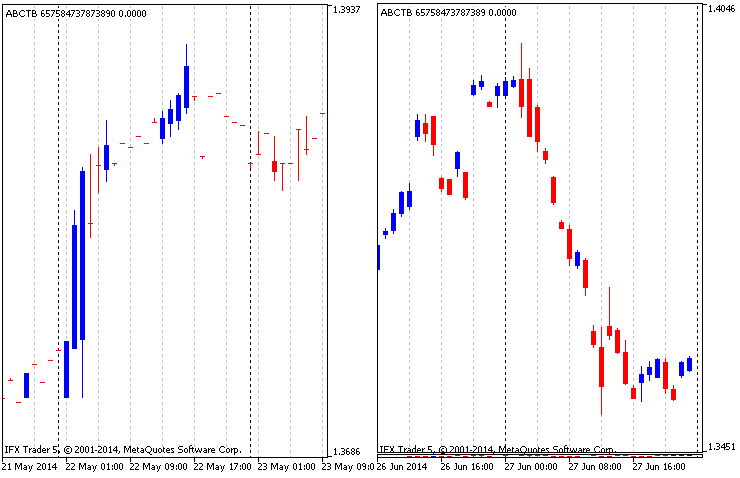
그림.2 네 가지 가격 유형을 기준으로 수정한 차트
현대화된 공사는 가격 유형이 다른 4개의 Three Line Break 차트를 결합하고 있기 때문에, 가격 간의 불일치를 발견하는 것은 당연합니다. 이를 방지하려면 데이터 동기화가 제 시간에 이루어져야 합니다. 가격 동기화는 전체(오른쪽 그림 2)와 부분(왼쪽 그림 2)의 두 가지 변형으로 수행되었습니다. 전체(완료) 동기화는 차트에 모든 데이터가 그려지고 누락된 데이터는 설정에 지정된 우선 순위 가격으로 대체되는 필터링된 부분 동기화를 나타냅니다. 완료(전체) 동기화 모드에서는 누락 데이터가 생략되고 전체 데이터 집합이 있는 캔들스틱만 그려집니다.
또 다른 혁신은 신호 분할의 편의를 위해 도입된 주기 구분자입니다. 잘 아시다시피, 주기 구분 기호는 차트 설정에서 활성화할 수 있습니다. 지표기에서는 설정에 지정된 시간에 따라 변경됩니다. 주기가 수직 점선으로 구분되는 MetaTrader 5의 차트와는 달리, 이 지표에서 새 주기는 선 색상(캔들, 그림 3)을 변경하여 표시됩니다.
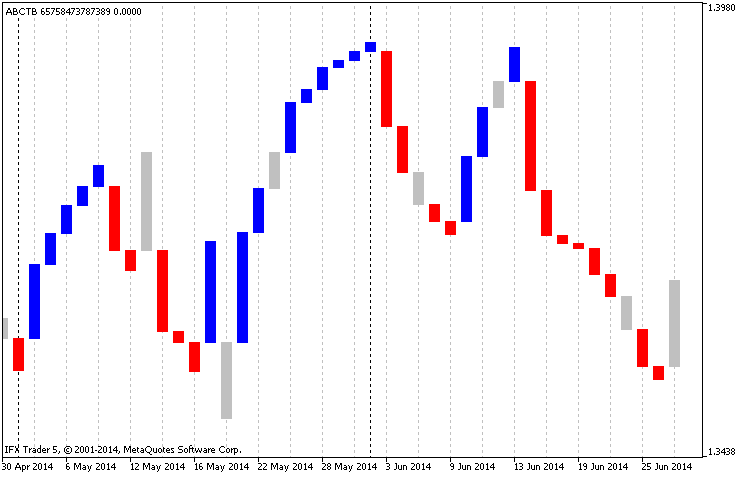
그림.3 표시기의 주기 구분자
또 다른 추가 사항은 기술 지표 iMA의 구현으로, 메인 차트의 가격을 기반으로 구축되지만 지표 데이터와 정시에 동기화됩니다. 따라서 데이터는 이동 평균으로 필터링됩니다(그림 4):
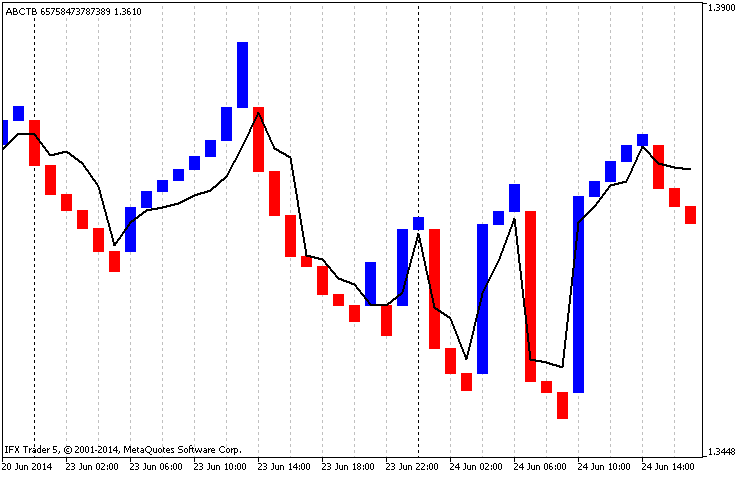
그림.4 내부 이동 평균
지표기에는 선을 그리기 위한 점의 최소 이동과 반전에 필요한 선 수를 설정하는 기능도 있습니다. 필터 역할도 합니다.
지표기의 코드
지표기의 알고리즘은 비교적 간단하며 데이터 복사, 복사된 데이터를 기반으로 계산 및 지표기의 버퍼 채우기(수신된 데이터를 기반으로 차트 구성)의 3단계로 구성됩니다. 코드는 자체 또는 입력 데이터와 상호 연결된 함수로 분할됩니다. 코드를 자세히 살펴보도록 하겠습니다.
1. 지표기의 매개 변수 입력
지표기의 서문에는 그래픽 구성 선언이 포함되어 있습니다. 지표기에는 그들 중 두가지가 있습니다: 차트 "ABCTB" (DRAW_COLOR_CANDLES) 및 추가 이동 평균 "LINE_TLB" (DRAW_LINE). 따라서, 6개의 버퍼가 있습니다. 그런 다음 enum 유형의 데이터를 따라 인터페이스 설정과 설정 자체를 개선합니다:
- magic_numb - 매직 넘버(Magic number)는 긴 유형을 가지고 있습니다. 그것은 지표기를 나타내는 고유 번호입니다. 필요성이 발생할 경우, 몇 가지 수정과 함께 스트링 유형으로 변환할 수 있습니다;
- time_frame - 계산 시간 범위, ENUM_TIMEFRAMES는 주요 매개변수(지표기의 시간)입니다;
- time_redraw - 차트 업데이트 기간, ENUM_TIMEFRAMES 유형. 차트 재계산이 수행되는 시간입니다. 차트를 빠르게 다시 그리려면 키보드의 "R" 키(지표기의 통합 컨트롤)를 누릅니다;
- first_date_start - 시작 날짜, datetime 유형. 데이터 복사 및 차트 작성의 시작점이 되는 주 매개 변수입니다;
- chart_price - 계산을 위한 가격 유형 (0-닫기, 1-열기, 2-높음, 3-낮음). 고전적인 차트 구성의 경우 하나의 가격 유형을 선택해야 합니다. 이미 언급한 바와 같이 수정된 구성을 사용할 경우 이 매개 변수는 무시됩니다;
- step_min_f - 새로운 열 (>0, type int) 또는 선 그리기에 필요한 점프의 최소 단계;
- line_to_back_f - 반전을 표시할 줄 수 (>0, type int). 클래식 유형은 반전을 나타내는 세 줄을 제안합니다;
- chart_type - 차트 생성 유형 (0-클래식, 1-수정), 유형 선택. 구성 유형 간의 스위치(전환)입니다;
- chart_color_period - 새 주기를 시작할 때 색상의 변경 (boolean(불린) 유형). 새 기간이 시작될 때 선 색을 변경하는 데 사용됩니다;
- chart_synchronization - 전체 동기화(boolean) 유형에서만 차트를 구성하는 경우, 차트를 구성하기 전에 모든 결측(누락)값을 삭제하는 완전한 동기화가 수행됩니다;
- chart_priority_close - 네가지 변수를 갖는 종가(마감 가격) (유형 선택)의 우선 순위. 부분 동기화 시 종가 우선 순위를 가리키고 전체 가격에서 무시됩니다;
- chart_priority_open - 개시 가격의 우선 순위. 이 경우에도 마찬가지입니다;
- chart_priority_high - 최대 가격의 우선 순위. 이 경우에도 마찬가지입니다;
- chart_priority_low - 최소 가격의 우선 순위. 이 경우에도 마찬가지입니다;
- ma_draw - 평균을 그립니다 (boolean 유형, 참이면, 이동 평균을 그립니다);
- ma_price - 평균을 구성하는 가격 유형, ENUM_APPLIED_PRICE 중 하나일 수 있습니다;
- ma_method - 구성 유형, ENUM_MA_METHOD 중 하나일 수 있습니다;
- ma_period - 이동 평균의 평균 주기;
그런 다음 계산에 필요한 버퍼 배열, 변수 및 구조를 선언합니다.
//+------------------------------------------------------------------+
//|                                                        ABCTB.mq5 |
//|                                 "Azotskiy Aktiniy ICQ:695710750" |
//|                        "" |
//+------------------------------------------------------------------+
// ABCTB - Auto Build Chart Three Line Break
#property copyright "Azotskiy Aktiniy ICQ:695710750"
#property link      ""
#property version   "1.00"
#property indicator_separate_window
#property indicator_buffers 6
#property indicator_plots   2
//--- plot ABCTB
#property indicator_label1  "ABCTB"
#property indicator_type1   DRAW_COLOR_CANDLES
#property indicator_color1  clrBlue,clrRed,clrGreenYellow
#property indicator_style1  STYLE_SOLID
#property indicator_width1  1
//--- plot LINE_TLB
#property indicator_label2  "LINE_TLB"
#property indicator_type2   DRAW_LINE
#property indicator_color2  clrRed
#property indicator_style2  STYLE_SOLID
#property indicator_width2  1
//--- Price type for calculation
enum type_price
  {
   close=0, // Close
   open=1,  // Open
   high=2,  // Hight
   low=3,   // Low
  };
//--- type of chart construction
enum type_build
  {
   classic=0,  // Classic
   modified=1, // Modified
  };
//--- priority
enum priority
  {
   highest_t=4, // Highest
   high_t=3,    // High
   medium_t=2,  // Medium
   low_t=1,     // Low
  };
//--- input parameters
input long               magic_numb=65758473787389;                // Magic number
input ENUM_TIMEFRAMES    time_frame=PERIOD_CURRENT;                // Calculation time range
input ENUM_TIMEFRAMES    time_redraw=PERIOD_M1;                    // Period of chart updates
input datetime           first_date_start=D'2013.03.13 00:00:00';  // Start date
input type_price         chart_price=close;                        // Price type for calculation (0-Close, 1-Open, 2-High, 3-Low)
input int                step_min_f=4;                             // Minimum step for a new column (>0)
input int                line_to_back_f=3;                         // Number of lines to display a reversal(>0)
input type_build         chart_type=classic;                       // Type of chart construction (0-classic, 1-modified)
input bool               chart_color_period=true;                  // Changing color for a new period
input bool               chart_synchronization=true;               // Constructing a chart only upon complete synchronization
input priority           chart_priority_close=highest_t;           // Priority of the closing price
input priority           chart_priority_open=highest_t;            // Priority of the opening price
input priority           chart_priority_high=highest_t;            // Priority of the maximum price
input priority           chart_priority_low=highest_t;             // Priority of the minimum price
input bool               ma_draw=true;                             // Draw the average
input ENUM_APPLIED_PRICE ma_price=PRICE_CLOSE;                     // Price type for constructing the average
input ENUM_MA_METHOD     ma_method=MODE_EMA;                       // Construction type
input int                ma_period=14;                             // Averaging period
//--- indicator buffers
//--- buffer of the chart
double         ABCTBBuffer1[];
double         ABCTBBuffer2[];
double         ABCTBBuffer3[];
double         ABCTBBuffer4[];
double         ABCTBColors[];
//--- buffer of the average
double         LINE_TLBBuffer[];
//--- variables
MqlRates rates_array[];// bar data array for analysis
datetime date_stop;    // current date
datetime date_start;   // start date variable for calculation
//+------------------------------------------------------------------+
//| Struct Line Price                                                |
//+------------------------------------------------------------------+
struct line_price// structure for storing information about the past lines
  {
   double            up;  // value of the high price
   double            down;// value of the low price
  };
//+------------------------------------------------------------------+
//| Struct Line Information                                          |
//+------------------------------------------------------------------+
struct line_info// structure for storing information about the shared lines
  {
   double            up;
   double            down;
   char              type;
   datetime          time;
  };
line_info line_main_open[];  // data on the opening prices chart
line_info line_main_high[];  // data on the maximum prices chart
line_info line_main_low[];   // data on the minimum prices chart
line_info line_main_close[]; // data on the closing prices chart
//+------------------------------------------------------------------+
//| Struct Buffer Info                                               |
//+------------------------------------------------------------------+
struct buffer_info// structure for storing data for filling a buffer
  {
   double            open;
   double            high;
   double            low;
   double            close;
   char              type;
   datetime          time;
  };
buffer_info data_for_buffer[];// data for filling the modified construction buffer
datetime array_datetime[];    // array for storing information of the time for every line
int time_array[3];            // array for the function func_date_color
datetime time_variable;       // variable for the function func_date_color
bool latch=false;             // variable-latch for the function func_date_color
int handle;                   // handle of the indicator iMA
int step_min;                 // variable of the minimum step
int line_to_back;             // variable of the number of lines to display a reversal
-->
2. OnInit 함수
모든 indicator buffers 지표기 버퍼는 OnInit 함수에서 선언되며, 배열 표시는 시간 시리즈(timeseries)에서와 같이 설정됩니다.
그런 다음 차트에 반영되지 않을 인디케이터의 값을 설정하고, 이름을 설정하며, 정확도를 지정하고, 차트에 오버로드될 때 현재 값을 제거합니다. 여기서는 지표기의 iMA의 핸들을 설정하고 입력된 데이터의 정확성을 확인합니다. 오류가 발생할 경우 해당 메시지가 인쇄되고 값이 최소값으로 변경됩니다.
//+------------------------------------------------------------------+
//| Custom indicator initialization function                         |
//+------------------------------------------------------------------+
int OnInit()
  {
//--- indicator buffers mapping
//--- buffers for a chart
   SetIndexBuffer(0,ABCTBBuffer1,INDICATOR_DATA);
   ArraySetAsSeries(ABCTBBuffer1,true);
   SetIndexBuffer(1,ABCTBBuffer2,INDICATOR_DATA);
   ArraySetAsSeries(ABCTBBuffer2,true);
   SetIndexBuffer(2,ABCTBBuffer3,INDICATOR_DATA);
   ArraySetAsSeries(ABCTBBuffer3,true);
   SetIndexBuffer(3,ABCTBBuffer4,INDICATOR_DATA);
   ArraySetAsSeries(ABCTBBuffer4,true);
   SetIndexBuffer(4,ABCTBColors,INDICATOR_COLOR_INDEX);
   ArraySetAsSeries(ABCTBColors,true);
//--- buffer for constructing the average
   SetIndexBuffer(5,LINE_TLBBuffer,INDICATOR_DATA);
   ArraySetAsSeries(LINE_TLBBuffer,true);
//--- set the values that are not going to be reflected on the chart
   PlotIndexSetDouble(0,PLOT_EMPTY_VALUE,0); // for the chart
   PlotIndexSetDouble(1,PLOT_EMPTY_VALUE,0); // for the average
//--- set the indicator appearance
   IndicatorSetString(INDICATOR_SHORTNAME,"ABCTB "+IntegerToString(magic_numb)); // name of the indicator
//--- accuracy of display
   IndicatorSetInteger(INDICATOR_DIGITS,_Digits);
//--- prohibit displaying the results of the indicator current value
   PlotIndexSetInteger(0,PLOT_SHOW_DATA,false);
   PlotIndexSetInteger(1,PLOT_SHOW_DATA,false);
//---
   handle=iMA(_Symbol,time_frame,ma_period,0,ma_method,ma_price);
   if(step_min_f<1)
     {
      step_min=1;
      Alert("Minimum step for a new column must be greater than zero");
     }
   else step_min=step_min_f;
//---
   if(line_to_back_f<1)
     {
      line_to_back=1;
      Alert("The number of lines to display a reversal must be greater than zero");
     }
   else line_to_back=line_to_back_f;
//---
   return(INIT_SUCCEEDED);
  }
-->
3. 데이터 복사 기능
이 지표는 네 가지 유형의 가격과 연동되도록 설계되었기 때문에 시간을 포함한 모든 데이터를 복사하는 것이 필수적입니다. MQL5에는 MqlRates이라는 구조가 있습니다. 거래 시작 시간, 가격, 수량 및 스프레드에 대한 정보를 저장하는 데 사용됩니다.
함수의 입력 매개 변수는 MqlRates 유형의 시작 및 종료 날짜, 시간 및 대상 배열입니다. 복사가 성공하면 함수가 true를 반환합니다. 데이터가 중간 배열로 복사됩니다. 계산된 결측 데이터와 세션 하나가 복사되어 데이터가 영구적으로 갱신됩니다. 중간 배열로 복사가 성공하면 데이터가 배열에 복사되어 전달되어 함수가 올바르게 작동하는지 확인합니다.
//+------------------------------------------------------------------+
//| Func All Copy                                                    |
//+------------------------------------------------------------------+
bool func_all_copy(MqlRates &result_array[],// response array
                   ENUM_TIMEFRAMES period,  // timeframe
                   datetime data_start,     // start date
                   datetime data_stop)      // end date
  {
//--- declaration of auxiliary variables
   bool x=false;       // variable for the function response
   int result_copy=-1; // copied data count
//--- adding variables and arrays for calculation
   static MqlRates interim_array[]; // temporary dynamic array for storing copied data
   static int bars_to_copy;         // number of bars for copying
   static int bars_copied;          // number of copied bars since the start date
//--- find out the current number of bars in the time range
   bars_to_copy=Bars(_Symbol,period,data_start,data_stop);
//--- count the number of bars to be copied
   bars_to_copy-=bars_copied;
//--- if it is not the first time when data is being copied
   if(bars_copied>0)
     {
      bars_copied--;
      bars_to_copy++;
     }
//--- change the size of the receiving array
   ArrayResize(interim_array,bars_to_copy);
//--- copy data to a temporary array
   result_copy=CopyRates(_Symbol,period,0,bars_to_copy,interim_array);
//--- check the result of copying data
   if(result_copy!=-1) // if copying to the temporary array was successful
     {
      ArrayCopy(result_array,interim_array,bars_copied,0,WHOLE_ARRAY); // copy the data from the temporary array to the main one
      x=true;                   // assign the positive response to the function
      bars_copied+=result_copy; // increase the value of the copied data
     }
//---
   return(x);
  }
-->
4. 데이터 계산 함수
이 함수는 세 줄 브레이크(Three Line Break) 차트의 고전적인 구성을 위한 데이터 계산의 프로토타입입니다. 앞에서 언급한 것처럼 함수는 데이터만 계산하여 코드 시작 부분에 선언된 구조체 유형 line_info의 특수 배열로 구성합니다.
이 기능에는 func_regrouping(재그룹화 기능)과 func_insert(삽입 기능)의 두 가지 기능이 있습니다. 먼저 시작하기 위해, 다음과 같은 내용을 살펴보겠습니다:
4.1. 함수를 다시 그룹화
이 함수는 동일한 방향의 연속 라인에 대한 정보를 다시 그룹화합니다. 이 값은 전달된 배열의 크기 또는 정확히는 지시자 설정에서 매개 변수 line_to_back_f (반전을 표시할 줄 수) 에 의해 제한됩니다. 따라서 컨트롤이 함수로 전달될 때마다 동일한 선에 대한 수신된 모든 데이터가 한 점 아래로 이동하며 인덱스 0은 새로운 값으로 채워집니다.
이는 중단(break)에 필요한 라인에 대한 정보를 저장하는 방법입니다(클래식 구성의 경우 중단(break)에는 세 개의 줄이 있습니다).
//+------------------------------------------------------------------+
// Func Regrouping                                                   |
//+------------------------------------------------------------------+
void func_regrouping(line_price &input_array[],// array for regrouping
                     double new_price,         // new price value
                     char type)                // type of movement
  {
   int x=ArraySize(input_array);// find out the size of the array for regrouping
   for(x--; x>0; x--)           // regrouping loop
     {
      input_array[x].up=input_array[x-1].up;
      input_array[x].down=input_array[x-1].down;
     }
   if(type==1)
     {
      input_array[0].up=new_price;
      input_array[0].down=input_array[1].up;
     }
   if(type==-1)
     {
      input_array[0].down=new_price;
      input_array[0].up=input_array[1].down;
     }
  }
-->
4.2. 삽입 기능
함수는 응답 배열에 값을 삽입합니다. 코드는 간단하며 자세한 설명이 필요하지 않습니다.
//+------------------------------------------------------------------+
// Func Insert                                                       |
//+------------------------------------------------------------------+
void func_insert(line_info &line_m[],  // target array
                 line_price &line_i[], // source array
                 int index,            // array element being inserted
                 char type,            // type of the target column
                 datetime time)        // date
  {
   line_m[index].up=line_i[0].up;
   line_m[index].down=line_i[0].down;
   line_m[index].type=type;
   line_m[index].time=time;
  }
-->
데이터 계산 기능은 일반적으로 세 부분으로 나뉘었습니다. 첫 번째 부분은 연산자 switch(스위치)의 도움을 받아 분석 중인 데이터를 중간 배열로 복사합니다. 관련 가격만 복사됩니다. 두 번째 파트에서는 데이터 배열의 필요한 공간을 계산하기 위해 테스트를 실행합니다. 그런 다음 처음 반응에 대한 함수에 전달된 데이터 배열 line_main_array[] 가 변경됩니다. 세 번째 부분은 수정된 데이터 배열을 채웁니다.
//+------------------------------------------------------------------+
//| Func Build Three Line Break                                      |
//+------------------------------------------------------------------+
void func_build_three_line_break(MqlRates &input_array[],      // array for analysis
                                 char price_type,              // type of the price under analysis (0-Close, 1-Open, 2-High, 3-Low)
                                 int min_step,                 // minimum step for drawing a line
                                 int line_back,                // number of lines for a reversal
                                 line_info &line_main_array[]) // array for return (response) of the function
  {
//--- calculate the size of the array for analysis
   int array_size=ArraySize(input_array);
//--- extract data required for calculation to an intermediate array
   double interim_array[];// intermediate array
   ArrayResize(interim_array,array_size);// adjust the intermediate array to the size of the data
   switch(price_type)
     {
      case 0: // Close
        {
         for(int x=0; x<array_size; x++)
           {
            interim_array[x]=input_array[x].close;
           }
        }
      break;
      case 1: // Open
        {
         for(int x=0; x<array_size; x++)
           {
            interim_array[x]=input_array[x].open;
           }
        }
      break;
      case 2: // High
        {
         for(int x=0; x<array_size; x++)
           {
            interim_array[x]=input_array[x].high;
           }
        }
      break;
      case 3: // Low
        {
         for(int x=0; x<array_size; x++)
           {
            interim_array[x]=input_array[x].low;
           }
        }
      break;
     }
//--- enter the variables for storing information about current situation
   line_price passed_line[];// array for storing information about the latest prices of the lines (type structure line_price)
   ArrayResize(passed_line,line_back+1);
   int line_calc=0;// number of lines
   int line_up=0;// number of the last ascending lines
   int line_down=0;// number of the last descending lines
   double limit_up=0;// upper limit necessary to pass
   double limit_down=0;// lower limit necessary to pass
/* Fill variables informing of the current situation with the first values */
   passed_line[0].up=interim_array[0];
   passed_line[0].down=interim_array[0];
//--- start the first loop to calculate received data for filling a buffer for drawing
   for(int x=0; x<array_size; x++)
     {
      if(line_calc==0)// no lines have been drawn
        {
         limit_up=passed_line[0].up;
         limit_down=passed_line[0].down;
         if(interim_array[x]>=limit_up+min_step*_Point)// the upper limit has been passed
           {
            func_regrouping(passed_line,interim_array[x],1);// regroup
            line_calc++;// update the line counter
            line_up++;
           }
         if(interim_array[x]<=limit_down-min_step*_Point)// the lower limit has been passed
           {
            func_regrouping(passed_line,interim_array[x],-1);// regroup
            line_calc++;// update the line counter
            line_down++;
           }
        }
      if(line_up>line_down)// last ascending line (lines)
        {
         limit_up=passed_line[0].up;
         limit_down=passed_line[(int)MathMin(line_up,line_back-1)].down;
         if(interim_array[x]>=limit_up+min_step*_Point)// the upper limit has been passed
           {
            func_regrouping(passed_line,interim_array[x],1);// regroup
            line_calc++;// update the line counter
            line_up++;
           }
         if(interim_array[x]<limit_down)// the lower limit has been passed
           {
            func_regrouping(passed_line,interim_array[x],-1);// regroup
            line_calc++;// update the line counter
            line_up=0;
            line_down++;
           }
        }
      if(line_down>line_up)// last descending line (lines)
        {
         limit_up=passed_line[(int)MathMin(line_down,line_back-1)].up;
         limit_down=passed_line[0].down;
         if(interim_array[x]>limit_up)// the upper limit has been passed
           {
            func_regrouping(passed_line,interim_array[x],1);// regroup
            line_calc++;// update the line counter
            line_down=0;
            line_up++;
           }
         if(interim_array[x]<=limit_down-min_step*_Point)// the lower limit has been passed
           {
            func_regrouping(passed_line,interim_array[x],-1);// regroup
            line_calc++;// update the line counter
            line_down++;
           }
        }
     }
   ArrayResize(line_main_array,line_calc);// change the size of the target array
//--- zeroise variables and fill with the the initial data
   line_calc=0;
   line_up=0;
   line_down=0;
   passed_line[0].up=interim_array[0];
   passed_line[0].down=interim_array[0];
//--- start the second loop to fill a buffer for drawing
   for(int x=0; x<array_size; x++)
     {
      if(line_calc==0)// no lines have been drawn
        {
         limit_up=passed_line[0].up;
         limit_down=passed_line[0].down;
         if(interim_array[x]>=limit_up+min_step*_Point)// the upper limit has been passed
           {
            func_regrouping(passed_line,interim_array[x],1);// regroup
            func_insert(line_main_array,passed_line,line_calc,1,input_array[x].time);
            line_calc++;// update the line counter
            line_up++;
           }
         if(interim_array[x]<=limit_down-min_step*_Point)// the lower limit has been passed
           {
            func_regrouping(passed_line,interim_array[x],-1);// regroup
            func_insert(line_main_array,passed_line,line_calc,-1,input_array[x].time);
            line_calc++;// update the line counter
            line_down++;
           }
        }
      if(line_up>line_down)// last ascending line (lines)
        {
         limit_up=passed_line[0].up;
         limit_down=passed_line[(int)MathMin(line_up,line_back-1)].down;
         if(interim_array[x]>=limit_up+min_step*_Point)// the upper limit has been passed
           {
            func_regrouping(passed_line,interim_array[x],1);// regroup
            func_insert(line_main_array,passed_line,line_calc,1,input_array[x].time);
            line_calc++;// update the line counter
            line_up++;
           }
         if(interim_array[x]<limit_down)// the lower limit has been passed
           {
            func_regrouping(passed_line,interim_array[x],-1);// regroup
            func_insert(line_main_array,passed_line,line_calc,-1,input_array[x].time);
            line_calc++;// update the line counter
            line_up=0;
            line_down++;
           }
        }
      if(line_down>line_up)// last descending line (lines)
        {
         limit_up=passed_line[(int)MathMin(line_down,line_back-1)].up;
         limit_down=passed_line[0].down;
         if(interim_array[x]>limit_up)// the upper limit has been passed
           {
            func_regrouping(passed_line,interim_array[x],1);// regroup
            func_insert(line_main_array,passed_line,line_calc,1,input_array[x].time);
            line_calc++;// update the line counter
            line_down=0;
            line_up++;
           }
         if(interim_array[x]<=limit_down-min_step*_Point)// the lower limit has been passed
           {
            func_regrouping(passed_line,interim_array[x],-1);// regroup
            func_insert(line_main_array,passed_line,line_calc,-1,input_array[x].time);
            line_calc++;// update the line counter
            line_down++;
           }
        }
     }
  }
-->
5. 차트 구성의 함수
이 기능은 선택한 구성 파라미터(클래식 또는 수정)를 기준으로 차트에 대한 데이터를 계산하고 표시기 버퍼에 표시할 데이터를 채우는 데 사용됩니다. 이전 기능과 마찬가지로 차트 구성 기능에는 세 가지 추가 기능이 있습니다. 색상의 함수, 동기화의 함수, 이동 평균의 함수입니다. 그것들을 좀 더 자세히 논의해 보겠습니다.
5.1. 색상 함수
이 함수는 시간이라는 하나의 입력 매개 변수만 있습니다. 함수의 응답은 불린(boolean) 변수입니다. 전달된 데이터가 기간의 경계인 경우 함수는 true로 반환됩니다. 주기는 선택한 기간에 따라 달라지기 때문에 조건부 연산자 if에 의해 주기 분리가 내장되어 있습니다. 기간을 선택한 후 새 기간이 시작되었는지 확인합니다. 날짜를 구조 MqlDateTime로 변환하고 비교를 통해 수행됩니다. H2(포함)까지의 시간에서 날짜 값의 변경은 새 기간의 시작을 나타냅니다. H12에서 D1까지의 시간 프레임은 월의 변화를 나타내며 W1과 MN 사이는 연도의 변화를 확인합니다.
안타깝게도, MqlDateTime 구조에는 현재 주간에 대한 정보가 없습니다. 이 문제는 변수 time_variable로 표현되는 초기 지점을 생성함으로써 해결되었습니다. 더 나아가서, 일주일 중 몇 초가 이 날짜에서 공제됩니다.
//+------------------------------------------------------------------+
// Func Date Color                                                   |
//+------------------------------------------------------------------+
bool func_date_color(datetime date_time) // input date
  {
   bool x=false;// response variable
   int seconds=PeriodSeconds(time_frame);// find out the calculation time range
   MqlDateTime date;
   TimeToStruct(date_time,date);// convert data
   if(latch==false) // check the state of the latch
     {
      MqlDateTime date_0;
      date_0=date;
      date_0.hour=0;
      date_0.min=0;
      date_0.sec=0;
      int difference=date_0.day_of_week-1;
      datetime date_d=StructToTime(date_0);
      date_d=date_d-86400*difference;
      time_variable=date_d;
      latch=true;// lock the latch
     }
   if(seconds<=7200)// period is less than or equal to H2
     {
      if(time_array[0]!=date.day)
        {
         x=true;
         time_array[0]=date.day;
        }
     }
   if(seconds>7200 && seconds<=43200)// period is greater than H2 but less than or equal to H12
     {
      if(time_variable>=date_time)
        {
         x=true;
         time_variable=time_variable-604800;
        }
     }
   if(seconds>43200 && seconds<=86400)// period is greater than H12 but less than or equal to D1
     {
      if(time_array[1]!=date.mon)
        {
         x=true;
         time_array[1]=date.mon;
        }
     }
   if(seconds>86400)// period W1 or MN
     {
      if(time_array[2]!=date.year)
        {
         x=true;
         time_array[2]=date.year;
        }
     }
   return(x);
  }
-->
5.2. 동기화 기능
동기화 기능에는 6개의 입력 매개 변수가 있습니다. 이 중 4개는 가격의 우선 순위, 완전 또는 부분 동기화의 불린(boolean) 매개 변수 및 분석 대상 배열 자체입니다. 기능은 두 부분으로 나뉩니다. 완전 동기화와 부분 동기화의 경우입니다.
완전한 동기화는 세 단계로 수행됩니다:
- 네 가지 가격 유형에 대한 데이터를 모두 포함하는 조건을 만족하는 배열 요소의 계산입니다.
- 동일한 조건에서 요소를 중간 배열로 복사합니다.
- 중간 배열에서 매개 변수에 의해 전달된 배열로 복사합니다.
부분 동기화는 더 복잡합니다.
통과된 1차원 구조 배열은 2차원 구조로 변환되고 있습니다. 여기서 첫 번째 색인은 순서를 나타내고 두 번째 색인은 가격 유형을 나타냅니다. 그런 다음 4개의 요소가 포함된 1차원 배열이 도입됩니다. 가격 우선 순위 수준이 이 배열에 복사된 다음 배열이 정렬되어 우선 순위를 식별합니다. 그 후 루프 for 및 조건부 연산자 if를 사용하여 우선순위에 따라 분배를 수행합니다. 동시에 우선순위가 같으면 가격 순서는 다음과 같습니다: 닫힘, 열림, 높음, 낮음. 연산자 if가 첫 번째 우선순위 값을 찾자마자, 루프 for는 이전에 생성된 2차원 배열의 모든 0 데이터를 우선순위 값으로 대체합니다.
//+------------------------------------------------------------------+
// Func Synchronization                                              |
//+------------------------------------------------------------------+
void func_synchronization(buffer_info &info[],
                          bool synchronization,
                          char close,
                          char open,
                          char high,
                          char low)
  {
   if(synchronization==true)// carry out a complete synchronization
     {
      int calc=0;// count variable
      for(int x=0; x<ArraySize(info); x++)// count complete data
        {
         if(info[x].close!=0 && info[x].high!=0 && info[x].low!=0 && info[x].open!=0)calc++;
        }
      buffer_info i_info[];    // enter a temporary array for copying
      ArrayResize(i_info,calc);// change the size of the temporary array
      calc=0;
      for(int x=0; x<ArraySize(info); x++)// copy data into the temporary array
        {
         if(info[x].close!=0 && info[x].high!=0 && info[x].low!=0 && info[x].open!=0)
           {
            i_info[calc]=info[x];
            calc++;
           }
        }
      ZeroMemory(info);        // clear the target array
      ArrayResize(info,calc);  // change the size of the main array
      for(int x=0; x<calc; x++)// copy data from the temporary array to the main one
        {
         info[x]=i_info[x];
        }
     }
   if(synchronization==false)  // change zero values to priority ones
     {
      int size=ArraySize(info); // measure the size of the array
      double buffer[][4];       // create a temporary array for calculation
      ArrayResize(buffer,size); // change the size of the temporary array
      for(int x=0; x<size; x++) // copy data into the temporary array
        {
         buffer[x][0]=info[x].close;
         buffer[x][1]=info[x].open;
         buffer[x][2]=info[x].high;
         buffer[x][3]=info[x].low;
        }
      char p[4];// enter an array for sorting by the order
      p[0]=close; p[1]=open; p[2]=high; p[3]=low;// assign variables for further sorting
      ArraySort(p); // sort
      int z=0,v=0;  // initialize frequently used variables
      for(int x=0; x<4; x++)// taking into account the results of the sorting, look through all variables and substitute them according to the priority
        {
         if(p[x]==close)// priority is for the closing prices
           {
            for(z=0; z<size; z++)
              {
               for(v=1; v<4; v++)
                 {
                  if(buffer[z][v]==0)buffer[z][v]=buffer[z][0];
                 }
              }
           }
         if(p[x]==open)// priority is for the opening prices
           {
            for(z=0; z<size; z++)
              {
               for(v=0; v<4; v++)
                 {
                  if(v!=1 && buffer[z][v]==0)buffer[z][v]=buffer[z][1];
                 }
              }
           }
         if(p[x]==high)// priority is for the maximum prices
           {
            for(z=0; z<size; z++)
              {
               for(v=0; v<4; v++)
                 {
                  if(v!=2 && buffer[z][v]==0)buffer[z][v]=buffer[z][2];
                 }
              }
           }
         if(p[x]==low)// priority is for the minimum prices
           {
            for(z=0; z<size; z++)
              {
               for(v=0; v<3; v++)
                 {
                  if(buffer[z][v]==0)buffer[z][v]=buffer[z][3];
                 }
              }
           }
        }
      for(int x=0; x<size; x++)// copy data from the temporary array back
        {
         info[x].close=buffer[x][0];
         info[x].open=buffer[x][1];
         info[x].high=buffer[x][2];
         info[x].low=buffer[x][3];
        }
     }
  }
-->
5.3. 이동 평균의 함수
이것은 가장 간단한 기능입니다. OnInit 함수에 수신된 지시자 핸들을 사용하여 함수 파라미터에서 지난 날짜에 해당하는 값을 복사합니다. 그런 다음 이 값은 이 함수에 대한 응답으로 반환됩니다.
//+------------------------------------------------------------------+
// Func MA                                                           |
//+------------------------------------------------------------------+
double func_ma(datetime date)
  {
   double x[1];
   CopyBuffer(handle,0,date,1,x);
   return(x[0]);
  }
-->
차트를 표시하는 기능은 일반적으로 두 부분으로 나뉩니다. 고전적인 그래프와 수정된 그래프입니다. 이 함수는 구성을 위한 가격 유형(수정 구성 중 무시됨)과 구성 유형(고전 및 수정)의 두 가지 입력 매개 변수가 있습니다.
초기 단계에서 표시기 버퍼가 제거되고 구성 유형에 따라 두 부분으로 나뉩니다. 첫 번째 부분(수정된 구조에 대해 설명 중)은 네 가지 가격 유형을 모두 계산하기 위해 함수를 호출하는 것으로 시작합니다. 그런 다음 데이터 계산 기능을 호출할 때 수신되는 사용 중인 데이터를 복사할 공통 데이터 배열을 만듭니다. 그런 다음 수신된 데이터 배열이 정렬되고 복제된 데이터에서 지워집니다. 그런 다음 글로벌 수준에서 선언된 어레이 data_for_buffer[] 가 다음과 같은 데이터 동기화와 함께 연속 날짜를 기준으로 채워집니다. 지표기 버퍼 채우기 작업은 수정된 구조의 마지막 단계입니다.
두 번째 부분(고전적 구조)은 훨씬 더 간단합니다. 처음에는 데이터 계산 함수를 호출한 다음 표시기 버퍼를 채웁니다.
//+------------------------------------------------------------------+
//| Func Chart Build                                                 |
//+------------------------------------------------------------------+
void func_chart_build(char price, // price type for chart construction
                      char type)  // type of chart construction
  {
//--- Zeroise the buffers
   ZeroMemory(ABCTBBuffer1);
   ZeroMemory(ABCTBBuffer2);
   ZeroMemory(ABCTBBuffer3);
   ZeroMemory(ABCTBBuffer4);
   ZeroMemory(ABCTBColors);
   ZeroMemory(LINE_TLBBuffer);
   if(type==1)// construct a modified chart (based on all price types)
     {
      func_build_three_line_break(rates_array,0,step_min,line_to_back,line_main_close);// data on closing prices
      func_build_three_line_break(rates_array,1,step_min,line_to_back,line_main_open);// data on opening prices
      func_build_three_line_break(rates_array,2,step_min,line_to_back,line_main_high);// data on maximum prices
      func_build_three_line_break(rates_array,3,step_min,line_to_back,line_main_low);// data on minimum prices
      //--- calculate data arrays
      int line_main_calc[4];
      line_main_calc[0]=ArraySize(line_main_close);
      line_main_calc[1]=ArraySize(line_main_open);
      line_main_calc[2]=ArraySize(line_main_high);
      line_main_calc[3]=ArraySize(line_main_low);
      //--- gather the date array
      int all_elements=line_main_calc[0]+line_main_calc[1]+line_main_calc[2]+line_main_calc[3];// find out the number of all elements
      datetime datetime_array[];// enter the array for copying
      ArrayResize(datetime_array,all_elements);
      int y[4];
      ZeroMemory(y);
      for(int x=0;x<ArraySize(datetime_array);x++)// copy data into the array
        {
         if(x<line_main_calc[0])
           {
            datetime_array[x]=line_main_close[y[0]].time;
            y[0]++;
           }
         if(x<line_main_calc[0]+line_main_calc[1] && x>=line_main_calc[0])
           {
            datetime_array[x]=line_main_open[y[1]].time;
            y[1]++;
           }
         if(x<line_main_calc[0]+line_main_calc[1]+line_main_calc[2] && x>=line_main_calc[0]+line_main_calc[1])
           {
            datetime_array[x]=line_main_high[y[2]].time;
            y[2]++;
           }
         if(x>=line_main_calc[0]+line_main_calc[1]+line_main_calc[2])
           {
            datetime_array[x]=line_main_low[y[3]].time;
            y[3]++;
           }
        }
      ArraySort(datetime_array);// sort the array
      //--- delete replicated data from the array
      int good_info=1;
      for(int x=1;x<ArraySize(datetime_array);x++)// count useful information
        {
         if(datetime_array[x-1]!=datetime_array[x])good_info++;
        }
      ArrayResize(array_datetime,good_info);
      array_datetime[0]=datetime_array[0];// copy the first element as it is the pattern in the beginning of comparison
      good_info=1;
      for(int x=1;x<ArraySize(datetime_array);x++)// fill the new array with useful data
        {
         if(datetime_array[x-1]!=datetime_array[x])
           {
            array_datetime[good_info]=datetime_array[x];
            good_info++;
           }
        }
      //--- fill the buffer for drawing (colored candles)
      int end_of_calc[4];// variables of storing information about the last comparison
      ZeroMemory(end_of_calc);
      ZeroMemory(data_for_buffer);
      ArrayResize(data_for_buffer,ArraySize(array_datetime));// change the size of the declared global array for storing data before passing it to a buffer
      for(int x=0; x<ArraySize(array_datetime); x++)
        {
         data_for_buffer[x].time=array_datetime[x];
         for(int s=end_of_calc[0]; s<line_main_calc[0]; s++)
           {
            if(array_datetime[x]==line_main_close[s].time)
              {
               end_of_calc[0]=s;
               if(line_main_close[s].type==1)data_for_buffer[x].close=line_main_close[s].up;
               else data_for_buffer[x].close=line_main_close[s].down;
               break;
              }
           }
         for(int s=end_of_calc[1]; s<line_main_calc[1]; s++)
           {
            if(array_datetime[x]==line_main_open[s].time)
              {
               end_of_calc[1]=s;
               if(line_main_open[s].type==1)data_for_buffer[x].open=line_main_open[s].down;
               else data_for_buffer[x].open=line_main_open[s].up;
               break;
              }
           }
         for(int s=end_of_calc[2]; s<line_main_calc[2]; s++)
           {
            if(array_datetime[x]==line_main_high[s].time)
              {
               end_of_calc[2]=s;
               data_for_buffer[x].high=line_main_high[s].up;
               break;
              }
           }
         for(int s=end_of_calc[3]; s<line_main_calc[3]; s++)
           {
            if(array_datetime[x]==line_main_low[s].time)
              {
               end_of_calc[3]=s;
               data_for_buffer[x].low=line_main_low[s].down;
               break;
              }
           }
        }
      //--- start the function of synchronizing data
      func_synchronization(data_for_buffer,chart_synchronization,chart_priority_close,chart_priority_open,chart_priority_high,chart_priority_low);
      //--- preparatory actions before starting the function func_date_color
      ZeroMemory(time_array);
      time_variable=0;
      latch=false;
      //--- fill the buffer for drawing candles
      for(int x=ArraySize(data_for_buffer)-1,z=0; x>=0; x--)
        {
         ABCTBBuffer1[z]=data_for_buffer[x].open;
         ABCTBBuffer2[z]=data_for_buffer[x].high;
         ABCTBBuffer3[z]=data_for_buffer[x].low;
         ABCTBBuffer4[z]=data_for_buffer[x].close;
         if(ABCTBBuffer1[z]<=ABCTBBuffer4[z])ABCTBColors[z]=0;
         if(ABCTBBuffer1[z]>=ABCTBBuffer4[z])ABCTBColors[z]=1;
         if(func_date_color(data_for_buffer[x].time)==true && chart_color_period==true)ABCTBColors[z]=2;
         if(ma_draw==true)LINE_TLBBuffer[z]=func_ma(data_for_buffer[x].time);
         z++;
        }
     }
   else// construct a classic chart (based on one price type)
     {
      func_build_three_line_break(rates_array,price,step_min,line_to_back,line_main_close);// find data on selected prices
      ArrayResize(array_datetime,ArraySize(line_main_close));
      //--- preparatory actions before starting the function func_date_color
      ZeroMemory(time_array);
      time_variable=0;
      latch=false;
      //--- the buffer for drawing candles
      for(int x=ArraySize(line_main_close)-1,z=0; x>=0; x--)
        {
         ABCTBBuffer1[z]=line_main_close[x].up;
         ABCTBBuffer2[z]=line_main_close[x].up;
         ABCTBBuffer3[z]=line_main_close[x].down;
         ABCTBBuffer4[z]=line_main_close[x].down;
         if(line_main_close[x].type==1)ABCTBColors[z]=0;
         else ABCTBColors[z]=1;
         if(func_date_color(line_main_close[x].time)==true && chart_color_period==true)ABCTBColors[z]=2;
         if(ma_draw==true)LINE_TLBBuffer[z]=func_ma(line_main_close[x].time);
         z++;
        }
     }
  }
-->
6. 통합의 함수
이 기능은 모든 제어 지표기 요소를 통합합니다. 처음에는 현재 날짜를 정의한 다음 데이터를 복사하는 기능과 차트 구성 기능을 호출합니다.
//+------------------------------------------------------------------+
//| Func Consolidation                                               |
//+------------------------------------------------------------------+
void func_consolidation()
  {
//--- defining the current date
   date_stop=TimeCurrent();
//--- copying data for analysis
   func_all_copy(rates_array,time_frame,first_date_start,date_stop);
//--- basic construction of the chart
   func_chart_build(chart_price,chart_type);
   ChartRedraw();
  }
-->
7. 키 제어 및 자동 제어 구조의 기능
이러한 기능은 키보드의 "R" 키(OnChartEvent)를 누르거나 선택한 시간 범위(OnCalculate)에 따라 자동으로 지표기를 다시 그리도록 설계되었습니다. 후자는 새 막대 함수 (func_new_bar)에 의해 분석되고, 이는 IsNewBar에 설명된 함수의 단순화된 버전입니다.
//+------------------------------------------------------------------+
//| Custom indicator iteration function                              |
//+------------------------------------------------------------------+
int OnCalculate(const int rates_total,
                const int prev_calculated,
                const int begin,
                const double &price[])
  {
//---
   if(func_new_bar(time_redraw)==true)
     {
      func_consolidation();
     };
//--- return value of prev_calculated for next call
   return(rates_total);
  }
//+------------------------------------------------------------------+
//| ChartEvent function                                              |
//+------------------------------------------------------------------+
void OnChartEvent(const int id,
                  const long &lparam,
                  const double &dparam,
                  const string &sparam)
  {
//--- event of a keystroke
   if(id==CHARTEVENT_KEYDOWN)
     {
      if(lparam==82) //--- the key "R" has been pressed
        {
         func_consolidation();
        }
     }
  }
//+------------------------------------------------------------------+
//| Func New Bar                                                     |
//+------------------------------------------------------------------+
bool func_new_bar(ENUM_TIMEFRAMES period_time)
  {
//---
   static datetime old_times; // variable of storing old values
   bool res=false;            // variable of the analysis result
   datetime new_time[1];      // time of a new bar
//---
   int copied=CopyTime(_Symbol,period_time,0,1,new_time); // copy the time of the last bar to the cell new_time
//---
   if(copied>0) // everything is ок. data copied
     {
      if(old_times!=new_time[0]) // if the old time of the bar is not equal to the new one
        {
         if(old_times!=0) res=true; // if it is not the first start, then new bar = true
         old_times=new_time[0];     // remember the time of the bar
        }
     }
//---
   return(res);
  }
-->
이쯤에서 지시계 코드 설명을 마치고 사용 방법에 대해 설명하겠습니다.
지표 및 거래 전략 사용 예제
고전적인 차트 구성에 기초한 주요 분석 전략부터 시작하겠습니다.
1. 흰색과 검은색 선은 사고 팔라는 신호입니다.
대략 두 가지 규칙에 대해 말할 수 있습니다:
- 규칙 №1: 3개의 연속 오름줄이 있을 때 구입하고, 3개의 연속 내림줄이 있을 때 판매합니다. 연속된 세 줄은 나타나는 경향을 보여줍니다.
- 규칙 №2: 반전이 3개의 연속 오름선 아래로 떨어졌을 때, 반전이 3개의 연속 내림선보다 높을 때 매입합니다.
2013년 초부터 EURUSD H1의 전형적인 구조를 나타내는 그림 6을 살펴보겠습니다(분석된 시간 범위는 그림 5에 나와 있습니다).
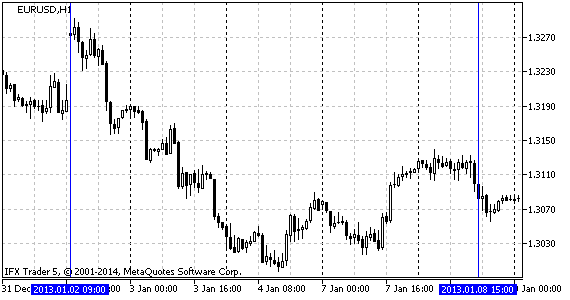
그림.5 분석된 시간 범위 EURUSD H1
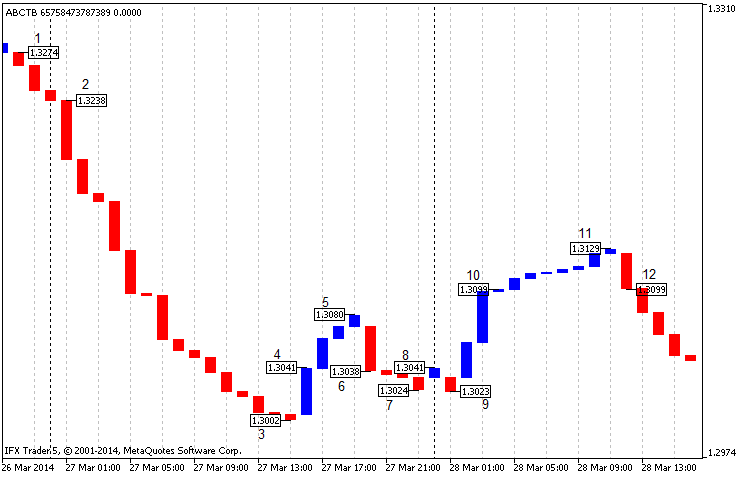
그림.6 EURUSD H1용 3라인 브레이크 차트의 고전적인 구성, 2013년 초 마감 가격.
차트(그림 6)에서는 판매 시작점인 포인트 1과 포인트 2 사이의 신호(규칙 №1)를 명확하게 볼 수 있습니다. 이 경우 소득은 소수점 4자리당 200 포인트가 넘습니다. 다음 포인트 4는 (규칙 №2와 같이) 구매에 유리한 상황을 나타냅니다. 5지점에서 마감했을 때 이익은 40 포인트였고, 6지점에서 손익분기점에 도달했습니다.
포인트 6에서는 판매 신호를 볼 수 있습니다(규칙 №2). 우리는 7포인트에서 마감할 때 10포인트의 수익을 얻고 8포인트에서 손익분기점을 얻습니다. 포인트 8과 9는 규칙 №1, 규칙 №2를 모두 만족시키지 않으므로 신호로 간주할 수 없습니다. 우리는 포인트 10 (규칙 №1)에서 살 수 있고 포인트 11에서 마감할 때 20포인트, 또는 포인트 12에서 손익분기점도 얻을 수 있습니다. 모든 숫자가 반올림되었습니다.
최상의 경우, 이 전략을 사용하면 270점의 수익을 올릴 수 있는데, 이는 매우 인상적입니다. 동시에, 지정된 시간 범위 내에서 이익에 영향을 미치는 격렬한 움직임이 있습니다. 최악의 경우, 거래는 손익분기점의 결과를 가져올 수 있는데, 이것은 나쁘지 않습니다.
어떤 상황이 규칙 1이나 규칙 2 중 하나를 충족시킬 때, 우리는 경향과 같은 방향으로 한 줄로 표현되는 경향 반전 확인을 기다릴 필요가 있습니다.
2. 등거리 채널, 지지선 및 저항선
또 다른 거래 전략은 삼행 브레이크 차트에 기술적 분석을 적용하는 것입니다. 그림 7을 살펴봅시다:
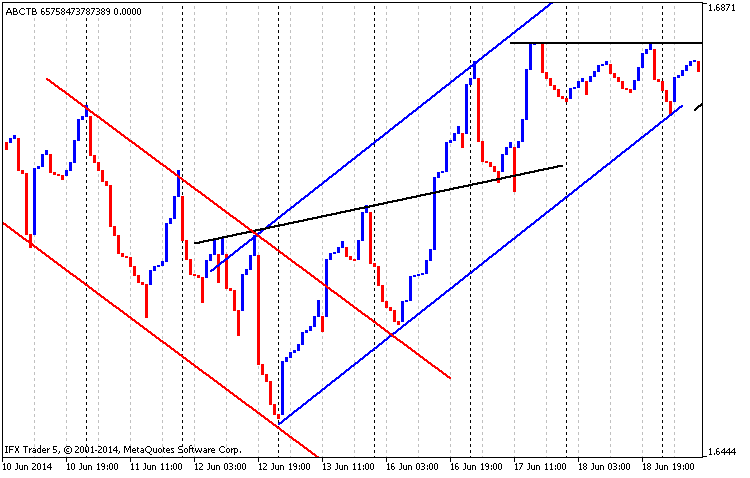
그림. 7 등거리 채널, 지지 및 저항 라인, GBPUSD H1, 시간 범위는 01.03.2014 ~ 01.05.2014
그림 7에서 여러분은 하강 등거리 채널은 빨간색 선으로, 상승 채널은 파란색 선으로, 그리고 지지선과 저항이 검은색으로 그려진 것을 볼 수 있습니다. 첫 번째 저항 라인이 지지선으로 바뀌고 있는 것이 분명합니다.
3. 캔들스틱 패턴
2013년 초에 USDCAD 페어의 시간 M30에 수정된 차트(두 줄 브레이크)가 상당히 흥미로워 보입니다.
신호를 정당화하는 일본 캔들스틱 패턴을 구별할 수 있습니다(그림 8).

그림. 8 수정된 Three Line Break 차트, USDCAD M30, 2013년 초, two lines break
차트의 앞부분에서, 우리는 №1에서 "Engulfing"의 반전 패턴을 볼 수 있습니다. 그것은 두 개의 캔들스틱으로 구성되어 있습니다: 빨간색과 앞의 파란색. 상승 추세선 이후 마켓은 원-캔들(one-candle) 반전 패턴 "해머"인, 넘버 2로 내려갑니다. 이 시점에서 시장은 방향을 바꿉니다. 패턴 №3("스피닝 탑(Spinning Top)")에서도 같은 현상이 발생합니다. 다음의 반전 패턴 "Kharami"(№4)는 캔들스틱 4와 그 옆에 있는 큰 오름선으로 표시됩니다. №6 패턴은 2개의 캔들스틱('Engulfing' 패턴)로 구성되어 있지만, 최초의 유사 모델과 달리 시장을 정반대로 돌립니다.
따라서 이러한 종류의 분석에서 지표를 사용하는 것은 허용되지만 신호가 거의 발생하지 않고 상당한 하강률이 발생할 가능성이 있다는 단점이 있다는 결론을 내릴 수 있습니다. 이 전략은 확실히 더 많은 개발이 필요합니다.
4. 이동 평균
그려진 선에만 이동 평균을 추가하는 것과 같은 부분 수정은 새로운 분석 기회를 제공합니다.
그림 9를 살펴봅시다:
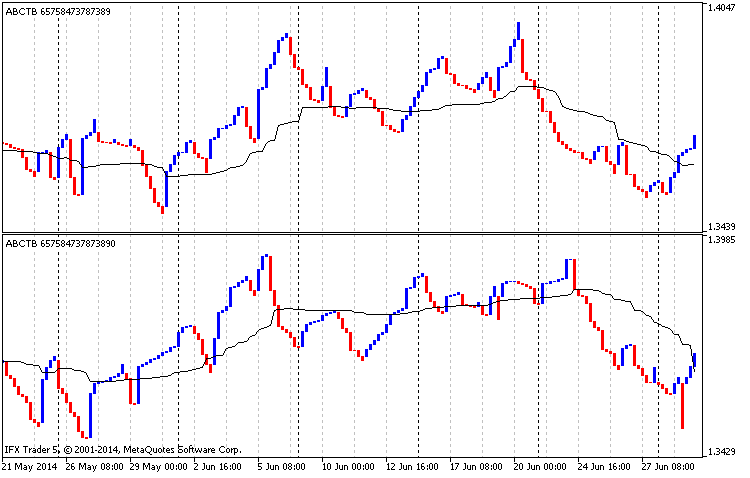
그림. 9 이동 평균, EURUSD H4, 3행 브레이크 차트, 클래식 구성의 분석 01.01.2014. ~ 01.07.2014.
그림 9의 윗부분은 이동 평균의 높은 가격(평균 기간은 90, 낮은 가격, 평활 평균)을 바탕으로 한 고전적인 구조를 보여줍니다. 아래 부분은 이동 평균과 함께 낮은 가격을 기반으로 한 고전적인 구조를 보여줍니다(평균 기간은 90, 높은 가격, 평활 평균).
따라서 그림 9의 상단에서는 이동 평균을 지지선으로 간주할 수 있고 하단에서는 반대로 저항선으로 간주할 수 있습니다. 두 차트의 가격이 평균 이하로 떨어지면 시장에서 하락 추세가 있고 파는 것이 더 좋습니다. 가격이 평균 이상으로 오르면 살 때입니다. 이 전략의 단점은 장기 거래에만 해당된다는 것입니다.
결론
결론적으로, 저는 삼행 브레이크(Three Line Break)는 지속적으로 좋은 신호를 주거나, 더 나쁜 경우에는, 손익분기점으로 이어진다고 말할 수 있습니다. 관행상 장기 추세에서 가장 잘 적용되므로 단기 거래에서는 이 차트를 사용하지 않는 것이 좋습니다. 거래에서 그것을 어떻게 사용할지에 대한 새로운 아이디어가 있는 사람이 있다면 기꺼이 상의해 보겠습니다.
평소처럼 코드를 자세히 살펴보려고 했습니다. 다시 한 번, 확장, 재작업 또는 최적화 방법에 대한 의견이 있는 경우 해당 기사에 대한 의견을 작성해 주십시오.
MetaQuotes 소프트웨어 사를 통해 러시아어가 번역됨.
원본 기고글: https://www.mql5.com/ru/articles/902
경고: 이 자료들에 대한 모든 권한은 MetaQuotes(MetaQuotes Ltd.)에 있습니다. 이 자료들의 전부 또는 일부에 대한 복제 및 재출력은 금지됩니다.
이 글은 사이트 사용자가 작성했으며 개인의 견해를 반영합니다. Metaquotes Ltd는 제시된 정보의 정확성 또는 설명 된 솔루션, 전략 또는 권장 사항의 사용으로 인한 결과에 대해 책임을 지지 않습니다.
 거래 로봇 이야기: 더 적은 것이 더 많은 것인가요?
 신경망 저렴하고 쾌활합니다 - NeuroPro와 MetaTrader 5의 연결
안녕하세요, 글을 보내주셔서 감사합니다. C# 언어로 변환해 주실 수 있나요? 미리 감사드립니다.
표시기는 시간 척도를 무시합니다. 무슨 일이 일어나고 있는지 더 정확하게 진단하려면 사용된 설정을 분석할 필요가 있습니다. 표시된 상단 조각은 표시된대로 가운데가 아닌 가장 오른쪽 섹터의 하단 차트에 있다고 가정 할 수 있습니다. 아래쪽에 표시된 차트 조각의 가격 수준은 약 1.330이고 위쪽에 표시된 부분의 고점은 약 1.315입니다.
MT4에도 비슷한 것이 있나요?
2085 빌드에서 작동하지 않는 코드를 새로 고칠 수 있나요?나는 기사에서 다운로드하고 컴파일하고 모든 것이 작동합니다 ...