
构建三线突破图表指标
介绍
之前的文章研究了 点数图, Kagi 以及 Renko 图表。持续发表了一系列关于 20 世纪图表的文章,这次我们要谈的是三线突破图表,或者准确地说,关于通过程序代码来实现它。有关这张图表来源的信息非常少。我猜想它始于日本。在美国学到它们是在 1994 年出版的 Steve Nison 的 "Beyond Candlesticks(超越蜡烛条)" 。
除了上面提到的图表,并未谈及三线突破图表的构建时间范围。它基于确定时间帧中最后形成的收盘价格, 它可以过滤相对以前行情的小幅价格波动。
在 Steve Nison 著作 "Beyond Candlesticks(超越蜡烛条)" 中描述了 11 种绘制这个图表的原理(p. 185). 我已经将它们合并成三条。
- 原理一: 为了构造,选择初始价格, 依据市场涨跌, 绘制阳线或阴线。它将标记出一个新的最低或最高。
- 原理二: 当新的价格下跌低于最低或超过最高, 我们绘制阴线或阳线。
- 原理三: 绘制与之前移动方向相反的线, 必须经过最低或最高。在同一时刻, 如果有多于一个的相同的线, 则最低或最高的计算基于它们中的两根 (如果有两根连续相同线) 或三根 (如果有三根或更多连续相同线)。
让我们近距离看一个经典的基于历史数据的构造图表例子 (图例. 1)。
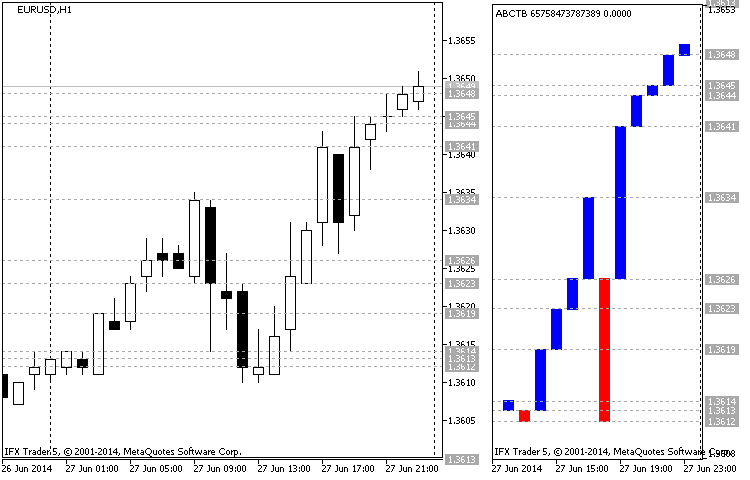
图例.1 构造一个三线突破图表示例 (EURUSD H1 27.06.2014)
图例. 1 在左侧呈现了一个蜡烛条图表,以及右侧的三线突破图表。这是 EURUSD 图表, 时间帧为 H1。图表的开始日期是 27.06.2014 起始价位 1.3613 (烛线的收盘时间 00:00), 则烛线 (01:00) 收盘于 1.3614, 形成了三线突破图表的第一根阳线。随后的空头烛线 (02:00) 形成一个阳线, 收盘于 1.3612 (收盘价低于之前的最低)。
后来多头烛条将价格推动到 1.3619 (03:00) 标记位置, 形成了一个新高,以及柱线。位于 04:00 的下跌烛线未能低于最低,并且它没有影响构造。位于 05:00 的烛线收盘于 1.3623, 标记了一个新高 (新的阳线)。
现在延续下降趋势, 我们需要经过两个最低 (1.3613), 但多头未放弃它们的位置,因此形成了一个新高 1.3626 (06:00)。后来多头试图扭转上行趋势两个小时, 但是相同的趋势持续,到达并创新高 1.3634 (09:00)。多头领先。现在绘制一根阳线, 经过三个最低价 (1.3626; 1.3623 和 1.3619)。
正如我们看到的, 在随后的三小时,空头在市场中占优, 下跌到位置 1.3612 (12:00)。它体现为一个新的阳线。但是,随后的五小时表明多头正在赢回自己的位置,并带领市场重回 1.3641,经过前高 1.3626,并在 17:00 形成新的阳线。空头在 18:00 未能超越前低,并且在随后五小时多头带领市场到达 1.3649,每小时形成一根新的阳线。
图表构造基础
在我们得到代码之前,我们要说说指标本身,并找出是什么使它与众不同。三线突破很明显,就像其它指标,是专为高效率的市场分析,以及寻找新策略提供便利。我相信你一定想知道,此处是否有什么新奇。事实上,还真有一些。该指标可以改变计算的价格类型。它覆盖了所有四个标准价格条。构造图表的经典设计是仅针对一个类型,现代型则迎合所有四种价格类型 (开盘, 最高, 最低和收盘)。它修改了经典图表构造的外观,通过添加 "阴影" 使得它们看起来像日本蜡烛条,即加入了图表的视觉观感。
现代版本的特性还可以设置当数据缺失时优先同步价格数据。
图表构造的现代类型如图例 2 所示:
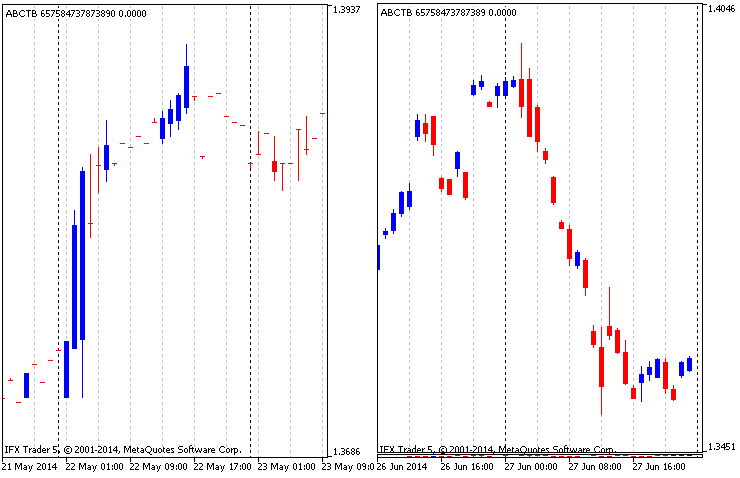
图例.2 修改后的基于四种价格类型图表
由于现代构造结合了四种不同价格类型的三线突破图表,它可以很自然地找到价格之间的差异。为了避免它,及时同步数据是必需的。价格同步带来两个变化: 完整 (图例. 2 右侧) 和局部 (图例. 2 左侧)。完整同步代表一个过滤的局部, 其中所有数据绘制在图表上,而且缺失数据被设置中的指定优选价格替代。在完整同步模式中,缺失数据被简单地省略,并且仅绘制数据完整的烛条。
另一项创新是周期分离,可便利的切分信号。正如您所知,周期分隔符可以在图表设置中启用。在指标中可以根据指定设置改变时间帧。不像 MetaTrader 5 中的图表, 通过垂直虚线分隔周期, 在此指标中通过一条变色垂直线表示(蜡烛, 图例. 3):
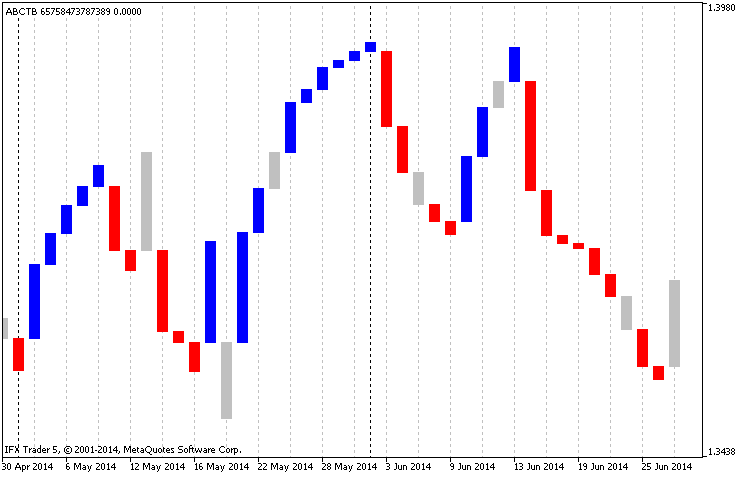
图例.3 指标中的周期分隔符
另外附加实现了技术指标 iMA, 其依据主图表的价格建立, 但是它可以及时与指标数据同步。因此,数据由均线过滤 (图例. 4):
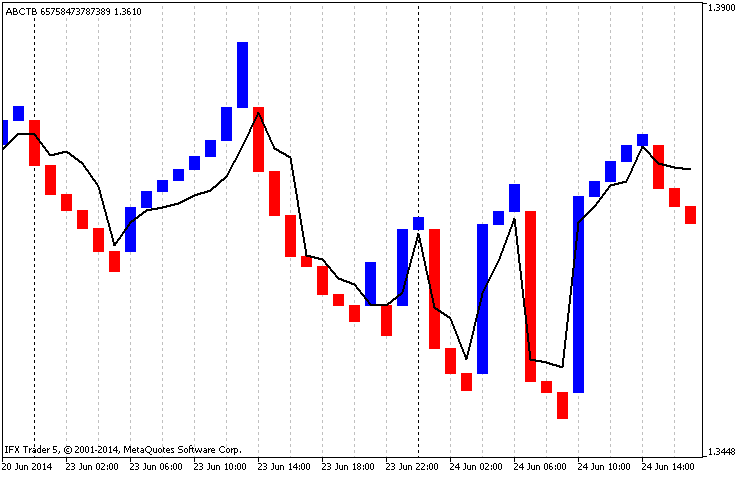
图例.4 内部均线
该指标还有一个特点,可以设置绘图的最小移动点数,以及所需反转的线数。它也是滤波器的作用。
指标代码
指标的算法相当简单,它有三个阶段:复制数据,基于该复制数据进行计算,以及填充指标缓冲器(构造图表基于所接收的数据)。代码依据它们的内部以及输入数据联系被划分功能。让我们近距离观查这些代码。
1. 指标输入参数
该指标的序言中包含了图形结构的声明。在指标中它们有两个: 图表 "ABCTB" (DRAW_COLOR_CANDLES) 和附加均线 "LINE_TLB" (DRAW_LINE)。因此,有六个缓冲器。以下 enum(枚举) 类型用于提高界面设置以及设置本身:
- magic_numb - 魔幻号类型为 long。它是一个唯一数字来表示指标。如果有必要时,可以转换类型为 string 并带修正参数;
- time_frame - 计算时间范围, 类型 ENUM_TIMEFRAMES, 它是主要参数 (指标时间帧);
- time_redraw - 图表更新周期, 类型 ENUM_TIMEFRAMES。它是图表进行重计算时采用的时间帧。为了快速重绘图表,在键盘上按下 "R" 键 - 指标的集成控制;
- first_date_start - 起始日期, 类型 datetime。主要参数,是复制数据和绘图的起始点;
- chart_price - 进行计算的价格类型 (0-收盘价, 1-开盘价, 2-最高价, 3-最低价)。对于经典构造图表,必须选择一个价格类型。正如已经提到的那样,当修改构造启用时,该参数将被忽略;
- step_min_f - 新列的最小步长 (>0, 类型 int) 或绘制线所需的跳跃距离;
- line_to_back_f - 显示反转的线数 (>0, 类型 int)。经典类型建议为三线用于显示反转;
- chart_type - 图表构造类型 (0-经典, 1-修改), 类型 select。它是构造类型的开关;
- chart_color_period - 当开始新周期时的变化颜色 (boolean 类型)。用于在新周期开始时改变线颜色;
- chart_synchronization - 仅在完整同步基础上构造图表 (boolean 类型, 若为 true, 则在构造图表之前执行完整同步,删除所有缺失数值);
- chart_priority_close - 收盘价优先 (类型 select, 有四种变化。它表示局部同步时以收盘价优先,并忽略完整的;
- chart_priority_open - 开盘价优先。此处同样应用;
- chart_priority_high - 最高价优先。此处同样应用;
- chart_priority_low - 最低价优先。此处同样应用;
- ma_draw - 绘制均线 (boolean 类型, 若为 true, 则绘制 均线);
- ma_price - 构造均线的价格类型, 可以是 ENUM_APPLIED_PRICE 之一;
- ma_method - 构造类型, 可以是 ENUM_MA_METHOD 之一;
- ma_period - 均线 周期;
然后我们声明缓存区数组, 用于计算的变量和结构。
//+------------------------------------------------------------------+
//|                                                        ABCTB.mq5 |
//|                                 "Azotskiy Aktiniy ICQ:695710750" |
//|                        "" |
//+------------------------------------------------------------------+
// ABCTB - Auto Build Chart Three Line Break
#property copyright "Azotskiy Aktiniy ICQ:695710750"
#property link      ""
#property version   "1.00"
#property indicator_separate_window
#property indicator_buffers 6
#property indicator_plots   2
//--- plot ABCTB
#property indicator_label1  "ABCTB"
#property indicator_type1   DRAW_COLOR_CANDLES
#property indicator_color1  clrBlue,clrRed,clrGreenYellow
#property indicator_style1  STYLE_SOLID
#property indicator_width1  1
//--- plot LINE_TLB
#property indicator_label2  "LINE_TLB"
#property indicator_type2   DRAW_LINE
#property indicator_color2  clrRed
#property indicator_style2  STYLE_SOLID
#property indicator_width2  1
//--- Price type for calculation
enum type_price
  {
   close=0, // Close
   open=1,  // Open
   high=2,  // Hight
   low=3,   // Low
  };
//--- type of chart construction
enum type_build
  {
   classic=0,  // Classic
   modified=1, // Modified
  };
//--- priority
enum priority
  {
   highest_t=4, // Highest
   high_t=3,    // High
   medium_t=2,  // Medium
   low_t=1,     // Low
  };
//--- input parameters
input long               magic_numb=65758473787389;                // Magic number
input ENUM_TIMEFRAMES    time_frame=PERIOD_CURRENT;                // Calculation time range
input ENUM_TIMEFRAMES    time_redraw=PERIOD_M1;                    // Period of chart updates
input datetime           first_date_start=D'2013.03.13 00:00:00';  // Start date
input type_price         chart_price=close;                        // Price type for calculation (0-Close, 1-Open, 2-High, 3-Low)
input int                step_min_f=4;                             // Minimum step for a new column (>0)
input int                line_to_back_f=3;                         // Number of lines to display a reversal(>0)
input type_build         chart_type=classic;                       // Type of chart construction (0-classic, 1-modified)
input bool               chart_color_period=true;                  // Changing color for a new period
input bool               chart_synchronization=true;               // Constructing a chart only upon complete synchronization
input priority           chart_priority_close=highest_t;           // Priority of the closing price
input priority           chart_priority_open=highest_t;            // Priority of the opening price
input priority           chart_priority_high=highest_t;            // Priority of the maximum price
input priority           chart_priority_low=highest_t;             // Priority of the minimum price
input bool               ma_draw=true;                             // Draw the average
input ENUM_APPLIED_PRICE ma_price=PRICE_CLOSE;                     // Price type for constructing the average
input ENUM_MA_METHOD     ma_method=MODE_EMA;                       // Construction type
input int                ma_period=14;                             // Averaging period
//--- indicator buffers
//--- buffer of the chart
double         ABCTBBuffer1[];
double         ABCTBBuffer2[];
double         ABCTBBuffer3[];
double         ABCTBBuffer4[];
double         ABCTBColors[];
//--- buffer of the average
double         LINE_TLBBuffer[];
//--- variables
MqlRates rates_array[];// bar data array for analysis
datetime date_stop;    // current date
datetime date_start;   // start date variable for calculation
//+------------------------------------------------------------------+
//| Struct Line Price                                                |
//+------------------------------------------------------------------+
struct line_price// structure for storing information about the past lines
  {
   double            up;  // value of the high price
   double            down;// value of the low price
  };
//+------------------------------------------------------------------+
//| Struct Line Information                                          |
//+------------------------------------------------------------------+
struct line_info// structure for storing information about the shared lines
  {
   double            up;
   double            down;
   char              type;
   datetime          time;
  };
line_info line_main_open[];  // data on the opening prices chart
line_info line_main_high[];  // data on the maximum prices chart
line_info line_main_low[];   // data on the minimum prices chart
line_info line_main_close[]; // data on the closing prices chart
//+------------------------------------------------------------------+
//| Struct Buffer Info                                               |
//+------------------------------------------------------------------+
struct buffer_info// structure for storing data for filling a buffer
  {
   double            open;
   double            high;
   double            low;
   double            close;
   char              type;
   datetime          time;
  };
buffer_info data_for_buffer[];// data for filling the modified construction buffer
datetime array_datetime[];    // array for storing information of the time for every line
int time_array[3];            // array for the function func_date_color
datetime time_variable;       // variable for the function func_date_color
bool latch=false;             // variable-latch for the function func_date_color
int handle;                   // handle of the indicator iMA
int step_min;                 // variable of the minimum step
int line_to_back;             // variable of the number of lines to display a reversal
2. 函数 OnInit
所有 指标缓存区 声明在函数 OnInit 中,以及指标数组设置如同 时间序列。
然后我们设置不会在图表上反映出来的指标数值, 设置 名称, 指定精度以及 删除当前数值,因为它们会造成图表过载。此处,我们还设置了指标 iMA 句柄,并检查输入数据的正确性。在出错的情况下,则输出相应的消息,并将数值改为最小。
//+------------------------------------------------------------------+
//| Custom indicator initialization function                         |
//+------------------------------------------------------------------+
int OnInit()
  {
//--- indicator buffers mapping
//--- buffers for a chart
   SetIndexBuffer(0,ABCTBBuffer1,INDICATOR_DATA);
   ArraySetAsSeries(ABCTBBuffer1,true);
   SetIndexBuffer(1,ABCTBBuffer2,INDICATOR_DATA);
   ArraySetAsSeries(ABCTBBuffer2,true);
   SetIndexBuffer(2,ABCTBBuffer3,INDICATOR_DATA);
   ArraySetAsSeries(ABCTBBuffer3,true);
   SetIndexBuffer(3,ABCTBBuffer4,INDICATOR_DATA);
   ArraySetAsSeries(ABCTBBuffer4,true);
   SetIndexBuffer(4,ABCTBColors,INDICATOR_COLOR_INDEX);
   ArraySetAsSeries(ABCTBColors,true);
//--- buffer for constructing the average
   SetIndexBuffer(5,LINE_TLBBuffer,INDICATOR_DATA);
   ArraySetAsSeries(LINE_TLBBuffer,true);
//--- set the values that are not going to be reflected on the chart
   PlotIndexSetDouble(0,PLOT_EMPTY_VALUE,0); // for the chart
   PlotIndexSetDouble(1,PLOT_EMPTY_VALUE,0); // for the average
//--- set the indicator appearance
   IndicatorSetString(INDICATOR_SHORTNAME,"ABCTB "+IntegerToString(magic_numb)); // name of the indicator
//--- accuracy of display
   IndicatorSetInteger(INDICATOR_DIGITS,_Digits);
//--- prohibit displaying the results of the indicator current value
   PlotIndexSetInteger(0,PLOT_SHOW_DATA,false);
   PlotIndexSetInteger(1,PLOT_SHOW_DATA,false);
//---
   handle=iMA(_Symbol,time_frame,ma_period,0,ma_method,ma_price);
   if(step_min_f<1)
     {
      step_min=1;
      Alert("Minimum step for a new column must be greater than zero");
     }
   else step_min=step_min_f;
//---
   if(line_to_back_f<1)
     {
      line_to_back=1;
      Alert("The number of lines to display a reversal must be greater than zero");
     }
   else line_to_back=line_to_back_f;
//---
   return(INIT_SUCCEEDED);
  }
3. 复制数据函数
由于指标设计为与所有四种价格类型工作,则复制所有数据至关重要,包括时间。在 MQL5 中有一个结构名为 MqlRates。它用于存储有关交易时段的开始时间,价格,交易量和点差信息。
该函数的输入参数是起始和结束日期,时间帧及 MqlRates 类型的目标数组。如果复制成功此函数返回 true。数据将复制到中间数组。已计算缺失数据加上一个时段将复制至此,数据将被永久更新。如果复制到中间数组成功,则数据将被复制到数组中,以保证该函数地正确工作。
//+------------------------------------------------------------------+
//| Func All Copy                                                    |
//+------------------------------------------------------------------+
bool func_all_copy(MqlRates &result_array[],// response array
                   ENUM_TIMEFRAMES period,  // timeframe
                   datetime data_start,     // start date
                   datetime data_stop)      // end date
  {
//--- declaration of auxiliary variables
   bool x=false;       // variable for the function response
   int result_copy=-1; // copied data count
//--- adding variables and arrays for calculation
   static MqlRates interim_array[]; // temporary dynamic array for storing copied data
   static int bars_to_copy;         // number of bars for copying
   static int bars_copied;          // number of copied bars since the start date
//--- find out the current number of bars in the time range
   bars_to_copy=Bars(_Symbol,period,data_start,data_stop);
//--- count the number of bars to be copied
   bars_to_copy-=bars_copied;
//--- if it is not the first time when data is being copied
   if(bars_copied>0)
     {
      bars_copied--;
      bars_to_copy++;
     }
//--- change the size of the receiving array
   ArrayResize(interim_array,bars_to_copy);
//--- copy data to a temporary array
   result_copy=CopyRates(_Symbol,period,0,bars_to_copy,interim_array);
//--- check the result of copying data
   if(result_copy!=-1) // if copying to the temporary array was successful
     {
      ArrayCopy(result_array,interim_array,bars_copied,0,WHOLE_ARRAY); // copy the data from the temporary array to the main one
      x=true;                   // assign the positive response to the function
      bars_copied+=result_copy; // increase the value of the copied data
     }
//---
   return(x);
  }
4. 计算数据函数
此函数是数据计算的原型,用于构造经典的三线突破图表。正如已经提到的,该函数只计算数据,并将其插入代码开始处声明的结构类型 line_info 的指定数组。
此函数包含了另外两个函数: func_regrouping (重组函数) 和 func_insert (插入函数)。我们开始看看它们:
4.1. 重组函数
此函数重组相同方向的连续线的信息。它受限于传递到它的数组的尺寸,或是来自指标设置参数 line_to_back_f (显示反转的线数) 的精确值。所以,每次当控制传递到函数时,全部有关标识线的接收数据向下移动一点,并且索引为 0 的线会被填充新数值。
这就是突破所需线的信息如何被存储 (在经典构造为三线情况下)。
//+------------------------------------------------------------------+
// Func Regrouping                                                   |
//+------------------------------------------------------------------+
void func_regrouping(line_price &input_array[],// array for regrouping
                     double new_price,         // new price value
                     char type)                // type of movement
  {
   int x=ArraySize(input_array);// find out the size of the array for regrouping
   for(x--; x>0; x--)           // regrouping loop
     {
      input_array[x].up=input_array[x-1].up;
      input_array[x].down=input_array[x-1].down;
     }
   if(type==1)
     {
      input_array[0].up=new_price;
      input_array[0].down=input_array[1].up;
     }
   if(type==-1)
     {
      input_array[0].down=new_price;
      input_array[0].up=input_array[1].down;
     }
  }
4.2. 插入函数
该函数插入数值至响应数组。该代码很简单,不需要详细解释。
//+------------------------------------------------------------------+
// Func Insert                                                       |
//+------------------------------------------------------------------+
void func_insert(line_info &line_m[],  // target array
                 line_price &line_i[], // source array
                 int index,            // array element being inserted
                 char type,            // type of the target column
                 datetime time)        // date
  {
   line_m[index].up=line_i[0].up;
   line_m[index].down=line_i[0].down;
   line_m[index].type=type;
   line_m[index].time=time;
  }
该用于计算数据的函数通常分为三个部分。第一部分,根据分析并依照操作符 switch 复制数据至中间数组。仅关注被复制价格。第二部分运行一个测试来计算数据数组所需的空间。然后该数据数组 line_main_array[], 初始化后传递到函数用于响应, 经历了一个变化。第三部分,轮流填充调整数据数组。
//+------------------------------------------------------------------+
//| Func Build Three Line Break                                      |
//+------------------------------------------------------------------+
void func_build_three_line_break(MqlRates &input_array[],      // array for analysis
                                 char price_type,              // type of the price under analysis (0-Close, 1-Open, 2-High, 3-Low)
                                 int min_step,                 // minimum step for drawing a line
                                 int line_back,                // number of lines for a reversal
                                 line_info &line_main_array[]) // array for return (response) of the function
  {
//--- calculate the size of the array for analysis
   int array_size=ArraySize(input_array);
//--- extract data required for calculation to an intermediate array
   double interim_array[];// intermediate array
   ArrayResize(interim_array,array_size);// adjust the intermediate array to the size of the data
   switch(price_type)
     {
      case 0: // Close
        {
         for(int x=0; x<array_size; x++)
           {
            interim_array[x]=input_array[x].close;
           }
        }
      break;
      case 1: // Open
        {
         for(int x=0; x<array_size; x++)
           {
            interim_array[x]=input_array[x].open;
           }
        }
      break;
      case 2: // High
        {
         for(int x=0; x<array_size; x++)
           {
            interim_array[x]=input_array[x].high;
           }
        }
      break;
      case 3: // Low
        {
         for(int x=0; x<array_size; x++)
           {
            interim_array[x]=input_array[x].low;
           }
        }
      break;
     }
//--- enter the variables for storing information about current situation
   line_price passed_line[];// array for storing information about the latest prices of the lines (type structure line_price)
   ArrayResize(passed_line,line_back+1);
   int line_calc=0;// number of lines
   int line_up=0;// number of the last ascending lines
   int line_down=0;// number of the last descending lines
   double limit_up=0;// upper limit necessary to pass
   double limit_down=0;// lower limit necessary to pass
/* Fill variables informing of the current situation with the first values */
   passed_line[0].up=interim_array[0];
   passed_line[0].down=interim_array[0];
//--- start the first loop to calculate received data for filling a buffer for drawing
   for(int x=0; x<array_size; x++)
     {
      if(line_calc==0)// no lines have been drawn
        {
         limit_up=passed_line[0].up;
         limit_down=passed_line[0].down;
         if(interim_array[x]>=limit_up+min_step*_Point)// the upper limit has been passed
           {
            func_regrouping(passed_line,interim_array[x],1);// regroup
            line_calc++;// update the line counter
            line_up++;
           }
         if(interim_array[x]<=limit_down-min_step*_Point)// the lower limit has been passed
           {
            func_regrouping(passed_line,interim_array[x],-1);// regroup
            line_calc++;// update the line counter
            line_down++;
           }
        }
      if(line_up>line_down)// last ascending line (lines)
        {
         limit_up=passed_line[0].up;
         limit_down=passed_line[(int)MathMin(line_up,line_back-1)].down;
         if(interim_array[x]>=limit_up+min_step*_Point)// the upper limit has been passed
           {
            func_regrouping(passed_line,interim_array[x],1);// regroup
            line_calc++;// update the line counter
            line_up++;
           }
         if(interim_array[x]<limit_down)// the lower limit has been passed
           {
            func_regrouping(passed_line,interim_array[x],-1);// regroup
            line_calc++;// update the line counter
            line_up=0;
            line_down++;
           }
        }
      if(line_down>line_up)// last descending line (lines)
        {
         limit_up=passed_line[(int)MathMin(line_down,line_back-1)].up;
         limit_down=passed_line[0].down;
         if(interim_array[x]>limit_up)// the upper limit has been passed
           {
            func_regrouping(passed_line,interim_array[x],1);// regroup
            line_calc++;// update the line counter
            line_down=0;
            line_up++;
           }
         if(interim_array[x]<=limit_down-min_step*_Point)// the lower limit has been passed
           {
            func_regrouping(passed_line,interim_array[x],-1);// regroup
            line_calc++;// update the line counter
            line_down++;
           }
        }
     }
   ArrayResize(line_main_array,line_calc);// change the size of the target array
//--- zeroise variables and fill with the the initial data
   line_calc=0;
   line_up=0;
   line_down=0;
   passed_line[0].up=interim_array[0];
   passed_line[0].down=interim_array[0];
//--- start the second loop to fill a buffer for drawing
   for(int x=0; x<array_size; x++)
     {
      if(line_calc==0)// no lines have been drawn
        {
         limit_up=passed_line[0].up;
         limit_down=passed_line[0].down;
         if(interim_array[x]>=limit_up+min_step*_Point)// the upper limit has been passed
           {
            func_regrouping(passed_line,interim_array[x],1);// regroup
            func_insert(line_main_array,passed_line,line_calc,1,input_array[x].time);
            line_calc++;// update the line counter
            line_up++;
           }
         if(interim_array[x]<=limit_down-min_step*_Point)// the lower limit has been passed
           {
            func_regrouping(passed_line,interim_array[x],-1);// regroup
            func_insert(line_main_array,passed_line,line_calc,-1,input_array[x].time);
            line_calc++;// update the line counter
            line_down++;
           }
        }
      if(line_up>line_down)// last ascending line (lines)
        {
         limit_up=passed_line[0].up;
         limit_down=passed_line[(int)MathMin(line_up,line_back-1)].down;
         if(interim_array[x]>=limit_up+min_step*_Point)// the upper limit has been passed
           {
            func_regrouping(passed_line,interim_array[x],1);// regroup
            func_insert(line_main_array,passed_line,line_calc,1,input_array[x].time);
            line_calc++;// update the line counter
            line_up++;
           }
         if(interim_array[x]<limit_down)// the lower limit has been passed
           {
            func_regrouping(passed_line,interim_array[x],-1);// regroup
            func_insert(line_main_array,passed_line,line_calc,-1,input_array[x].time);
            line_calc++;// update the line counter
            line_up=0;
            line_down++;
           }
        }
      if(line_down>line_up)// last descending line (lines)
        {
         limit_up=passed_line[(int)MathMin(line_down,line_back-1)].up;
         limit_down=passed_line[0].down;
         if(interim_array[x]>limit_up)// the upper limit has been passed
           {
            func_regrouping(passed_line,interim_array[x],1);// regroup
            func_insert(line_main_array,passed_line,line_calc,1,input_array[x].time);
            line_calc++;// update the line counter
            line_down=0;
            line_up++;
           }
         if(interim_array[x]<=limit_down-min_step*_Point)// the lower limit has been passed
           {
            func_regrouping(passed_line,interim_array[x],-1);// regroup
            func_insert(line_main_array,passed_line,line_calc,-1,input_array[x].time);
            line_calc++;// update the line counter
            line_down++;
           }
        }
     }
  }
5. 图表构造函数
此函数的目的是依据选择的构造参数 (经典或修改) 计算图表数据并将显示数据填充到指标缓存区。如同之前函数, 此图表构造函数也有三个附加函数。它们是彩色函数, 同步函数以及均线函数。让我们来讨论更多它们的细节。
5.1. 彩色函数
此函数仅有一个输入参数 - 时间。该函数的响应是一个布尔变量。如果传递的数据是周期的边界,则该函数将返回 true。由于周期依赖于选择的时间帧,函数通过条件操作符 if 有一个内置的周期分隔。在周期被选择之后,它会检查是否一个新的周期已经开始。它是通过将日期转化为 MqlDateTime 结构并进行比较来完成。对于时间帧大于等于 H2, 日期值的变化指示新的周期开始。自时间帧 H12 至 D1,包含月份的变化,而在 W1 和 MN 之间,我们检查年份的变化。
不幸地, 结构 MqlDateTime 未包含当前周的信息。这个问题可以通过创建由变量 time_variable 表示的初始点来解决。依线向前,从这个日期中扣除一周的秒数。
//+------------------------------------------------------------------+
// Func Date Color                                                   |
//+------------------------------------------------------------------+
bool func_date_color(datetime date_time) // input date
  {
   bool x=false;// response variable
   int seconds=PeriodSeconds(time_frame);// find out the calculation time range
   MqlDateTime date;
   TimeToStruct(date_time,date);// convert data
   if(latch==false) // check the state of the latch
     {
      MqlDateTime date_0;
      date_0=date;
      date_0.hour=0;
      date_0.min=0;
      date_0.sec=0;
      int difference=date_0.day_of_week-1;
      datetime date_d=StructToTime(date_0);
      date_d=date_d-86400*difference;
      time_variable=date_d;
      latch=true;// lock the latch
     }
   if(seconds<=7200)// period is less than or equal to H2
     {
      if(time_array[0]!=date.day)
        {
         x=true;
         time_array[0]=date.day;
        }
     }
   if(seconds>7200 && seconds<=43200)// period is greater than H2 but less than or equal to H12
     {
      if(time_variable>=date_time)
        {
         x=true;
         time_variable=time_variable-604800;
        }
     }
   if(seconds>43200 && seconds<=86400)// period is greater than H12 but less than or equal to D1
     {
      if(time_array[1]!=date.mon)
        {
         x=true;
         time_array[1]=date.mon;
        }
     }
   if(seconds>86400)// period W1 or MN
     {
      if(time_array[2]!=date.year)
        {
         x=true;
         time_array[2]=date.year;
        }
     }
   return(x);
  }
5.2. 同步函数
同步函数有六个输入参数: 它们中的四个是优先价格, 布尔参数是完整或局部同步,以及它自己的分析数组。该函数被分成两部分: 完整与局部同步情况。
完整同步进行的三个阶段:
- 计算数组元素, 满足所有四个价格类型包含数据的条件。
- 在相同条件下,复制元素至中间阵列。
- 从中间数组复制并以参数传递。
局部同步更加复杂。
传递一维数组结构数组并转化为二维, 其中第一个索引表示顺序,而第二个则是价格类型。之后介绍的是一个有四个元素的一维数组。价格优先级复制到该数组,然后数组进行排序,以确定优先顺序。之后,我们根据优先权使用循环 for 以及条件操作符 if 进行分派。与此同时, 如果优先权相同, 则价格序列如下: 收盘, 开盘, 最高, 最低。一旦操作符 if 发现第一个优先数值, 则循环 for 取代之前创建的二维数组中的所有 0 值等等。
//+------------------------------------------------------------------+
// Func Synchronization                                              |
//+------------------------------------------------------------------+
void func_synchronization(buffer_info &info[],
                          bool synchronization,
                          char close,
                          char open,
                          char high,
                          char low)
  {
   if(synchronization==true)// carry out a complete synchronization
     {
      int calc=0;// count variable
      for(int x=0; x<ArraySize(info); x++)// count complete data
        {
         if(info[x].close!=0 && info[x].high!=0 && info[x].low!=0 && info[x].open!=0)calc++;
        }
      buffer_info i_info[];    // enter a temporary array for copying
      ArrayResize(i_info,calc);// change the size of the temporary array
      calc=0;
      for(int x=0; x<ArraySize(info); x++)// copy data into the temporary array
        {
         if(info[x].close!=0 && info[x].high!=0 && info[x].low!=0 && info[x].open!=0)
           {
            i_info[calc]=info[x];
            calc++;
           }
        }
      ZeroMemory(info);        // clear the target array
      ArrayResize(info,calc);  // change the size of the main array
      for(int x=0; x<calc; x++)// copy data from the temporary array to the main one
        {
         info[x]=i_info[x];
        }
     }
   if(synchronization==false)  // change zero values to priority ones
     {
      int size=ArraySize(info); // measure the size of the array
      double buffer[][4];       // create a temporary array for calculation
      ArrayResize(buffer,size); // change the size of the temporary array
      for(int x=0; x<size; x++) // copy data into the temporary array
        {
         buffer[x][0]=info[x].close;
         buffer[x][1]=info[x].open;
         buffer[x][2]=info[x].high;
         buffer[x][3]=info[x].low;
        }
      char p[4];// enter an array for sorting by the order
      p[0]=close; p[1]=open; p[2]=high; p[3]=low;// assign variables for further sorting
      ArraySort(p); // sort
      int z=0,v=0;  // initialize frequently used variables
      for(int x=0; x<4; x++)// taking into account the results of the sorting, look through all variables and substitute them according to the priority
        {
         if(p[x]==close)// priority is for the closing prices
           {
            for(z=0; z<size; z++)
              {
               for(v=1; v<4; v++)
                 {
                  if(buffer[z][v]==0)buffer[z][v]=buffer[z][0];
                 }
              }
           }
         if(p[x]==open)// priority is for the opening prices
           {
            for(z=0; z<size; z++)
              {
               for(v=0; v<4; v++)
                 {
                  if(v!=1 && buffer[z][v]==0)buffer[z][v]=buffer[z][1];
                 }
              }
           }
         if(p[x]==high)// priority is for the maximum prices
           {
            for(z=0; z<size; z++)
              {
               for(v=0; v<4; v++)
                 {
                  if(v!=2 && buffer[z][v]==0)buffer[z][v]=buffer[z][2];
                 }
              }
           }
         if(p[x]==low)// priority is for the minimum prices
           {
            for(z=0; z<size; z++)
              {
               for(v=0; v<3; v++)
                 {
                  if(buffer[z][v]==0)buffer[z][v]=buffer[z][3];
                 }
              }
           }
        }
      for(int x=0; x<size; x++)// copy data from the temporary array back
        {
         info[x].close=buffer[x][0];
         info[x].open=buffer[x][1];
         info[x].high=buffer[x][2];
         info[x].low=buffer[x][3];
        }
     }
  }
5.3. 均线函数
它是最简单的函数。使用 OnInit 函数中接收到的指标句柄, 我们复制数值, 与传递到函数的参数日期相对应。之后这个数值作为响应返回到这个函数。
//+------------------------------------------------------------------+
// Func MA                                                           |
//+------------------------------------------------------------------+
double func_ma(datetime date)
  {
   double x[1];
   CopyBuffer(handle,0,date,1,x);
   return(x[0]);
  }
该绘制图表的函数,通常分为两个部分:经典绘图与修改的。该函数有两个输入参数:价格类型用于构造 (在修改模式被忽略) 和构造类型 (经典和修改)。
在最开始,指标缓存区被清除,然后,依照构造类型分为两部分。第一部分(我们正在谈论的修改构造)开始调用该函数用来计算所有四个价格类型。然后,我们创建一个通用的数据数组,即我们复制所使用的数据,接收调用函数计算后的数据。之后,接收到的数据数组被排序,且复制数据被清除。在全局级别声明数组 array data_for_buffer[] 之后, 将会填充基于与下列数据同步的连续日期。填充指标缓存区是修改构造的最后阶段。
第二部分(经典构造)则简单很多。起初,数据计算的函数被调用,然后填满指标缓存区。
//+------------------------------------------------------------------+
//| Func Chart Build                                                 |
//+------------------------------------------------------------------+
void func_chart_build(char price, // price type for chart construction
                      char type)  // type of chart construction
  {
//--- Zeroise the buffers
   ZeroMemory(ABCTBBuffer1);
   ZeroMemory(ABCTBBuffer2);
   ZeroMemory(ABCTBBuffer3);
   ZeroMemory(ABCTBBuffer4);
   ZeroMemory(ABCTBColors);
   ZeroMemory(LINE_TLBBuffer);
   if(type==1)// construct a modified chart (based on all price types)
     {
      func_build_three_line_break(rates_array,0,step_min,line_to_back,line_main_close);// data on closing prices
      func_build_three_line_break(rates_array,1,step_min,line_to_back,line_main_open);// data on opening prices
      func_build_three_line_break(rates_array,2,step_min,line_to_back,line_main_high);// data on maximum prices
      func_build_three_line_break(rates_array,3,step_min,line_to_back,line_main_low);// data on minimum prices
      //--- calculate data arrays
      int line_main_calc[4];
      line_main_calc[0]=ArraySize(line_main_close);
      line_main_calc[1]=ArraySize(line_main_open);
      line_main_calc[2]=ArraySize(line_main_high);
      line_main_calc[3]=ArraySize(line_main_low);
      //--- gather the date array
      int all_elements=line_main_calc[0]+line_main_calc[1]+line_main_calc[2]+line_main_calc[3];// find out the number of all elements
      datetime datetime_array[];// enter the array for copying
      ArrayResize(datetime_array,all_elements);
      int y[4];
      ZeroMemory(y);
      for(int x=0;x<ArraySize(datetime_array);x++)// copy data into the array
        {
         if(x<line_main_calc[0])
           {
            datetime_array[x]=line_main_close[y[0]].time;
            y[0]++;
           }
         if(x<line_main_calc[0]+line_main_calc[1] && x>=line_main_calc[0])
           {
            datetime_array[x]=line_main_open[y[1]].time;
            y[1]++;
           }
         if(x<line_main_calc[0]+line_main_calc[1]+line_main_calc[2] && x>=line_main_calc[0]+line_main_calc[1])
           {
            datetime_array[x]=line_main_high[y[2]].time;
            y[2]++;
           }
         if(x>=line_main_calc[0]+line_main_calc[1]+line_main_calc[2])
           {
            datetime_array[x]=line_main_low[y[3]].time;
            y[3]++;
           }
        }
      ArraySort(datetime_array);// sort the array
      //--- delete replicated data from the array
      int good_info=1;
      for(int x=1;x<ArraySize(datetime_array);x++)// count useful information
        {
         if(datetime_array[x-1]!=datetime_array[x])good_info++;
        }
      ArrayResize(array_datetime,good_info);
      array_datetime[0]=datetime_array[0];// copy the first element as it is the pattern in the beginning of comparison
      good_info=1;
      for(int x=1;x<ArraySize(datetime_array);x++)// fill the new array with useful data
        {
         if(datetime_array[x-1]!=datetime_array[x])
           {
            array_datetime[good_info]=datetime_array[x];
            good_info++;
           }
        }
      //--- fill the buffer for drawing (colored candles)
      int end_of_calc[4];// variables of storing information about the last comparison
      ZeroMemory(end_of_calc);
      ZeroMemory(data_for_buffer);
      ArrayResize(data_for_buffer,ArraySize(array_datetime));// change the size of the declared global array for storing data before passing it to a buffer
      for(int x=0; x<ArraySize(array_datetime); x++)
        {
         data_for_buffer[x].time=array_datetime[x];
         for(int s=end_of_calc[0]; s<line_main_calc[0]; s++)
           {
            if(array_datetime[x]==line_main_close[s].time)
              {
               end_of_calc[0]=s;
               if(line_main_close[s].type==1)data_for_buffer[x].close=line_main_close[s].up;
               else data_for_buffer[x].close=line_main_close[s].down;
               break;
              }
           }
         for(int s=end_of_calc[1]; s<line_main_calc[1]; s++)
           {
            if(array_datetime[x]==line_main_open[s].time)
              {
               end_of_calc[1]=s;
               if(line_main_open[s].type==1)data_for_buffer[x].open=line_main_open[s].down;
               else data_for_buffer[x].open=line_main_open[s].up;
               break;
              }
           }
         for(int s=end_of_calc[2]; s<line_main_calc[2]; s++)
           {
            if(array_datetime[x]==line_main_high[s].time)
              {
               end_of_calc[2]=s;
               data_for_buffer[x].high=line_main_high[s].up;
               break;
              }
           }
         for(int s=end_of_calc[3]; s<line_main_calc[3]; s++)
           {
            if(array_datetime[x]==line_main_low[s].time)
              {
               end_of_calc[3]=s;
               data_for_buffer[x].low=line_main_low[s].down;
               break;
              }
           }
        }
      //--- start the function of synchronizing data
      func_synchronization(data_for_buffer,chart_synchronization,chart_priority_close,chart_priority_open,chart_priority_high,chart_priority_low);
      //--- preparatory actions before starting the function func_date_color
      ZeroMemory(time_array);
      time_variable=0;
      latch=false;
      //--- fill the buffer for drawing candles
      for(int x=ArraySize(data_for_buffer)-1,z=0; x>=0; x--)
        {
         ABCTBBuffer1[z]=data_for_buffer[x].open;
         ABCTBBuffer2[z]=data_for_buffer[x].high;
         ABCTBBuffer3[z]=data_for_buffer[x].low;
         ABCTBBuffer4[z]=data_for_buffer[x].close;
         if(ABCTBBuffer1[z]<=ABCTBBuffer4[z])ABCTBColors[z]=0;
         if(ABCTBBuffer1[z]>=ABCTBBuffer4[z])ABCTBColors[z]=1;
         if(func_date_color(data_for_buffer[x].time)==true && chart_color_period==true)ABCTBColors[z]=2;
         if(ma_draw==true)LINE_TLBBuffer[z]=func_ma(data_for_buffer[x].time);
         z++;
        }
     }
   else// construct a classic chart (based on one price type)
     {
      func_build_three_line_break(rates_array,price,step_min,line_to_back,line_main_close);// find data on selected prices
      ArrayResize(array_datetime,ArraySize(line_main_close));
      //--- preparatory actions before starting the function func_date_color
      ZeroMemory(time_array);
      time_variable=0;
      latch=false;
      //--- the buffer for drawing candles
      for(int x=ArraySize(line_main_close)-1,z=0; x>=0; x--)
        {
         ABCTBBuffer1[z]=line_main_close[x].up;
         ABCTBBuffer2[z]=line_main_close[x].up;
         ABCTBBuffer3[z]=line_main_close[x].down;
         ABCTBBuffer4[z]=line_main_close[x].down;
         if(line_main_close[x].type==1)ABCTBColors[z]=0;
         else ABCTBColors[z]=1;
         if(func_date_color(line_main_close[x].time)==true && chart_color_period==true)ABCTBColors[z]=2;
         if(ma_draw==true)LINE_TLBBuffer[z]=func_ma(line_main_close[x].time);
         z++;
        }
     }
  }
6. 整合函数
此功能联合所有控制指标元素。首先,当前日期被定义,之后复制数据函数和图表构造函数被调用。
//+------------------------------------------------------------------+
//| Func Consolidation                                               |
//+------------------------------------------------------------------+
void func_consolidation()
  {
//--- defining the current date
   date_stop=TimeCurrent();
//--- copying data for analysis
   func_all_copy(rates_array,time_frame,first_date_start,date_stop);
//--- basic construction of the chart
   func_chart_build(chart_price,chart_type);
   ChartRedraw();
  }
7. 键盘控制和自动控构造制函数
这些函数被设计为通过按键盘上的 "R" 键 (OnChartEvent) 或按照选定的时间范围 (OnCalculate) 自动重绘指标。后者则通过新柱线函数 (func_new_bar) 进行分析,func_new_bar 是一个曾描述过的 IsNewBar 函数简化版。
//+------------------------------------------------------------------+
//| Custom indicator iteration function                              |
//+------------------------------------------------------------------+
int OnCalculate(const int rates_total,
                const int prev_calculated,
                const int begin,
                const double &price[])
  {
//---
   if(func_new_bar(time_redraw)==true)
     {
      func_consolidation();
     };
//--- return value of prev_calculated for next call
   return(rates_total);
  }
//+------------------------------------------------------------------+
//| ChartEvent function                                              |
//+------------------------------------------------------------------+
void OnChartEvent(const int id,
                  const long &lparam,
                  const double &dparam,
                  const string &sparam)
  {
//--- event of a keystroke
   if(id==CHARTEVENT_KEYDOWN)
     {
      if(lparam==82) //--- the key "R" has been pressed
        {
         func_consolidation();
        }
     }
  }
//+------------------------------------------------------------------+
//| Func New Bar                                                     |
//+------------------------------------------------------------------+
bool func_new_bar(ENUM_TIMEFRAMES period_time)
  {
//---
   static datetime old_times; // variable of storing old values
   bool res=false;            // variable of the analysis result
   datetime new_time[1];      // time of a new bar
//---
   int copied=CopyTime(_Symbol,period_time,0,1,new_time); // copy the time of the last bar to the cell new_time
//---
   if(copied>0) // everything is ок. data copied
     {
      if(old_times!=new_time[0]) // if the old time of the bar is not equal to the new one
        {
         if(old_times!=0) res=true; // if it is not the first start, then new bar = true
         old_times=new_time[0];     // remember the time of the bar
        }
     }
//---
   return(res);
  }
在这一点上,我们必须完成描述指标的代码,并谈谈使用它的方式。
使用指标和交易策略的例子
让我们开始基于经典图表构造来分析主要策略。
1. 白与黑线作为买卖信号
大致我们可以谈论两个规则:
- 规则一: 买,当三根连续阳线;卖,当三根连续阴线。三根连续线说明趋势正在出现。
- 规则二: 卖, 当反转线下跌且低于三根连续阳线;买, 当反转线高于三根连续阴线。
让我们看看图例. 6,显示的是EURUSD 从2013年开始的经典构造(所分析的时间范围如图例. 5 描绘)。
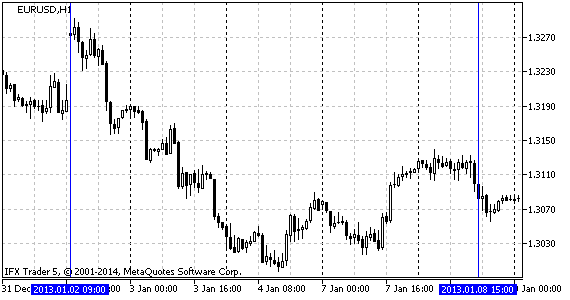
图例.5 分析时间范围 EURUSD H1
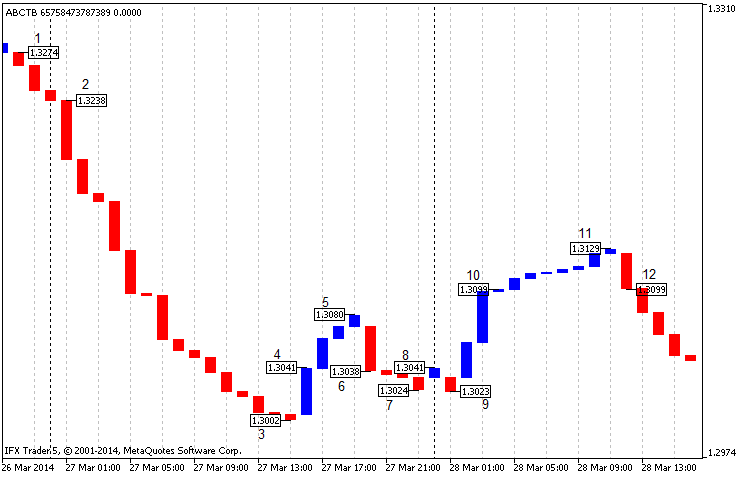
图例.6 三线突破图表经典构造 EURUSD H1, 开始自 2013, 收盘价格
在图表上 (图例. 6) 我们可以清晰看到在点 1 和 2 之间的信号 (规则一) , 即起始卖点。在这种情况下,按照四位数字报价,收入超过 200 点。随后的点 4 说明有利买入 (规则二)。截至收盘,在点 5 的利润为 40 点,而我们的盈亏平衡点处于收盘价点 6。
在点 6 我们可以看到卖信号 (规则二)。在收盘价点 7,我们获得 10 点利润,在收盘价点 8 则盈亏平衡。点 8 和 9 不可以考虑作为信号,因为它们既不满足规则一,也不满足规则二。我们可以在点 10 (规则一) 买入; 我们也可以在收盘价点 11 获得 20 点利润,或在点 12 盈亏平衡。所有数字均四舍五入。
在最好的情况下,使用这种策略,我们可以产生 270 点的利润,这很令人印象深刻。同时,在指定的时间范围内有强烈的走势从而影响利润。在最坏的情况下,交易可能会导致盈亏平衡,这其实还不坏。
值得一提的是,当情况既符合规则一也符合规则二,我们需要在相同趋势中,等待一个代表趋势反转的行确认。
2. 等距通道,支撑与阻力线
另一种交易策略是运用三线突破图表进行技术分析。让我们看看图例. 7:
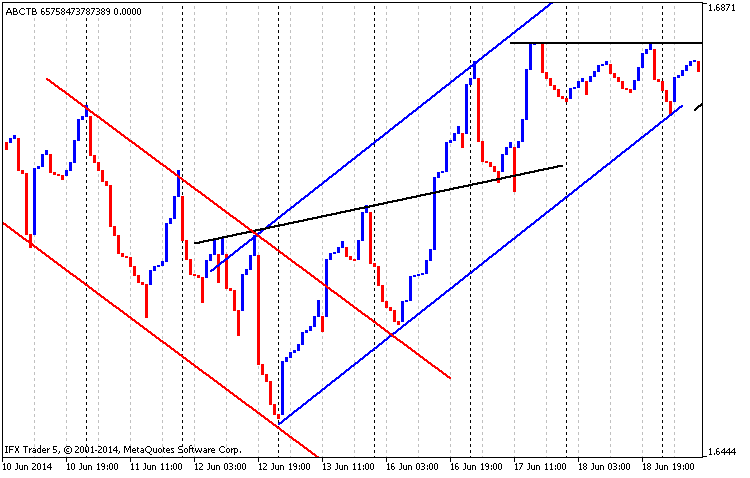
图例. 7 等距通道, 支撑与阻力线, GBPUSD H1, 时间范围自 01.03.2014 至 01.05.2014
在图例. 7 中您可以看到下降等距通道以红色线绘制,上升等距通道为蓝色,而支撑与阻力线以黑色绘制。很显然,所述第一阻力线正切入支撑线。
3. 蜡烛条形态
一个修改过的图表 (两线突破) 时间帧为 M30,货币对为 USDCAD,开始自 2013,看上去很有趣。
我们可以区分日本蜡烛条形态作为合理的信号 (图例. 8)。

图例. 8 修改的三线突破图表, USDCAD M30, 开始自 2013, 两线突破
在图表开始,我们可以看到反转形态 "Engulfing(吞噬)" 位于标记 1 之下。它由两根烛台组成: 红色和前面的蓝色。上升趋势线之后,市场走低到 2 号位置,是一个烛台反转形态 "Hammer (锤)"。在这个点上,市场改变方向。同样的情况出现在形态 3 处("Spinning Top -- 陀螺")。随后反转形态 "Kharami (孕育线)" (位置 4 ) 显示为烛条 4 以及它旁边的长阳线。形态 6 也由两根烛条组成 (形态 "Engulfing--吞噬") 但不像第一根类似模型,它令市场反方向翻转。
因此,可以得出结论,使用该指标分析是可以接受的,但它有这样的缺点,如信号较少,以及可能有显著的回撤。这一策略当然需要进一步发展。
4. 移动均线
局部修改,如添加移动均线,仅绘制线条,可为分析给与新的机会。
让我们看看图例. 9:
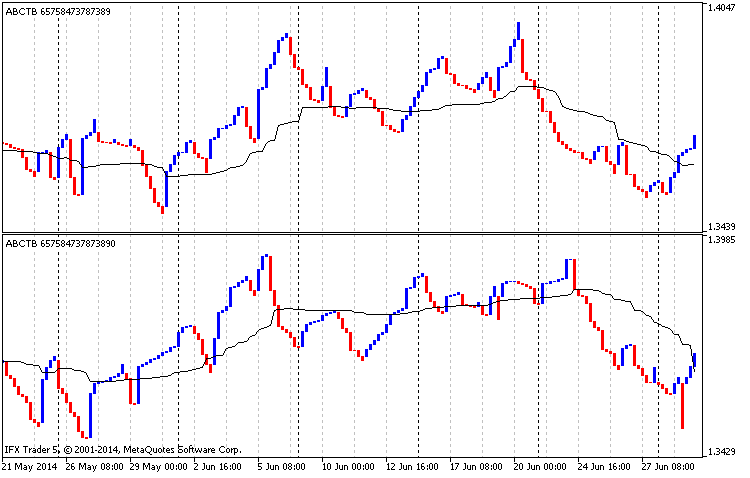
图例.9 分析移动均线, EURUSD H4, 三线突破图表, 经典构造, 自 01.01.2014 至 01.07.2014
在图例. 9 的上半部描绘了一幅给予最高价的经典构造图表,以及均线 (平均周期为 90, 最低价, 平滑平均)。图的下半部显示一个基于最低价的经典构造图表,以及均线 (平均周期为 90, 最高价, 平滑平均)。
所以,在图例. 9 的上半部分,均线可以被认为是支撑线,在下半部,与此相反,为阻力线。如果在两个图表中的价格均低于平均水平,则目前市场上呈下降趋势,此刻最好卖出。当价格上升到高于平均水平,此刻是时候买入。此策略的一个缺点是,它是只适用于长线交易。
结论
最后,我可以说,三线中断图表始终给出良好的信号,或者在最坏的情况下,也会导致盈亏平衡。实践证明,最好在一个长线趋势中应用,因此,我不建议在短线交易使用这种图表。如果任何人有关于如何使用它进行交易的新思路,我很乐意讨论它。
通常情况下,我试着来详细揭示代码。再次,若有任何扩展,返工或优化的想法,请为本文书写评论。
本文由MetaQuotes Ltd译自俄文
原文地址: https://www.mql5.com/ru/articles/902
注意: MetaQuotes Ltd.将保留所有关于这些材料的权利。全部或部分复制或者转载这些材料将被禁止。
本文由网站的一位用户撰写,反映了他们的个人观点。MetaQuotes Ltd 不对所提供信息的准确性负责,也不对因使用所述解决方案、策略或建议而产生的任何后果负责。
 宏观经济数据对货币价格波动影响的还原分析
 如何准备迁移至虚拟主机的交易账户
 构建新兴的社交技术, 第二部分: 编制 MQL5 的 REST 客户端
您好,感谢您的文章。能否请您将其转换为 C# 语言?非常感谢。
指标忽略了时间刻度。为了更准确地诊断发生了什么,有必要分析所使用的设置。我可以假设,标记的上部片段位于下部图表的最右边,而不是标记的中间。标记在下部的图表片段的价格水平约为 1.330,而标记在上部的片段的峰值约为 1.315。
MT4 是否也有类似的情况?
能否刷新一下您的代码,在 2085 版中是否无法运行?我从这篇文章中下载、编译,一切正常...