
レンコチャートにおけるインジケーター
はじめに
Indicator for Point and Figure charting(ポイント・フィギュアチャートにおけるインジケーター) やIndicator for Kagi charting(かぎ足チャートにおけるインジケーター)などの記事で、ポイント・フィギュアや"Kagi"インジケーターのチャート化原則について紹介されています。 チャートを作成する一つのプログラミング方法を学びましょう。
"Renko" は、日本語の「レンガ」に由来します。レンコチャートは、一連のレンガから構成され、それらの作成は価格の変動によって決定されます。価格が上昇する際、上昇レンガがチャートに配置され、価格の降下で降下レンガが追加されます。"Renko"は、日本語で"遅い速度"という意味を持ちます。レンコチャートは、19世紀に日本で生まれました。アメリカやヨーロッパは、Steeve NisonがBeyond Candlesticks: New Japanese Charting Techniques Revealedという本を1994年に出版して初めてその単語を聞くようになりました。
レンコチャートは、タイムラインを無視し、価格の動きのみに関連します。ポイント・フィギュアチャートと異なり、レンコは、新しいコラムに「レンガ」を配置し、その他は共通の作成メソッドになります:「レンガ(「ポイント」、「フィギュア」)」のサイズは固定され、価格の分析や配置は同様の方法で実行されます。
なので、レンコチャートは垂直バーの集まりです。(「レンガ」)白いレンガはトレンドの方向が上向きになれば使用され、黒色はトレンドが降下する際に使用されます。その形成は価格の動きに応じています。取得された期間での現在の価格は、以前のレンガの最大・最小値と比較されます。もしその株がオープン時の価格よりも高くなってきたら、白レンガがオープン価格を表示している部分の下とクロージング価格を表示している上の部分に表示されます。もし株がオープン価格よりも低くなれば、黒レンガがオープン価格を表示している上の部分とクロージング価格を表示している部分の下に表示されます。
そのチャートの最初のレンガは、価格の動きに基づき描画され、バーのオープン価格は以前のレンガの最大・最小に関連して取得されます。
標準のレンコチャート例、図1:
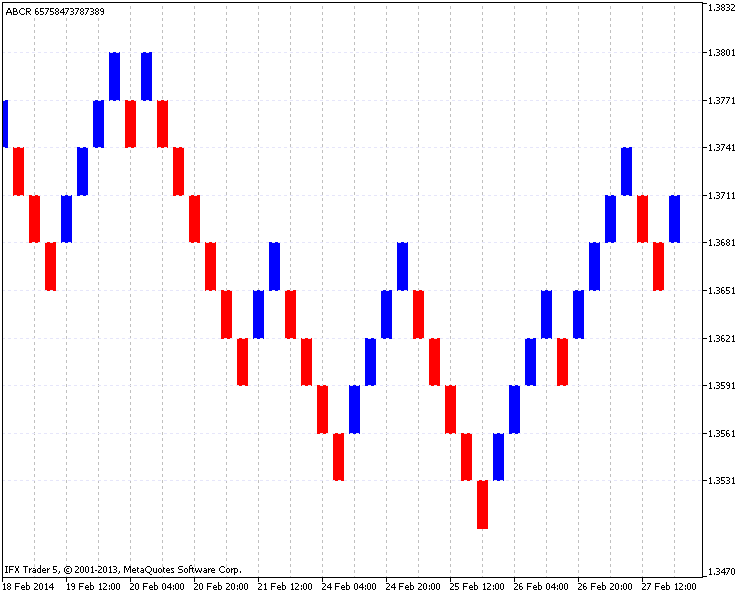
図1. 標準レンコチャート例
1. チャート化の例
標準のレンコチャートは、クロージング価格に基づいて描画されます。まず、タイムフレームとボックスサイズを選択してください。
この例では、EURUSD (H4タイムフレーム)が使用され、30ポイントのボックスサイズです。03.01.2014から31.01.2014におけるレンコチャートの結果は図2に示されています。左側に特定のタイムフレームのチャートがあり、右側にレンコチャートの結果があります。

図2. EURUSD(H4、ボックス30ポイント)のレンコチャートの結果
チャート化原則を詳しく見ていきましょう。図2、赤色の水平線は、価格の変化に応じた各ブロックのサイズを示し、青色の線は最も興味深い日付を示します。
ご覧の通り、03.01.2014の終わりで、ロウソク足が1.3589という以前定義された1.3591より下の価格範囲でクローズしし、チャートに降下ブロックを配置しました。
その後、価格は一定で(1.356より下や1.3651より上ではクローズしない)、20:00 10.01.2014までオープンであり、1.3663でクローズします。そして、その価格は、再び20:00 14.01.2014までに安定し、価格範囲を超え、新しいレンガを作成し、1.3684でクローズします。
その後、価格が降下し価格範囲を4倍下回る下げ局面になります。12:00 23.01.2014(そのロウソク足は08:00にオープンしました)に、二つの価格範囲を突破する上昇があり、1.3639にて閉じることで二つのレンガをオープンします。最初のレンガは、明確に見ることができ、2番目は長い垂直線で引かれています。(最初のレンガで同時に開くため)さらなる構築は同様の原則で続きます。
2. レンコチャート化原則
このインジケーターを開発する間、全ての関数ができる限り独立して実装されています。主な目的の一つは、インジケーターのポテンシャルを最大化し、市場分析をより簡単にすることです。
その計算は現在のタイムフレームにて行われず、設定にてタイムフレームが選択されます。タイムフレームに関係なく設定されたデータを示します。取得された期間のデータを個別のバッファ配列にコピーすることで実行され、その後計算がなされ、アウトプットバッファーが格納されます。
標準のレンコチャートがClose価格に応じて形成されますが、Open、High、Low値が分析を向上するために使用されます。
レンコチャートのレンガは同様のサイズであるので、強い価格の動きによる動的なマーケットポイントを知ることは役に立ちます。このため、(日本のロウソク足のように)レンガの小さい垂直影で表示される印が表示され、選択されたタイムフレームバーのサイドのレンガのレベルを上げる、もしくは下げます。
メインチャートにてZigzaを形成することで、グラフィカルアナリシスを拡大することができます。
図3は、完全な機能を持つインジケーターを示しています。

図3. EURUSDチャートにおけるインジケーター(日毎のステップは25ポイントです)
3. そのインジケーターのコードとアルゴリズム
そのインジケーターのコードは、900行で形成されるようにかなり多いです。以前述べられた通り、最大限の個別に分けられた関数はそのアルゴリズムの理解を複雑にします。以前の記事のいくつかの関数が基礎として使用されます。いくつか誤解されている場合のため、かぎ足チャート形成インジケーターをご参照いただけます。
そのコードの各関数は、この記事で説明されます。関数は逐一紹介されます。
3.1. インジケーター入力パラメーター
連呼チャートは、異なる色の上・下レンガの範囲です。この種類の形成は、 "色付きのロウソク足"で組み合わされた5つのみのバッファーのみを必要とします。残りの4つのバッファーは、インジケーターの計算のために必要なデータを収集します。
グループに分けられる入力パラメーター取得してください。
- ステップ - レンガサイズ:
- type_step - ステップの種類、ポイントやパーセンテージにて表される(後者は、現在の価格に基づいて計算されます)
- magic_numb - グラフィカルオブジェクトを区別しチャートから削除するために必要なマジックナンバー
- levels_number - インジケーターウィンドウにてレンガを分けるためのレベル(0〜レベル無し)
- levels_color - インジケーターウィンドウでのレベルの色;
- time_frame - チャートの形成における期間の設定のために使用される(分析期間);
- time_redraw - チャートの更新時間;
- first_date_start - チャート化の開始日程l
- type_price - 形成における価格のタイプ; Close - クロージング価格に基づく標準のメソッド; Open - オープン価格; High - 最大価格、 Low - 最小価格;
- shadow_print - もし本当のオプションを設定すれば、影の部分が複数のレンガのオープンにより引き起こされる最大・最小価格を表します;
- filter_number - チャートリバースに使用されるレンガ値(チャートをリバースするために必要なレンガの数に応じるエキストラのオプション)
- zig_zag - メインチャート上にZigZagを描くための使用される(チャートの更新にて使用され、分析を促進するメインチャートのオブジェクト)
- zig_zag_shadow - 最大・最小価格に即するZigZagsを描くために用いられる(終点でジグザグを形成するため、最大・最小価格を用いる);
- zig_zag_width - ZigZag線幅;
- zig_zag_color_up - ZigZag上向き時の線の色、
- zig_zag_color_down - ZigZag降下時の線の色;
- square_draw - メインチャートのレンガを描くために使用される(このモードでは、レンガをオープンする価格の動きをご覧になれます)
- square_color_up - メイン上向きチャートでのレンガの色;
- square_color_down - メイン下向きチャートでのレンガの色;
- square_fill - メインチャートでのレンガの色付け;
- square_width - メインチャートでのレンガの線幅;
- frame_draw - レンガのフレームを描くために用いられる(レンガの縁を表す、まれに使用されるエキストラオプションです)
- frame_width - レンガの線幅;
- frame_color_up - レンガの上の端の色;
- frame_color_down - レンガの下の線の色;
それから、そのコードはバッファーを宣言します:5つの主要なバッファーがグラフィックの描写に用いられ、4つはデザインや計算データを保存するために用いられます。Price[] - 計算に用いられるコピーされた価格を保存するためのバッファー、Date[] - メインチャートでの描画に用いられるコピーされたデータを保存するバッファー、Price_high[]とPrice_low[]は、メインチャートのZigZagsに適用される最大、最小値を保存するバッファーです。
その計算の後、バッファー配列や補助関数の変数が宣言されます;func_draw_renko、func_draw_zig_zag、 func_draw_renko_main_chart. 後ほどこれらは紹介されます。
//+------------------------------------------------------------------+
//|                                                         ABCR.mq5 |
//|                                   Azotskiy Aktiniy ICQ:695710750 |
//|                          https://www.mql5.com/ru/users/Aktiniy |
//+------------------------------------------------------------------+
//--- Auto Build Chart Renko
#property copyright "Azotskiy Aktiniy ICQ:695710750"
#property link      "https://www.mql5.com/ru/users/Aktiniy"
#property version   "1.00"
#property description "Auto Build Chart Renko"
#property description "   "
#property description "This indicator used to draw Renko chart in the indicator window, and in the main chart window"
#property indicator_separate_window
#property indicator_buffers 9
#property indicator_plots   1
//--- plot RENKO
#property indicator_label1  "RENKO"
#property indicator_type1   DRAW_COLOR_CANDLES
#property indicator_color1  clrRed,clrBlue,C'0,0,0',C'0,0,0',C'0,0,0',C'0,0,0',C'0,0,0',C'0,0,0'
#property indicator_style1  STYLE_SOLID
#property indicator_width1  1
//--- construction method
enum type_step_renko
  {
   point=0,   // Point
   percent=1, // Percent
  };
//--- type of price
enum type_price_renko
  {
   close=0, // Close
   open=1,  // Open
   high=2,  // High
   low=3,   // Low
  };
//--- input parameters
input double           step=10;                                 // Step
input type_step_renko  type_step=point;                         // Type of step
input long             magic_numb=65758473787389;               // Magic number
input int              levels_number=1000;                      // Number of levels (0-no levels)
input color            levels_color=clrLavender;                // Color of levels
input ENUM_TIMEFRAMES  time_frame=PERIOD_CURRENT;               // Calculation period
input ENUM_TIMEFRAMES  time_redraw=PERIOD_M1;                   // Chart redraw period
input datetime         first_date_start=D'2013.09.13 00:00:00'; // Start date
input type_price_renko type_price=close;                        // Price for construction
input bool             shadow_print=true;                       // Show shadows
input int              filter_number=0;                         // Bricks number needed to reversal
input bool             zig_zag=true;                            // Whether ZigZag should be drawn on the main chart
input bool             zig_zag_shadow=true;                     // Draw ZigZag at highs and lows of the price
input int              zig_zag_width=2;                         // ZigZag line width
input color            zig_zag_color_up=clrBlue;                // ZigZag up line color
input color            zig_zag_color_down=clrRed;               // ZigZag down line color
input bool             square_draw=true;                        // Whether bricks should be drawn on the main chart
input color            square_color_up=clrBlue;                 // Up brick color on the main chart
input color            square_color_down=clrRed;                // Down brick color on the main chart
input bool             square_fill=true;                        // Brick filling on the main chart
input int              square_width=2;                          // Brick line width on the main chart
input bool             frame_draw=true;                         // Whether to draw frames of the bricks
input int              frame_width=2;                           // Brick frame line width
input color            frame_color_up=clrBlue;                  // Up brick frames color
input color            frame_color_down=clrRed;                 // Down brick frames color
//--- indicator buffers
double         RENKO_open[];
double         RENKO_high[];
double         RENKO_low[];
double         RENKO_close[];
double         RENKO_color[];

double         Price[];      // copy price data to the buffer
double         Date[];       // copy data to the buffer
double         Price_high[]; // copy high prices to the buffer
double         Price_low[];  // copy low prices to the buffer
//--- calculation buffer arrays
double         up_price[];    // up brick price
double         down_price[];  // down brick price
char           type_box[];    // brick type (up, down)
datetime       time_box[];    // brick copy time
double         shadow_up[];   // up high price
double         shadow_down[]; // down low price
int            number_id[];   // Index of Price_high and Price_low arrays
//--- calculation global variables
int obj=0;           //variable for storing number of graphics objects
int a=0;             // variable to count bricks
int bars;            // number of bars
datetime date_stop;  // current data
datetime date_start; // start date variable, for calculations
bool date_change;    // variable for storing details about time changes
3.2. インジケーターイニシャライザー
インジケーターバッファーは、一次元の動的配列に関連付けられ、アドレス化は、 INDICATOR_DATAやINDICATOR_COLOR_INDEXバッファーにセットされます。残りの動的配列のアドレス化(Price[], Date[], Price_high[], Price_low[])は、データを保存するためだけに使用されるので、変更されずに残されます。
チャートに表示されていない値が設定されています。それから、その名前がインジケーターに割り当てられます。その表示の精度がセットされ、現在の数値の表示がインジケーターウィンドウで禁止されます。
その後、date_start 変数の値が (計算を開始する時間) 割り当てられます。その変数の値が割り当てられます。その入力値はチャートがインジケーターバッファーにとって重すぎるので使用されます。その開始時間が正しくセットされ、カスタムが宣言されます。分析用関数開始時間、「func_calc_date_start」は時間の修正を行います。
//+------------------------------------------------------------------+
//| Custom indicator initialization function                         |
//+------------------------------------------------------------------+
int OnInit()
  {
//--- indicator buffers mapping
   SetIndexBuffer(0,RENKO_open,INDICATOR_DATA);
   ArraySetAsSeries(RENKO_open,true);
   SetIndexBuffer(1,RENKO_high,INDICATOR_DATA);
   ArraySetAsSeries(RENKO_high,true);
   SetIndexBuffer(2,RENKO_low,INDICATOR_DATA);
   ArraySetAsSeries(RENKO_low,true);
   SetIndexBuffer(3,RENKO_close,INDICATOR_DATA);
   ArraySetAsSeries(RENKO_close,true);
   SetIndexBuffer(4,RENKO_color,INDICATOR_COLOR_INDEX);
   ArraySetAsSeries(RENKO_color,true);
//---
   SetIndexBuffer(5,Price,INDICATOR_CALCULATIONS);      // initialize price buffer
   SetIndexBuffer(6,Date,INDICATOR_CALCULATIONS);       // initialize data buffer
   SetIndexBuffer(7,Price_high,INDICATOR_CALCULATIONS); // initialize high price
   SetIndexBuffer(8,Price_low,INDICATOR_CALCULATIONS);  // initialize low price
//--- set data which will not be drawn
   PlotIndexSetDouble(0,PLOT_EMPTY_VALUE,0);
//--- set the indicator appearance
   IndicatorSetString(INDICATOR_SHORTNAME,"ABCR "+IntegerToString(magic_numb)); // indicator name
//--- display accuracy
   IndicatorSetInteger(INDICATOR_DIGITS,_Digits);
//--- prohibit display of the results of the indicator current values
   PlotIndexSetInteger(0,PLOT_SHOW_DATA,false);
//--- assign start date variable value
   date_start=first_date_start;
//---
   return(INIT_SUCCEEDED);
  }
3.3. 分析開始時間の計算用関数
その関数は小さく、一つのループからなります。二つの入力パラメーターがあります - はじめに開始時間を設定し、計算終了時間をセットします(現在のデータ)その開始時間は関数内で変更され、答えとして表示されます。
その関数は、受け取るバッファー配列の測定から始まります(すべてのバッファ0ーは選択されたタイムフレームバーの数に等しい同じサイズを持ちます)バーの数は、選択されたタイムフレームにて測定されます。
選択されたタイムフレームのバー数とバッファー配列のサイズは、ループにて比較されます。より多くのバーを持っていれば、バッファー配列にすべて配置できず、取得されたタイムフレームが10日間短縮されます。つまり、10日ほどが分析開始時間に加えられます。これはバッファー配列がすべてのバーのデータを含むことができなくなるまで続きます。その関数は計算されたデータを返します。
//+------------------------------------------------------------------+
//| Func Calculate Date Start                                        |
//+------------------------------------------------------------------+
datetime func_calc_date_start(datetime input_data_start,// initially start date set
                              datetime data_stop)       // calculation end date (current date)
//---
  {
   int Array_Size=ArraySize(Price);
   int Bars_Size=Bars(_Symbol,time_frame,input_data_start,data_stop);
   for(;Bars_Size>Array_Size;input_data_start+=864000) // 864000 = 10 days
     {
      Bars_Size=Bars(_Symbol,time_frame,input_data_start,data_stop);
     }
   return(input_data_start);
//---
  }
3.4. データのコピー用関数
まず、そのデータはデータコピー用関数にてコピーされます(func_copy_price、func_copy_date)。
価格コピー用関数、func_copy_priceを紹介します。これにより、配列にて設定されたタイムフレームのOpen, Close, High, Low価格をコピーできるようになります。うまくコピーできた場合、その関数は「true」を返します。
関数の呼び出しの初めに、そのFalse値が初期化され、コピーされたデータの結果の変数が初期化され、負の値が割り当てられます。一時的にコピーされたデータを保存する共通の配列price_interim[]や、bars_to_copy変数がコピーされたデータの保存を防ぐするために宣言されます。
さらに、その関数はコピーされたデータを保存するために早めに宣言された変数をリセットし、タイムフレームのバー数を計算し、選択された価格(0-Close, 1-Open, 2-High, 3-Low) やswitch条件文に応じて、bars_copied変数価格に以前コピーされたデータの値を割り当てます。その後、コピー用のデータの数が計算されます。もしそのデータが以前コピーされていたら、最後にコピーされたバーの情報がチャートでの変更を防ぐために削除されます。
Swtich文が必要な価格データをprice_interim[]時間配列にコピーします。その後、コピー結果がチェックされ、switchがコピーされたデータの変数にデータを格納します。
//+------------------------------------------------------------------+
//| Func Copy Price                                                  |
//+------------------------------------------------------------------+
bool func_copy_price(double &result_array[],
                     ENUM_TIMEFRAMES period,// Timeframe
                     datetime data_start,
                     datetime data_stop,
                     char price_type) // 0-Close, 1-Open, 2-High, 3-Low
  {
//---
   int x=false;        // Variable for answering
   int result_copy=-1; // copied data number
//---
   static double price_interim[]; // Temporal dynamic array for storing copied data
   static int bars_to_copy;       // number of bars to copy
   static int bars_copied_0;      // number of copied bars from Close start date
   static int bars_copied_1;      // number of copied bars from Open start date
   static int bars_copied_2;      // number of copied bars from High start date
   static int bars_copied_3;      // number of copied bars from Low start date
   static int bars_copied;        // number of copied bars from the common variable start date
//--- variables reset due to changes in a start date
   if(date_change==true)
     {
      ZeroMemory(price_interim);
      ZeroMemory(bars_to_copy);
      ZeroMemory(bars_copied_0);
      ZeroMemory(bars_copied_1);
      ZeroMemory(bars_copied_2);
      ZeroMemory(bars_copied_3);
      ZeroMemory(bars_copied);
     }
//--- get an information about the current bars number on the timeframe
   bars_to_copy=Bars(_Symbol,period,data_start,data_stop);
//--- assign a copied function value to a common variable
   switch(price_type)
     {
      case 0:
         //--- Close
         bars_copied=bars_copied_0;
         break;
      case 1:
         //--- Open
         bars_copied=bars_copied_1;
         break;
      case 2:
         //--- High
         bars_copied=bars_copied_2;
         break;
      case 3:
         //--- Low
         bars_copied=bars_copied_3;
         break;
     }
//--- calculate number of bars required to be copied
   bars_to_copy-=bars_copied;
//--- if it is not the first time the data has been copied
   if(bars_copied!=0)
     {
      bars_copied--;
      bars_to_copy++;
     }
//--- change the size of the recieving array
   ArrayResize(price_interim,bars_to_copy);
//--- copy data to the recieving array
   switch(price_type)
     {
      case 0:
         //--- Close
        {
         result_copy=CopyClose(_Symbol,period,0,bars_to_copy,price_interim);
        }
      break;
      case 1:
         //--- Open
        {
         result_copy=CopyOpen(_Symbol,period,0,bars_to_copy,price_interim);
        }
      break;
      case 2:
         //--- High
        {
         result_copy=CopyHigh(_Symbol,period,0,bars_to_copy,price_interim);
        }
      break;
      case 3:
         //--- Low
        {
         result_copy=CopyLow(_Symbol,period,0,bars_to_copy,price_interim);
        }
      break;
     }
//--- check the result of data copying
   if(result_copy!=-1) // if copying to the intermediate array is successful
     {
      ArrayCopy(result_array,price_interim,bars_copied,0,WHOLE_ARRAY); // copy the data from the temporary array to the main one
      x=true;                   // assign the positive answer to the function
      bars_copied+=result_copy; // increase the value of the processed data
     }
//--- return the information about the processed data with one of the copied variables
   switch(price_type)
     {
      case 0:
         //--- Close
         bars_copied_0=bars_copied;
         break;
      case 1:
         //--- Open
         bars_copied_1=bars_copied;
         break;
      case 2:
         //--- High
         bars_copied_2=bars_copied;
         break;
      case 3:
         //--- Low
         bars_copied_3=bars_copied;
         break;
     }
//---
   return(x);
  }
"func_copy_date"、データコピー用関数その関数のコードは、上記のユニットに類似し、違いはコピーされるデータの種類のみです。
//+------------------------------------------------------------------+
//| Func Copy Date                                                   |
//+------------------------------------------------------------------+
bool func_copy_date(double &result_array[],
                    ENUM_TIMEFRAMES period,// timeframe
                    datetime data_start,
                    datetime data_stop)
  {
//---
   int x=false;                    // variable for answer
   int result_copy=-1;             // number of copied data
   static datetime time_interim[]; // temporaty dynamic array for storing the copied data
   static int bars_to_copy;        // bars number required to be copied
   static int bars_copied;         // copied bars with start date
//--- variables reset due to the start date change
   if(date_change==true)
     {
      ZeroMemory(time_interim);
      ZeroMemory(bars_to_copy);
      ZeroMemory(bars_copied);
     }
//---
   bars_to_copy=Bars(_Symbol,period,data_start,data_stop); // Find out the current number of bars on the time interval
   bars_to_copy-=bars_copied; // Calculate the number of bars to be copied
//---
   if(bars_copied!=0) // If it is not the first time the data has been copied
     {
      bars_copied--;
      bars_to_copy++;
     }
//---
   ArrayResize(time_interim,bars_to_copy); // Change the size of the receiving array
   result_copy=CopyTime(_Symbol,period,0,bars_to_copy,time_interim);
//---
   if(result_copy!=-1) // If copying to the intermediate array is successful
     {
      ArrayCopy(result_array,time_interim,bars_copied,0,WHOLE_ARRAY); // Copy the data from the temporary array to the main one
      x=true; // assign the positive answer to the function
      bars_copied+=result_copy; // Increase the value of the processed data
     }
//---
   return(x);
  }
3.5. レンガの計算
ご覧の通り、レンガのサイズは、現在の価格でポイントとパーセンテージの両方で設定できます。ポイントは固定値ですが、パーセンテージでの計算はどのように実行されるのでしょうか?このために「func_calc_dorstep」レンガの計算関数があります。
3つの入力パラメーターがあります;現在の価格(もしレンガのサイズがパーセンテージの場合の価格のパーセンテージ方式の計算のため)、計算方法(ポイントかパーセンテージ)、ステップサイズ(パーセンテージかポイントの値で設定されます。)の3つです。
その関数のはじめに、その答えのための変数は、Double型によって初期化され、If-elseの条件文によって選択された計算メソッドに応じて、ポイントにて割り当てられます。それから、たとえ計算が非Int値になっても、その答えの変数はint型に変換され、その値をInt型で保存します。
//+------------------------------------------------------------------+
//| Func Calculate Doorstep                                          |
//+------------------------------------------------------------------+
int func_calc_dorstep(double price,      // price
                      char type_doorstep,// step type
                      double doorstep)   // step
  {
   double x=0;          // variable for answer

   if(type_doorstep==0) // If the calculation is to be performed in points
     {
      x=doorstep;
     }

   if(type_doorstep==1) // If the calculation is to be performed in percentage
     {
      x=price/_Point*doorstep/100;
     }

   return((int)x);
  }
3.6. メインの関数 - レンコチャート累進化
レンコチャート累進化の関数 - "func_draw_renko". この関数は、グラフィカルバッファーを扱い、計算バッファー配列の格納を行います。計算バッファーは各レンガの情報を保持します。
この関数の入力パラメーターは、データの価格とバーの形成日付の配列です。ステップの種類、そのパラメーター、リバースフィルター、影の描画パラメーターに関する情報をこちらで見ることができます。
その関数は、二つのパートに分けることができます;レンガの計算の数を持つ部分と、計算とグラフィカルバッファーの格納における部分です。
その関数の最初に、バッファは、空の箱をオフにするためリセットされます。その後、補助変数が入力されます;「doorstep_now」変数がステップに用いられます(パーセンテージステップのサイズを変更するために用いられます)、「point_go」最後に作成されたレンガからの距離についての情報を保持し、「a」変数は、レンガの計算に用いられます、「upprice_calc」と「down_price_calc」は、最後に分析されたHigh, Low価格で、「type_box_calc」は、最後に分析されたレンガの種類(上向きか下向きか)です。
両方がループから成り立っており、二つ目が一番目を補完します。詳細にプロセスを分析してください。
最初のループはすべてのコピーされた値で処理され、その「bar」値は、コピーされたデータの数に応じます("func_concolidation"で計算されます。こちらは後ほど詳しく見ていきます。)さらに、そのループにてその関数がレンガサイズの計算を始めます。各バーが異なるクローズ価格を持つので、もしパーセンテージステップが用いられた場合、個別にそれぞれのバーに対して計算されなければなりません。
その条件分岐ifは、価格の方向をチェックし、その価格は一つかそれ以上のステップの距離を超えなければなりません。その価格の方向が決定された後、以前の動きの条件がチェックされます。インジケーターパラメーターがフィルターパラメーターを含んでいるので(リバースのために必要なレンガの数)、これが実行されます。すべての条件がチェックされた後、そのループが開始され、レンガが現在の価格の動きを表すほど多くの回数処理されます。
ディスプレィバーが計算され、その計算バッファー配列のサイズが変更され、リセットされます。その後、最初のいくつかの計算配列に主要な値が割り当てられます。
もし最大の表示されるバーの数がレンガの数よりも少なければ、余分のレンガが計算され、低い値に関するメッセージが表示されます。これは、チャートの間違った表示を防ぐために行われます。
レンガの数の計算のための変数がリセットされ、メインループが開始されます。前のループとは異なり、そのメインループは計算バッファー配列の格納とレンガカウンターのリセットを扱います。
その関数の最後に、そのグラフィックバッファーに格納されます。
//+------------------------------------------------------------------+
//| Func Draw Renko                                                  |
//+------------------------------------------------------------------+
void func_draw_renko(double &price[],   // prices array
                     double &date[],    // date array
                     int number_filter, // bricks number for reversal
                     bool draw_shadow,  // draw shadow
                     char type_doorstep,// step type
                     double doorstep)   // step
  {
//--- arrays reset
//--- drawing buffer arrays
   ZeroMemory(RENKO_close);
   ZeroMemory(RENKO_color);
   ZeroMemory(RENKO_high);
   ZeroMemory(RENKO_low);
   ZeroMemory(RENKO_open);
//--- additional variables
   int doorstep_now; // current step
   int point_go;     // passed points
//--- additional variables for bricks number calculating
   a=0;
   double up_price_calc=price[0];
   double down_price_calc=price[0];
   char type_box_calc=0;

   for(int z=0; z<bars; z++) //---> bricks calculating loop
     {
      //--- calculate step according to the current price
      doorstep_now=func_calc_dorstep(price[z],type_doorstep,doorstep);
      //--- if price rises
      if((price[z]-up_price_calc)/_Point>=doorstep_now)
        {
         //--- calculate points passed
         point_go=int((price[z]-up_price_calc)/_Point);
         //--- prices was rising or unknown price behavour
         if(type_box_calc==1 || type_box_calc==0)
           {
            for(int y=point_go; y>=doorstep_now; y-=doorstep_now)
              {
               //--- add the next brick
               a++;
               //--- add value of the next brick low price
               down_price_calc=up_price_calc;
               //--- add value of the next brick up price
               up_price_calc=down_price_calc+(doorstep_now*_Point);
               //--- set the brick type (up)
               type_box_calc=1;
              }
           }
         //--- price went down
         if(type_box_calc==-1)
           {
            if((point_go/doorstep_now)>=number_filter)
              {
               for(int y=point_go; y>=doorstep_now; y-=doorstep_now)
                 {
                  //--- add the next brick
                  a++;
                  //--- set the next brick down price
                  down_price_calc=up_price_calc;
                  //--- set the next brick up price
                  up_price_calc=down_price_calc+(doorstep_now*_Point);
                  //--- set the brick type (up)
                  type_box_calc=1;
                 }
              }
           }
        }
      //--- if the price moves downwards
      if((down_price_calc-price[z])/_Point>=doorstep_now)
        {
         //--- calculate the points passed
         point_go=int((down_price_calc-price[z])/_Point);
         //--- if the price went downwards or the direction is unknown
         if(type_box_calc==-1 || type_box_calc==0)
           {
            for(int y=point_go; y>=doorstep_now; y-=doorstep_now)
              {
               //--- add the next brick
               a++;
               //--- set the next brick low price value
               up_price_calc=down_price_calc;
               //--- set the next brick up price value
               down_price_calc=up_price_calc-(doorstep_now*_Point);
               //--- set the britck type (up)
               type_box_calc=-1;
              }
           }
         //--- the price moved upwards
         if(type_box_calc==1)
           {
            if((point_go/doorstep_now)>=number_filter)
              {
               for(int y=point_go; y>=doorstep_now; y-=doorstep_now)
                 {
                  //--- add the next brick
                  a++;
                  //--- set the next brick down price value
                  up_price_calc=down_price_calc;
                  //--- set the next brick up price value
                  down_price_calc=up_price_calc-(doorstep_now*_Point);
                  //--- set the brick type (up)
                  type_box_calc=-1;
                 }
              }
           }
        }
     } //---< bricks calculate loop
//--- calculate the number of display bars
   int b=Bars(_Symbol,PERIOD_CURRENT);
//--- resize arrays
   ArrayResize(up_price,b);
   ArrayResize(down_price,b);
   ArrayResize(type_box,b);
   ArrayResize(time_box,b);
   ArrayResize(shadow_up,b);
   ArrayResize(shadow_down,b);
   ArrayResize(number_id,b);
//--- resize calculation buffers array
   ZeroMemory(up_price);
   ZeroMemory(down_price);
   ZeroMemory(type_box);
   ZeroMemory(time_box);
   ZeroMemory(shadow_up);
   ZeroMemory(shadow_down);
   ZeroMemory(number_id);
//--- fill arrays with the initial values
   up_price[0]=price[0];
   down_price[0]=price[0];
   type_box[0]=0;
//--- calculate odd bricks number
   int l=a-b;
   int turn_cycle=l/(b-1);
   int turn_rest=(int)MathMod(l,(b-1))+2;
   int turn_var=0;
//--- message of partially displayed bricks
   if(a>b)Alert("More bricks than can be placed on the chart, the step is small");

   a=0; //--- reset bricks claculating variable
   for(int z=0; z<bars; z++) //---> Main loop
     {
      //--- calculate the step according to the price
      doorstep_now=func_calc_dorstep(price[z],type_doorstep,doorstep);
      //---if the price moves upwards
      if((price[z]-up_price[a])/_Point>=doorstep_now)
        {
         //--- calculate the points passed
 point_go=int((price[z]-up_price[a])/_Point);
         //--- price moved upwards or its behavour is unknown
         if(type_box[a]==1 || type_box[a]==0)
           {
            for(int y=point_go; y>=doorstep_now; y-=doorstep_now)
              {
               a++; //--- add the next brick
               if((a==b && turn_var<turn_cycle) || (turn_var==turn_cycle && turn_rest==a))
                 {
                  up_price[0]=up_price[a-1];
                  a=1;        // bricks calculator reset
                  turn_var++; // calculator of loops reset
                 }
               //--- the next brick low price value
               down_price[a]=up_price[a-1];
               //--- set the brick up price
               up_price[a]=down_price[a]+(doorstep_now*_Point);

               //--- set the up shadow value
               if(shadow_print==true) shadow_up[a]=price[z]; //to the upper price level
               else shadow_up[a]=up_price[a];                // to the up price level

               //--- set the low price value(to the brick price level)
               shadow_down[a]=down_price[a];
               //--- value of the brick closing time
               time_box[a]=(datetime)Date[z];
               //--- set the brick type (up)
               type_box[a]=1;
               //--- set the index
               number_id[a]=z;
              }
           }
         //--- the price moved downwards
         if(type_box[a]==-1)
           {
            if((point_go/doorstep_now)>=number_filter)
              {
               for(int y=point_go; y>=doorstep_now; y-=doorstep_now)
                 {
                  a++; //--- add the next brick

                  if((a==b && turn_var<turn_cycle) || (turn_var==turn_cycle && turn_rest==a))
                    {
                     up_price[0]=up_price[a-1];
                     a=1;        // bricks counter reset
                     turn_var++; // loops reset cycle
                    }
                  //--- set the next brick low price value
                  down_price[a]=up_price[a-1];
                  //--- set the next brick up price
                  up_price[a]=down_price[a]+(doorstep_now*_Point);

                  //--- set the up shadow value
                  if(shadow_print==true) shadow_up[a]=price[z]; // at the up price level
                  else shadow_up[a]=up_price[a];                // the brick up price level

                  //--- set of the down price value (the brick price level)
                  shadow_down[a]=down_price[a];
                  //--- set the close time
                  time_box[a]=(datetime)Date[z];
                  //--- set the up brick
                  type_box[a]=1;
                  //--- set index
                  number_id[a]=z;
                 }
              }
           }
        }

      //--- if price moves upwards
      if((down_price[a]-price[z])/_Point>=doorstep_now)
        {
         //--- calculate the points passed
         point_go=int((down_price[a]-price[z])/_Point);
         //--- price moved downwards or the direction is unknown
         if(type_box[a]==-1 || type_box[a]==0)
           {
            for(int y=point_go; y>=doorstep_now; y-=doorstep_now)
              {
               a++; //--- add the next brick
               if((a==b && turn_var<turn_cycle) || (turn_var==turn_cycle && turn_rest==a))
                 {
                  down_price[0]=down_price[a-1];
                  a=1;        // set the bricks counter to zero
                  turn_var++; // reset loop counter
                 }
               //--- set the next brick down price
               up_price[a]=down_price[a-1];
               //--- set the next brick up price
               down_price[a]=up_price[a]-(doorstep_now*_Point);

               //--- set the down shadow value
               if(shadow_print==true) shadow_down[a]=price[z]; //--- the last lowest price level
               else shadow_down[a]=down_price[a];              //--- low price level

               //--- set the up price value
               shadow_up[a]=up_price[a];
               //--- set the brick close time
               time_box[a]=set the down shadow value];
               //--- set the brick type (down)
               type_box[a]=-1;
               //--- set index
               number_id[a]=z;
              }
           }
         //--- price moved upwards
         if(type_box[a]==1)
           {
            if((point_go/doorstep_now)>=number_filter)
              {
               for(int y=point_go; y>=doorstep_now; y-=doorstep_now)
                 {
                  a++; //--- add the next brick
                  if((a==b && turn_var<turn_cycle) || (turn_var==turn_cycle && turn_rest==a))
                    {
                     down_price[0]=down_price[a-1];
                     a=1;        // reset bricks counter
                     turn_var++; // reset loop counter
                    }

                  up_price[a]=down_price[a-1]; //--- set the next brick down price
                  down_price[a]=up_price[a]-(doorstep_now*_Point); //--- set the up price value

                  //--- set the down shadow value
                  if(shadow_print==true) shadow_down[a]=price[z]; // at the lowest price level
                  else shadow_down[a]=down_price[a];              // at the down price level

                  //--- set the up price level
                  shadow_up[a]=up_price[a];
                  //--- set the brick close time
                  time_box[a]=(datetime)Date[z];
                  //--- set the brick type (down)
                  type_box[a]=-1;
                  //--- index set
                  number_id[a]=z;
                 }
              }
           }
        }
     } //---< Main loop

//--- fill the draw buffer
   int y=a;
   for(int z=0; z<a; z++)
     {
      if(type_box[y]==1)RENKO_color[z]=0;
      else RENKO_color[z]=1;
      RENKO_open[z]=down_price[y];
      RENKO_close[z]=up_price[y];
      RENKO_high[z]=shadow_up[y];
      RENKO_low[z]=shadow_down[y];
      y--;
     }
  }
3.7. 「トレンド線」と、「長方形」グラフィカルオブジェクトを作成するための関数
「トレンド線」を作成するための関数「func_create_trend_line」、「長方形」グラフィカルオブジェクトを作成するための関数、「func_create_square_or_rectangle」は、OBJ_RECTANGLEやOBJ_TRENDへのリファレンスに言及されているデータに基づきます。それらは、「レンコ」チャートのグラフィカルオブジェクト作成や、メインチャートでの「ZigZag」の形成のために使用されます。
//+------------------------------------------------------------------+
//| Func Create Trend Line                                           |
//+------------------------------------------------------------------+
void func_create_trend_line(string name,
                            double price1,
                            double price2,
                            datetime time1,
                            datetime time2,
                            int width,
                            color color_line)
  {
   ObjectCreate(0,name,OBJ_TREND,0,time1,price1,time2,price2);
//--- set the line color
   ObjectSetInteger(0,name,OBJPROP_COLOR,color_line);
//--- set the line display style
   ObjectSetInteger(0,name,OBJPROP_STYLE,STYLE_SOLID);
//--- set the width of the line
   ObjectSetInteger(0,name,OBJPROP_WIDTH,width);
//--- display in the foreground (false) or in the (true) background
   ObjectSetInteger(0,name,OBJPROP_BACK,false);
//--- enable (true) or disable (false) the mode of the left line display
   ObjectSetInteger(0,name,OBJPROP_RAY_LEFT,false);
//--- enable (true) or disable (false) the right line display
   ObjectSetInteger(0,name,OBJPROP_RAY_RIGHT,false);
  }
//+------------------------------------------------------------------+
//| Func Create Square or Rectangle                                  |
//+------------------------------------------------------------------+
void func_create_square_or_rectangle(string name,
                                     double price1,
                                     double price2,
                                     datetime time1,
                                     datetime time2,
                                     int width,
                                     color color_square,
                                     bool fill)
  {
//--- create rectangle according to the setpoints
   ObjectCreate(0,name,OBJ_RECTANGLE,0,time1,price1,time2,price2);
//--- set the rectangle color
   ObjectSetInteger(0,name,OBJPROP_COLOR,color_square);
//--- set style of rectangle color
   ObjectSetInteger(0,name,OBJPROP_STYLE,STYLE_SOLID);
//--- set lines width
   ObjectSetInteger(0,name,OBJPROP_WIDTH,width);
//--- activate (true) or disactivate (false) mode of rectangle colouring
   ObjectSetInteger(0,name,OBJPROP_FILL,fill);
//--- display in the foreground (false) or in the background (true)
   ObjectSetInteger(0,name,OBJPROP_BACK,false);
  }
3.8. メインチャート上での「レンコ」の形成
共通の計算バッファー配列の使用のため、レンコチャートの関数、「func_draw_renko_main_chart」はむしろコンパクトになります。
その入力パラメーターは以下を含みます;フレーム付き上向き、下向きのレンガ、二種類のフレーム幅(1種類目は、レンガに、2種類目はフレームに用いられます)、3つのディスプレィオプション(レンガ、色、フレームの3つです)
まず、オブジェクト名の変数が宣言され、生成されたそれぞれのオブジェクト名に関するループが開かれ、以前のレンガの種類に応じて、「トレンド線」、「長方形」グラフィカルオブジェクトの関数が実行されます。そのパラメーターは、計算バッファー配列から取得されました。
//+------------------------------------------------------------------+
//| Func Draw Renko Main Chart                                       |
//+------------------------------------------------------------------+
void func_draw_renko_main_chart(color color_square_up,
                                color color_square_down,
                                color color_frame_up,
                                color color_frame_down,
                                int width_square,
                                int width_frame,
                                bool square,
                                bool fill,
                                bool frame)
  {
   string name_square;
   string name_frame;

   for(int z=2; z<=a; z++)
     {
      name_square=IntegerToString(magic_numb)+"_Square_"+IntegerToString(z);
      name_frame=IntegerToString(magic_numb)+"_Frame_"+IntegerToString(z);
      if(type_box[z]==1)
        {
         if(square==true)func_create_square_or_rectangle(name_square,up_price[z],down_price[z],time_box[z-1],time_box[z],width_square,color_square_up,fill);
         if(frame==true)func_create_square_or_rectangle(name_frame,up_price[z],down_price[z],time_box[z-1],time_box[z],width_frame,color_frame_up,false);
        }
      if(type_box[z]==-1)
        {
         if(square==true)func_create_square_or_rectangle(name_square,up_price[z],down_price[z],time_box[z-1],time_box[z],width_square,color_square_down,fill);
         if(frame==true)func_create_square_or_rectangle(name_frame,up_price[z],down_price[z],time_box[z-1],time_box[z],width_frame,color_frame_down,false);
        }
     }
  }
3.9. メインチャートでの"ZigZag"形成
インジケーターへの補助として、「ZigZag」チャート関数、「func_draw_zig_zag」があります。
入力パラメーター;その描画方法(最大・最小価格、もしくはチャートポイントにて)、線幅、上向き・下向きの線の色。
"zig_zag_shadow"パラメーターの変更は図4にてご覧になれます。もし「true」がオンの状態であれば、そのインジケーターは影のポイント(最小・最大の価格)で「ZigZag」線を描きます。「false」オブションにて、その「ZigZag」線は「レンコ」最大・最小ポイントに描画されます。
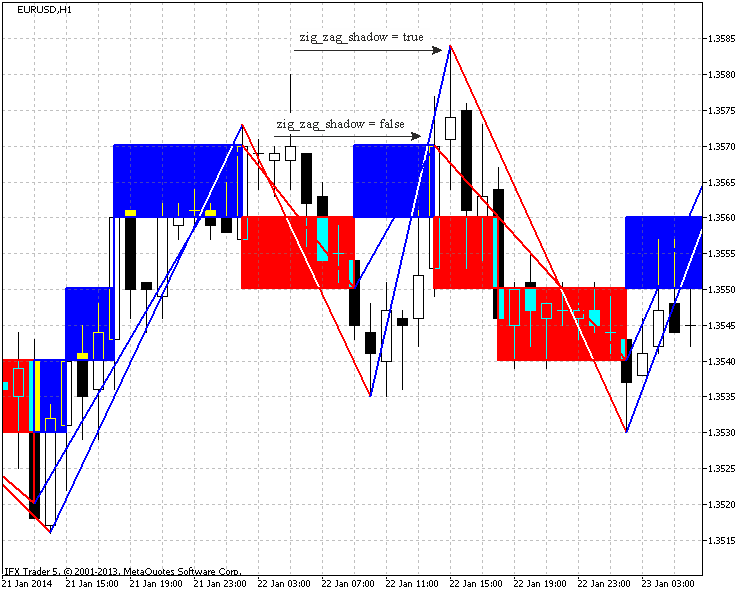
図4. "zig_zag_shadow"パラメーターのEURUSED, H1, 10ポイントでの影響
「トレンド線」オブジェクトを形成するために、二つのポイント(開始と終了)が必要で、価格パラメーターに二つの変数を入力し、日付パラメーターにも二つの変数を格納します。条件分岐が最初のレンガの種類に応じて、一つ目のポイントを設定します。
そして、すべてのオブジェクトを形成するループが開始します。ご覧の通り、すでに一つ目のポイントが設定されている場合、そのループは二つ目のレンガの分析から始まります。そして、その条件分岐レンガの種類(価格の動き)をチェックします。そのオブジェクトの名前の変数が格納され、価格の動きの変化に応じて、そのループが分割されます。次に、描画方法に応じて、二つのバリアントに分けられます。
最小・最大価格にて表示された場合、そのPrice_high[]とPrice_low[]のデータ配列は近い最小・最大ポイントを検索します。その検索は近いバーに限られます。
もしチャートポイントにて累進すれば、そのデータはバッファ配列から割り当てられています。
「トレンド線」形成関数が呼び出されます。その関数は、「ZigZag」の分析とチャート化を終了します。
//+------------------------------------------------------------------+
//| Func Draw Zig Zag                                                |
//+------------------------------------------------------------------+
void func_draw_zig_zag(bool price_shadow,
                       int line_width,
                       color line_color_up,
                       color line_color_down)
  {
   double price_1=0;
   double price_2=0;
   datetime date_1=0;
   datetime date_2=0;

   if(type_box[1]==1)price_1=down_price[1];
   if(type_box[1]==-1)price_1=up_price[1];
   date_1=time_box[1];
   int id=0; //  Low & High array storing variable
   int n=0;  // variable for name forming

   string name_line; //--- variable responsible for the "trend line" name

   for(int z=2; z<=a; z++)
     {
      if(type_box[z]!=type_box[z-1])
        {
         n++;
         name_line=IntegerToString(magic_numb)+"_Line_"+IntegerToString(n);
         if(type_box[z]==1)
           {
            if(price_shadow==true)
              {
               id=number_id[z-1];
               if((id-1)>0 && Price_low[id-1]<Price_low[id])id--;
               if(Price_low[id+1]<Price_low[id])id++;
               price_2=Price_low[id];
               date_2=(datetime)Date[id];
              }
            else
              {
               price_2=down_price[z-1];
               date_2=time_box[z-1];
              }
            func_create_trend_line(name_line,price_1,price_2,date_1,date_2,line_width,line_color_down);
            price_1=price_2;
            date_1=date_2;
           }
         if(type_box[z]==-1)
           {
            if(price_shadow==true)
              {
               id=number_id[z-1];
               if((id-1)>0 && Price_high[id-1]>Price_high[id])id--;
               if(Price_high[id+1]>Price_high[id])id++;
               price_2=Price_high[id];
               date_2=(datetime)Date[id];
              }
            else
              {
               price_2=up_price[z-1];
               date_2=time_box[z-1];
              }
            func_create_trend_line(name_line,price_1,price_2,date_1,date_2,line_width,line_color_up);
            price_1=price_2;
            date_1=date_2;
           }
        }
     }
  }
3.10. 以前作成されたグラフィカルオブジェクトの削除
マジックナンバーはインジケーターのオブジェクトを特定するために使用されます。チャートのでのいくつかのインジケーターの起動とオブジェクトの削除プロセスを単純化します。
次の関数は、オブジェクトを削除するための関数「func_delete_objetcts」です。その名前(オブジェクト(トレンド線、長方形)に応じて設定されます)とオブジェクトの名前は二つの入力パラメーターに格納されています。その関数はオブジェクトを選択し、すでに割り当てられた名前のオブジェクトを削除します。
//+------------------------------------------------------------------+
//| Func Delete Objects                                              |
//+------------------------------------------------------------------+
void func_delete_objects(string name,
                         int number)
  {
   string name_del;
   for(int x=0; x<=number; x++)
     {
      name_del=name+IntegerToString(x);
      ObjectDelete(0,name_del);
     }
  }
すべてのインジケーターオブジェクトを削除するためのすべての関数を統合している関数が作成されました。
//+------------------------------------------------------------------+
//| Func All Delete                                                  |
//+------------------------------------------------------------------+
void func_all_delete()
  {
//--- the graphical objects calculating
   obj=ObjectsTotal(0,-1,-1);
//--- all indicator graphical objects deleting
   func_delete_objects(IntegerToString(magic_numb)+"_Line_",obj);
   func_delete_objects(IntegerToString(magic_numb)+"_Square_",obj);
   func_delete_objects(IntegerToString(magic_numb)+"_Frame_",obj);
//--- the chart redrawing
   ChartRedraw(0);
  }
3.11. レベルの生成のための関数
レベルの生成のための関数"func_create_levels"は、インジケーターウィンドウのチャートの表示を単純化します。それは二つの入力パラメータのみを持ちます:生成されるレベルと色、です。
関数内にて、IndicatorSetIntegerは、表示されるレベル数を設定するために使用され、価格と色はそれぞれのレベルに設定されます。
//+------------------------------------------------------------------+
//| Func Create Levels                                               |
//+------------------------------------------------------------------+
void func_create_levels(int level_number,
                        color level_color)
  {
//--- set the number of levels in the indicator window
   IndicatorSetInteger(INDICATOR_LEVELS,level_number);
 which brick is taken to draw levels
   int k=0;
   if(a>level_number)k=a-level_number;
//--- set levels prices
   for(int z=0;(z<=level_number && k<=a); z++,k++)
     {
      IndicatorSetDouble(INDICATOR_LEVELVALUE,z,up_price[k]);
      IndicatorSetInteger(INDICATOR_LEVELCOLOR,z,level_color);
     }
  }
3.12. 統合用関数
"func_consolidation"関数は、すべての関数を統合するために作成されました。
その関数はすべての実行された関数を呼び出します。
//+------------------------------------------------------------------+
//| Func Consolidation                                               |
//+------------------------------------------------------------------+
void func_concolidation()
  {
//--- deleting all the graphical objects of the indicator
   func_all_delete();
//--- the current date
   date_stop=TimeCurrent();
//--- the initial date changing due to the restricted buffer size
   if((bars=Bars(_Symbol,time_frame,date_start,date_stop))>ArraySize(Price))
     {
      date_start=func_calc_date_start(date_start,date_stop);
      Alert("The initial date was changed due to the lack of the chart size");
      date_change=true;
      //--- calculation of bars on the taken timeframe
      bars=Bars(_Symbol,time_frame,date_start,date_stop);
     }
//---
   bool result_copy_price=func_copy_price(Price,time_frame,date_start,date_stop,type_price);
   bool result_copy_date=func_copy_date(Date,time_frame,date_start,date_stop);
//--- change the date parameter
   if(result_copy_price=true && result_copy_date==true)date_change=false;
//---
   if(zig_zag_shadow==true)
     {
      func_copy_price(Price_high,time_frame,date_start,date_stop,2);
      func_copy_price(Price_low,time_frame,date_start,date_stop,3);
     }
//---
   func_draw_renko(Price,Date,filter_number,shadow_print,type_step,step);
   if(zig_zag==true)func_draw_zig_zag(zig_zag_shadow,zig_zag_width,zig_zag_color_up,zig_zag_color_down);
//---
   func_draw_renko_main_chart(square_color_up,square_color_down,frame_color_up,frame_color_down,square_width,frame_width,square_draw,square_fill,frame_draw);
   func_create_levels(levels_number,levels_color);
//--- redraw the chart
   ChartRedraw(0);
  }
3.13. OnCalculate()とOnChartEvent()関数
OnCalculate()functionに進む前に、新しいバーを分析する「func_new_bar」関数を見てみましょう。
それは、IsNewBarで示されている単純化された関数です。
//+------------------------------------------------------------------+
//| Func New Bar                                                     |
//+------------------------------------------------------------------+
bool func_new_bar(ENUM_TIMEFRAMES period_time)
  {
//---
   static datetime old_times; // array for storing old values
   bool res=false;            // analysis result variable
   datetime new_time[1];      // new bar time
//---
   int copied=CopyTime(_Symbol,period_time,0,1,new_time); // copy the time of the new bar into the new_time box
//---
   if(copied>0) // все ок. data have been copied
     {
      if(old_times!=new_time[0])    // if the bar's old time is not equal to new one
        {
         if(old_times!=0) res=true; // if it is not the first launch, true = new bar
         old_times=new_time[0];     // store the bar's time
        }
     }
//---
   return(res);
  }
OnCalculate()関数は、もし新しいバーがチャートの更新中に作成された場合、すべての関数を統合し始めます。
//+------------------------------------------------------------------+
//| Custom indicator iteration function                              |
//+------------------------------------------------------------------+
int OnCalculate(const int rates_total,
                const int prev_calculated,
                const int begin,
                const double &price[])
  {
//---
   if(func_new_bar(time_redraw)==true)
     {
      func_concolidation();
     }
//--- return value of prev_calculated for next call
   return(rates_total);
  }
OnChartEvent()関数は、すべてのグラフィカルオブジェクトを"C"を押すことで削除し、"R"押すと、チャートの再描画を開始します(統合関数)。
//+------------------------------------------------------------------+
//| OnChartEvent                                                     |
//+------------------------------------------------------------------+
void OnChartEvent(const int id,         // event ID
                  const long& lparam,   // long type event parameter
                  const double& dparam, // double type event parameter
                  const string& sparam) // string type event parameter
  {
//--- Keyboard button pressing event
   if(id==CHARTEVENT_KEYDOWN)
     {
      if(lparam==82) //--- "R" key has been pressed
        {
         //--- call of the consolidation function
         func_concolidation();
        }
      if(lparam==67) //--- "C" key has been pressed
        {
         //--- deletion of all objects of the indicator
         func_all_delete();
        }
     }
  }
3.14. OnDeinit()関数
そして、最後にOnDeint()関数です。この関数はインジケータのすべてのグラフィカルオブジェクトを削除するための関数を起動します。
//+------------------------------------------------------------------+
//| Custom indicator deinitialization function                       |
//+------------------------------------------------------------------+
void OnDeinit(const int reason)
  {
//--- delete all graphical objects of the indicator
   func_all_delete();
  }
4. レンコチャートを試しに使用する
レンコチャートは、価格の動きの戦略に応じて作成されます。
最も人気の戦略から始めましょう:上向きのレンガが下向きに動き始めた場合に売り、逆の場合に買うというものです。
これは図5に示されています:
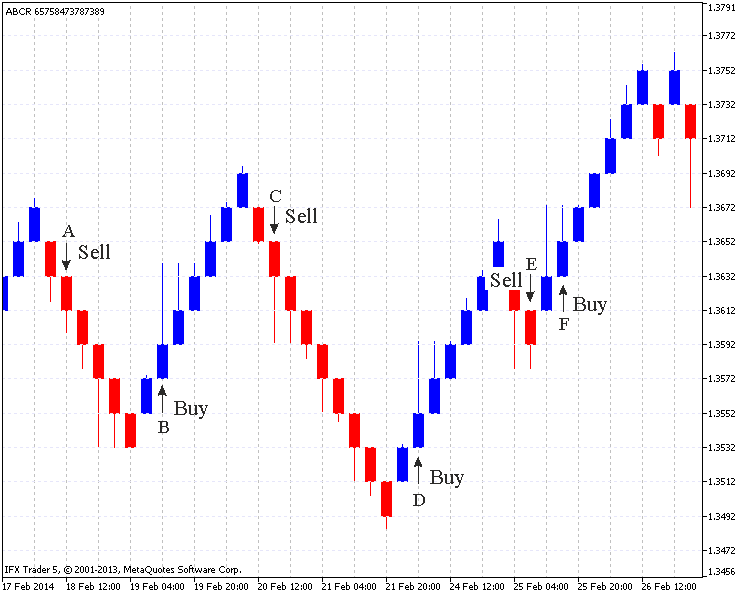
図5. 標準レンコチャート (EURUSD H4, 20 ポイント)
図5は、市場への参入の6つのポイント (A,B,C,D,E,F) を示しています。
「A」ポイントでは、上向きレンガが下向きレンガに変わります。
(B,C,D)ポイントのリバースされたレンガは、一つの動きで作成されます。しかし、「E」ポイントでは、二つのレンガが一つの動きで作成され、同じレベルで下の影も作成されます。
この場合、その参入は「E」と「F」ポイントの間で可能です。価格が反対方向にお動いているので、それは成功した参入ではなく、類似した状況は「F」ポイント上です:一つの動きが同様に二つのレンガを作成します。上の影が同じレベルで作成されます。強い動きですが、価格は方向を変えません。
最も望ましいマーケットへの参入は、一つのリバースレンガが作成された時です。もし二つのレンガが一度に作成されると、その参入は安全ではありません。
このチャートでの"ZigZag"は、グラフィカルアナリシスに使用されます。図6はいくつかの例を示しています:「support」、「resistance」線、「head and shoulders」モデル設定
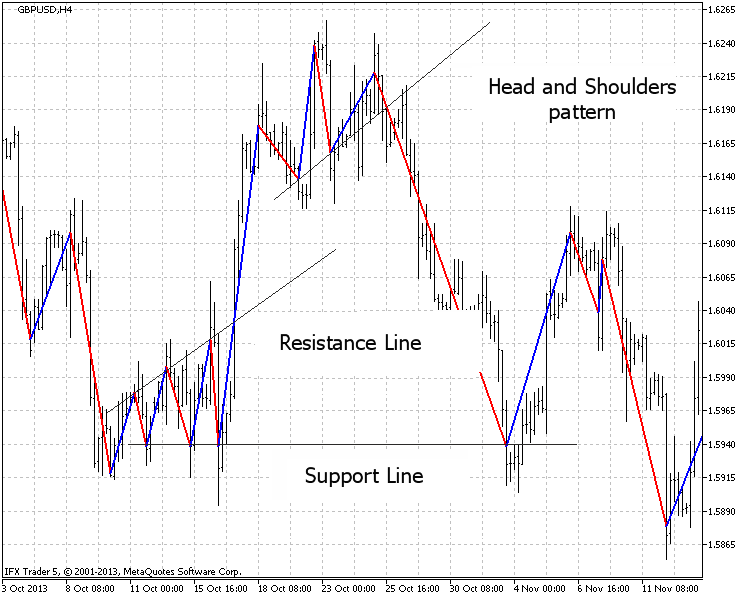
図6グラフィカルアナリシス(GBPUSD H4, 20ポイント)
"Equidistant channel" グラフィカルアナリシスが図7で示されています。
そのインジケーターはタイムフレームを分析するためにセットされ、その累進は、4時間のタイムフレームにて表示されています。
そのような設定は、カスタムがいくつかのタイムフレームで同時にシグナルに従わせるようにし、一つのインジケーターが一つのタイムフレームに使用され、他のインジケーターがが別のタイムフレームに使用できるということを意味します。
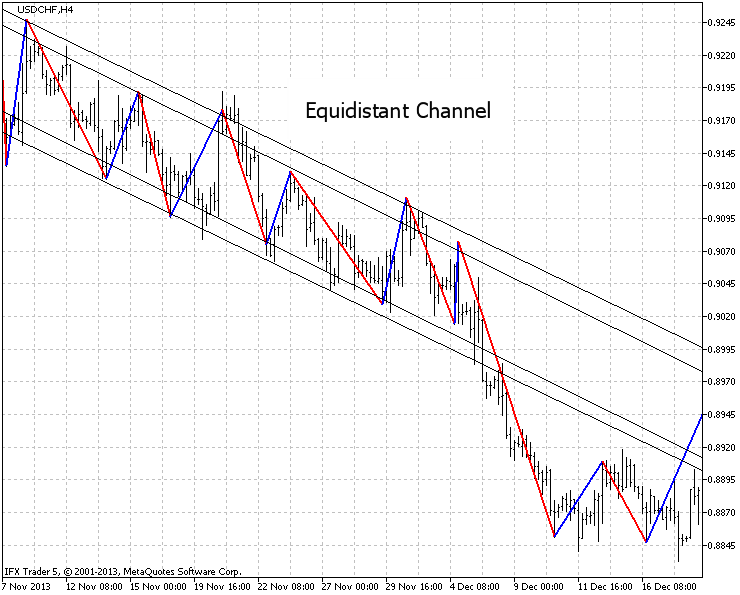
図7. "Equidistant channel"の分析( USDCHF, H4, H1の設定, 20 ポイント)
図8は、異なるタイムフレームに関してのもう一つの例を示しています。
そのタイムチャートは、起こりうるクローズリバースを示し、4時間のチャートが使用しないシグナルを削除し、ディリーチャートが傾向の動きの長い延滞を承認します。
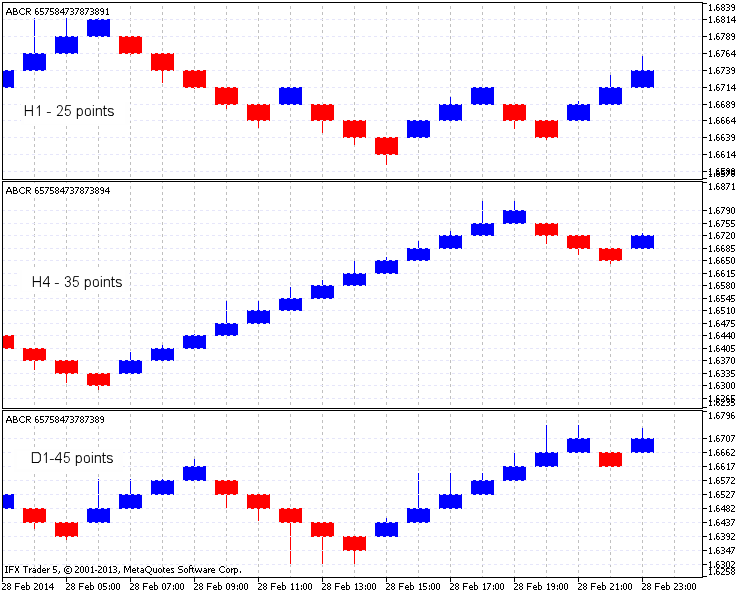
図8. GBPUSD, H1, H4とD1でのレンコインジケーター
もう一つの例は、図9です。このルールによると、最も近い赤色のレンガの間に上向きの線を少なくとも青色のレンガとともに作成し、レンガがその線の下に作成されれば売りに出します。
そして、その逆も行います:最も近い青色のレンガの間に下向きの線を赤色のレンガとともに作成し、その線より上にレンガが作成されれば売りに出します。
色は、図9にて述べらています。図9. 青と赤色の矢印は、場所を描画する線をマークし、大きい矢印は、買いと売りのシグナルをマークしています。
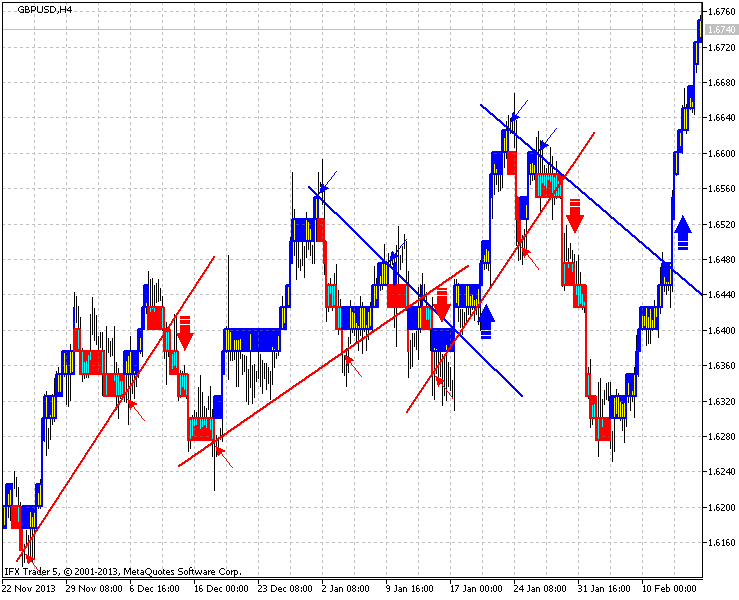
図9. GBPUSD, H4, 25ポイントインジケーターの例
結論
レンコチャートは、初心者とプロのトレーダー両者にとって興味深いものです。年月が経ちましたが、以前使用されています。
この記事にて、そのチャートに興味を持ってもらい、レンコチャートの分析を向上したいと考えていました。そのため、レンコチャートの形成方法を詳しく紹介しました。
そのインジケーターに関する改善点や新しいアイディアを受け付けており、将来それらを実装したいと思っています。そのインジケーターの実装方法はいくつかあり、あなた自身の方法を見つけるかもしれません。
ここまで読んでいただきありがとうございました。トレードがうまくいき、新しいトレードストラテジーを発見できることを願っています!
MetaQuotes Ltdによってロシア語から翻訳されました。
元の記事: https://www.mql5.com/ru/articles/792
警告: これらの資料についてのすべての権利はMetaQuotes Ltd.が保有しています。これらの資料の全部または一部の複製や再プリントは禁じられています。
この記事はサイトのユーザーによって執筆されたものであり、著者の個人的な見解を反映しています。MetaQuotes Ltdは、提示された情報の正確性や、記載されているソリューション、戦略、または推奨事項の使用によって生じたいかなる結果についても責任を負いません。
 MQL5 エキスパートアドバイザーから、GSMモデムを使用する
 MQL5クックブック - MQL5での未決注文の取り扱いとマルチカレンシーエキスパートアドバイザー
 MetaTrader 5の継続的な先物取引
- 無料取引アプリ
- 8千を超えるシグナルをコピー
- 金融ニュースで金融マーケットを探索
インジケータは完璧に動作しています。しかし、コードの中で直接変更しても、レベルの色をなし(clrNONE / -1)に変更することができません。関数はこうなると思います:
IndicatorSetInteger(INDICATOR_LEVELCOLOR,z,レベルカラー)
41行目をリンクhttps://www.mql5.com/ja/docs/constants/objectconstants/webcolors.  の色のいずれかに変更してください;
こんにちは。
あなたのインジケーターをダウンロードしましたが、うまく動作しないようです。
私はこのインディケータをRoboforexのMT5で動かしていますが、あなたがアップロードした画像のようには表示できません。
このインディケータを正常に動作させる方法を教えていただけますか?ありがとうございました。
おそらく古いデータが何らかの形でつながっているのでしょう。一度チャートを閉じて、インジケーターを開いて追加してみてください。それでもうまくいかない場合は、どのように実行したかを書いてください。
こんにちは。インジケーターを チャートウィンドウにドラッグしても、renkoチャートが表示されない方へのヒントです。キーボードの「R」キーを押してみてください。私はうまくいきました。ありがとうございます。
ありがとう!ここではうまくいったよ!
Oups :( インジケータが再描画されることに今気づいたよ。