
MQL5での戦略の可視化:基準チャートに最適化結果をレイアウトする

内容
はじめに
mql5.comには非常に多くの情報があり、記事カタログやリファレンス、教科書をスクロールするたびに、新しい発見や興味深い情報を見つけることができます。
今回もその一例です。シンプルで一見簡単そうな記事を見つけました。内容はストラテジーテスターの簡単な説明に過ぎず、一見既知の情報のように思えます。しかし、記事の最後の部分が非常に興味を引きました。記事では、単純に小さなコードをEAに接続し、いくつかの標準ハンドラを追加するだけで、通常のMetaTrader 5プラットフォームストラテジーテスターの最適化機能が、視覚的に確認できるものに変わると説明されていました。これは面白そうです。
そこで内容を整理し始めました。そして、自分なりに少し見た目を改善し、最適化結果をより便利に閲覧できる機能を追加することを考えました。
具体的には、EAは新しいウィンドウを開き、そこには5つのタブが表示されます。最初のタブにはすべてのパスのチャートがあり、各パスはバランス曲線として描画されます。残りの4つのタブにもチャートが表示されますが、最適化が完了した後に利用可能になります。各タブでは、4つの最適化基準のそれぞれについて、上位3つのパスのデータを表示します。そして、各タブには2つの表があり、1つは最適化パスの結果を示し、もう1つはそのパスにおけるEAの設定を示します。
- 最適化タブ
- 次のパスの最適化結果表
- 該当パスのEA入力パラメータ表
- 現在完了した最適化パスのバランス曲線
- Replayボタン(最適化の再生用)
- シャープレシオタブ
- 選択されたパス(シャープレシオ上位3つのうちの1つ)の最適化結果表
- 上の選択されたパスのEA入力パラメータ表
- シャープレシオ上位3つのパスのバランス曲線
- シャープレシオ上位3つのパスの3つの最適化結果から1つを選択する三段階トグル
- 純利益タブ
- 選択されたパス(純利益上位3つのうちの1つ)の最適化結果表
- 上の選択されたパスのEA入力パラメータ表
- 純利益上位3つのパスのバランス曲線
- 純利益上位3つのパスの3つの最適化結果から1つを選択する三段階トグル
- プロフィットファクタータブ
- 選択されたパス(収益性上位3つのうちの1つ)の最適化結果表
- 上の選択されたパスのEA入力パラメータ表
- 収益性上位3つのパスのバランス曲線
- 収益性上位3つのパスの3つの最適化結果から1つを選択する三段階トグル
- リカバリーファクタータブ
- 選択されたパス(リカバリーファクター上位3つのうちの1つ)の最適化結果表
- 上の選択されたパスのEA入力パラメータ表
- リカバリーファクター上位3つのパスのバランス曲線
- リカバリーファクター上位3つのパスの3つの最適化結果から1つを選択する三段階トグル
タブのセットを実装するために、まずコントロールクラスを作成し、そこからタブコントロールを構築します。本記事ではコントロール作成の手順は省略し、あらかじめ用意されたクラスファイルを提供する形にします。以降の記事では、将来的に役立つかもしれないいくつかのコントロールを作成するために、そのようなクラスの説明に戻ります。
パラメータの受け渡し情報を表示するために、テーブルクラスは「MQL5におけるSQLiteの機能:銘柄とマジックナンバー別の取引統計を表示するダッシュボード」記事からあらかじめ用意された形式で取得し、テーブルを作成してセルにテキストを出力する作業をより便利にするために、若干の改良を加えます。
このアイデアを実装するために、上記記事に添付されている最適化フレームワークを扱うコードを基に、自分自身のクラスを作成し、できるだけ概念を維持するようにします。記事ではフレームの操作や、フレームモードで動作するEAのプロセスについては説明されていませんので、ここでそのシステムを理解するように試みます。
動作の仕組み
MQL5チュートリアルに目を通し、ストラテジーテスターおよびその最適化機能の動作について確認してみましょう。
...テスターの特に重要な機能のひとつはマルチスレッド最適化です。これはローカルおよび分散(ネットワーク上)エージェントプログラムを使用して実行でき、MQL5クラウドネットワークでも可能です。ユーザーが手動で開始する単一のテスト実行(特定のEA入力パラメータを用いた場合)や、最適化によって引き起こされる複数のテスト実行(パラメータ値を設定範囲内で反復する場合)は、それぞれ別のエージェントプログラム上で実行されます。技術的には、これはmetatester64.exeファイルであり、テストや最適化の間、Windowsタスクマネージャー上でそのプロセスのコピーが確認できます。このため、テスターはマルチスレッドで動作します。
ターミナルは実行マネージャーとして機能し、タスクをローカルおよびリモートエージェントに分配します。必要に応じてローカルエージェントを自動的に起動します。最適化中は、デフォルトで複数のエージェントが起動され、その数はプロセッサコアの数に対応します。指定されたパラメータでのEAテストタスクを完了すると、エージェントは結果をターミナルに返します。
各エージェントは独自の取引環境およびソフトウェア環境を生成します。すべてのエージェントは互いに、またクライアントターミナルからも隔離されています。
この説明から明らかなことは、テスト対象のEAの各インスタンスはそれぞれ独自のテストエージェント上で起動され、各パスの最終データはエージェントからターミナルに送信されるということです。
ターミナルとエージェント間のデータ交換には、以下のハンドラが用意されています。
- OnTesterInit():TesterInitイベントが発生したときにEA内で呼び出され、最適化開始前に必要な処理をおこないます。
- OnTester():Testerイベントが発生したときにEA内で呼び出され、テスト完了時に必要な処理をおこないます。
- OnTesterPass():TesterPassイベントが発生したときにEA内で呼び出され、最適化中の新しいデータフレームを処理します。
- OnTesterDeinit():TesterDeinitイベントが発生したときにEA内で呼び出され、最適化完了後に必要な処理をおこないます。
EAがOnTesterInit()、OnTesterDeinit()(この2つは常にペアで機能し、片方だけは使用できません)、またはOnTesterPass()のいずれかを持つ場合、EAは特別なフレームモードで、独立したターミナルウィンドウで起動されます。
最適化プロセスを管理し、エージェントからターミナルへ任意のアプリケーション結果を転送するために、MQL5ではOnTesterInit、OnTesterDeinit、OnTesterPassの3つの特別イベントがあります。これらのハンドラをコードに実装することで、開発者は最適化開始前、完了後、および各最適化パス完了時に必要な処理を実行できます。
すべてのハンドラは任意です。最適化はこれらなしでも実行可能です。また、これら3つのイベントは最適化中のみ機能し、単一テストでは動作しないことに注意してください。
これらのハンドラを持つEAは、テスターで指定された銘柄および時間足のターミナル上の別チャートに自動的にロードされます。このEAのコピーは取引はおこなわず、サービス処理のみを実行します。他のイベントハンドラ(OnInit、OnDeinit、OnTickなど)はここでは動作しません。
最適化中、ターミナル上ではEAのインスタンスは1つだけ動作し、必要に応じて受信フレームを処理します。ただし、このEAインスタンスは前述の3つのイベントハンドラのいずれかがコードに存在する場合のみ起動されます。
最適化の各個別パス完了後、OnTester()イベントがエージェント上で動作するEAインスタンスで発生します。このイベントハンドラから、完了したパスのデータを特別なフレームモードで動作する別チャート上のEAに送信できます。チャート上のEAに送信されるパス情報のデータパケットはフレームと呼ばれ、パス番号、パス開始時のEA入力変数の値、パス結果を含みます。
これらのデータはEAに送信され、TesterPassイベントが生成されます。このイベントはOnTesterPass()ハンドラで処理され、そこでパスデータを読み取り、必要な処理を実行できます。たとえば、このパスのバランス曲線を描画したり、その他のサービス処理をおこなったりすることが可能です。
エージェントからターミナル上のチャートで動作するEAにパスのデータを送信する場合は、FrameAdd()関数を使用します。現在のフレーム(完了したパス)はこの関数を通じてエージェントからEAに送信され、すでにターミナル上のEAのOnTesterPass()ハンドラで処理されます。
ご覧の通り、一部の関数はエージェント上のEAインスタンスで動作し、他の関数はフレームモードで動作するターミナル上のEAで処理されます。しかし、これらすべての処理は、当然ながらEAのコード内で記述されている必要があります。
結果として、EAの動作の流れと、エージェントとターミナル間でデータを転送する際の処理手順は以下の通りです。
- OnTesterInitハンドラ(ターミナル上のチャートで動作するEAのインスタンス)では、すべてのグラフィック構造を準備する必要があります。具体的には、EAがフレームモードで動作する専用のチャートを用意し、そのチャート上にはバランス曲線、パラメータや結果を表示するテーブル、タブコントロールオブジェクト、さらにタブ上で操作を選択するためのボタンなどを配置します。
- OnTesterハンドラ(エージェント上で動作するEAのインスタンス)では、完了したパスに関するすべての情報を収集する必要があります。具体的には、各決済取引のバランス結果を配列に記録し、このパスで取得したその他の結果も配列に書き込みます。そして、収集したすべてのデータをFrameAdd()を使用して、ターミナル上のEAに送信します。
- OnTesterPassハンドラ(ターミナル上のチャートで動作するEAのインスタンス)では、エージェントからFrameAdd()を使って送信された次のフレームを受信し、そのデータを読み取ります。そのデータをもとにチャート上にバランスグラフを描画し、さらにフレームオブジェクトを作成して配列に保存します。この配列は、後で最適化基準に従った並べ替えや選択をおこなうために使用されます。
- OnTesterDeinitおよびOnChartEventハンドラ(ターミナル上のチャートで動作するEAのインスタンス)は、最適化完了後に最適化データを処理します。具体的には、最適化プロセスの再生成をおこなったり、特定の最適化基準に基づいて最良の結果を表示したりする処理を実行したりします。
タスク用のクラスを作成する
タブコントロールを作成するために、コントロール一式をまとめたファイルControls.mqhが作成されました。このファイルは記事の最後に添付してあり、テスト用EAを作成するフォルダに直接配置する必要があります。たとえば、ターミナルディレクトリ内の\MQL5\Experts\FrameViewer\Controls.mqhに配置します。
ここでは各コントロールのクラスを個別に詳しく説明することはしませんが、簡単な概要を提供します。
合計で、8つの独立したコントロール用に10個のクラスが実装されています。
| # | クラス | 親クラス | 説明 | 役割 |
|---|---|---|---|---|
| 1 | CBaseCanvas | CObject | 描画の基底クラス | ベースキャンバスです。サイズや位置の設定や変更、非表示や表示をおこなうメソッドを含みます。 |
| 2 | CPanel | CBaseCanvas | パネルクラス | 色の設定と変更やマウスイベントハンドラのメソッドを持ち、子コントロールをアタッチできます。 |
| 3 | CLabel | CPanel | テキストラベルクラス | キャンバス上の指定座標にテキストを描画します。 |
| 4 | CButton | CLabel | シンプルボタンクラス | 状態固定のない通常のボタンです。ホバーやクリックで色を変化させます。 |
| 5 | CButtonTriggered | CButton | 2状態ボタンクラス | On/Offの2つの状態を持つボタンです。ホバー、クリック、状態変化に応じて色を変化させます。 |
| 6 | CTabButton | CButtonTriggered | タブボタンクラス | 2状態ボタンで、タブ領域との接合部には境界線がありません。 |
| 7 | CButtonSwitch | CPanel | トグルボタンクラス | 2状態以上のボタンを持つパネルで、On状態のボタンは1つのみです。既存のボタンに新しいボタンを追加できます。 |
| 8 | CTabWorkArea | CObject | タブの作業領域クラス | 背景と前景の2つの基底描画クラスを持つオブジェクトです。 |
| 9 | CTab | CPanel | タブオブジェクトクラス | ボタンとフィールドを持つパネルです。作業領域はタブフィールド上にあり、ここで描画をおこないます。 |
| 10 | CTabControl | CPanel | タブコントロールオブジェクトクラス | タブオブジェクトを追加および管理できるパネルです。 |
コントロールオブジェクトが正常に作成された後は、各オブジェクトに対してCreate()メソッドを呼び出し、座標とサイズを指定する必要があります。これをおこなうことで、要素は使用可能な状態になります。
イベントハンドラを実装したコントロール要素は、ユーザー操作イベントをプログラム側のチャートへ送信します。このイベントを利用することで、オブジェクト内でユーザーがどの操作をおこなったかを判定することが可能です。
| # | クラス | イベント | ID | lparam | dparam | sparam |
|---|---|---|---|---|---|---|
| 1 | CButton | オブジェクトのクリック | (ushort)CHARTEVENT_CLICK | カーソルのX座標 | カーソルのY座標 | ボタンオブジェクト名 |
| 2 | CButtonTriggered | オブジェクトのクリック | (ushort)CHARTEVENT_CLICK | カーソルのX座標 | カーソルのY座標 | ボタンオブジェクト名 |
| 3 | CTabButton | オブジェクトのクリック | (ushort)CHARTEVENT_CLICK | カーソルのX座標 | カーソルのY座標 | ボタンオブジェクト名 |
| 4 | CButtonSwitch | オブジェクトボタンのクリック | (ushort)CHARTEVENT_CLICK | ボタンID | 0 | 切り替えオブジェクト名 |
表からわかる通り、コードを簡略化するため、タブコントロールからプログラム側のチャートへの参照は持たせていません。プログラム側でタブ切り替えに反応する必要がある場合は、TabButtonのクリックイベントを判定することで対応できます。ボタン名からタブ番号を特定したり、TabControlオブジェクトから選択されているタブのインデックスを取得したりすることが可能です。
いずれにしても、将来的には、プログラムで便利に使える各種コントロールを作成する際に、これらのクラスを詳細に分析します。
次に、記事で提示されたテーブルクラスを少し改良する必要があります。記事からダウンロードできるDashboard.mqhファイルから、テーブルクラスのコード(12行目〜285行目)だけをコピーし、\MQL5\Experts\FrameViewer\フォルダ内のTable.mqhとして保存します。
このクラスを追加することで、テーブルや表形式データの操作が容易になります。
さらに、CObjectクラスおよびその派生クラスのインスタンスへのポインタを管理する動的配列クラスであるCArrayObjのファイルと、カスタム描画を簡単に作成するためのCCanvasクラスのファイルも、このファイルに接続します。
//+------------------------------------------------------------------+
//|                                                        Table.mqh |
//|                                  Copyright 2025, MetaQuotes Ltd. |
//|                                             https://www.mql5.com |
//+------------------------------------------------------------------+
#property copyright "Copyright 2025, MetaQuotes Ltd."
#property link      "https://www.mql5.com"

#include <Arrays\ArrayObj.mqh>
#include <Canvas\Canvas.mqh>
テーブルセルクラスのprivateセクションに、セル内のテキストの幅、高さ、色を格納するための新しい変数を追加します。
//+------------------------------------------------------------------+
//| Table cell class                                                 |
//+------------------------------------------------------------------+
class CTableCell : public CObject
  {
private:
   int               m_row;                     // Row
   int               m_col;                     // Column
   int               m_x;                       // X coordinate
   int               m_y;                       // Y coordinate
   int               m_w;                       // Width
   int               m_h;                       // Height
   string            m_text;                    // Text in the cell
   color             m_fore_color;              // Text color in the cell
public:
publicセクションで、新しいプロパティの読み取りと設定をおこなうメソッドと、セルに書き込まれたテキストを指定されたキャンバスオブジェクトに出力するメソッドを追加します。
public:
//--- Methods for setting values
   void              SetRow(const uint row)     { this.m_row=(int)row;  }
   void              SetColumn(const uint col)  { this.m_col=(int)col;  }
   void              SetX(const uint x)         { this.m_x=(int)x;      }
   void              SetY(const uint y)         { this.m_y=(int)y;      }
   void              SetXY(const uint x,const uint y)
                       {
                        this.m_x=(int)x;
                        this.m_y=(int)y;
                       }
   void              SetWidth(const uint w)     { this.m_w=(int)w;      }
   void              SetHeight(const uint h)    { this.m_h=(int)h;      }
   void              SetSize(const uint w,const uint h)
                       {
                        this.m_w=(int)w;
                        this.m_h=(int)h;
                       }
   void              SetText(const string text) { this.m_text=text;     }

//--- Methods for getting values
   int               Row(void)            const { return this.m_row;    }
   int               Column(void)         const { return this.m_col;    }
   int               X(void)              const { return this.m_x;      }
   int               Y(void)              const { return this.m_y;      }
   int               Width(void)          const { return this.m_w;      }
   int               Height(void)         const { return this.m_h;      }
   string            Text(void)           const { return this.m_text;   }

//--- Prints the text written in cell properties to the canvas, the pointer to which is passed to the method
   void              TextOut(CCanvas *canvas, const int x_shift, const int y_shift, const color bg_color=clrNONE, const uint flags=0, const uint alignment=0)
                       {
                        if(canvas==NULL)
                           return;
                        //--- Remember current font flags
                        uint flags_prev=canvas.FontFlagsGet();
                        //--- Set background color
                        uint clr=(bg_color==clrNONE ? 0x00FFFFFF : ::ColorToARGB(bg_color));
                        //--- Fill in the cell with the set background color (erase the previous label)
                        canvas.FillRectangle(this.m_x+1, this.m_y+1, this.m_x+this.m_w-1, this.m_y+this.m_h-1, clr);
                        //--- Set font flags
                        canvas.FontFlagsSet(flags);
                        //--- Print text in the cell
                        canvas.TextOut(this.m_x+x_shift, this.m_y+y_shift, this.m_text, ::ColorToARGB(this.m_fore_color), alignment);
                        //--- Return previously memorized font flags and update canvas
                        canvas.FontFlagsSet(flags_prev);
                        canvas.Update(false);
                       }

//--- A virtual method for comparing two objects
クラスの最後に、新しいテーブルコントロールクラスを実装します。
//+------------------------------------------------------------------+
//| Table control class                                              |
//+------------------------------------------------------------------+
class CTableDataControl : public CTableData
  {
protected:
   uchar             m_alpha;
   color             m_fore_color;

//--- Converts RGB to color
   color             RGBToColor(const double r,const double g,const double b) const;
//--- Writes RGB component values to variables
   void              ColorToRGB(const color clr,double &r,double &g,double &b);
//--- Returns color component (1) Red, (2) Green, (3) Blue
   double            GetR(const color clr)      { return clr&0xff ;                    }
   double            GetG(const color clr)      { return(clr>>8)&0xff;                 }
   double            GetB(const color clr)      { return(clr>>16)&0xff;                }

//--- Returns a new color
   color             NewColor(color base_color, int shift_red, int shift_green, int shift_blue);

public:
//--- Returns a pointer to itself
   CTableDataControl*Get(void)                                 { return &this;         }

//--- (1) Sets, (2) returns transparency
   void              SetAlpha(const uchar alpha)               { this.m_alpha=alpha;   }
   uchar             Alpha(void)                         const { return this.m_alpha;  }

//--- Draws (1) a background grid, (2) with automatic cell size
   void              DrawGrid(CCanvas *canvas,const int x,const int y,const uint header_h,const uint rows,const uint columns,const uint row_size,const uint col_size,
                              const color line_color=clrNONE,bool alternating_color=true);
   void              DrawGridAutoFill(CCanvas *canvas,const uint border,const uint header_h,const uint rows,const uint columns,const color line_color=clrNONE,bool alternating_color=true);

//--- Prints (1) a text message, (2) a filled rectangle at the specified coordinates
   void              DrawText(CCanvas *canvas,const string text,const int x,const int y,const color clr=clrNONE,const uint align=0,const int width=WRONG_VALUE,const int height=WRONG_VALUE);
   void              DrawRectangleFill(CCanvas *canvas,const int x,const int y,const int width,const int height,const color clr,const uchar alpha);


//--- Constructors/Destructor
                     CTableDataControl (const uint id) : CTableData(id), m_fore_color(clrDimGray), m_alpha(255) {}
                     CTableDataControl (void) : m_alpha(255) {}
                    ~CTableDataControl (void) {}
  };
//+------------------------------------------------------------------+
//| Draws background grid                                            |
//+------------------------------------------------------------------+
void CTableDataControl::DrawGrid(CCanvas *canvas,const int x,const int y,const uint header_h,const uint rows,const uint columns,const uint row_size,const uint col_size,
                                 const color line_color=clrNONE,bool alternating_color=true)
  {
//--- Clear all lists of the tabular data object (delete cells from rows and all rows)
   this.Clear();
//--- Row height cannot be less than 2
   int row_h=int(row_size<2 ? 2 : row_size);
//--- Row width cannot be less than 2
   int col_w=int(col_size<2 ? 2 : col_size);

//--- Left coordinate (X1) of the table
   int x1=x;
//--- Calculate X2 coordinate (on the right) depending on the number of columns and their width
   int x2=x1+col_w*int(columns>0 ? columns : 1);
//--- Y1 coordinate is located under the panel header area
   int y1=(int)header_h+y;

//--- Calculate Y2 coordinate (from below) depending on the number of rows and their height
   int y2=y1+row_h*int(rows>0 ? rows : 1);
//--- Set coordinates of the table
   this.SetCoords(x1,y1-header_h,x2,y2-header_h);

//--- Get color of grid lines of table, either by default or passed to method
   color clr=(line_color==clrNONE ? C'200,200,200' : line_color);
//--- Draw table border
   canvas.Rectangle(x1,y1,x2,y2,::ColorToARGB(clr,this.m_alpha));
//--- In a loop by table rows
   for(int i=0;i<(int)rows;i++)
     {
      //--- calculate Y coordinate of next horizontal grid line (Y coordinate of next row of table)
      int row_y=y1+row_h*i;
      //--- if the flag of "alternating" row colors is passed and the row is even
      if(alternating_color && i%2==0)
        {
         //--- lighten background color of table and draw a background rectangle
         color new_color=this.NewColor(clr,45,45,45);
         canvas.FillRectangle(x1+1,row_y+1,x2-1,row_y+row_h-1,::ColorToARGB(new_color,this.m_alpha));
        }
      //--- Draw horizontal grid line of table
      canvas.Line(x1,row_y,x2,row_y,::ColorToARGB(clr,this.m_alpha));

      //--- Create new table row object
      CTableRow *row_obj=new CTableRow(i);
      if(row_obj==NULL)
        {
         ::PrintFormat("%s: Failed to create table row object at index %lu",(string)__FUNCTION__,i);
         continue;
        }
      //--- Add it to list of rows of tabular data object
      //--- (if failed to add object, delete created object)
      if(!this.AddRow(row_obj))
         delete row_obj;
      //--- Set Y coordinate in created row object, given offset from panel header
      row_obj.SetY(row_y-header_h);
     }

//--- In loop by table columns
   for(int i=0;i<(int)columns;i++)
     {
      //--- calculate X coordinate of next vertical grid line (X coordinate of next table column)
      int col_x=x1+col_w*i;
      //--- If grid line has gone beyond panel, break cycle
      if(x1==1 && col_x>=x1+canvas.Width()-2)
         break;
      //--- Draw vertical grid line of table
      canvas.Line(col_x,y1,col_x,y2,::ColorToARGB(clr,this.m_alpha));

      //--- Get the number of created rows from tabular data object
      int total=this.RowsTotal();
      //--- In loop through table rows
      for(int j=0;j<total;j++)
        {
         //--- get next row
         CTableRow *row=this.GetRow(j);
         if(row==NULL)
            continue;
         //--- Create new table cell
         CTableCell *cell=new CTableCell(row.Row(),i);
         if(cell==NULL)
           {
            ::PrintFormat("%s: Failed to create table cell object at index %lu",(string)__FUNCTION__,i);
            continue;
           }
         //--- Add created cell to row
         //--- (if failed to add object, delete created object)
         if(!row.AddCell(cell))
           {
            delete cell;
            continue;
           }
         //--- In created cell object, set its X coordinate and Y coordinate from row object.
         cell.SetXY(col_x,row.Y());
         cell.SetSize(col_w, row_h);
        }
     }
//--- Update canvas without redrawing chart
   canvas.Update(false);
  }
//+------------------------------------------------------------------+
//| Draws background grid with automatic cell size                   |
//+------------------------------------------------------------------+
void CTableDataControl::DrawGridAutoFill(CCanvas *canvas,const uint border,const uint header_h,const uint rows,const uint columns,const color line_color=clrNONE,bool alternating_color=true)
  {
//--- X1 coordinate (left) of table
   int x1=(int)border;
//--- X2 coordinate (right) of table
   int x2=canvas.Width()-(int)border-1;
//--- Y1 coordinate (top) of table
   int y1=int(header_h+border-1);
//--- Y2 coordinate (lower) of table
   int y2=canvas.Height()-(int)border-1;
//--- Set coordinates of table
   this.SetCoords(x1,y1,x2,y2);

//--- Get color of grid lines of table, either by default or passed to method
   color clr=(line_color==clrNONE ? C'200,200,200' : line_color);
//--- If indentation from edge of panel is greater than zero, draw border of table
//--- otherwise, panel border acts as table border
   if(border>0)
      canvas.Rectangle(x1,y1,x2,y2,::ColorToARGB(clr,this.m_alpha));

//--- Height of entire table grid
   int greed_h=y2-y1;
//--- Calculate row height depending on table height and number of rows
   int row_h=(int)::round((double)greed_h/(double)rows);
//--- In loop through number of rows
   for(int i=0;i<(int)rows;i++)
     {
      //--- calculate Y coordinate of next horizontal grid line (Y coordinate of next row of table)
      int row_y=y1+row_h*i;
      //--- if the flag of "alternating" row colors is passed and the row is even
      if(alternating_color && i%2==0)
        {
         //--- lighten background color of table and draw a background rectangle
         color new_color=this.NewColor(clr,45,45,45);
         canvas.FillRectangle(x1+1,row_y+1,x2-1,row_y+row_h-1,::ColorToARGB(new_color,this.m_alpha));
        }
      //--- Draw horizontal grid line of table
      canvas.Line(x1,row_y,x2,row_y,::ColorToARGB(clr,this.m_alpha));

      //--- Create new table row object
      CTableRow *row_obj=new CTableRow(i);
      if(row_obj==NULL)
        {
         ::PrintFormat("%s: Failed to create table row object at index %lu",(string)__FUNCTION__,i);
         continue;
        }
      //--- Add it to list of rows of tabular data object
      //--- (if failed to add object, delete created object)
      if(!this.AddRow(row_obj))
         delete row_obj;
      //--- Set Y coordinate in created row object, given offset from panel header
      row_obj.SetY(row_y-header_h);
     }

//--- Width of table grid
   int greed_w=x2-x1;
//--- Calculate column width depending on table width and number of columns
   int col_w=(int)::round((double)greed_w/(double)columns);
//--- In loop by table columns
   for(int i=0;i<(int)columns;i++)
     {
      //--- calculate X coordinate of next vertical grid line (X coordinate of next table column)
      int col_x=x1+col_w*i;
      //--- If this is not the very first vertical line, draw it
      //--- (the first vertical line is either table border or panel border)
      if(i>0)
         canvas.Line(col_x,y1,col_x,y2,::ColorToARGB(clr,this.m_alpha));

      //--- Get the number of created rows from tabular data object
      int total=this.RowsTotal();
      //--- In loop through table rows
      for(int j=0;j<total;j++)
        {
         //--- get next row
         CTableRow *row=this.GetRow(j);
         if(row==NULL)
            continue;
         //--- Create new table cell
         CTableCell *cell=new CTableCell(row.Row(),i);
         if(cell==NULL)
           {
            ::PrintFormat("%s: Failed to create table cell object at index %lu",(string)__FUNCTION__,i);
            continue;
           }
         //--- Add created cell to row
         //--- (if failed to add object, delete created object)
         if(!row.AddCell(cell))
           {
            delete cell;
            continue;
           }
         //--- In created cell object, set its X coordinate and Y coordinate from row object.
         cell.SetXY(col_x,row.Y());
         cell.SetSize(col_w, row_h);
        }
     }
//--- Update canvas without redrawing chart
   canvas.Update(false);
  }
//+------------------------------------------------------------------+
//| Returns color with new color component                           |
//+------------------------------------------------------------------+
color CTableDataControl::NewColor(color base_color, int shift_red, int shift_green, int shift_blue)
  {
   double clR=0, clG=0, clB=0;
   this.ColorToRGB(base_color,clR,clG,clB);
   double clRn=(clR+shift_red  < 0 ? 0 : clR+shift_red  > 255 ? 255 : clR+shift_red);
   double clGn=(clG+shift_green< 0 ? 0 : clG+shift_green> 255 ? 255 : clG+shift_green);
   double clBn=(clB+shift_blue < 0 ? 0 : clB+shift_blue > 255 ? 255 : clB+shift_blue);
   return this.RGBToColor(clRn,clGn,clBn);
  }
//+------------------------------------------------------------------+
//| Converts RGB to color                                            |
//+------------------------------------------------------------------+
color CTableDataControl::RGBToColor(const double r,const double g,const double b) const
  {
   int int_r=(int)::round(r);
   int int_g=(int)::round(g);
   int int_b=(int)::round(b);
   int clr=0;
   clr=int_b;
   clr<<=8;
   clr|=int_g;
   clr<<=8;
   clr|=int_r;
//---
   return (color)clr;
  }
//+------------------------------------------------------------------+
//| Retrieving RGB component values                                  |
//+------------------------------------------------------------------+
void CTableDataControl::ColorToRGB(const color clr,double &r,double &g,double &b)
  {
   r=GetR(clr);
   g=GetG(clr);
   b=GetB(clr);
  }
//+------------------------------------------------------------------+
//| Prints text message to specified coordinates                     |
//+------------------------------------------------------------------+
void CTableDataControl::DrawText(CCanvas *canvas,const string text,const int x,const int y,const color clr=clrNONE,const uint align=0,const int width=WRONG_VALUE,const int height=WRONG_VALUE)
  {
//--- Declare variables to record width and height of text in them
   int w=width;
   int h=height;
//--- If width and height of text passed to method have zero values,
//--- entire canvas space is completely erased with transparent color
   if(width==0 && height==0)
      canvas.Erase(0x00FFFFFF);
//--- Otherwise
   else
     {
      //--- If passed width and height have default values (-1), get its width and height from text
      if(width==WRONG_VALUE && height==WRONG_VALUE)
         canvas.TextSize(text,w,h);
      //--- otherwise,
      else
        {
         //--- if width passed to method has default value (-1), get width from text, or
         //--- if width passed to method has value greater than zero, use width passed to method, or
         //--- if width passed to method has zero value, use value 1 for width
         w=(width ==WRONG_VALUE ? canvas.TextWidth(text)  : width>0  ? width  : 1);
         //--- if height passed to method has default value (-1), get height from text, or
         //--- if height passed to method has value greater than zero, use height passed to method, or
         //--- if height passed to method has zero value, use value 1 for height
         h=(height==WRONG_VALUE ? canvas.TextHeight(text) : height>0 ? height : 1);
        }
      //--- Fill space according to specified coordinates and by resulting width and height with transparent color (erase previous entry)
      canvas.FillRectangle(x,y,x+w,y+h,0x00FFFFFF);
     }
//--- Print text in place cleared of previous text and update workspace without redrawing screen
   canvas.TextOut(x,y,text,::ColorToARGB(clr==clrNONE ? this.m_fore_color : clr),align);
   canvas.Update(false);
  }
//+------------------------------------------------------------------+
//| Prints filled rectangle to specified coordinates                 |
//+------------------------------------------------------------------+
void CTableDataControl::DrawRectangleFill(CCanvas *canvas,const int x,const int y,const int width,const int height,const color clr,const uchar alpha)
  {
   canvas.FillRectangle(x,y,x+width,y+height,::ColorToARGB(clr,alpha));
   canvas.Update();
  }
//+------------------------------------------------------------------+
このクラスには、「指標やEAのデータを表示するダッシュボードの作成」記事の情報パネルの説明セクションで原理が述べられていたメソッドが含まれています。前述の記事では、これらのメソッドはパネルオブジェクトに属していましたが、ここではテーブルクラスを継承した別クラスとして配置されています。
ここで扱うすべての表形式データオブジェクトはCTableDataControlクラス型になります。このクラスはテーブルコントロールオブジェクトであり、テーブルを素早く操作できる機能を提供します。
では、かつての記事でEAにダウンロードして接続するよう指示されていたものを確認してみましょう。
そして最後の「パフォーマンスのハイライト」は最適化結果の処理です。以前は、トレーダーは結果を処理するためにデータを準備し、どこかにアップロードして別の場所で処理する必要がありました。しかし、現在は「レジを離れることなく」、すなわち最適化中に直接処理をおこなうことが可能になっています。この機能を示すために、最も簡単な処理例が実装されているいくつかのインクルードファイルが必要です。
記事に添付されている.mqh拡張子のファイルをすべてMQL5\Includeフォルダにアップロードします。その後、任意のEAを開き、最後に以下のブロックを挿入します。
//--- connect code to work with optimization results
#include <FrameGenerator.mqh>
//--- frame generator
CFrameGenerator fg;
//+------------------------------------------------------------------+
//| Tester function                                                  |
//+------------------------------------------------------------------+
double OnTester()
  {
//--- here insert your own function to calculate optimization criterion
   double TesterCritetia=MathAbs(TesterStatistics(STAT_SHARPE_RATIO)*TesterStatistics(STAT_PROFIT));
   TesterCritetia=TesterStatistics(STAT_PROFIT)>0?TesterCritetia:(-TesterCritetia);
//--- call at each end of testing and pass optimization criterion as parameter
   fg.OnTester(TesterCritetia);
//---
   return(TesterCritetia);
  }
//+------------------------------------------------------------------+
//| TesterInit function                                              |
//+------------------------------------------------------------------+
void OnTesterInit()
  {
//--- prepare chart for displaying balance charts
   fg.OnTesterInit(3); //parameter sets number of balance lines on chart
  }
//+------------------------------------------------------------------+
//| TesterPass function                                              |
//+------------------------------------------------------------------+
void OnTesterPass()
  {
//--- handle test results and display graphics
   fg.OnTesterPass();
  }
//+------------------------------------------------------------------+
//| TesterDeinit function                                            |
//+------------------------------------------------------------------+
void OnTesterDeinit()
  {
//--- completing optimization
   fg.OnTesterDeinit();
  }
//+------------------------------------------------------------------+
//|  Event handling on chart                                         |
//+------------------------------------------------------------------+
void OnChartEvent(const int id,const long &lparam,const double &dparam,const string &sparam)
  {
   //--- starts playback of frames upon completion of optimization when clicking on header
   fg.OnChartEvent(id,lparam,dparam,sparam,100); // 100 - this is pause in ms between frames
  }
//+------------------------------------------------------------------+
例として、標準付属のEA Moving Averages.mq5を使用しました。コードを挿入し、EAをMoving Averages With Frames.mq5という名前で保存します。その後、コンパイルして最適化を実行します。
記事の最後に添付されているファイルを見ると、*.mqh拡張子のファイルが4つあります。これらをアップロードして内容を確認します。
- specialchart.mqh (7.61 KB):特別なチャート用のクラスです。このチャートには、各テスターのパスごとのバランス曲線や、完了した最適化プロセスを再現した際のバランス曲線が描画されます。
- colorprogressbar.mqh (4.86 KB):最適化の進行状況を表示するプログレスバーのクラスです。最適化中、色付きの列が塗りつぶされていきます。緑は利益の出た系列、赤は損失の出た系列を示し、特別なチャートの下部に表示されます。
- simpletable.mqh (10.74 KB):各最適化パスのデータを表示するシンプルなテーブルのクラスです。各パスの結果や、EAがそのパスで使用した設定パラメータの値を表示します。特別なチャートの左側に2つのテーブルが配置されます。
- framegenerator.mqh (14.88 KB):テストエージェントとターミナル間でデータを交換し、特別なチャート上に情報を表示するためのクラスです。視覚的最適化を実装するための主要なクラスとなります。
これらの知識をもとに、(1)プログレスバーのクラス、(2)特別なチャートのクラス、(3)フレームビューアのクラスを作成することを決めました。(4)テーブルクラスはすでに将来のEA用フォルダにアップロードされ、若干改良されています。
さらに小さなクラスとして、(5)フレームクラスを実装する必要があります。このクラスの目的は、4つの最適化基準(シャープレシオ、純利益、勝率、リカバリーファクター)それぞれに対して、上位3つのパスのチャートを選択して表示することです。この作業を効率的におこなうためには、標準ライブラリのCObjectクラスおよびその派生クラスのインスタンスへのポインタを格納する動的配列クラスに基づいたオブジェクトリストを使用するのが便利です。リストを目的の基準でソートすれば、リスト内のすべてのオブジェクトが選択された基準値のプロパティに従って並び、最大値のオブジェクトはリストの最後に配置されます。その後、前回見つけたオブジェクトよりプロパティ値の小さい2つのオブジェクトを探せばよく、この検索のためのメソッドはすでに該当クラスに実装されています。
プログレスバークラス、特別チャートクラス、フレームビューアクラスは、記事からダウンロードしたコードを基に作成します。記事の実装方法を確認し、それを基礎として自分たちのクラスを実装し、不要な部分を削除したり必要な機能を追加したりします。完成したコードは、希望に応じて以前の記事から取得した古いコードと比較することも可能です。古いファイルのアーカイブも記事の最後に添付されています。
すべてのクラスは1つのファイルにまとめて記述します。まだ作成していなければ、\MQL5\Experts\FrameViewer\FrameViewer.mqhを作成し、そこにコードを書き込み始めます。
作成したファイルには、必要なクラスやライブラリのファイルをインクルードし、いくつかのマクロ置換も定義します。
//+------------------------------------------------------------------+
//|                                                  FrameViewer.mqh |
//|                                  Copyright 2025, MetaQuotes Ltd. |
//|                                             https://www.mql5.com |
//+------------------------------------------------------------------+
#property copyright "Copyright 2025, MetaQuotes Ltd."
#property link      "https://www.mql5.com"

#include "Controls.mqh"                               // Classes of controls
#include "Table.mqh"                                  // Table class
#include <Arrays\ArrayDouble.mqh>                     // Array of physical data

#define  CELL_W               128                     // Width of table cells
#define  CELL_H               19                      // Height of table cell
#define  BUTT_RES_W           CELL_W+30               // Width of optimization result selection button
#define  DATA_COUNT           8                       // Amount of data
#define  FRAME_ID             1                       // Frame ID
#define  TABLE_OPT_STAT_ID    1                       // ID of statistics table on optimization tab
#define  TABLE_OPT_STAT_ID    2                       // ID of statistics table on optimization tab
描画に使用されるほとんどすべてのグラフィックオブジェクトは、複数のCCanvasオブジェクトを持っています。そのうちの1つは基盤として機能し、その上にさらに2つのキャンバスが重ねられます。最初のキャンバスには背景画像が描かれ、2つ目のキャンバスには背景の上に描画すべき内容が表示されます。描画用のメソッドを持つオブジェクトの場合、描画対象のキャンバスオブジェクトへのポインタがメソッドに渡され、そのキャンバス上に描画がおこなわれます。
クラスコードが非常に多く、各クラスやメソッドには完全なコメントが付いているため、ここではすべてを詳細かつ段階的に説明することはしません。代わりに、クラスやメソッドのコードを確認し、この記事では簡単な概要を示します。
以下がプログレスバークラスです。
//+------------------------------------------------------------------+
//|  Progress bar class that draws in two colors                     |
//+------------------------------------------------------------------+
class CColorProgressBar :public CObject
  {
private:
   CCanvas          *m_background;                    // Pointer to CCanvas class object for drawing on background
   CCanvas          *m_foreground;                    // Pointer to CCanvas class object for drawing on foreground
   CRect             m_bound;                         // Coordinates and dimensions of workspace
   color             m_good_color, m_bad_color;       // Colors of profitable and loss series
   color             m_back_color, m_fore_color;      // Background and frame colors
   bool              m_passes[];                      // Number of processed passes
   int               m_last_index;                    // Last pass index
public:
//--- Constructor/destructor
                     CColorProgressBar(void);
                    ~CColorProgressBar(void){};

//--- Sets pointer to canvas
   void              SetCanvas(CCanvas *background, CCanvas *foreground)
                       {
                        if(background==NULL)
                          {
                           ::Print(__FUNCTION__, ": Error. Background is NULL");
                           return;
                          }
                        if(foreground==NULL)
                          {
                           ::Print(__FUNCTION__, ": Error. Foreground is NULL");
                           return;
                          }

                        this.m_background=background;
                        this.m_foreground=foreground;
                       }
//--- Sets coordinates and dimensions of workspace on canvas
   void              SetBound(const int x1, const int y1, const int x2, const int y2)
                       {
                        this.m_bound.SetBound(x1, y1, x2, y2);
                       }
//--- Return of coordinates of bounds of rectangular area
   int               X1(void)                      const { return this.m_bound.left;   }
   int               Y1(void)                      const { return this.m_bound.top;    }
   int               X2(void)                      const { return this.m_bound.right;  }
   int               Y2(void)                      const { return this.m_bound.bottom; }

//--- Setting background color and frame
   void              SetBackColor(const color clr)       { this.m_back_color=clr;      }
   void              SetForeColor(const color clr)       { this.m_fore_color=clr;      }
//--- Returning background color and frame
   color             BackColor(void)               const { return this.m_back_color;   }
   color             ForeColor(void)               const { return this.m_fore_color;   }
//--- Resets counter to zero
   void              Reset(void)                         { this.m_last_index=0;        }
//--- Adds result for drawing strip in progress bar
   void              AddResult(bool good, const bool chart_redraw);
//--- Updates progress bar on chart
   void              Update(const bool chart_redraw);
  };
//+------------------------------------------------------------------+
//| Constructor                                                      |
//+------------------------------------------------------------------+
CColorProgressBar::CColorProgressBar() : m_last_index(0), m_good_color(clrSeaGreen), m_bad_color(clrLightPink)
  {
//--- Set size of pass array with reserve
   ::ArrayResize(this.m_passes, 5000, 1000);
   ::ArrayInitialize(this.m_passes, 0);
  }
//+------------------------------------------------------------------+
//| Adding result                                                    |
//+------------------------------------------------------------------+
void CColorProgressBar::AddResult(bool good, const bool chart_redraw)
  {
   this.m_passes[this.m_last_index]=good;
//--- Add another vertical line of desired color to progress bar
   this.m_foreground.LineVertical(this.X1()+1+this.m_last_index, this.Y1()+1, this.Y2()-1, ::ColorToARGB(good ? this.m_good_color : this.m_bad_color));
//--- Update on chart
   this.m_foreground.Update(chart_redraw);
//--- Updating index
   this.m_last_index++;
   if(this.m_last_index>=this.m_bound.Width()-1)
      this.m_last_index=0;
  }
//+------------------------------------------------------------------+
//| Updating progress bar on chart                                   |
//+------------------------------------------------------------------+
void CColorProgressBar::Update(const bool chart_redraw)
  {
//--- Fill background with background color
   this.m_background.FillRectangle(this.X1(), this.Y1(), this.X2(), this.Y2(), ::ColorToARGB(this.m_back_color));
//--- Draw border
   this.m_background.Rectangle(this.X1(), this.Y1(), this.X2(), this.Y2(), ::ColorToARGB(this.m_fore_color));
//--- Update chart
   this.m_background.Update(chart_redraw);
  }
このクラス自体は、描画用のキャンバスオブジェクトを持っていません。描画対象のキャンバスオブジェクトを指定するために、既存のキャンバスへのポインタを引数として受け取り、クラス内の変数に割り当てるメソッドが用意されています。このクラスのメソッドは、この割り当てられたキャンバス上に描画をおこないます。ここでは2つのオブジェクトがあります。1つはプログレスバーの背景を描画するためのオブジェクト、もう1つは描画済みの背景の上に前景を描くためのオブジェクトです。特別なチャートクラスのCCanvasオブジェクトがキャンバスとして機能し、このプログレスバーの描画対象になります。
以下は、最適化結果の統計チャートやテーブル、EAの設定パラメータを描画するためのクラスです。
//+------------------------------------------------------------------+
//| Class for rendering statistics charts and tables                 |
//| of optimization results and EA’s settings parameters             |
//+------------------------------------------------------------------+
class CStatChart: public CObject
  {
private:
   color             m_back_color;        // Background color
   color             m_fore_color;        // Border color
   int               m_line_width;        // Line width in pixels
   int               m_lines;             // Number of lines on chart
   CArrayDouble      m_seria[];           // Arrays for storing chart values
   bool              m_profitseria[];     // Profitable series or not
   int               m_lastseria_index;   // Index of fresh line on chart
   color             m_profit_color;      // Color of profitable series
   color             m_loss_color;        // Color of loss series
   color             m_selected_color;    // Color of selected best series

protected:
   CCanvas          *m_background;        // Pointer to object of CCanvas class for drawing on background
   CCanvas          *m_foreground;        // Pointer to CCanvas class object for drawing on foreground
   CRect             m_bound_chart;       // Workspace of chart
   CRect             m_bound_head;        // Chart header workspace
   CColorProgressBar m_progress_bar;      // Progress bar
   CButton           m_button_replay;     // Replay button
   CButtonSwitch     m_button_res;        // Button for selecting one of top three results
   int               m_tab_id;            // Tab ID

public:
//--- Constructor/destructor
                     CStatChart() : m_lastseria_index(0), m_profit_color(clrForestGreen), m_loss_color(clrOrangeRed), m_selected_color(clrDodgerBlue), m_tab_id(0) {};
                    ~CStatChart() { this.m_background=NULL; this.m_foreground=NULL; }

//--- Sets pointer to canvas
   void              SetCanvas(CCanvas *background, CCanvas *foreground)
                       {
                        if(background==NULL)
                          {
                           ::Print(__FUNCTION__, ": Error. Background is NULL");
                           return;
                          }
                        if(foreground==NULL)
                          {
                           ::Print(__FUNCTION__, ": Error. Foreground is NULL");
                           return;
                          }
                        this.m_background=background;
                        this.m_foreground=foreground;
                        this.m_progress_bar.SetCanvas(background, foreground);
                       }
//--- Sets coordinates and dimensions of chart workspace and progress bar on canvas
   void              SetChartBounds(const int x1, const int y1, const int x2, const int y2)
                       {
                        this.m_bound_chart.SetBound(x1, y1, x2, y2);
                        this.SetBoundHeader(x1, y1-CELL_H, x2, y1);
                        this.m_progress_bar.SetBound(x1, y2-CELL_H, x2, y2);
                       }
//--- Sets coordinates and dimensions of chart header on canvas
   void              SetBoundHeader(const int x1, const int y1, const int x2, const int y2)
                       {
                        this.m_bound_head.SetBound(x1, y1, x2, y2);
                       }
//--- Returns pointer to (1) itself, (2) progress bar
   CStatChart       *Get(void)                           { return &this;                     }
   CColorProgressBar*GetProgressBar(void)                { return(&this.m_progress_bar);     }

//--- Setting/returning tab ID
   void              SetTabID(const int id)              { this.m_tab_id=id;                 }
   int               TabID(void)                   const { return this.m_tab_id;             }

//--- Returning coordinates of bounds of chart’s rectangular area
   int               X1(void)                      const { return this.m_bound_chart.left;   }
   int               Y1(void)                      const { return this.m_bound_chart.top;    }
   int               X2(void)                      const { return this.m_bound_chart.right;  }
   int               Y2(void)                      const { return this.m_bound_chart.bottom; }
//--- Return of coordinates of bounds of rectangular header area
   int               HeaderX1(void)                const { return this.m_bound_head.left;    }
   int               HeaderY1(void)                const { return this.m_bound_head.top;     }
   int               HeaderX2(void)                const { return this.m_bound_head.right;   }
   int               HeaderY2(void)                const { return this.m_bound_head.bottom;  }
//--- Return of coordinates of bounds of rectangular area of progress bar
   int               ProgressBarX1(void)           const { return this.m_progress_bar.X1();  }
   int               ProgressBarY1(void)           const { return this.m_progress_bar.Y1();  }
   int               ProgressBarX2(void)           const { return this.m_progress_bar.X2();  }
   int               ProgressBarY2(void)           const { return this.m_progress_bar.Y2();  }

//--- Returns pointer to button of: (1) replay, (2) result selection (3) worst, (4) average, (5) best result
   CButton          *ButtonReplay(void)                  { return(&this.m_button_replay);    }
   CButtonSwitch    *ButtonResult(void)                  { return(&this.m_button_res);       }
   CButtonTriggered *ButtonResultMin(void)               { return(this.m_button_res.GetButton(0)); }
   CButtonTriggered *ButtonResultMid(void)               { return(this.m_button_res.GetButton(1)); }
   CButtonTriggered *ButtonResultMax(void)               { return(this.m_button_res.GetButton(2)); }

//--- (1) Hides, (2) shows, (3) brings results selection button to foreground
   bool              ButtonsResultHide(void)             { return(this.m_button_res.Hide());       }
   bool              ButtonsResultShow(void)             { return(this.m_button_res.Show());       }
   bool              ButtonsResultBringToTop(void)       { return(this.m_button_res.BringToTop()); }

//--- Creates replay button
   bool              CreateButtonReplay(void)
                       {
                        if(this.m_background==NULL)
                          {
                           ::PrintFormat("%s: Фон не задан (сначала используйте функцию SetCanvas())");
                           return false;
                          }
                        string text="Optimization Completed: Click to Replay";
                        int w=this.m_background.TextWidth(text);

                        //--- Upper-left coordinate of button
                        CPoint cp=this.m_bound_head.CenterPoint();
                        int x=cp.x-w/2;
                        int y=this.Y1()+this.m_bound_head.top-2;

                        //--- Create button and set new colors for it, hide created button
                        if(!this.m_button_replay.Create(::StringFormat("Tab%d_ButtonReplay", this.m_tab_id), text, x, y, w, CELL_H-1))
                           return false;

                        this.m_button_replay.SetDefaultColors(COLOR_BACKGROUND, STATE_OFF, C'144,238,144', C'144,228,144', C'144,218,144', clrSilver);
                        this.m_button_replay.SetDefaultColors(COLOR_BORDER, STATE_OFF, C'144,238,144', C'144,228,144', C'144,218,144', clrSilver);
                        this.m_button_replay.SetDefaultColors(COLOR_FOREGROUND, STATE_OFF, clrBlack, clrBlack, clrBlack, clrGray);
                        this.m_button_replay.ResetUsedColors(STATE_OFF);
                        this.m_button_replay.Draw(false);
                        this.m_button_replay.Hide();
                        return true;
                       }

//--- Creates results selection button
   bool              CreateButtonResults(void)
                       {
                        if(this.m_background==NULL)
                          {
                           ::PrintFormat("%s: Фон не задан (сначала используйте функцию SetCanvas())");
                           return false;
                          }
                        //--- Upper-left coordinate of button
                        int x=this.m_bound_head.left+1;
                        int y=this.m_progress_bar.Y1()+CELL_H+2;
                        int w=BUTT_RES_W;

                        //--- Creatу button and set new colors for it, hidу created button
                        if(!this.m_button_res.Create(::StringFormat("Tab%u_ButtonRes",this.m_tab_id), "", x, y, w, CELL_H-1))
                           return false;

                        string text[3]={"Worst result of the top 3", "Average result of the top 3", "Best result of the top 3"};
                        if(!this.m_button_res.AddNewButton(text, w))
                           return false;
                        this.m_button_res.GetButton(0).SetDefaultColors(COLOR_BORDER, STATE_OFF, C'228,228,228', C'228,228,228', C'228,228,228', clrSilver);
                        this.m_button_res.GetButton(0).ResetUsedColors(STATE_OFF);
                        this.m_button_res.GetButton(1).SetDefaultColors(COLOR_BORDER, STATE_OFF, C'228,228,228', C'228,228,228', C'228,228,228', clrSilver);
                        this.m_button_res.GetButton(1).ResetUsedColors(STATE_OFF);
                        this.m_button_res.GetButton(2).SetDefaultColors(COLOR_BORDER, STATE_OFF, C'228,228,228', C'228,228,228', C'228,228,228', clrSilver);
                        this.m_button_res.GetButton(2).ResetUsedColors(STATE_OFF);
                        this.m_button_res.Draw(false);
                        this.m_button_res.Hide();
                        return true;
                       }

//--- Sets background color
   void              SetBackColor(const color clr)
                       {
                        this.m_back_color=clr;
                        this.m_progress_bar.SetBackColor(clr);
                       }
//--- Sets border color
   void              SetForeColor(const color clr)
                       {
                        this.m_fore_color=clr;
                        this.m_progress_bar.SetForeColor(clr);
                       }

//--- Sets number of lines on chart
   void              SetLines(const int num)
                       {
                        this.m_lines=num;
                        ::ArrayResize(this.m_seria, num);
                        ::ArrayResize(this.m_profitseria, num);
                       }

//--- Setting color of (1) profitable, (2) loss, (3) selected series
   void              SetProfitColorLine(const color clr)    { this.m_profit_color=clr;    }
   void              SetLossColorLine(const color clr)      { this.m_loss_color=clr;      }
   void              SetSelectedLineColor(const color clr)  { this.m_selected_color=clr;  }

//--- Updating object on screen
   void              Update(color clr, const int line_width, const bool chart_redraw);
//--- Adding data from array
   void              AddSeria(const double  &array[], bool profit);
//--- Draws chart
   void              Draw(const int seria_index, color clr, const int line_width, const bool chart_redraw);
//--- Draws line in usual coordinates (from left to right, from bottom to top)
   void              Line(int x1, int y1, int x2, int y2, uint col, int size);
//--- Getting max. and min. values in the series
   double            MaxValue(const int seria_index);
   double            MinValue(const int seria_index);

//--- Event handler
   void OnChartEvent(const int id,const long& lparam,const double& dparam,const string& sparam)
     {
      //--- If replay button is not hidden, call its event handler
      if(!this.m_button_replay.IsHidden())
         this.m_button_replay.OnChartEvent(id, lparam, dparam, sparam);
      //--- If result selection button is not hidden, call its event handler
      if(!this.m_button_res.IsHidden())
         this.m_button_res.OnChartEvent(id, lparam, dparam, sparam);
     }
  };
指定されたキャンバス(背景と前景の両方)上で、このクラスはパラメータやテスト結果のテーブル、各パスのチャート、プログレスバー、完了した最適化プロセスを再生するボタン、特定の最適化基準に基づいて最良結果を選択するボタンなどを描画します。
ここで重要なのは、キャンバス上の矩形領域(追跡対象のオブジェクトやエリアが存在する範囲)を指定する際に、これらのクラスがCRect構造体を使用している点です。
この構造体は\MQL5\Include\Controls\Rect.mqhで定義されており、重要な要素を含む矩形領域の範囲を指定するための便利なツールとして機能します。たとえば、キャンバス上でマウスカーソルを追跡する範囲を制限したり、キャンバス全体を覆う矩形領域のサイズを指定することもできます。この場合、オブジェクト全体の領域がカーソルとのインタラクションに使用可能になります。矩形領域の座標を取得するメソッドは構造体内に実装されており、範囲の設定や値の取得方法も複数用意されています。オブジェクトの構造や目的に応じて使い分けることが可能です。さらに、矩形領域を移動およびシフトするためのメソッドも実装されており、任意の領域を効率的に追跡および管理するための便利なツールとして利用できます。
ここで取り上げているクラスでは、これらの矩形領域がマウスカーソルとのインタラクションや、キャンバス上でオブジェクトがどこに配置されているかを示すために必要とされています。
以下は、チャートを更新するメソッドです。
//+------------------------------------------------------------------+
//| Updating chart                                                   |
//+------------------------------------------------------------------+
void CStatChart::Update(color clr, const int line_width, const bool chart_redraw)
  {
//--- If canvas for background or foreground is not installed, exit
   if(this.m_background==NULL || this.m_foreground==NULL)
      return;
//--- StatChart fill in background
   this.m_background.FillRectangle(this.X1(), this.Y1(), this.X2(), this.Y2(), ::ColorToARGB(this.m_back_color));
//--- StatChart draw border
   this.m_background.Rectangle(this.X1(), this.Y1(), this.X2(), this.Y2(), ::ColorToARGB(this.m_fore_color));

//--- ProgressBar fill in background and draw border
   this.m_progress_bar.Update(false);

//--- Draw each series for 80% of available chart area vertically and horizontally
   for(int i=0; i<this.m_lines; i++)
     {
      //--- If color is set missing, use colors of profitable and loss series
      if(clr==clrNONE)
        {
         clr=this.m_loss_color;
         if(this.m_profitseria[i])
            clr=this.m_profit_color;
        }
      //--- otherwise, use color set for selected line
      else
         clr=this.m_selected_color;

      //--- Draw a chart of optimization results
      this.Draw(i, clr, line_width, false);
     }
//--- Update both canvases
   this.m_background.Update(false);
   this.m_foreground.Update(chart_redraw);
  }
描画用に確保されたキャンバスの矩形領域は、パスチャートを描くために一度消去され、その上にバランス曲線とプログレスバーが描画されます。
以下は、チャートに描画する新しいデータ系列を追加するメソッドです。
//+------------------------------------------------------------------+
//| Adds new series of data to be drawn on chart                     |
//+------------------------------------------------------------------+
void CStatChart::AddSeria(const double &array[], bool profit)
  {
//--- Adding array to series number m_lastseria_index
   this.m_seria[this.m_lastseria_index].Resize(0);
   this.m_seria[this.m_lastseria_index].AddArray(array);
   this.m_profitseria[this.m_lastseria_index]=profit;
//--- Track index of last line (not currently in use)
   this.m_lastseria_index++;
   if(this.m_lastseria_index>=this.m_lines)
      this.m_lastseria_index=0;
  }
最適化の各新しいパスについて、そのデータ配列をデータ列配列に登録する必要があります。これを実装しているのが、このメソッドです。
以下は、最適化パスの配列内で指定されたデータ列の最大値および最小値を取得するためのメソッドです。
//+------------------------------------------------------------------+
//| Getting maximum value of specified series                        |
//+------------------------------------------------------------------+
double CStatChart::MaxValue(const int seria_index)
  {
   double res=this.m_seria[seria_index].At(0);
   int total=this.m_seria[seria_index].Total();
//--- Iterate through array and compare every two adjacent series
   for(int i=1; i<total; i++)
     {
      if(this.m_seria[seria_index].At(i)>res)
         res=this.m_seria[seria_index].At(i);
     }
//--- result
   return res;
  }
//+------------------------------------------------------------------+
//| Getting minimum value of specified series                        |
//+------------------------------------------------------------------+
double CStatChart::MinValue(const int seria_index)
  {
   double res=this.m_seria[seria_index].At(0);;
   int total=this.m_seria[seria_index].Total();
//--- Iterate through array and compare every two adjacent series
   for(int i=1; i<total; i++)
     {
      if(this.m_seria[seria_index].At(i)<res)
         res=this.m_seria[seria_index].At(i);
     }
//--- result
   return res;
  }
最適化パスのチャートを特別なチャートの中央に対して配置するには、まずパスデータ列内の最大値と最小値を把握しておく必要があります。これらの値を使うことで、チャート上のラインの相対座標を計算でき、最適化パスのバランス曲線用に確保された描画領域の80%に収まるようにラインを描画できます。
以下は、チャート上にバランス曲線を描くメソッドです。
//+------------------------------------------------------------------+
//| Overloading the basic drawing function                           |
//+------------------------------------------------------------------+
void CStatChart::Line(int x1, int y1, int x2, int y2, uint col, int size)
  {
//--- If canvas is not set, exit
   if(this.m_foreground==NULL)
      return;
//--- Since Y-axis is inverted, invert y1 and y2
   int y1_adj=this.m_bound_chart.Height()-CELL_H-y1;
   int y2_adj=this.m_bound_chart.Height()-CELL_H-y2;

//--- Draw smoothed line
//--- If line thickness is less than 3, draw line using the Wu smoothing algorithm
//--- (for thicknesses of 1 and 2, LineWu() method is called in LineThick() method),
//--- otherwise, draw smoothed line of given thickness using LineThick
   this.m_foreground.LineThick(x1, y1_adj, x2, y2_adj,::ColorToARGB(col), (size<1 ? 1 : size), STYLE_SOLID, LINE_END_ROUND);
  }
これは、CCanvasクラスの同名メソッドをオーバーロードしたメソッドです。チャート上の座標は左上を原点として始まりますが、バランス曲線は通常、左下を原点として描画されます。
このメソッドでは、配列から取得したバランスポイントの値に基づいて、画面上のY座標を反転させることで、上下逆にならない正しいバランス曲線を描画します。
以下は、チャート上にバランス曲線を描画するメソッドです。
//+------------------------------------------------------------------+
//| Drawing balance line on chart                                    |
//+------------------------------------------------------------------+
void CStatChart::Draw(const int seria_index, color clr, const int line_width, const bool chart_redraw)
  {
//--- If canvas is not set, exit
   if(this.m_foreground==NULL)
      return;

//--- Preparing coefficients for converting values into pixels
   double min=this.MaxValue(seria_index);
   double max=this.MinValue(seria_index);
   double size=this.m_seria[seria_index].Total();

//--- Indentations from chart edge
   double x_indent=this.m_bound_chart.Width()*0.05;
   double y_indent=this.m_bound_chart.Height()*0.05;

//--- Calculate coefficients
   double k_y=(max-min)/(this.m_bound_chart.Height()-2*CELL_H-2*y_indent);
   double k_x=(size)/(this.m_bound_chart.Width()-2*x_indent);

//--- Coefficients
   double start_x=this.m_bound_chart.left+x_indent;
   double start_y=this.m_bound_chart.bottom-2*CELL_H*2-y_indent;

//--- Now draw polyline passing through all points of series
   for(int i=1; i<size; i++)
     {
      //--- convert values to pixels
      int x1=(int)((i-0)/k_x+start_x);  // set value number horizontally
      int y1=(int)(start_y-(m_seria[seria_index].At(i)-min)/k_y);    // vertically
      int x2=(int)((i-1-0)/k_x+start_x);// set value number horizontally
      int y2=(int)(start_y-(m_seria[seria_index].At(i-1)-min)/k_y);  // vertically
      //--- Draw line from previous point to current one
      this.Line(x1, y1, x2, y2, clr, line_width);
     }
//--- Updating canvas with chart redrawing (if flag is set)
   this.m_foreground.Update(chart_redraw);
  }
ここでは、チャート上でバランス曲線を描画するために必要な座標が計算されます(バランス曲線を描画するために確保されたチャート領域内で)。その後、指定されたデータ列配列に従ってループ処理をおこない、配列に記録されたすべてのバランスポイント間に線を描画します。
以下は、フレームデータクラスです。
//+------------------------------------------------------------------+
//| Enumerations                                                     |
//+------------------------------------------------------------------+
enum ENUM_FRAME_PROP                                              // Frame properties
  {
   FRAME_PROP_PASS_NUM,                                           // Pass number
   FRAME_PROP_SHARPE_RATIO,                                       // Sharpe Ratio result
   FRAME_PROP_NET_PROFIT,                                         // Net Profit result
   FRAME_PROP_PROFIT_FACTOR,                                      // Profit Factor result
   FRAME_PROP_RECOVERY_FACTOR,                                    // Recovery Factor result
  };
//+------------------------------------------------------------------+
//| Frame data class                                                 |
//+------------------------------------------------------------------+
class CFrameData : public CObject
  {
protected:
   ulong             m_pass;                                      // Pass number
   double            m_sharpe_ratio;                              // Sharpe Ratio
   double            m_net_profit;                                // Total profit
   double            m_profit_factor;                             // Profitability
   double            m_recovery_factor;                           // Recovery factor
public:
//--- Setting frame properties (pass results)
   void              SetPass(const ulong pass)                    { this.m_pass=pass;              }
   void              SetSharpeRatio(const double value)           { this.m_sharpe_ratio=value;     }
   void              SetNetProfit(const double value)             { this.m_net_profit=value;       }
   void              SetProfitFactor(const double value)          { this.m_profit_factor=value;    }
   void              SetRecoveryFactor(const double value)        { this.m_recovery_factor=value;  }
//--- Returning frame properties (pass results)
   ulong             Pass(void)                             const { return this.m_pass;            }
   double            SharpeRatio(void)                      const { return this.m_sharpe_ratio;    }
   double            NetProfit(void)                        const { return this.m_net_profit;      }
   double            ProfitFactor(void)                     const { return this.m_profit_factor;   }
   double            RecoveryFactor(void)                   const { return this.m_recovery_factor; }

//--- Description of properties
   string            PassDescription(void)                  const { return ::StringFormat("Pass: %I64u", this.m_pass);                       }
   string            SharpeRatioDescription(void)           const { return ::StringFormat("Sharpe Ratio: %.2f", this.m_sharpe_ratio);        }
   string            NetProfitDescription(void)             const { return ::StringFormat("Net Profit: %.2f", this.m_net_profit);            }
   string            ProfitFactorDescription(void)          const { return ::StringFormat("Profit Factor: %.2f", this.m_profit_factor);      }
   string            RecoveryFactorDescription(void)        const { return ::StringFormat("Recovery Factor: %.2f", this.m_recovery_factor);  }

//--- Printing frame properties to log
   void              Print(void)
                       {
                        ::PrintFormat("Frame %s:", this.PassDescription());
                        ::PrintFormat(" - %s", this.SharpeRatioDescription());
                        ::PrintFormat(" - %s", this.NetProfitDescription());
                        ::PrintFormat(" - %s", this.ProfitFactorDescription());
                        ::PrintFormat(" - %s", this.RecoveryFactorDescription());
                       }

//--- A method for comparing two objects
   virtual int       Compare(const CObject *node,const int mode=0) const
                       {
                        //--- Compare real values as two-digit values
                        const CFrameData *obj=node;
                        switch(mode)
                          {
                           case FRAME_PROP_SHARPE_RATIO     :  return(::NormalizeDouble(this.SharpeRatio(),2)   > ::NormalizeDouble(obj.SharpeRatio(),2)    ?  1 :
                                                                      ::NormalizeDouble(this.SharpeRatio(),2)   < ::NormalizeDouble(obj.SharpeRatio(),2)    ? -1 : 0);
                           case FRAME_PROP_NET_PROFIT       :  return(::NormalizeDouble(this.NetProfit(),2)     > ::NormalizeDouble(obj.NetProfit(),2)      ?  1 :
                                                                      ::NormalizeDouble(this.NetProfit(),2)     < ::NormalizeDouble(obj.NetProfit(),2)      ? -1 : 0);
                           case FRAME_PROP_PROFIT_FACTOR    :  return(::NormalizeDouble(this.ProfitFactor(),2)  > ::NormalizeDouble(obj.ProfitFactor(),2)   ?  1 :
                                                                      ::NormalizeDouble(this.ProfitFactor(),2)  < ::NormalizeDouble(obj.ProfitFactor(),2)   ? -1 : 0);
                           case FRAME_PROP_RECOVERY_FACTOR  :  return(::NormalizeDouble(this.RecoveryFactor(),2)> ::NormalizeDouble(obj.RecoveryFactor(),2) ?  1 :
                                                                      ::NormalizeDouble(this.RecoveryFactor(),2)< ::NormalizeDouble(obj.RecoveryFactor(),2) ? -1 : 0);
                           //---FRAME_PROP_PASS_NUM
                           default                          :  return(this.Pass()>obj.Pass() ?  1  :  this.Pass()<obj.Pass()  ? -1  :  0);
                          }
                       }

//--- Constructors/destructor
                     CFrameData (const ulong pass, const double sharpe_ratio, const double net_profit, const double profit_factor, const double recovery_factor) :
                        m_pass(pass), m_sharpe_ratio(sharpe_ratio), m_net_profit(net_profit), m_profit_factor(profit_factor), m_recovery_factor(recovery_factor) {}
                     CFrameData (void) :
                        m_pass(0), m_sharpe_ratio(0), m_net_profit(0), m_profit_factor(0), m_recovery_factor(0) {}
                    ~CFrameData (void) {}
  };
最適化の各パスが完了すると、そのパスのデータを含むフレームがターミナルに送信されます。このフレームには、そのパスの終了時に受け取ったすべてのデータが含まれています。任意のパスのデータにアクセスするには、受信したフレームをすべてループで検索し、目的の番号のフレームを見つけてデータを取得する必要があります。しかし、これはまったく効率的ではありません。必要なのは、特定のパスのデータに素早くアクセスできること、そしてすべてのパスを指定したプロパティでソートできることです。なぜなら、4つの最適化基準ごとに上位3つのパスを選択する必要があるからです。
解決策は、パスをキャッシュすることです。そのためにフレームオブジェクトクラスが必要になります。各パスが完了してフレームをターミナルに送信した後、フレームオブジェクトを作成し、受信したテストフレームのデータでプロパティを埋め、フレームオブジェクトをリストに配置します。最適化プロセスが完了し、すべてのフレームが取得されると、フレームリストにはすべてのフレームのコピーが保存されます。これにより、リストを必要なプロパティでソートし、目的のフレームのデータを素早く取得できるようになります。
Compare()メソッドでは、実数を比較する際に、正規化差と0を比較するのではなく、2つの正規化された値同士を比較する必要がありました。なぜでしょうか。
実数を比較する方法はいくつかあります。ひとつは正規化されていない値を比較する方法で、「大きいか」「小さいか」を三項演算子で順に比較し、最後に残れば「等しい」と判断します。もうひとつは、2つの数値の正規化差を0と比較する方法です。ただし、ここでは両方の数値を2桁に正規化し、これらの値を比較する必要がありました。
理由は、ターミナルでは最適化結果テーブルに小数2桁で表示されますが、内部的にはその値は正規化されていないからです。言い換えると、結果の小数2桁表示は結果テーブルにのみ反映されます。たとえば、テーブルに1.09と1.08と表示されていても、実際には1.085686399864や1.081254322375などの値である可能性があります。テーブル上ではどちらも1.09と1.08に四捨五入されて表示されます。しかし、比較をおこなう際に正規化せずに処理すると、両方が同じ値として扱われ、1.09の値が欠落することがあります。これにより、最良パスの検索が正しく行えなくなります。
解決策は、両方の数値を小数2桁に正規化したうえで、その丸められた値を比較することです。
以下は、フレームビューアクラスです。
//+------------------------------------------------------------------+ //| ▸Frame viewer class | //+------------------------------------------------------------------+ class CFrameViewer : public CObject { private: int m_w; // Chart width int m_h; // Chart height color m_selected_color; // Color of selected series from top three uint m_line_width; // Width of line of selected series from top three bool m_completed; // Optimization completion flag CFrameData m_frame_tmp; // Frame object for searching by property CArrayObj m_list_frames; // List of frames CTabControl m_tab_control; // Tab Control //--- Declare tab objects on Tab Control //--- Tab 0 (Optimization) of Tab Control CTableDataControl m_table_inp_0; // Table of optimization parameters on tab 0 CTableDataControl m_table_stat_0; // Table of optimization results on tab 0 CTableDataControl m_table_stat_0; // Table of optimization results on tab 0 CColorProgressBar*m_progress_bar; // Progress bar on optimization chart on tab 0 //--- Tab 1 (Sharpe Ratio) of Tab Control CTableDataControl m_table_inp_1; // Table of optimization parameters on tab 1 CTableDataControl m_table_stat_1; // Table of optimization results on tab 1 CStatChart m_chart_stat_1; // Table of optimization results on tab 1 //--- Tab 2 (Net Profit) of Tab Control CTableDataControl m_table_inp_2; // Table of optimization parameters on tab 2 CTableDataControl m_table_stat_2; // Table of optimization results on tab 2 CStatChart m_chart_stat_2; // Chart of optimization results on tab 2 //--- Tab 3 (Profit Factor) of Tab Control CTableDataControl m_table_inp_3; // Table of optimization parameters on tab 3 CTableDataControl m_table_stat_3; // Table of optimization results on tab 3 CStatChart m_chart_stat_3; // Chart of optimization results on tab 3 //--- Tab 4 (Recovery Factor) of Tab Control CTableDataControl m_table_inp_4; // Table of optimization parameters on tab 4 CTableDataControl m_table_stat_4; // able of optimization results on tab 4 CStatChart m_chart_stat_4; // Chart of optimization results on tab 4 protected: //--- Returns pointer to table of optimization parameters by tab index CTableDataControl*GetTableInputs(const uint tab_id) { switch(tab_id) { case 0 : return this.m_table_inp_0.Get(); case 1 : return this.m_table_inp_1.Get(); case 2 : return this.m_table_inp_2.Get(); case 3 : return this.m_table_inp_3.Get(); case 4 : return this.m_table_inp_4.Get(); default: return NULL; } } //--- Returns pointer to table of optimization results by tab index CTableDataControl*GetTableStats(const uint tab_id) { switch(tab_id) { case 0 : return this.m_table_stat_0.Get(); case 1 : return this.m_table_stat_1.Get(); case 2 : return this.m_table_stat_2.Get(); case 3 : return this.m_table_stat_3.Get(); case 4 : return this.m_table_stat_4.Get(); default: return NULL; } } //--- Returns pointer to chart of optimization results by tab index CStatChart *GetChartStats(const uint tab_id) { switch(tab_id) { case 0 : return this.m_chart_stat_0.Get(); case 1 : return this.m_chart_stat_1.Get(); case 2 : return this.m_chart_stat_2.Get(); case 3 : return this.m_chart_stat_3.Get(); case 4 : return this.m_chart_stat_4.Get(); default: return NULL; } } //--- Adds frame object to list bool AddFrame(CFrameData *frame) { if(frame==NULL) { ::PrintFormat("%s: Error: Empty object passed",__FUNCTION__); return false; } this.m_frame_tmp.SetPass(frame.Pass()); this.m_list_frames.Sort(FRAME_PROP_PASS_NUM); int index=this.m_list_frames.Search(frame); if(index>WRONG_VALUE) return false; return this.m_list_frames.Add(frame); } //--- Draws table of optimization statistics on specified tab void TableStatDraw(const uint tab_id, const int x, const int y, const int w, const int h, const bool chart_redraw); //--- Draws table of input optimization parameters on specified tab void TableInpDraw(const uint tab_id, const int x, const int y, const int w, const int h, const uint rows, const bool chart_redraw); //--- Draws chart of optimization on specified tab void ChartOptDraw(const uint tab_id, const bool opt_completed, const bool chart_redraw); //--- Draws data tables and optimization chart void DrawDataChart(const uint tab_id); //--- Draws charts of top three passes by optimization criterion void DrawBestFrameData(const uint tab_id, const int res_index); //--- Controls view of control objects on optimization charts void ControlObjectsView(const uint tab_id); //--- Replaying frames after optimization completion void ReplayFrames(const int delay_ms); //--- Retrieving data of current frame and printing it on specified tab in table and on optimization results chart bool DrawFrameData(const uint tab_id, const string text, color clr, const uint line_width, ulong &pass, string ¶ms[], uint &par_count, double &data[]); //--- Prints data of specified frame to optimization chart bool DrawFrameDataByPass(const uint tab_id, const ulong pass_num, const string text, color clr, const uint line_width, double &data[]); //--- Fills array with frame indexes of top three passes for specified optimization criterion (by tab index) bool FillArrayBestFrames(const uint tab_id, ulong &array_passes[]); //--- Prints out three best passes on each tab on optimization results charts void DrawBestFrameDataAll(void); //--- Searches for and returns pointer to frame object with a property value less than sample CFrameData *FrameSearchLess(CFrameData *frame, const int mode); public: //--- Setting thickness of selected line void SetSelectedLineWidth(const uint width) { this.m_line_width=width; } //--- Setting color of profitable series void SetProfitColorLine(const color clr) { int total=this.m_tab_control.TabsTotal(); for(int i=1; i<total; i++) { CStatChart *chart=this.GetChartStats(i); if(chart!=NULL) chart.SetProfitColorLine(clr); } } //--- Setting color of loss series void SetLossColorLine(const color clr) { int total=this.m_tab_control.TabsTotal(); for(int i=1; i<total; i++) { CStatChart *chart=this.GetChartStats(i); if(chart!=NULL) chart.SetLossColorLine(clr); } } //--- Setting color of selected series void SetSelectedLineColor(const color clr) { int total=this.m_tab_control.TabsTotal(); for(int i=1; i<total; i++) { CStatChart *chart=this.GetChartStats(i); if(chart!=NULL) chart.SetSelectedLineColor(clr); } } //--- Event handlers of strategy tester void OnTester(const double OnTesterValue); int OnTesterInit(const int lines, const int selected_line_width, const color selected_line_color); void OnTesterPass(void); void OnTesterDeinit(void); //--- Chart event handlers void OnChartEvent(const int id,const long &lparam,const double &dparam,const string &sparam,const int delay_ms); protected: //--- Handler for (1) changing tab of Tab Control element, (2) selecting Button Switch void OnTabSwitchEvent(const int tab_id); void OnButtonSwitchEvent(const int tab_id, const uint butt_id); public: //--- Constructor/destructor CFrameViewer(void); ~CFrameViewer(void){ this.m_list_frames.Clear(); } };
タブの数や、各タブに配置される要素が正確に決まっているため、ここでは新しいオブジェクトの作成はおこなわれません。代わりに、各タブに必要なオブジェクトのインスタンスを用意し、それらにアクセスするためのメソッドや、クラス自体が動作するためのメソッドが宣言されています。
以下はコンストラクタです。
//+------------------------------------------------------------------+
//| Constructor                                                      |
//+------------------------------------------------------------------+
CFrameViewer::CFrameViewer(void) : m_completed(false), m_progress_bar(NULL), m_selected_color(clrDodgerBlue), m_line_width(1)
  {
//--- Chart window size
   this.m_w=(int)::ChartGetInteger(0, CHART_WIDTH_IN_PIXELS);
   this.m_h=(int)::ChartGetInteger(0, CHART_HEIGHT_IN_PIXELS);
//--- Get pointer to progress bar from statistics chart object
   this.m_progress_bar=this.m_chart_stat_0.GetProgressBar();
   this.m_list_frames.Clear();
  }
コンストラクタでは、EAが動作しているチャートの幅と高さを取得して保持し、プログレスバーへのポインタを見つけて書き込み、フレームのリストをクリアします。
最適化を開始する際は、開始前に、フレームモードで動作するEAのコピーをクライアントターミナル上に起動するためのチャートを準備する必要があります。このチャートはターミナルから分離され、タブコントロールがフルサイズで配置されます。残りの要素は各タブ上に配置され、パスのバランス曲線や操作用ボタンを表示します。
これらすべての処理はOnTesterInit()ハンドラ内でおこなう必要があります。そのために、クラスは同名のハンドラを提供しており、CFrameViewerクラスのインスタンスからEAで呼び出されます。
以下は、OnTesterInitハンドラです。
//+------------------------------------------------------------------+
//| It must be called in handler of OnTesterInit() Expert Advisor    |
//+------------------------------------------------------------------+
int CFrameViewer::OnTesterInit(const int lines, const int selected_line_width, const color selected_line_color)
  {
//--- Chart ID with expert running in Frame mode
   long chart_id=::ChartID();

//--- Preparing a floating chart for drawing statistics tables and balance lines
   ::ResetLastError();
   if(!::ChartSetInteger(chart_id, CHART_SHOW, false))
     {
      ::PrintFormat("%s: ChartSetInteger() failed. Error %d",__FUNCTION__, GetLastError());
      return INIT_FAILED;
     }
   if(!::ChartSetInteger(chart_id, CHART_IS_DOCKED, false))
     {
      ::PrintFormat("%s: ChartSetInteger() failed. Error %d",__FUNCTION__, GetLastError());
      return INIT_FAILED;
     }
//--- Clearing chart completely of all graphical objects
   ::ObjectsDeleteAll(chart_id);

//--- Based on chart size create Tab Control with five tabs
   int w=(int)::ChartGetInteger(chart_id, CHART_WIDTH_IN_PIXELS);
   int h=(int)::ChartGetInteger(chart_id, CHART_HEIGHT_IN_PIXELS);
   if(this.m_tab_control.Create("TabControl", "", 0, 0, w, h))
     {
      //--- If control is created successfully, add five tabs to it
      bool res=true;
      for(int i=0; i<5; i++)
        {
         string tab_text=(i==1 ? "Sharpe Ratio" : i==2 ? "Net Profit" : i==3 ? "Profit Factor" : i==4 ? "Recovery Factor" : "Optimization");
         res &=this.m_tab_control.AddTab(i, tab_text);
        }
      if(!res)
        {
         ::PrintFormat("%s: Errors occurred while adding tabs to the Tab Control",__FUNCTION__);
         return INIT_FAILED;
        }
     }
   else
     {
      Print("Tab Control creation failed");
      return INIT_FAILED;
     }

//--- CCanvas objects in workspace of tab 0 (Optimization) for drawing background images and text
   CCanvas *tab0_background=this.m_tab_control.GetTabBackground(0);
   CCanvas *tab0_foreground=this.m_tab_control.GetTabForeground(0);
//--- CCanvas objects in workspace of tab 1 (Sharpe Ratio) for drawing background images and text
   CCanvas *tab1_background=this.m_tab_control.GetTabBackground(1);
   CCanvas *tab1_foreground=this.m_tab_control.GetTabForeground(1);
//--- CCanvas objects in workspace of tab 2 (Net Profit) for drawing background images and text
   CCanvas *tab2_background=this.m_tab_control.GetTabBackground(2);
   CCanvas *tab2_foreground=this.m_tab_control.GetTabForeground(2);
//--- CCanvas objects in workspace of tab 3 (Profit Factor) for drawing background images and text
   CCanvas *tab3_background=this.m_tab_control.GetTabBackground(3);
   CCanvas *tab3_foreground=this.m_tab_control.GetTabForeground(3);
//--- CCanvas objects in workspace of tab 4 (Recovery Factor) for drawing background images and text
   CCanvas *tab4_background=this.m_tab_control.GetTabBackground(4);
   CCanvas *tab4_foreground=this.m_tab_control.GetTabForeground(4);

//--- Set tab identifiers for objects of optimization statistics charts
   this.m_chart_stat_0.SetTabID(0);
   this.m_chart_stat_1.SetTabID(1);
   this.m_chart_stat_2.SetTabID(2);
   this.m_chart_stat_3.SetTabID(3);
   this.m_chart_stat_4.SetTabID(4);

//--- Indicate for objects of statistics charts that we draw on tab with corresponding index
   this.m_chart_stat_0.SetCanvas(tab0_background, tab0_foreground);
   this.m_chart_stat_1.SetCanvas(tab1_background, tab1_foreground);
   this.m_chart_stat_2.SetCanvas(tab2_background, tab2_foreground);
   this.m_chart_stat_3.SetCanvas(tab3_background, tab3_foreground);
   this.m_chart_stat_4.SetCanvas(tab4_background, tab4_foreground);

//--- Set number of series on optimization statistics charts
   this.m_chart_stat_0.SetLines(lines);
   this.m_chart_stat_1.SetLines(lines);
   this.m_chart_stat_2.SetLines(lines);
   this.m_chart_stat_3.SetLines(lines);
   this.m_chart_stat_4.SetLines(lines);

//--- Setting background and foreground colors of optimization statistics charts
   this.m_chart_stat_0.SetBackColor(clrIvory);
   this.m_chart_stat_0.SetForeColor(C'200,200,200');
   this.m_chart_stat_1.SetBackColor(clrIvory);
   this.m_chart_stat_1.SetForeColor(C'200,200,200');
   this.m_chart_stat_2.SetBackColor(clrIvory);
   this.m_chart_stat_2.SetForeColor(C'200,200,200');
   this.m_chart_stat_3.SetBackColor(clrIvory);
   this.m_chart_stat_3.SetForeColor(C'200,200,200');
   this.m_chart_stat_4.SetBackColor(clrIvory);
   this.m_chart_stat_4.SetForeColor(C'200,200,200');

//--- Set thickness and color of selected line of best pass
   this.SetSelectedLineWidth(selected_line_width);
   this.SetSelectedLineColor(selected_line_color);

//--- Draw two tables with optimization results and input parameters on tab 0 (Optimization),
//--- and window with progress bar for printing charts and optimization process
   this.TableStatDraw(0, 4, 4, CELL_W*2, CELL_H, false);
   this.TableInpDraw(0, 4, this.m_table_stat_0.Y2()+4, CELL_W*2, CELL_H, 0, false);
   this.ChartOptDraw(0, this.m_completed, true);
//--- Create optimization replay button on tab 0
   if(!this.m_chart_stat_0.CreateButtonReplay())
     {
      Print("Button Replay creation failed");
      return INIT_FAILED;
     }

//--- Draw two tables with optimization results and input parameters on tab 1 (Sharpe Ratio),
//--- and window to print charts of optimization results
   this.TableStatDraw(1, 4, 4, CELL_W*2, CELL_H, false);
   this.TableInpDraw(1, 4, this.m_table_stat_1.Y2()+4, CELL_W*2, CELL_H, 0, false);
   this.ChartOptDraw(1, this.m_completed, true);
//--- Create result selection button on tab 1
   if(!this.m_chart_stat_1.CreateButtonResults())
     {
      Print("Tab1: There were errors when creating the result buttons");
      return INIT_FAILED;
     }

//--- Draw two tables with optimization results and input parameters on tab 2 (Net Profit),
//--- and window to print charts of optimization results
   this.TableStatDraw(2, 4, 4, CELL_W*2, CELL_H, false);
   this.TableInpDraw(2, 4, this.m_table_stat_1.Y2()+4, CELL_W*2, CELL_H, 0, false);
   this.ChartOptDraw(2, this.m_completed, true);
//--- Create result selection button on tab 2
   if(!this.m_chart_stat_2.CreateButtonResults())
     {
      Print("Tab2: There were errors when creating the result buttons");
      return INIT_FAILED;
     }

//--- Draw two tables with optimization results and input parameters on tab 3 (Profit Factor),
//--- and window to print charts of optimization results
   this.TableStatDraw(3, 4, 4, CELL_W*2, CELL_H, false);
   this.TableInpDraw(3, 4, this.m_table_stat_1.Y2()+4, CELL_W*2, CELL_H, 0, false);
   this.ChartOptDraw(3, this.m_completed, true);
//--- Create result selection button on tab 3
   if(!this.m_chart_stat_3.CreateButtonResults())
     {
      Print("Tab3: There were errors when creating the result buttons");
      return INIT_FAILED;
     }

//--- Draw two tables with optimization results and input parameters on tab 4 (Recovery Factor),
//--- and window to print charts of optimization results
   this.TableStatDraw(4, 4, 4, CELL_W*2, CELL_H, false);
   this.TableInpDraw(4, 4, this.m_table_stat_1.Y2()+4, CELL_W*2, CELL_H, 0, false);
   this.ChartOptDraw(4, this.m_completed, true);
//--- Create result selection button on tab 4
   if(!this.m_chart_stat_4.CreateButtonResults())
     {
      Print("Tab4: There were errors when creating the result buttons");
      return INIT_FAILED;
     }

   return INIT_SUCCEEDED;
  }
ここでは、すべての要素がブロックごとに作成されます。各コードブロックは、プログラムインターフェースの特定の要素を生成する役割を担っています。
最適化が完了した後は、作成したインターフェースに対していくつかの変更を加える必要があります。具体的には、チャートヘッダの再描画、ヘッダー上のテキストの変更、そして最初のタブ(識別子0)に再生開始ボタンを表示することです。これらの処理はすべてOnTesterDeinit()ハンドラ内で実装されます。
以下は、OnTesterDeinitハンドラです。
//+------------------------------------------------------------------+
//| It must be called in handler of OnTesterDeinit() Expert Advisor  |
//+------------------------------------------------------------------+
void CFrameViewer::OnTesterDeinit(void)
  {
//--- Get pointers to canvas to draw background and foreground
   CCanvas *background=this.m_tab_control.GetTabBackground(0);
   CCanvas *foreground=this.m_tab_control.GetTabForeground(0);

   if(background==NULL || foreground==NULL)
      return;

//--- Set optimization completion flag
   this.m_completed=true;

//--- Chart header coordinates
   int x1=this.m_chart_stat_0.HeaderX1();
   int y1=this.m_chart_stat_0.HeaderY1();
   int x2=this.m_chart_stat_0.HeaderX2();
   int y2=this.m_chart_stat_0.HeaderY2();

   int x=(x1+x2)/2;
   int y=(y1+y2)/2;

//--- Repaint background and erase header text
   background.FillRectangle(x1, y1, x2, y2, ::ColorToARGB(clrLightGreen));
   foreground.FillRectangle(x1, y1, x2, y2, 0x00FFFFFF);

//--- Change text and color of header
   string text="Optimization Complete: Click to Replay";
   foreground.FontSet("Calibri", -100, FW_BLACK);
   foreground.TextOut(x, y, text, ::ColorToARGB(clrMidnightBlue), TA_CENTER|TA_VCENTER);
   background.Update(false);
   foreground.Update(true);

//--- Get active tab index and call method for controlling print of control objects on optimization charts
   int tab_selected=this.m_tab_control.GetSelectedTabID();
   this.ControlObjectsView(tab_selected);

//--- On each tab (1-4), draw charts of three best optimization passes
   this.DrawBestFrameDataAll();
   ::ChartRedraw();
  }
最適化の各パスが完了すると、Testerイベントが発生し、これをOnTester()ハンドラで処理できます。このハンドラは、テストエージェント上で動作するEAインスタンス側で起動されます。
このハンドラ内では、完了したパスのすべてのデータを収集し、フレームを作成してFrameAdd()関数を使ってクライアントターミナルに送信する必要があります。
以下は、OnTesterハンドラです。
//+------------------------------------------------------------------+
//| Prepares array of balance values and sends it in frame           |
//| It must be called in Expert Advisor in OnTester() handler        |
//+------------------------------------------------------------------+
void CFrameViewer::OnTester(const double OnTesterValue)
  {
//--- Variables for working with pass results
   double balance[];
   int    data_count=0;
   double balance_current=::TesterStatistics(STAT_INITIAL_DEPOSIT);

//--- Temporary variables for working with trades
   ulong  ticket=0;
   double profit;
   string symbol;
   long   entry;

//--- Request entire trading history
   ::ResetLastError();
   if(!::HistorySelect(0, ::TimeCurrent()))
     {
      PrintFormat("%s: HistorySelect() failed. Error ",__FUNCTION__, ::GetLastError());
      return;
     }

//--- Collect data of trades
   uint deals_total=::HistoryDealsTotal();
   for(uint i=0; i<deals_total; i++)
     {
      ticket=::HistoryDealGetTicket(i);
      if(ticket==0)
         continue;
      symbol=::HistoryDealGetString(ticket, DEAL_SYMBOL);
      entry =::HistoryDealGetInteger(ticket, DEAL_ENTRY);
      profit=::HistoryDealGetDouble(ticket, DEAL_PROFIT);
      if(entry!=DEAL_ENTRY_OUT && entry!=DEAL_ENTRY_INOUT)
         continue;

      balance_current+=profit;
      data_count++;
      ::ArrayResize(balance, data_count);
      balance[data_count-1]=balance_current;
     }
//--- data[] array to send data to frame
   double data[];
   ::ArrayResize(data, ::ArraySize(balance)+DATA_COUNT);
   ::ArrayCopy(data, balance, DATA_COUNT, 0);

//--- Fill in first DATA_COUNT values of array with test results
   data[0]=::TesterStatistics(STAT_SHARPE_RATIO);           // Sharpe Ratio
   data[1]=::TesterStatistics(STAT_PROFIT);                 // net profit
   data[2]=::TesterStatistics(STAT_PROFIT_FACTOR);          // profit factor
   data[3]=::TesterStatistics(STAT_RECOVERY_FACTOR);        // recovery factor
   data[4]=::TesterStatistics(STAT_TRADES);                 // number of trades
   data[5]=::TesterStatistics(STAT_DEALS);                  // number of deals
   data[6]=::TesterStatistics(STAT_EQUITY_DDREL_PERCENT);   // maximum drawdown of funds as percentage
   data[7]=OnTesterValue;                                   // value of user optimization criterion
   if(data[2]==DBL_MAX)
      data[2]=0;
//--- Create data frame and send it to terminal
   if(!::FrameAdd(::MQLInfoString(MQL_PROGRAM_NAME), FRAME_ID, deals_total, data))
      ::PrintFormat("%s: Frame add error: ",__FUNCTION__, ::GetLastError());
  }
クライアントターミナルでEAがエージェントから送信されたフレームを受信すると、TesterPassイベントが発生し、これをOnTesterPass()ハンドラで処理します。
このハンドラ内では、フレームから情報を取得し、そのパスのバランスグラフをチャート上に描画し、テスト結果やパラメータのテーブルを埋めます。また、処理したフレームを新しいフレームオブジェクトとして保存し、必要なパスをチャートに表示する際に利用できるよう、フレームリストに追加します。
以下は、OnTesterPassハンドラです。
//+------------------------------------------------------------------+
//| Retrieves data frame during optimization and prints chart        |
//| It must be called in Expert Advisor in OnTesterPass() handler    |
//+------------------------------------------------------------------+
void CFrameViewer::OnTesterPass(void)
  {
//--- Variables to work with frames
   string name;
   ulong  pass;
   long   id;
   double value, data[];
   string params[];
   uint   par_count;

//--- Auxiliary variables
   static datetime start=::TimeLocal();
   static int      frame_counter=0;

//--- When receive new frame, we receive data from it
   while(!::IsStopped() && ::FrameNext(pass, name, id, value, data))
     {
      frame_counter++;
      string text=::StringFormat("Frames completed (tester passes): %d in %s", frame_counter,::TimeToString(::TimeLocal()-start, TIME_MINUTES|TIME_SECONDS));
      //--- Get input parameters of Expert Advisor, for which frame was formed, and send them to tables and on chart
      //--- Upon successful retrieval of frame write its data to frame object and locate it in list
      if(this.DrawFrameData(0, text, clrNONE, 0, pass, params, par_count, data))
        {
         //--- Results of tester's pass
         double sharpe_ratio=data[0];
         double net_profit=data[1];
         double profit_factor=data[2];
         double recovery_factor=data[3];

         //--- Create new frame object and save it in list
         CFrameData *frame=new CFrameData(pass, sharpe_ratio, net_profit, profit_factor, recovery_factor);
         if(frame!=NULL)
           {
            if(!this.AddFrame(frame))
               delete frame;
           }
         ::ChartRedraw();
        }
     }
  }
最適化プロセスが完了すると、フレームモードで動作するEAは、ターミナル上の浮動チャート上で動作を続けます。そして、このEAに対するすべての操作はOnChartEvent()ハンドラ内でおこなわれます。なぜなら、チャート上のボタンやマウスカーソルを使って必要な処理を制御するからです。
以下は、OnChartEventハンドラです。
//+------------------------------------------------------------------+
//|  Event handling on chart                                         |
//+------------------------------------------------------------------+
void CFrameViewer::OnChartEvent(const int id,const long &lparam,
                                   const double &dparam,const string &sparam,
                                   const int delay_ms)
  {
//--- Call event handlers for the tab control object and optimization result charts
   this.m_tab_control.OnChartEvent(id, lparam, dparam, sparam);
   this.m_chart_stat_0.OnChartEvent(id, lparam, dparam, sparam);
   this.m_chart_stat_1.OnChartEvent(id, lparam, dparam, sparam);
   this.m_chart_stat_2.OnChartEvent(id, lparam, dparam, sparam);
   this.m_chart_stat_3.OnChartEvent(id, lparam, dparam, sparam);
   this.m_chart_stat_4.OnChartEvent(id, lparam, dparam, sparam);

//--- If chart change event has arrived
   if(id==CHARTEVENT_CHART_CHANGE)
     {
      //--- get chart size
      int w=(int)::ChartGetInteger(0, CHART_WIDTH_IN_PIXELS);
      int h=(int)::ChartGetInteger(0, CHART_HEIGHT_IN_PIXELS);
      if(w!=this.m_w || h!=this.m_h)
        {
         if(w==0 || h==0)
            return;

         //--- Change size of Tab Control
         this.m_tab_control.Resize(w, h);

         //--- Get ID of selected tab and draw data tables and optimization chart on tab
         int tab_selected=this.m_tab_control.GetSelectedTabID();
         this.DrawDataChart(tab_selected);

         //--- Get pointer to toggle button and selected button for printing optimization results
         CButtonSwitch *button_switch=(tab_selected>0 ? this.GetChartStats(tab_selected).ButtonResult() : NULL);
         uint res_index=(button_switch!=NULL ? button_switch.SelectedButton() : -1);

         //--- Depending on selected tab
         switch(tab_selected)
           {
            //--- tab 0 (Optimization)
            case 0 :
               //--- Draw chart with line of last pass and two empty tables
               this.DrawDataChart(0);
               //--- It starts replay of performed optimization,
               //--- which stops working with the rest while replay goes on
               //if(this.m_completed)
               //   this.ReplayFrames(1);
              break;

            //--- tabs 1 - 4
            default:
               //--- Retrieve index of selected optimization pass button
               res_index=button_switch.SelectedButton();
               //--- Draw chart with results of three best passes of selected tab
               this.DrawDataChart(tab_selected);
               this.DrawBestFrameData(tab_selected, -1);
               this.DrawBestFrameData(tab_selected, res_index);

               //--- On tab 0 draw chart with line of last pass and two empty tables
               this.DrawDataChart(0);
               //--- It starts replay of performed optimization,
               //--- which stops working with the rest while replay goes on
               //--- To re-draw charts of all passes, you can click replay button
               //if(this.m_completed)
               //   this.ReplayFrames(1);
              break;
           }

         //--- Remember new dimensions for later verification
         this.m_w=w;
         this.m_h=h;
        }
     }

//--- If optimization process is not completed, exit
   if(!this.m_completed)
      return;

//--- If custom event has arrived
   if(id>CHARTEVENT_CUSTOM)
     {
      //--- If Replay button event has arrived and optimization is complete
      if(sparam==this.m_chart_stat_0.ButtonReplay().Name() && this.m_completed)
        {
         //--- hide Replay button,
         this.m_chart_stat_0.ButtonReplay().Hide();

         //--- Initialize chart of optimization results,
         this.ChartOptDraw(0, this.m_completed, true);

         //--- start replay,
         this.m_completed=false;       // block it so as not to run it several times in a row
         this.ReplayFrames(delay_ms);  // replay procedure
         this.m_completed=true;        // unlock

         //--- After replay is complete, show Replay button and redraw chart
         this.m_chart_stat_0.ButtonReplay().Show();
         ::ChartRedraw();
        }

      //--- Get pointers to tab buttons
      CTabButton *tab_btn0=this.m_tab_control.GetTabButton(0);
      CTabButton *tab_btn1=this.m_tab_control.GetTabButton(1);
      CTabButton *tab_btn2=this.m_tab_control.GetTabButton(2);
      CTabButton *tab_btn3=this.m_tab_control.GetTabButton(3);
      CTabButton *tab_btn4=this.m_tab_control.GetTabButton(4);
      if(tab_btn0==NULL || tab_btn1==NULL || tab_btn2==NULL || tab_btn3==NULL || tab_btn4==NULL)
         return;

      //--- Get ID of selected tab
      int tab_selected=this.m_tab_control.GetSelectedTabID();

      //--- If switch event has arrived to tab 0
      if(sparam==tab_btn0.Name())
        {
         //--- On tab 0, draw chart with last pass line and two tables with empty results
         this.DrawDataChart(0);
         //--- It starts replay of performed optimization
         //--- (it can take a long time - if desired, you can click Replay button to print charts)
         //if(this.m_completed)
         //   this.ReplayFrames(1);
         ::ChartRedraw();
         return;
        }

      //--- Get pointer to chart of selected tab
      CStatChart *chart_stat=this.GetChartStats(tab_selected);
      if(tab_selected==0 || chart_stat==NULL)
         return;
      //--- Get pointers to chart buttons of selected tab (tab index 1-4)
      CButtonTriggered *button_min=chart_stat.ButtonResultMin();
      CButtonTriggered *button_mid=chart_stat.ButtonResultMid();
      CButtonTriggered *button_max=chart_stat.ButtonResultMax();
      if(button_min==NULL || button_mid==NULL || button_max==NULL)
         return;

      //--- If switch event has arrived to tab 1
      if(sparam==tab_btn1.Name())
        {
         //--- call handler for switching to tab
         this.OnTabSwitchEvent(1);
        }
      //--- If switch event has arrived to tab 2
      if(sparam==tab_btn2.Name())
        {
         //--- call handler for switching to tab
         this.OnTabSwitchEvent(2);
        }
      //--- If switch event has arrived to tab 3
      if(sparam==tab_btn3.Name())
        {
         //--- call handler for switching to tab
         this.OnTabSwitchEvent(3);
        }
      //--- If switch event has arrived to tab 4
      if(sparam==tab_btn4.Name())
        {
         //--- call handler for switching to tab
         this.OnTabSwitchEvent(4);
        }

      //--- If event has arrived click on minimum result button of selected tab
      if(sparam==button_min.Name())
        {
         //--- call handler for toggle button switching
         this.OnButtonSwitchEvent(tab_selected, 0);
        }
      //--- If event has arrived click on mid result button of selected tab
      if(sparam==button_mid.Name())
        {
         //--- call handler for toggle button switching
         this.OnButtonSwitchEvent(tab_selected, 1);
        }
      //--- If event has arrived click on max result button of selected tab
      if(sparam==button_max.Name())
        {
         //--- call handler for toggle button switching
         this.OnButtonSwitchEvent(tab_selected, 2);
        }
     }
  }
タブコントロールのタブ切り替えイベントやトグルボタンのクリックは、それぞれ対応するカスタムハンドラで処理されます。これらのハンドラ内でおこなわれる操作は基本的に同一で、異なるのはタブの識別子(ID)だけです。そのため、これらのイベントはそれぞれ専用のハンドラで処理されるように設計されています。
以下は、タブ切り替えハンドラです。
//+------------------------------------------------------------------+
//| ▸Tab switching handler                                           |
//+------------------------------------------------------------------+
void CFrameViewer::OnTabSwitchEvent(const int tab_id)
  {
   //--- Get pointer to chart of selected tab
   CStatChart *chart_stat=this.GetChartStats(tab_id);
   if(chart_stat==NULL)
      return;

   //--- Get pointer to chart toggle button of selected tab
   CButtonSwitch *button_switch=chart_stat.ButtonResult();
   if(button_switch==NULL)
      return;

   //--- Index of pressed button
   uint butt_index=button_switch.SelectedButton();
   //--- Initialize chart of results on tab_id and
   this.DrawDataChart(tab_id);
   //--- call method that controls display of control elements on all tabs
   this.ControlObjectsView(tab_id);

   //--- Draw all three best passes
   this.DrawBestFrameData(tab_id, -1);
   //--- Highlight pass selected by button
   this.DrawBestFrameData(tab_id, butt_index);
  }
以下は、トグルボタン切り替えハンドラです。
//+------------------------------------------------------------------+
//| Handler for toggle button switching                              |
//+------------------------------------------------------------------+
void CFrameViewer::OnButtonSwitchEvent(const int tab_id, const uint butt_id)
  {
   //--- Initialize chart of results on tab_id
   this.DrawDataChart(tab_id);
   //--- Draw all three best passes
   this.DrawBestFrameData(tab_id, -1);
   //--- Highlight pass selected by butt_id button
   this.DrawBestFrameData(tab_id, butt_id);
  }
以下は、データテーブルと最適化チャートを描画するメソッドです。
//+------------------------------------------------------------------+
//| Draws data tables and optimization chart                         |
//+------------------------------------------------------------------+
void CFrameViewer::DrawDataChart(const uint tab_id)
  {
//--- Draw table of statistics, table of input parameters, and optimization chart
   this.TableStatDraw(tab_id, 4, 4, CELL_W*2, CELL_H, false);
   this.TableInpDraw(tab_id, 4, this.GetTableStats(tab_id).Y2()+4, CELL_W*2, CELL_H, this.GetTableInputs(tab_id).RowsTotal(), false);
   this.ChartOptDraw(tab_id, this.m_completed, true);
   //--- call method that controls display of control elements on all tabs
   this.ControlObjectsView(tab_id);
  }
すべてのテーブルやチャートが描画された後は、コントロールを正しく配置する必要があります。非アクティブなタブ上のボタンは非表示にし、アクティブなタブ上のボタンは表示するようにします。これはControlObjectsViewメソッドで実装されています。
以下は、最適化チャート上のコントロールの表示を制御するメソッドです。
//+-------------------------------------------------------------------+
//|Controls view of control objects on optimization charts            |
//+-------------------------------------------------------------------+
void CFrameViewer::ControlObjectsView(const uint tab_id)
  {
//--- Get index of active tab
   int tab_index=this.m_tab_control.GetSelectedTabID();

//--- Get pointer to active tab and optimization statistics table
   CTab              *tab=this.m_tab_control.GetTab(tab_index);
   CTableDataControl *table_stat=this.GetTableStats(tab_index);

   if(tab==NULL || table_stat==NULL)
      return;

//--- Coordinates of left and right boundaries of header of optimization results chart
   int w=0, cpx=0, x=0, y=0;
   int x1=table_stat.X2()+10;
   int x2=tab.GetField().Right()-10;

//--- Depending on selected tab index
   switch(tab_index)
     {
      //--- Optimization
      case 0 :
         //--- Shift Replay button to center of header
         w=this.m_chart_stat_0.ButtonReplay().Width();
         cpx=(x1+x2)/2;
         x=cpx-w/2;
         this.m_chart_stat_0.ButtonReplay().MoveX(x);

         //--- If optimization is completed, show button in foreground
         if(this.m_completed)
           {
            this.m_chart_stat_0.ButtonReplay().Show();
            this.m_chart_stat_0.ButtonReplay().BringToTop();
           }

         //--- Hide buttons of all other tabs
         this.m_chart_stat_1.ButtonsResultHide();
         this.m_chart_stat_2.ButtonsResultHide();
         this.m_chart_stat_3.ButtonsResultHide();
         this.m_chart_stat_4.ButtonsResultHide();
        break;

      //--- Sharpe Ratio
      case 1 :
         //--- Hide Replay button
         this.m_chart_stat_0.ButtonReplay().Hide();

         //--- Get Y coordinate and move toggle button to it
         y=this.m_chart_stat_1.ProgressBarY1()+CELL_H+2;
         this.m_chart_stat_1.ButtonResult().MoveY(y);

         //--- Move toggle button on tab 1 to foreground,
         //--- and hide all other buttons on other tabs
         this.m_chart_stat_1.ButtonsResultBringToTop();
         this.m_chart_stat_2.ButtonsResultHide();
         this.m_chart_stat_3.ButtonsResultHide();
         this.m_chart_stat_4.ButtonsResultHide();
        break;

      //--- Net Profit
      case 2 :
         this.m_chart_stat_0.ButtonReplay().Hide();

         //--- Get Y coordinate and move toggle button to it
         y=this.m_chart_stat_2.ProgressBarY1()+CELL_H+2;
         this.m_chart_stat_2.ButtonResult().MoveY(y);

         //--- Move toggle button on tab 2 to foreground,
         //--- and hide all other buttons on other tabs
         this.m_chart_stat_2.ButtonsResultBringToTop();
         this.m_chart_stat_1.ButtonsResultHide();
         this.m_chart_stat_3.ButtonsResultHide();
         this.m_chart_stat_4.ButtonsResultHide();
        break;

      //--- Profit Factor
      case 3 :
         this.m_chart_stat_0.ButtonReplay().Hide();

         //--- Get Y coordinate and move toggle button to it
         y=this.m_chart_stat_3.ProgressBarY1()+CELL_H+2;
         this.m_chart_stat_3.ButtonResult().MoveY(y);

         //--- Move toggle button on tab 3 to foreground,
         //--- and hide all other buttons on other tabs
         this.m_chart_stat_3.ButtonsResultBringToTop();
         this.m_chart_stat_1.ButtonsResultHide();
         this.m_chart_stat_2.ButtonsResultHide();
         this.m_chart_stat_4.ButtonsResultHide();
        break;

      //--- Recovery Factor
      case 4 :
         this.m_chart_stat_0.ButtonReplay().Hide();

         //--- Get Y coordinate and move toggle button to it
         y=this.m_chart_stat_4.ProgressBarY1()+CELL_H+2;
         this.m_chart_stat_4.ButtonResult().MoveY(y);

         //--- Move toggle button on tab 4 to foreground,
         //--- and hide all other buttons on other tabs
         this.m_chart_stat_4.ButtonsResultBringToTop();
         this.m_chart_stat_1.ButtonsResultHide();
         this.m_chart_stat_2.ButtonsResultHide();
         this.m_chart_stat_3.ButtonsResultHide();
        break;
      default:
        break;
     }
//--- Redraw chart
   ::ChartRedraw();
  }
以下は、最適化が完了した後にフレームを再生するメソッドです。
//+------------------------------------------------------------------+
//| Replaying frames after optimization completion                   |
//+------------------------------------------------------------------+
void CFrameViewer::ReplayFrames(const int delay_ms)
  {
//--- Variables to work with frames
   string name;
   ulong  pass;
   long   id;
   double value, data[];
   string params[];
   uint   par_count;

//--- Frame counter
   int frame_counter=0;

//--- Reset progress bar counters
   this.m_progress_bar.Reset();
   this.m_progress_bar.Update(false);

//--- Move frame pointer to the beginning and start iterating through frames
   ::FrameFirst();
   while(!::IsStopped() && ::FrameNext(pass, name, id, value, data))
     {
      //--- Increase frame counter and prepare header text of optimization chart
      frame_counter++;
      string text=::StringFormat("Playing with pause %d ms: frame %d", delay_ms, frame_counter);
      //--- Get input parameters of Expert Advisor, for which frame is formed, frame data, and print them on chart
      if(this.DrawFrameData(0, text, clrNONE, 0, pass, params, par_count, data))
         ::ChartRedraw();

      //--- Wait for delay_ms milliseconds
      ::Sleep(delay_ms);
     }
  }
最適化が完了した後は、受信したすべてのフレームを閲覧できるようになります。ここでは、シンプルなループを使って最初のフレームから順にすべてのフレームを辿り、そのデータをテーブルやチャート上に表示します。
以下は、最適化チャート上で指定したフレームのデータを表示するメソッドです。
//+------------------------------------------------------------------+
//| Prints data of specified frame on optimization chart             |
//+------------------------------------------------------------------+
bool CFrameViewer::DrawFrameDataByPass(const uint tab_id, const ulong pass_num, const string text, color clr, const uint line_width, double &data[])
  {
//--- Variables to work with frames
   string name;
   ulong  pass;
   long   id;
   uint   par_count;
   double value;
   string params[];

//--- Move frame pointer to the beginning and start search of pass_num frame
   ::FrameFirst();
   while(::FrameNext(pass, name, id, value, data))
     {
      //--- If passe number matches the desired one -
      //--- get frame data and print it in table
      //--- and on chart on tab tab_id
      if(pass==pass_num)
        {
         if(DrawFrameData(tab_id, text, clr, line_width, pass, params, par_count, data))
            return true;
        }
     }
//--- Pass not found
   return false;
  }
最適化後に利用可能なフレームは、FrameFirst()-->FrameNext()のループでしか取得できません。標準の方法を使うと、ここではすべてのフレームを順にループし、目的のパス番号を持つフレームを探します。目的のフレームが見つかると、そのデータがチャート上に表示されます。
基本的に、最適化後にはすでにフレームオブジェクトのリストが用意されており、このリストから必要なオブジェクトを素早く取得できます。そのようなアクセス方法も可能ですが、その場合はフレームオブジェクトやデータ列配列からデータを取得し、必要な形式に変換してチャートに描画するためのメソッドをさらに実装する必要があります。現状では、クラス内のコード量を減らし理解を簡単にするため、上記のメソッドで示した方法のままアクセスをおこなっています。
以下は、最適化基準ごとの上位3つのパスのチャートを描画するメソッドです。
//+------------------------------------------------------------------+
//| Draws charts of top three passes by optimization criterion       |
//+------------------------------------------------------------------+
void CFrameViewer::DrawBestFrameData(const uint tab_id, const int res_index)
  {
//--- If incorrect identifiers of table and pressed button are passed, exit
   if(tab_id<1 || tab_id>4 || res_index>2)
     {
      ::PrintFormat("%s: Error. Incorrect table (%u) or selected button (%d) identifiers passed",__FUNCTION__, tab_id, res_index);
      return;
     }

//--- Arrays for getting results of passes
   ulong array_passes[3];
   double data[];

//--- Create header text of pass chart
   string res=
     (
      tab_id==1 ? "Results by Sharpe Ratio"     :
      tab_id==2 ? "Results by Net Profit"       :
      tab_id==3 ? "Results by Profit Factor"    :
      tab_id==4 ? "Results by Recovery Factor"  :
      ""
     );
   string text="Optimization Completed: "+res;

//--- Fill in array_passes array by indexes of three best passes
   this.FillArrayBestFrames(tab_id, array_passes);
//--- If index of pass button is set to negative number -
   if(res_index<0)
     {
      //--- print all three passes on chart
      //--- (line color is specified as clrNONE for automatic line color selection of profitable or loss series)
      for(int i=0; i<(int)array_passes.Size(); i++)
         this.DrawFrameDataByPass(tab_id, array_passes[i], text, clrNONE, 0, data);
     }
   //--- Otherwise, print series indicated by index of pressed button on chart (res_index),
   //--- by color set in m_selected_color, and width specified in m_line_width
   else
      this.DrawFrameDataByPass(tab_id, array_passes[res_index], text, this.m_selected_color, this.m_line_width, data);
  }
ここではまず、FillArrayBestFrames()メソッドで、指定された最適化基準に対する上位3つのパスのフレームインデックスを配列に格納します。その後、目的のパス(または3つすべて)をチャート上に描画します。
以下は、指定した最適化基準に対して上位3つのパスのフレームインデックスを配列に格納するメソッドです。
//+------------------------------------------------------------------+
//| Fills array with frame indexes of top three passes               |
//| for specified optimization criterion (by tab index)              |
//+------------------------------------------------------------------+
bool CFrameViewer::FillArrayBestFrames(const uint tab_id, ulong &array_passes[])
  {
//--- Clear array of optimization pass indexes passed to method
   ::ZeroMemory(array_passes);

   //FRAME_PROP_PASS_NUM,           // Pass number
   //FRAME_PROP_SHARPE_RATIO,       // Sharpe Ratio result
   //FRAME_PROP_NET_PROFIT,         // Net Profit result
   //FRAME_PROP_PROFIT_FACTOR,      // Profit Factor result
   //FRAME_PROP_RECOVERY_FACTOR,    // Recovery Factor result

//--- By using tab ID, determine property by which best optimization passes will be searched
//--- Check tab ID to be within 1 to 4
   if(tab_id<FRAME_PROP_SHARPE_RATIO || tab_id>FRAME_PROP_RECOVERY_FACTOR)
     {
      ::PrintFormat("%s: Error: Invalid tab ID passed (%u)",__FUNCTION__, tab_id);
      return false;
     }

//--- Convert table ID to frame property
   ENUM_FRAME_PROP prop=(ENUM_FRAME_PROP)tab_id;

//--- Sort frame list in ascending order by property,
//--- which corresponds to tab_id value as ENUM_FRAME_PROP
   this.m_list_frames.Sort(prop);

//--- After sorting, frame with best result will be at list end
//--- Using index, get frame from list with maximum result value and
   int index=this.m_list_frames.Total()-1;
   CFrameData *frame_next=this.m_list_frames.At(index);
   if(frame_next==NULL)
      return false;

//--- register pass number to last cell of array_passes
   array_passes[2]=frame_next.Pass();

//--- Now find objects for which optimization result in descending order is less than maximum found
//--- In loop from 1 to 0 (remaining cells of array_passes)
   for(int i=1; i>=0; i--)
     {
      //--- look for previous object with property value less than that of frame_next object
      frame_next=this.FrameSearchLess(frame_next, prop);
      //--- In next cell of array_passes, enter pass number of found object
      //--- If object is not found, it means that there are no objects with value less than that of frame_next object,
      //--- and in this case, enter its previous value to next cell of array_passes
      array_passes[i]=(frame_next!=NULL ? frame_next.Pass() : array_passes[i+1]);
     }
//--- Success
   return true;
  }
メソッド全体のロジックは、コード内のコメントで完全に説明されています。メソッドの実行が終了すると、配列にはサイズ3で、該当するタブ番号(そのタブ上のチャートにこれらのパスのデータを表示する必要がある)に対応する最適化基準による上位3つのパスの番号が格納されます。現在の値よりも小さいプロパティ値を持つフレームを検索するために、FrameSearchLess()メソッドが使用されます。
以下は、サンプルよりも小さいプロパティ値を持つフレームオブジェクトへのポインタを検索して返すメソッドです。
//+------------------------------------------------------------------+
//| Searches for and returns pointer to frame object,                |
//| with property value less than sample                             |
//+------------------------------------------------------------------+
CFrameData *CFrameViewer::FrameSearchLess(CFrameData *frame, const int mode)
  {
//--- Depending on type of frame property
   switch(mode)
     {
      //--- to temporary object record corresponding property of object passed to method
      case FRAME_PROP_SHARPE_RATIO     :  this.m_frame_tmp.SetSharpeRatio(frame.SharpeRatio());       break;
      case FRAME_PROP_NET_PROFIT       :  this.m_frame_tmp.SetNetProfit(frame.NetProfit());           break;
      case FRAME_PROP_PROFIT_FACTOR    :  this.m_frame_tmp.SetProfitFactor(frame.ProfitFactor());     break;
      case FRAME_PROP_RECOVERY_FACTOR  :  this.m_frame_tmp.SetRecoveryFactor(frame.RecoveryFactor()); break;
      default                          :  this.m_frame_tmp.SetPass(frame.Pass());                     break;
     }
//--- Sort array of frames by specified property and
   this.m_list_frames.Sort(mode);
//--- get index of nearest object with lower property value, or -1
   int index=this.m_list_frames.SearchLess(&this.m_frame_tmp);
//--- Get object by index from list and return pointer to it, or NULL
   CFrameData *obj=this.m_list_frames.At(index);
   return obj;
  }
メソッドにはフレームが渡され、ソート済みのフレームリスト内で、標準ライブラリのCArrayObjクラスのSearchLess()メソッドを使用して、渡されたフレームよりもプロパティ値が小さい最も近いオブジェクトを検索します。
以下は、各タブの最適化結果チャートにおいて、上位3つのパスを表示するメソッドです。
//+------------------------------------------------------------------+
//| Prints on optimization results charts                            |
//| on each tab three best passes                                    |
//+------------------------------------------------------------------+
void CFrameViewer::DrawBestFrameDataAll(void)
  {
//--- In a loop through all tabs from tab 1, draw charts of top three passes for each tab
   for(int i=1; i<this.m_tab_control.TabsTotal(); i++)
      this.DrawBestFrameData(i,-1);
  }
以下は、現在のフレームのデータを取得し、指定されたタブのテーブルおよび最適化結果チャート上に表示するメソッドです。
//+-------------------------------------------------------------------+ //| Retrieving data of current frame and printing it on specified tab | //| in table and on optimization results chart | //+-------------------------------------------------------------------+ bool CFrameViewer::DrawFrameData(const uint tab_id, const string text, color clr, const uint line_width, ulong &pass, string ¶ms[], uint &par_count, double &data[]) { //--- Check passed tab ID if(tab_id>4) { ::PrintFormat("%s: Error: Invalid tab ID passed (%u)",__FUNCTION__, tab_id); return false; } //--- Get pointers to objects used on specified tab CCanvas *foreground=this.m_tab_control.GetTabForeground(tab_id); CTableDataControl *table_stat=this.GetTableStats(tab_id); CTableDataControl *table_inp=this.GetTableInputs(tab_id); CStatChart *chart_stat=this.GetChartStats(tab_id); if(foreground==NULL || table_stat==NULL || table_inp==NULL || chart_stat==NULL) return false; //--- Get input parameters of Expert Advisor, for which frame is formed, frame data, and print them on chart ::ResetLastError(); if(::FrameInputs(pass, params, par_count)) { //--- Draw table of input parameters on chart this.TableInpDraw(tab_id, 4, table_stat.Y2()+4, CELL_W*2, CELL_H, par_count, false); //--- Iterate through parameters, params[i], string looks as "parameter=value" for(uint i=0; i<par_count; i++) { //--- Fill in table with names and values of input parameters string array[]; //--- Split string in params[i] into two substrings and update cells in string of test parameters table if(::StringSplit(params[i],'=',array)==2) { //--- Fill in strings of optimized parameters with pale yellow color, //--- parameters that are not available for optimization - to pale pink, the rest - to default colors bool enable=false; double value=0, start=0, step=0, stop=0; color clr=clrMistyRose; if(::ParameterGetRange(array[0], enable, value, start, step, stop)) clr=(enable ? clrLightYellow : clrNONE); //--- Get two cells of table by parameter index and print text of parameter name and its value to them CTableCell *cell_0=table_inp.GetCell(i, 0); CTableCell *cell_1=table_inp.GetCell(i, 1); if(cell_0!=NULL && cell_1!=NULL) { //--- Update captions in cells cell_0.SetText(array[0]); cell_1.SetText(array[1]); cell_0.TextOut(foreground, 4, CELL_H/2, clr, 0, TA_VCENTER); cell_1.TextOut(foreground, 4, CELL_H/2, clr, 0, TA_VCENTER); } } } //--- Update optimization statistics table //--- Table header string foreground.FillRectangle(table_stat.X1()+1, 4+1, table_stat.X1()+CELL_W*2-1, 4+CELL_H-1, 0x00FFFFFF); foreground.FontSet("Calibri", -100, FW_BLACK); foreground.TextOut(4+(CELL_W*2)/2, 4+CELL_H/2, ::StringFormat("Optimization results (pass %I64u)", pass), ::ColorToARGB(clrMidnightBlue), TA_CENTER|TA_VCENTER); //--- In loop by number of strings in table int total=table_stat.RowsTotal(); for(int i=0; i<total; i++) { //--- get two cells of current string and CTableCell *cell_0=table_stat.GetCell(i, 0); CTableCell *cell_1=table_stat.GetCell(i, 1); if(cell_0!=NULL && cell_1!=NULL) { //--- update values of pass results in second cell string text="---"; switch(i) { case 0 : text=::StringFormat("%.2f", data[0]); break; // Sharpe Ratio case 1 : text=::StringFormat("%.2f", data[1]); break; // Net Profit case 2 : text=::StringFormat("%.2f", data[2]); break; // Profit Factor case 3 : text=::StringFormat("%.2f", data[3]); break; // Recovery Factor case 4 : text=::StringFormat("%.0f", data[4]); break; // Trades case 5 : text=::StringFormat("%.0f", data[5]); break; // Deals case 6 : text=::StringFormat("%.2f%%", data[6]);break; // Equity DD case 7 : text=::StringFormat("%G", data[7]); break; // OnTester() default: break; } //--- Highlight background of table string corresponding to selected tab with color. //--- Remaining strings will have default color color clr=(tab_id>0 ? (i==tab_id-1 ? C'223,242,231' : clrNONE) : clrNONE); //--- Update captions in cells cell_0.TextOut(foreground, 4, CELL_H/2, clr, 0, TA_VCENTER); cell_1.SetText(text); cell_1.TextOut(foreground, 4, CELL_H/2, clr, 0, TA_VCENTER); } } //--- Array for accepting values of balance of current frame double seria[]; ::ArrayCopy(seria, data, 0, DATA_COUNT, ::ArraySize(data)-DATA_COUNT); //--- Send array for printing on special balance chart chart_stat.AddSeria(seria, data[1]>0); //--- Update balance lines on chart chart_stat.Update(clr, line_width, false); //--- Update progress bar (only for tab with ID 0) if(tab_id==0) this.m_progress_bar.AddResult(data[1]>0, false); //--- Update caption on chart header int x1=chart_stat.HeaderX1(); int y1=chart_stat.HeaderY1(); int x2=chart_stat.HeaderX2(); int y2=chart_stat.HeaderY2(); int x=(x1+x2)/2; int y=(y1+y2)/2; foreground.FillRectangle(x1, y1, x2, y2, 0x00FFFFFF); foreground.FontSet("Calibri", -100, FW_BLACK); foreground.TextOut(x, y, text, ::ColorToARGB(clrMidnightBlue), TA_CENTER|TA_VCENTER); foreground.Update(false); //--- Success return true; } //--- Failed... else PrintFormat("%s: FrameInputs() failed. Error %d",__FUNCTION__, ::GetLastError()); return false; }
このメソッドでは、フレームからデータを取得し、そのデータですべてのテーブルを埋め、当該最適化パスのバランス曲線を描画します。
以下は、指定されたタブに最適化統計のテーブルを描画するメソッドです。
//+------------------------------------------------------------------+
//| Draws table of optimization statistics on specified tab          |
//+------------------------------------------------------------------+
void CFrameViewer::TableStatDraw(const uint tab_id, const int x, const int y, const int w, const int h, const bool chart_redraw)
  {
//--- Check passed tab ID
   if(tab_id>4)
     {
      ::PrintFormat("%s: Error: Invalid tab ID passed (%u)",__FUNCTION__, tab_id);
      return;
     }
//--- Get pointers to objects used on specified tab
   CCanvas           *background=this.m_tab_control.GetTabBackground(tab_id);
   CCanvas           *foreground=this.m_tab_control.GetTabForeground(tab_id);
   CTableDataControl *table_stat=this.GetTableStats(tab_id);

   if(background==NULL || foreground==NULL || table_stat==NULL)
      return;

//--- Draw header of optimization results table
   background.FillRectangle(x, y, x+CELL_W*2, y+CELL_H, ::ColorToARGB(C'195,209,223'));   // C'180,190,230'
   foreground.FillRectangle(x+1, y+1, x+CELL_W*2-1, y+CELL_H-1, 0x00FFFFFF);
   foreground.FontSet("Calibri", -100, FW_BLACK);
   foreground.TextOut(x+(CELL_W*2)/2, y+CELL_H/2, "Optimization results", ::ColorToARGB(clrMidnightBlue), TA_CENTER|TA_VCENTER);

//--- Set table's identifier and draw table grid
   table_stat.SetID(TABLE_OPT_STAT_ID+10*tab_id);
   table_stat.DrawGrid(background, x, y+CELL_H, 0, DATA_COUNT, 2, CELL_H, CELL_W, C'200,200,200', false);

//--- Draw empty table of optimization results - only headers, without values
//--- In a loop by table rows
   int total=table_stat.RowsTotal();
   for(int row=0; row<total; row++)
     {
      //--- iterate through columns of rows
      for(int col=0; col<2; col++)
        {
         //--- Get table cell in current row and column
         CTableCell *cell=table_stat.GetCell(row, col);
         //--- Define text in cell
         //--- For left cell, these will be headers of results of parameters optimized
         if(col%2==0)
           {
            string text="OnTester()";
            switch(row)
              {
               case 0 : text="Sharpe Ratio";    break;
               case 1 : text="Net Profit";      break;
               case 2 : text="Profit Factor";   break;
               case 3 : text="Recovery Factor"; break;
               case 4 : text="Trades";          break;
               case 5 : text="Deals";           break;
               case 6 : text="Equity DD";       break;
               default: break;
              }
            cell.SetText(text);
           }
         //--- For right cell, text will be strikeout for table initialized
         else
            cell.SetText(tab_id==0 ? " --- " : "");

         //--- Print corresponding text in cell
         cell.TextOut(foreground, 4, CELL_H/2, clrNONE, 0, TA_VCENTER);
        }
     }

//--- Update background and foreground canvas
   background.Update(false);
   foreground.Update(chart_redraw);
  }
このメソッドは最適化結果のテーブルを描画し、テーブルの行ヘッダのみに入力します。データセルへの入力は、前述のメソッドによっておこなわれます。
以下は、指定されたタブに入力最適化パラメータのテーブルを描画するメソッドです。
//+------------------------------------------------------------------+
//|Draws table of input optimization parameters on the specified tab |
//+------------------------------------------------------------------+
void CFrameViewer::TableInpDraw(const uint tab_id, const int x, const int y, const int w, const int h, const uint rows, const bool chart_redraw)
  {
//--- Check passed tab ID
   if(tab_id>4)
     {
      ::PrintFormat("%s: Error: Invalid tab ID passed (%u)",__FUNCTION__, tab_id);
      return;
     }
//--- Get pointers to objects used on specified tab
   CCanvas           *background=this.m_tab_control.GetTabBackground(tab_id);
   CCanvas           *foreground=this.m_tab_control.GetTabForeground(tab_id);
   CTableDataControl *table_inp=this.GetTableInputs(tab_id);

   if(background==NULL || foreground==NULL || table_inp==NULL)
      return;

//--- Draw header of optimization parameters table
   background.FillRectangle(x, y, x+CELL_W*2, y+CELL_H, ::ColorToARGB(C'195,209,223'));
   foreground.FillRectangle(x+1, y+1, x+CELL_W*2-1, y+CELL_H-1, 0x00FFFFFF);
   foreground.FontSet("Calibri", -100, FW_BLACK);
   foreground.TextOut(x+(CELL_W*2)/2, y+CELL_H/2, "Input parameters", ::ColorToARGB(clrMidnightBlue), TA_CENTER|TA_VCENTER);

//--- Set table's identifier and draw table grid
   table_inp.SetID(TABLE_OPT_INP_ID+10*tab_id);
   table_inp.DrawGrid(background, x, y+CELL_H, 0, rows, 2, CELL_H, CELL_W, C'200,200,200', false);

//--- Update background and foreground canvas
   background.Update(false);
   foreground.Update(chart_redraw);
  }
このメソッドも前のメソッドと同様に、最適化パラメータの空のテーブルを描画します。このテーブルは、テスターのパスがどのパラメータで実行されたかが判明しているDrawFrameData()メソッド内でデータが入力されます。
以下は、指定されたタブに最適化チャートを描画するメソッドです。
//+------------------------------------------------------------------+
//| Draws chart of optimization on specified tab                     |
//+------------------------------------------------------------------+
void CFrameViewer::ChartOptDraw(const uint tab_id, const bool opt_completed, const bool chart_redraw)
  {
//--- Check passed tab ID
   if(tab_id>4)
     {
      ::PrintFormat("%s: Error: Invalid tab ID passed (%u)",__FUNCTION__, tab_id);
      return;
     }
//--- Get pointers to objects used on specified tab
   CCanvas           *background=this.m_tab_control.GetTabBackground(tab_id);
   CCanvas           *foreground=this.m_tab_control.GetTabForeground(tab_id);
   CTab              *tab=this.m_tab_control.GetTab(tab_id);
   CTableDataControl *table_stat=this.GetTableStats(tab_id);
   CStatChart        *chart_stat=this.GetChartStats(tab_id);

   if(background==NULL || foreground==NULL || tab==NULL || table_stat==NULL || chart_stat==NULL)
      return;

//--- Calculate coordinates of four corners of optimization results chart
   int x1=table_stat.X2()+10;
   int y1=table_stat.Y1();
   int x2=tab.GetField().Right()-10;
   int y2=tab.GetField().Bottom()-tab.GetButton().Height()-12;

//--- Check size limits by minimum width and height (480 x 180)
   int w_min=480;
   if(x2-x1<w_min)
      x2=x1+w_min;
   if(y2-y1<180)
      y2=y1+180;

//--- Set dimensions of bounding rectangle of optimization results chart
   chart_stat.SetChartBounds(x1, y1, x2, y2);

//--- Color and text of chart header
   color clr=clrLightGreen;   // header color at optimization completion
   string suff=
     (
      tab_id==1 ? "Results by Sharpe Ratio"     :
      tab_id==2 ? "Results by Net Profit"       :
      tab_id==3 ? "Results by Profit Factor"    :
      tab_id==4 ? "Results by Recovery Factor"  :
                     "Click to Replay"
     );
   string text="Optimization Completed: "+suff;

//--- If optimization is not completed, specify color and text of header
   if(!opt_completed)
     {
      clr=C'195,209,223';
      text=::StringFormat("Optimization%sprogress%s", (tab_id==0 ? " " : " in "), (tab_id==0 ? "" : ": Waiting ... "));
     }

//--- Draw header and text
   background.FillRectangle(x1, 4, x2, y1, ::ColorToARGB(clr));
   foreground.FillRectangle(x1, 4, x2, y2, 0x00FFFFFF);
   foreground.FontSet("Calibri", -100, FW_BLACK);
   foreground.TextOut((x1+x2)/2, 4+CELL_H/2, text, ::ColorToARGB(clrMidnightBlue), TA_CENTER|TA_VCENTER);

//--- Erase whole chart of optimization results
   background.FillRectangle(x1, y1, x2, y2, 0x00FFFFFF);
   foreground.FillRectangle(x1, y1, x2, y2, 0x00FFFFFF);

//--- Update optimization chart
   chart_stat.Update(clrNONE, 0, chart_redraw);
  }
このメソッドは、ヘッダ付きの空のチャートを準備し、完了した最適化パスのバランス曲線を描画メソッドを使ってチャート上に表示します。
視覚的最適化に必要なすべてのクラスの実装が完了しました。これで、CFrameViewerクラスのファイルを任意のEAに組み込むことで、ターミナル上の別チャートに最適化の進行状況を表示できるようになります。
エキスパートアドバイザーへの機能の接続
それでは、現在の状態を確認しましょう。
標準配信のEAを「\MQL5\Experts\Advisors\ExpertMAMA.mq5」から取得します。これを、事前に作成した新しいフォルダ\MQL5\Experts\FrameViewer\にExpertMAMA_Frames.mq5という名前で保存します。
これに追加する必要があるのは、リストの末尾でCFrameViewerクラスファイルをインクルードすること、このクラス型のオブジェクトを宣言すること、作成したクラス内の同名ハンドラーを呼び出すハンドラを追加することです。
また、EAの入力変数名に含まれているアンダースコア(「_」)を削除して、変数名を少し短くすることも可能です。これにより、テーブルのセル幅内により収まりやすくなります。
//+------------------------------------------------------------------+
//|                                                   ExpertMAMA.mq5 |
//|                             Copyright 2000-2025, MetaQuotes Ltd. |
//|                                             https://www.mql5.com |
//+------------------------------------------------------------------+
#property copyright "Copyright 2000-2025, MetaQuotes Ltd."
#property link      "https://www.mql5.com"
#property version   "1.00"
//+------------------------------------------------------------------+
//| Include                                                          |
//+------------------------------------------------------------------+
#include <Expert\Expert.mqh>
#include <Expert\Signal\SignalMA.mqh>
#include <Expert\Trailing\TrailingMA.mqh>
#include <Expert\Money\MoneyNone.mqh>
//+------------------------------------------------------------------+
//| Inputs                                                           |
//+------------------------------------------------------------------+
//--- inputs for expert
input string             InpExpertTitle      =  "ExpertMAMA";
int                      Expert_MagicNumber  =  12003;
bool                     Expert_EveryTick    =  false;
//--- inputs for signal
input int                InpSignalMAPeriod   =  12;
input int                InpSignalMAShift    =  6;
input ENUM_MA_METHOD     InpSignalMAMethod   =  MODE_SMA;
input ENUM_APPLIED_PRICE InpSignalMAApplied  =  PRICE_CLOSE;
//--- inputs for trailing
input int                InpTrailingMAPeriod =  12;
input int                InpTrailingMAShift  =  0;
input ENUM_MA_METHOD     InpTrailingMAMethod =  MODE_SMA;
input ENUM_APPLIED_PRICE InpTrailingMAApplied=  PRICE_CLOSE;
//+------------------------------------------------------------------+
//| Global expert object                                             |
//+------------------------------------------------------------------+
CExpert ExtExpert;
//+------------------------------------------------------------------+
//| Initialization function of the expert                            |
//+------------------------------------------------------------------+
int OnInit(void)
  {
//--- Initializing expert
   if(!ExtExpert.Init(Symbol(),Period(),Expert_EveryTick,Expert_MagicNumber))
     {
      //--- failed
      printf(__FUNCTION__+": error initializing expert");
      ExtExpert.Deinit();
      return(-1);
     }
//--- Creation of signal object
   CSignalMA *signal=new CSignalMA;
   if(signal==NULL)
     {
      //--- failed
      printf(__FUNCTION__+": error creating signal");
      ExtExpert.Deinit();
      return(-2);
     }
//--- Add signal to expert (will be deleted automatically))
   if(!ExtExpert.InitSignal(signal))
     {
      //--- failed
      printf(__FUNCTION__+": error initializing signal");
      ExtExpert.Deinit();
      return(-3);
     }
//--- Set signal parameters
   signal.PeriodMA(InpSignalMAPeriod);
   signal.Shift(InpSignalMAShift);
   signal.Method(InpSignalMAMethod);
   signal.Applied(InpSignalMAApplied);
//--- Check signal parameters
   if(!signal.ValidationSettings())
     {
      //--- failed
      printf(__FUNCTION__+": error signal parameters");
      ExtExpert.Deinit();
      return(-4);
     }
//--- Creation of trailing object
   CTrailingMA *trailing=new CTrailingMA;
   if(trailing==NULL)
     {
      //--- failed
      printf(__FUNCTION__+": error creating trailing");
      ExtExpert.Deinit();
      return(-5);
     }
//--- Add trailing to expert (will be deleted automatically))
   if(!ExtExpert.InitTrailing(trailing))
     {
      //--- failed
      printf(__FUNCTION__+": error initializing trailing");
      ExtExpert.Deinit();
      return(-6);
     }
//--- Set trailing parameters
   trailing.Period(InpTrailingMAPeriod);
   trailing.Shift(InpTrailingMAShift);
   trailing.Method(InpTrailingMAMethod);
   trailing.Applied(InpTrailingMAApplied);
//--- Check trailing parameters
   if(!trailing.ValidationSettings())
     {
      //--- failed
      printf(__FUNCTION__+": error trailing parameters");
      ExtExpert.Deinit();
      return(-7);
     }
//--- Creation of money object
   CMoneyNone *money=new CMoneyNone;
   if(money==NULL)
     {
      //--- failed
      printf(__FUNCTION__+": error creating money");
      ExtExpert.Deinit();
      return(-8);
     }
//--- Add money to expert (will be deleted automatically))
   if(!ExtExpert.InitMoney(money))
     {
      //--- failed
      printf(__FUNCTION__+": error initializing money");
      ExtExpert.Deinit();
      return(-9);
     }
//--- Set money parameters
//--- Check money parameters
   if(!money.ValidationSettings())
     {
      //--- failed
      printf(__FUNCTION__+": error money parameters");
      ExtExpert.Deinit();
      return(-10);
     }
//--- Tuning of all necessary indicators
   if(!ExtExpert.InitIndicators())
     {
      //--- failed
      printf(__FUNCTION__+": error initializing indicators");
      ExtExpert.Deinit();
      return(-11);
     }
//--- succeed
   return(INIT_SUCCEEDED);
  }
//+------------------------------------------------------------------+
//| Deinitialization function of the expert                          |
//+------------------------------------------------------------------+
void OnDeinit(const int reason)
  {
   ExtExpert.Deinit();
  }
//+------------------------------------------------------------------+
//| Function-event handler "tick"                                    |
//+------------------------------------------------------------------+
void OnTick(void)
  {
   ExtExpert.OnTick();
  }
//+------------------------------------------------------------------+
//| Function-event handler "trade"                                   |
//+------------------------------------------------------------------+
void OnTrade(void)
  {
   ExtExpert.OnTrade();
  }
//+------------------------------------------------------------------+
//| Function-event handler "timer"                                   |
//+------------------------------------------------------------------+
void OnTimer(void)
  {
   ExtExpert.OnTimer();
  }
//+------------------------------------------------------------------+
//| Code required to visualize optimization                          |
//+------------------------------------------------------------------+
//--- When debugging, if press "Stop" during optimization, next run of optimization will continue incomplete passes from stop point
//--- In order for each new optimization run to start anew, define preprocessor directive
#property tester_no_cache

//--- Define macro substitutions
#define   REPLAY_DELAY_MS      100           // Optimization replay delay in milliseconds
#define   STAT_LINES           1             // Number of optimization statistics lines displayed
#define   SELECTED_LINE_WD     3             // Thickness of line of selected optimization passage
#define   SELECTED_LINE_CLR    clrDodgerBlue // Color of line of selected optimization passage

//--- Connect code to work with the optimization results by frame viewer
#include  "FrameViewer.mqh"

//--- Declare frame viewer object
CFrameViewer fw;

//+------------------------------------------------------------------+
//| Tester function                                                  |
//+------------------------------------------------------------------+
double OnTester()
  {
//--- here insert your own function to calculate optimization criterion
   double TesterCritetia=MathAbs(TesterStatistics(STAT_SHARPE_RATIO)*TesterStatistics(STAT_PROFIT));
   TesterCritetia=TesterStatistics(STAT_PROFIT)>0?TesterCritetia:(-TesterCritetia);
//--- call at each end of testing and pass optimization criterion as parameter
   fw.OnTester(TesterCritetia);
//---
   return(TesterCritetia);
  }
//+------------------------------------------------------------------+
//| TesterInit function                                              |
//+------------------------------------------------------------------+
void OnTesterInit()
  {
//--- prepare chart for displaying balance lines
//--- STAT_LINES sets number of balance lines on chart,
//--- SELECTED_LINE_WD - sets width, SELECTED_LINE_CLR - sets color of line of selected passage
   fw.OnTesterInit(STAT_LINES, SELECTED_LINE_WD, SELECTED_LINE_CLR);
  }
//+------------------------------------------------------------------+
//| TesterDeinit function                                            |
//+------------------------------------------------------------------+
void OnTesterDeinit()
  {
//--- completing optimization
   fw.OnTesterDeinit();
  }
//+------------------------------------------------------------------+
//| TesterPass function                                              |
//+------------------------------------------------------------------+
void OnTesterPass()
  {
//--- handle test results and display graphics
   fw.OnTesterPass();
  }
//+------------------------------------------------------------------+
//|  Event handling on chart                                         |
//+------------------------------------------------------------------+
void OnChartEvent(const int id,const long &lparam,const double &dparam,const string &sparam)
  {
//--- starts playback of frames upon completion of optimization when clicking on header
   fw.OnChartEvent(id,lparam,dparam,sparam,REPLAY_DELAY_MS); // REPLAY_DELAY_MS - pause in ms between replay frames
  }
これで、視覚的最適化を動作させるために必要なEAへの変更と追加はすべて完了です(変数名の短縮を除く)。
次に、EAをコンパイルして最適化を実行します。
テスト用の最適化設定は特に厳密である必要はありません。とりあえず以下のように設定して実行してください。
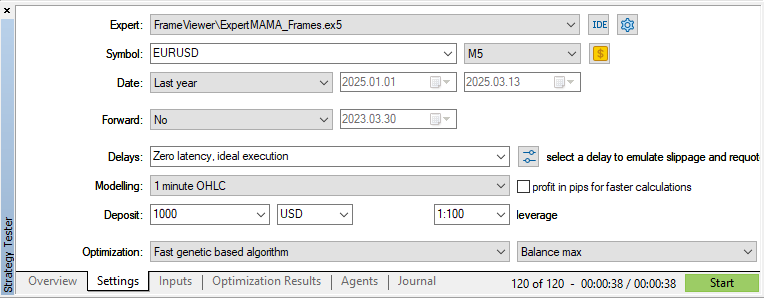
最適化を実行します。
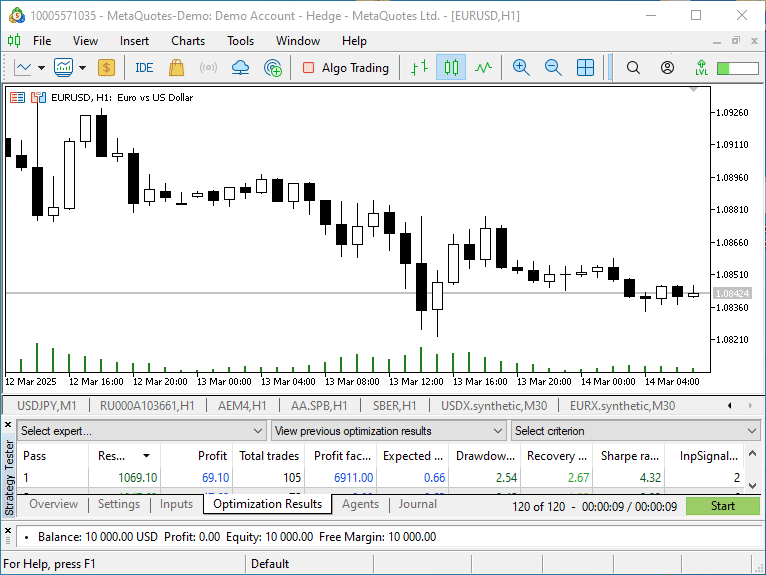
最適化を開始すると、新しいチャートウィンドウが開きます。すべてのコントロールはこのウィンドウ上に配置されており、最適化結果チャートと視覚的最適化用チャートを切り替える手間がなく便利です。この独立したウィンドウはターミナル外に移動させたり、セカンドモニターに置いたりすることもでき、すべての最適化チャートに同時にアクセスできます。
結論
結論として、ここでは最適化プロセスを制御するための追加機能を実装する小さな例のみを取り上げました。視覚的最適化チャート上には、テスターのレポートから取得したデータや、各最適化パス終了後に独自に計算したデータを自由に表示することができます。どのような機能や表示を用意するかは、視覚的最適化を使う開発者それぞれの好みや必要性によって決まります。本記事では、具体的な例を通して、必要な機能を自分の目的に応じて実装し活用する方法について解説しました。
記事で紹介したすべてのファイルは自習用に添付されています。Old_article_files.zipには、今回紹介した内容の元となった古い記事のファイルが含まれています。
また、MQL5.zipアーカイブも添付されており、解凍すれば必要なテストファイルをターミナルの各フォルダにそのまま配置できます。
以下は本稿で使用されているプログラムです。
| # | 名前 | 種類 | 説明 |
|---|---|---|---|
| 1 | Table.mqh | クラスライブラリ | テーブル作成用のクラスライブラリ |
| 2 | Controls.mqh | クラスライブラリ | UIコントロールを作成するためのクラスライブラリ |
| 3 | FrameViewer.mqh | クラスライブラリ | EAに視覚的最適化機能を実装するためのクラスライブラリ |
| 4 | ExpertMAMA_Frames.mq5 | EA | 視覚的最適化をテストするためのEA |
| 5 | MQL5.zip | アーカイブ | クライアントターミナルのMQL5ディレクトリに解凍するための上記のファイルのアーカイブ |
| 6 | Old_article_files.zip | アーカイブ | この記事のすべてのファイルが作成された元記事のファイルのアーカイブ |
MetaQuotes Ltdによってロシア語から翻訳されました。
元の記事: https://www.mql5.com/ru/articles/17457
警告: これらの資料についてのすべての権利はMetaQuotes Ltd.が保有しています。これらの資料の全部または一部の複製や再プリントは禁じられています。
この記事はサイトのユーザーによって執筆されたものであり、著者の個人的な見解を反映しています。MetaQuotes Ltdは、提示された情報の正確性や、記載されているソリューション、戦略、または推奨事項の使用によって生じたいかなる結果についても責任を負いません。

- 無料取引アプリ
- 8千を超えるシグナルをコピー
- 金融ニュースで金融マーケットを探索
opt-formatの開示 後、フレームの使用は、opt-fileにないデータを転送する場合にのみ適切であった。
この記事の例では、提案されたGUIを使用してオプトファイルを視覚化することができる。
オプト・フォーマットが公開された後も、フレームの使用はオプト・ファイルにないデータを送信する場合にのみ適切であった。
この記事の例では、提案されたGUIを使用してoptファイルを視覚化することができる。