
Visualizing Strategies in MQL5: Laying Out Optimization Results Across Criterion Charts

Contents
- Introduction
- How It Works
- Make Classes For Our Tasks
- Connect functionality to Expert Advisor
- Conclusion
Introduction
mql5.com contains so much information that every time you scroll through article catalogues or reference information, or a textbook, you will definitely find something new and interesting for yourself.
This is the case this time. I came across a simple and at first glance uncomplicated article, which briefly describes the strategy tester. Everything seems to be simple and has been known for a long time, but... But the last part of the article intrigued me. It suggests simply connecting a small code to the Expert Advisor, adding several standard handlers to it, and... and the usual optimizer of MetaTrader 5 platform strategy tester turns into a visual one. Hm... That’s interesting.
I began to study and sort things out. As a result, an idea was born to slightly improve the appearance and expand a feature of viewing the optimization results.
Let's do this: the Expert Advisor will open a new window with five tabs. The first one will have a chart of all passes, where each new pass will be displayed with a balance line. The other four tabs will also have charts, but they will be available after optimization is complete. Each of these tabs will display data on the top three passes by one of four optimization criteria. And on each tab there will be two tables: with results of the optimization pass and settings of the Expert Advisor for this pass:
- Optimization tab:
- a table of optimization results for the next pass,
- a table of EA's input parameters for this pass,
- balance chart of the current completed optimization pass,
- Replay button for replaying the optimization performed.
- Sharpe Ratio tab:
- a table of optimization results for the selected pass (one of the top three by the Sharpe Coefficient),
- a table of Expert Advisor’s input parameters for the selected pass (one of the top three by the Sharpe Coefficient),
- balance charts of the three best optimization passes by the Sharpe Coefficient.
- A toggle (three-position) for selecting one of the three best optimization results by the Sharpe Coefficient.
- Net Profit tab:
- a table of optimization results for the selected pass (one of the top three by Total Profit),
- a table of Expert Advisor’s input parameters for the selected pass (one of the top three by Total Profit),
- balance charts of the three best optimization passes by Total Profit.
- A toggle (three-position) for selecting one of the three best optimization results by Total Profit.
- Profit Factor tab:
- a table of optimization results for the selected pass (one of the top three by Profitability),
- a table of Expert Advisor’s input parameters for the selected pass (one of the top three by Profitability),
- balance charts of the three best optimization passes by Profitability,
- A toggle (three-position) for selecting one of the three best optimization results by Profitability.
- Recovery Factor tab:
- a table of optimization results for the selected pass (one of the top three by Recovery Factor),
- a table of Expert Advisor’s input parameters for the selected pass (one of the top three by Recovery Factor),
- balance charts of the three best optimization passes by Recovery Factor,
- A toggle (three-position) for selecting one of the three best optimization results by Recovery Factor.
To implement a set of tabs, create control classes, from which make up the Tab Control. Skip the process of creating controls in this article by simply offering a ready-made class file. In following articles, we will return to description of such classes for creating some controls that may be useful in the future.
To display information about pass parameters, we want table classes to be taken in a ready-made form from "SQLite capabilities in MQL5: Example of a dashboard with trading statistics by symbols and magic numbers” article and slightly refine table classes to create tables and output text to their cells more conveniently.
To implement the idea, take codes for working with optimization frameworks attached to the above mentioned article, and based on them make our own classes, trying to preserve the concept as much as possible. Since the article does not describe the process of working with frames and the Expert Advisor working in frame mode, let's try to understand this system here.
How It Works
Let's turn to the MQL5 Tutorial, and see what it says about functioning of strategy tester and its optimizer:
... A particularly important function of the tester is multithreaded optimization, which can be performed using local and distributed (networked) agent programs, including in the MQL5 Cloud Network. A single test run (with specific EA’s input parameters), started manually by the user, or one of the many runs caused by optimization (when the parameter values are iterated within set ranges) is performed in a separate agent program. Technically— it is metatester64.exe file, and copies of its processes are available in the Windows Task Manager during testing and optimization. This is why the tester is multithreaded.
The terminal is the Execution Manager that distributes tasks to local and remote agents. It launches local agents itself, if necessary. During optimization, several agents are launched by default — their number corresponds to the number of processor cores. After completing the next task of testing the Expert Advisor with specified parameters, the agent returns the results to the terminal.
Each agent creates its own trading and software environment. All agents are isolated from each other and from the client terminal.
What can be clear from the description: each instance of the EA being tested is launched on its own testing agent, and each pass — its final data — is sent from the agent to the terminal.
There is a set of handlers for data exchange between the terminal and agents:
- OnTesterInit() — it is called in Expert Advisors when TesterInit event occurs to perform necessary actions before starting optimization in the strategy tester.
- OnTester() — it is called in Expert Advisors when Tester event occurs to perform necessary actions upon completion of testing.
- OnTesterPass() — it is called in Expert Advisors when TesterPass to process a new data frame during Expert Advisor optimization.
- OnTesterDeinit() — it is called in Expert Advisors when TesterDeinit event occurs to perform necessary actions upon completion of EA optimization.
If the EA has any of the handlers OnTesterInit(), OnTesterDeinit() (these two handlers always work in pair - you can't have just one of them), OnTesterPass(), then the expert will be launched in a separate terminal window in a special frame mode:
To manage the optimization process and transfer arbitrary application results from agents to the terminal (in addition to trade indicators), there are 3 special events in MQL5: OnTesterInit, OnTesterDeinit, OnTesterPass. By describing the handlers in the code for them, the programmer will be able to perform the actions he needs before starting optimization, after optimization is completed, and at completion of each of the individual optimization passes.
All handlers are optional. Optimization runs without them, as well. It should also be understood that all 3 events work only during optimization, but not in a single test.
The Expert Advisor with these handlers is automatically loaded on a separate terminal chart with the symbol and period as specified in the tester. This copy of the Expert Advisor does not trade, but performs only service actions. All other event handlers do not run in it, in particular, OnInit, OnDeinit, onTick.
During optimization, only one instance of the Expert Advisor works in the terminal and, if necessary, accepts incoming frames. But to make it clear once again that such an instance of the Expert Advisor is launched only if one of the three described event handlers is present in its code.
After each individual pass of the optimizer is completed, the OnTester() event is generated in the EA’s instance running on the agent. From the handler of this event, you can send data about a pass to the Expert Advisor that runs on a separate chart in a special frame mode. The data packet about the completed pass sent to the Expert Advisor on the chart is called a frame. It contains information about the pass number, values of EA's input variables with which the pass was started, and results of this pass.
All this data is sent to the Expert Advisor, and a TesterPass event is generated in it, being processed in OnTesterPass() handler, where we can read the pass data and perform any actions (in this case, for example, draw a balance chart of this pass and perform other service actions).
To send data about the pass from the agent to the Expert Advisor on the chart in the terminal, one should use the FrameAdd() function. The current frame (completed pass) will be sent from the agent to the Expert Advisor and will already be handled there in the OnTesterPass() handler.
As you can see, some functions work on the agent in the EA instance running in it, and some work in the Expert Advisor on the terminal chart running in frame mode. But all of them, of course, must be described inside the EA code.
As a result, the sequence of the EA's operation and our actions when transferring data between the agent and the terminal is as follows:
- In the OnTesterInit handler (an instance of the Expert Advisor on the chart in the terminal), it is necessary to prepare all graphical constructions — a separate chart on which the EA is running in frame mode, and the contents of this chart: a chart of the balance chart, tables with parameters and results, a tab control object and buttons for selecting actions on tabs;
- In the OnTester handler (an Expert Advisor instance on the agent), it is necessary to collect all the information about the completed pass — write the balance result of each closing transaction into an array, receive and write the received results of this pass into an array, and send all this data to the EA using FrameAdd();
- In the OnTesterPass handler (an Expert Advisor instance on the chart in the terminal), we receive the next frame sent from the agent using FrameAdd(), read its data and draw a balance graph on the chart, create a frame object and save it to an array for subsequent sorting and selection according to optimization criteria;
- OnTesterDeinit and OnChartEvent handlers (an Expert Advisor instance on the chart in the terminal) work with optimization data after its completion — a repeated generation of the optimization process, showing the best results on certain optimization criteria.
Make Classes For Our Tasks
To create the Tab Control, a file with a set of controls Controls.mqh was created. The file is attached at the end of the article, and it should be placed directly in the folder where we will write the test EA, for example, in the terminal directory \MQL5\Experts\FrameViewer\Controls.mqh.
We will not consider each created class of each control here. Provide a brief overview.
In total, ten classes were implemented for eight independent controls:
| # | Class | Parent class | Description | Assignment |
|---|---|---|---|---|
| 1 | CBaseCanvas | CObject | Drawing base class | The base canvas. It contains methods for setting and changing the size and position, hiding and displaying |
| 2 | CPanel | CBaseCanvas | Panel class | It contains methods for setting and changing colors and mouse event handlers. It enables to attach child controls |
| 3 | CLabel | CPanel | Text label class | It prints a text on the canvas in the set coordinates |
| 4 | CButton | CLabel | Simple button class | A regular button with an unfixed state. It reacts to hovering and mouse clicks by changing the color |
| 5 | CButtonTriggered | CButton | Two-way button class | A button with two states: On/Off It reacts to hovering, mouse clicks and a change of the state by changing the color |
| 6 | CTabButton | CButtonTriggered | Tab button class | A two-way button with a missing border at the junction with the tab field |
| 7 | CButtonSwitch | CPanel | Toggle button class | A panel with two or more two-way buttons, where only one can have the On state. It allows you to add new buttons to existing ones. |
| 8 | CTabWorkArea | CObject | Workspace class of the tab | An object that has two basic drawing classes — for the background and foreground. |
| 9 | CTab | CPanel | Tab object class | A panel with a button and a field. The workspace is located on the tab field, where the drawing takes place. |
| 10 | CTabControl | CPanel | The class of the tab control object | A panel that allows you to add and manage tab objects. |
After the control object has been successfully created, its Create() method must be called for each of the objects, specifying its coordinates and dimensions. After that, the element is ready to use it.
The control element, which includes implemented event handlers, sends user events to the control program chart, which can be used to determine what has been done in the object:
| # | Class | Event | ID | lparam | dparam | sparam |
|---|---|---|---|---|---|---|
| 1 | CButton | Click on the object | (ushort)CHARTEVENT_CLICK | X-coordinate of the cursor | Y-coordinate of the cursor | Button object name |
| 2 | CButtonTriggered | Click on the object | (ushort)CHARTEVENT_CLICK | X-coordinate of the cursor | Y-coordinate of the cursor | Button object name |
| 3 | CTabButton | Click on the object | (ushort)CHARTEVENT_CLICK | X-coordinate of the cursor | Y-coordinate of the cursor | Button object name |
| 4 | CButtonSwitch | Click on object button | (ushort)CHARTEVENT_CLICK | Button ID | 0 | Toggle object name |
The table shows that to simplify the code, there is no reference from the Tab Control to the chart of the user event program. If the program requires reaction to tab switching, then you can determine the event by clicking on the TabButton. By the button name, you can find out the tab number, or request the index of the selected tab from TabControl object, etc.
In any case, in the future we will analyze such classes in detail when creating various controls that are useful for use in our programs.
Now we must slightly refine the table class presented in the article, which should be downloaded (Dashboard.mqh file), copy only the table class code from the file (lines 12 - 285) and save the copied code in \MQL5\Experts\FrameViewer\ folder in Table.mqh file.
Add the class so that working with tables and tabular data is a little more convenient.
Connect to the file a file of the class of a dynamic array of pointers to instances of the CObject class and its descendants CArrayObj and a file of the class for simplified creation of custom drawings CCanvas:
//+------------------------------------------------------------------+
//|                                                        Table.mqh |
//|                                  Copyright 2025, MetaQuotes Ltd. |
//|                                             https://www.mql5.com |
//+------------------------------------------------------------------+
#property copyright "Copyright 2025, MetaQuotes Ltd."
#property link      "https://www.mql5.com"

#include <Arrays\ArrayObj.mqh>
#include <Canvas\Canvas.mqh>
To the private section of the table cell class add new variables to store the width, height, and color of the text in the cell:
//+------------------------------------------------------------------+
//| Table cell class                                                 |
//+------------------------------------------------------------------+
class CTableCell : public CObject
  {
private:
   int               m_row;                     // Row
   int               m_col;                     // Column
   int               m_x;                       // X coordinate
   int               m_y;                       // Y coordinate
   int               m_w;                       // Width
   int               m_h;                       // Height
   string            m_text;                    // Text in the cell
   color             m_fore_color;              // Text color in the cell
public:
In the public section, add methods for reading and setting new properties and a method that prints the text written in the cell to the specified canvas object:
public:
//--- Methods for setting values
   void              SetRow(const uint row)     { this.m_row=(int)row;  }
   void              SetColumn(const uint col)  { this.m_col=(int)col;  }
   void              SetX(const uint x)         { this.m_x=(int)x;      }
   void              SetY(const uint y)         { this.m_y=(int)y;      }
   void              SetXY(const uint x,const uint y)
                       {
                        this.m_x=(int)x;
                        this.m_y=(int)y;
                       }
   void              SetWidth(const uint w)     { this.m_w=(int)w;      }
   void              SetHeight(const uint h)    { this.m_h=(int)h;      }
   void              SetSize(const uint w,const uint h)
                       {
                        this.m_w=(int)w;
                        this.m_h=(int)h;
                       }
   void              SetText(const string text) { this.m_text=text;     }

//--- Methods for getting values
   int               Row(void)            const { return this.m_row;    }
   int               Column(void)         const { return this.m_col;    }
   int               X(void)              const { return this.m_x;      }
   int               Y(void)              const { return this.m_y;      }
   int               Width(void)          const { return this.m_w;      }
   int               Height(void)         const { return this.m_h;      }
   string            Text(void)           const { return this.m_text;   }

//--- Prints the text written in cell properties to the canvas, the pointer to which is passed to the method
   void              TextOut(CCanvas *canvas, const int x_shift, const int y_shift, const color bg_color=clrNONE, const uint flags=0, const uint alignment=0)
                       {
                        if(canvas==NULL)
                           return;
                        //--- Remember current font flags
                        uint flags_prev=canvas.FontFlagsGet();
                        //--- Set background color
                        uint clr=(bg_color==clrNONE ? 0x00FFFFFF : ::ColorToARGB(bg_color));
                        //--- Fill in the cell with the set background color (erase the previous label)
                        canvas.FillRectangle(this.m_x+1, this.m_y+1, this.m_x+this.m_w-1, this.m_y+this.m_h-1, clr);
                        //--- Set font flags
                        canvas.FontFlagsSet(flags);
                        //--- Print text in the cell
                        canvas.TextOut(this.m_x+x_shift, this.m_y+y_shift, this.m_text, ::ColorToARGB(this.m_fore_color), alignment);
                        //--- Return previously memorized font flags and update canvas
                        canvas.FontFlagsSet(flags_prev);
                        canvas.Update(false);
                       }

//--- A virtual method for comparing two objects
At the end of class listing, implement a new table control class:
//+------------------------------------------------------------------+
//| Table control class                                              |
//+------------------------------------------------------------------+
class CTableDataControl : public CTableData
  {
protected:
   uchar             m_alpha;
   color             m_fore_color;

//--- Converts RGB to color
   color             RGBToColor(const double r,const double g,const double b) const;
//--- Writes RGB component values to variables
   void              ColorToRGB(const color clr,double &r,double &g,double &b);
//--- Returns color component (1) Red, (2) Green, (3) Blue
   double            GetR(const color clr)      { return clr&0xff ;                    }
   double            GetG(const color clr)      { return(clr>>8)&0xff;                 }
   double            GetB(const color clr)      { return(clr>>16)&0xff;                }

//--- Returns a new color
   color             NewColor(color base_color, int shift_red, int shift_green, int shift_blue);

public:
//--- Returns a pointer to itself
   CTableDataControl*Get(void)                                 { return &this;         }

//--- (1) Sets, (2) returns transparency
   void              SetAlpha(const uchar alpha)               { this.m_alpha=alpha;   }
   uchar             Alpha(void)                         const { return this.m_alpha;  }

//--- Draws (1) a background grid, (2) with automatic cell size
   void              DrawGrid(CCanvas *canvas,const int x,const int y,const uint header_h,const uint rows,const uint columns,const uint row_size,const uint col_size,
                              const color line_color=clrNONE,bool alternating_color=true);
   void              DrawGridAutoFill(CCanvas *canvas,const uint border,const uint header_h,const uint rows,const uint columns,const color line_color=clrNONE,bool alternating_color=true);

//--- Prints (1) a text message, (2) a filled rectangle at the specified coordinates
   void              DrawText(CCanvas *canvas,const string text,const int x,const int y,const color clr=clrNONE,const uint align=0,const int width=WRONG_VALUE,const int height=WRONG_VALUE);
   void              DrawRectangleFill(CCanvas *canvas,const int x,const int y,const int width,const int height,const color clr,const uchar alpha);


//--- Constructors/Destructor
                     CTableDataControl (const uint id) : CTableData(id), m_fore_color(clrDimGray), m_alpha(255) {}
                     CTableDataControl (void) : m_alpha(255) {}
                    ~CTableDataControl (void) {}
  };
//+------------------------------------------------------------------+
//| Draws background grid                                            |
//+------------------------------------------------------------------+
void CTableDataControl::DrawGrid(CCanvas *canvas,const int x,const int y,const uint header_h,const uint rows,const uint columns,const uint row_size,const uint col_size,
                                 const color line_color=clrNONE,bool alternating_color=true)
  {
//--- Clear all lists of the tabular data object (delete cells from rows and all rows)
   this.Clear();
//--- Row height cannot be less than 2
   int row_h=int(row_size<2 ? 2 : row_size);
//--- Row width cannot be less than 2
   int col_w=int(col_size<2 ? 2 : col_size);

//--- Left coordinate (X1) of the table
   int x1=x;
//--- Calculate X2 coordinate (on the right) depending on the number of columns and their width
   int x2=x1+col_w*int(columns>0 ? columns : 1);
//--- Y1 coordinate is located under the panel header area
   int y1=(int)header_h+y;

//--- Calculate Y2 coordinate (from below) depending on the number of rows and their height
   int y2=y1+row_h*int(rows>0 ? rows : 1);
//--- Set coordinates of the table
   this.SetCoords(x1,y1-header_h,x2,y2-header_h);

//--- Get color of grid lines of table, either by default or passed to method
   color clr=(line_color==clrNONE ? C'200,200,200' : line_color);
//--- Draw table border
   canvas.Rectangle(x1,y1,x2,y2,::ColorToARGB(clr,this.m_alpha));
//--- In a loop by table rows
   for(int i=0;i<(int)rows;i++)
     {
      //--- calculate Y coordinate of next horizontal grid line (Y coordinate of next row of table)
      int row_y=y1+row_h*i;
      //--- if the flag of "alternating" row colors is passed and the row is even
      if(alternating_color && i%2==0)
        {
         //--- lighten background color of table and draw a background rectangle
         color new_color=this.NewColor(clr,45,45,45);
         canvas.FillRectangle(x1+1,row_y+1,x2-1,row_y+row_h-1,::ColorToARGB(new_color,this.m_alpha));
        }
      //--- Draw horizontal grid line of table
      canvas.Line(x1,row_y,x2,row_y,::ColorToARGB(clr,this.m_alpha));

      //--- Create new table row object
      CTableRow *row_obj=new CTableRow(i);
      if(row_obj==NULL)
        {
         ::PrintFormat("%s: Failed to create table row object at index %lu",(string)__FUNCTION__,i);
         continue;
        }
      //--- Add it to list of rows of tabular data object
      //--- (if failed to add object, delete created object)
      if(!this.AddRow(row_obj))
         delete row_obj;
      //--- Set Y coordinate in created row object, given offset from panel header
      row_obj.SetY(row_y-header_h);
     }

//--- In loop by table columns
   for(int i=0;i<(int)columns;i++)
     {
      //--- calculate X coordinate of next vertical grid line (X coordinate of next table column)
      int col_x=x1+col_w*i;
      //--- If grid line has gone beyond panel, break cycle
      if(x1==1 && col_x>=x1+canvas.Width()-2)
         break;
      //--- Draw vertical grid line of table
      canvas.Line(col_x,y1,col_x,y2,::ColorToARGB(clr,this.m_alpha));

      //--- Get the number of created rows from tabular data object
      int total=this.RowsTotal();
      //--- In loop through table rows
      for(int j=0;j<total;j++)
        {
         //--- get next row
         CTableRow *row=this.GetRow(j);
         if(row==NULL)
            continue;
         //--- Create new table cell
         CTableCell *cell=new CTableCell(row.Row(),i);
         if(cell==NULL)
           {
            ::PrintFormat("%s: Failed to create table cell object at index %lu",(string)__FUNCTION__,i);
            continue;
           }
         //--- Add created cell to row
         //--- (if failed to add object, delete created object)
         if(!row.AddCell(cell))
           {
            delete cell;
            continue;
           }
         //--- In created cell object, set its X coordinate and Y coordinate from row object.
         cell.SetXY(col_x,row.Y());
         cell.SetSize(col_w, row_h);
        }
     }
//--- Update canvas without redrawing chart
   canvas.Update(false);
  }
//+------------------------------------------------------------------+
//| Draws background grid with automatic cell size                   |
//+------------------------------------------------------------------+
void CTableDataControl::DrawGridAutoFill(CCanvas *canvas,const uint border,const uint header_h,const uint rows,const uint columns,const color line_color=clrNONE,bool alternating_color=true)
  {
//--- X1 coordinate (left) of table
   int x1=(int)border;
//--- X2 coordinate (right) of table
   int x2=canvas.Width()-(int)border-1;
//--- Y1 coordinate (top) of table
   int y1=int(header_h+border-1);
//--- Y2 coordinate (lower) of table
   int y2=canvas.Height()-(int)border-1;
//--- Set coordinates of table
   this.SetCoords(x1,y1,x2,y2);

//--- Get color of grid lines of table, either by default or passed to method
   color clr=(line_color==clrNONE ? C'200,200,200' : line_color);
//--- If indentation from edge of panel is greater than zero, draw border of table
//--- otherwise, panel border acts as table border
   if(border>0)
      canvas.Rectangle(x1,y1,x2,y2,::ColorToARGB(clr,this.m_alpha));

//--- Height of entire table grid
   int greed_h=y2-y1;
//--- Calculate row height depending on table height and number of rows
   int row_h=(int)::round((double)greed_h/(double)rows);
//--- In loop through number of rows
   for(int i=0;i<(int)rows;i++)
     {
      //--- calculate Y coordinate of next horizontal grid line (Y coordinate of next row of table)
      int row_y=y1+row_h*i;
      //--- if the flag of "alternating" row colors is passed and the row is even
      if(alternating_color && i%2==0)
        {
         //--- lighten background color of table and draw a background rectangle
         color new_color=this.NewColor(clr,45,45,45);
         canvas.FillRectangle(x1+1,row_y+1,x2-1,row_y+row_h-1,::ColorToARGB(new_color,this.m_alpha));
        }
      //--- Draw horizontal grid line of table
      canvas.Line(x1,row_y,x2,row_y,::ColorToARGB(clr,this.m_alpha));

      //--- Create new table row object
      CTableRow *row_obj=new CTableRow(i);
      if(row_obj==NULL)
        {
         ::PrintFormat("%s: Failed to create table row object at index %lu",(string)__FUNCTION__,i);
         continue;
        }
      //--- Add it to list of rows of tabular data object
      //--- (if failed to add object, delete created object)
      if(!this.AddRow(row_obj))
         delete row_obj;
      //--- Set Y coordinate in created row object, given offset from panel header
      row_obj.SetY(row_y-header_h);
     }

//--- Width of table grid
   int greed_w=x2-x1;
//--- Calculate column width depending on table width and number of columns
   int col_w=(int)::round((double)greed_w/(double)columns);
//--- In loop by table columns
   for(int i=0;i<(int)columns;i++)
     {
      //--- calculate X coordinate of next vertical grid line (X coordinate of next table column)
      int col_x=x1+col_w*i;
      //--- If this is not the very first vertical line, draw it
      //--- (the first vertical line is either table border or panel border)
      if(i>0)
         canvas.Line(col_x,y1,col_x,y2,::ColorToARGB(clr,this.m_alpha));

      //--- Get the number of created rows from tabular data object
      int total=this.RowsTotal();
      //--- In loop through table rows
      for(int j=0;j<total;j++)
        {
         //--- get next row
         CTableRow *row=this.GetRow(j);
         if(row==NULL)
            continue;
         //--- Create new table cell
         CTableCell *cell=new CTableCell(row.Row(),i);
         if(cell==NULL)
           {
            ::PrintFormat("%s: Failed to create table cell object at index %lu",(string)__FUNCTION__,i);
            continue;
           }
         //--- Add created cell to row
         //--- (if failed to add object, delete created object)
         if(!row.AddCell(cell))
           {
            delete cell;
            continue;
           }
         //--- In created cell object, set its X coordinate and Y coordinate from row object.
         cell.SetXY(col_x,row.Y());
         cell.SetSize(col_w, row_h);
        }
     }
//--- Update canvas without redrawing chart
   canvas.Update(false);
  }
//+------------------------------------------------------------------+
//| Returns color with new color component                           |
//+------------------------------------------------------------------+
color CTableDataControl::NewColor(color base_color, int shift_red, int shift_green, int shift_blue)
  {
   double clR=0, clG=0, clB=0;
   this.ColorToRGB(base_color,clR,clG,clB);
   double clRn=(clR+shift_red  < 0 ? 0 : clR+shift_red  > 255 ? 255 : clR+shift_red);
   double clGn=(clG+shift_green< 0 ? 0 : clG+shift_green> 255 ? 255 : clG+shift_green);
   double clBn=(clB+shift_blue < 0 ? 0 : clB+shift_blue > 255 ? 255 : clB+shift_blue);
   return this.RGBToColor(clRn,clGn,clBn);
  }
//+------------------------------------------------------------------+
//| Converts RGB to color                                            |
//+------------------------------------------------------------------+
color CTableDataControl::RGBToColor(const double r,const double g,const double b) const
  {
   int int_r=(int)::round(r);
   int int_g=(int)::round(g);
   int int_b=(int)::round(b);
   int clr=0;
   clr=int_b;
   clr<<=8;
   clr|=int_g;
   clr<<=8;
   clr|=int_r;
//---
   return (color)clr;
  }
//+------------------------------------------------------------------+
//| Retrieving RGB component values                                  |
//+------------------------------------------------------------------+
void CTableDataControl::ColorToRGB(const color clr,double &r,double &g,double &b)
  {
   r=GetR(clr);
   g=GetG(clr);
   b=GetB(clr);
  }
//+------------------------------------------------------------------+
//| Prints text message to specified coordinates                     |
//+------------------------------------------------------------------+
void CTableDataControl::DrawText(CCanvas *canvas,const string text,const int x,const int y,const color clr=clrNONE,const uint align=0,const int width=WRONG_VALUE,const int height=WRONG_VALUE)
  {
//--- Declare variables to record width and height of text in them
   int w=width;
   int h=height;
//--- If width and height of text passed to method have zero values,
//--- entire canvas space is completely erased with transparent color
   if(width==0 && height==0)
      canvas.Erase(0x00FFFFFF);
//--- Otherwise
   else
     {
      //--- If passed width and height have default values (-1), get its width and height from text
      if(width==WRONG_VALUE && height==WRONG_VALUE)
         canvas.TextSize(text,w,h);
      //--- otherwise,
      else
        {
         //--- if width passed to method has default value (-1), get width from text, or
         //--- if width passed to method has value greater than zero, use width passed to method, or
         //--- if width passed to method has zero value, use value 1 for width
         w=(width ==WRONG_VALUE ? canvas.TextWidth(text)  : width>0  ? width  : 1);
         //--- if height passed to method has default value (-1), get height from text, or
         //--- if height passed to method has value greater than zero, use height passed to method, or
         //--- if height passed to method has zero value, use value 1 for height
         h=(height==WRONG_VALUE ? canvas.TextHeight(text) : height>0 ? height : 1);
        }
      //--- Fill space according to specified coordinates and by resulting width and height with transparent color (erase previous entry)
      canvas.FillRectangle(x,y,x+w,y+h,0x00FFFFFF);
     }
//--- Print text in place cleared of previous text and update workspace without redrawing screen
   canvas.TextOut(x,y,text,::ColorToARGB(clr==clrNONE ? this.m_fore_color : clr),align);
   canvas.Update(false);
  }
//+------------------------------------------------------------------+
//| Prints filled rectangle to specified coordinates                 |
//+------------------------------------------------------------------+
void CTableDataControl::DrawRectangleFill(CCanvas *canvas,const int x,const int y,const int width,const int height,const color clr,const uchar alpha)
  {
   canvas.FillRectangle(x,y,x+width,y+height,::ColorToARGB(clr,alpha));
   canvas.Update();
  }
//+------------------------------------------------------------------+
This class contains the methods which principle was described in "Making a dashboard to display data in indicators and EAs" article in information panel description section. In the mentioned article, methods belonged to the panel object. Here they are placed in a separate class inherited from the table class.
All the tabular data objects here will have a CTableDataControl class type, a table control object, which enables to quickly control tables.
Let's see what we were asked to download and connect to the Expert Advisor in that long-ago article:
And the last “highlight of the performance” is working with optimization results! Previously, a trader had to prepare data to handle the results , upload it somewhere and process it somewhere else, but now this can be done "without leaving the cash register" — during the optimization itself. To demonstrate this feature, we need several include files in which the simplest examples of such processing were implemented.
Upload the files with MQH extension attached to the article to MQL5\Include folder. Take any EA and insert this block at the end:
//--- connect code to work with optimization results
#include <FrameGenerator.mqh>
//--- frame generator
CFrameGenerator fg;
//+------------------------------------------------------------------+
//| Tester function                                                  |
//+------------------------------------------------------------------+
double OnTester()
  {
//--- here insert your own function to calculate optimization criterion
   double TesterCritetia=MathAbs(TesterStatistics(STAT_SHARPE_RATIO)*TesterStatistics(STAT_PROFIT));
   TesterCritetia=TesterStatistics(STAT_PROFIT)>0?TesterCritetia:(-TesterCritetia);
//--- call at each end of testing and pass optimization criterion as parameter
   fg.OnTester(TesterCritetia);
//---
   return(TesterCritetia);
  }
//+------------------------------------------------------------------+
//| TesterInit function                                              |
//+------------------------------------------------------------------+
void OnTesterInit()
  {
//--- prepare chart for displaying balance charts
   fg.OnTesterInit(3); //parameter sets number of balance lines on chart
  }
//+------------------------------------------------------------------+
//| TesterPass function                                              |
//+------------------------------------------------------------------+
void OnTesterPass()
  {
//--- handle test results and display graphics
   fg.OnTesterPass();
  }
//+------------------------------------------------------------------+
//| TesterDeinit function                                            |
//+------------------------------------------------------------------+
void OnTesterDeinit()
  {
//--- completing optimization
   fg.OnTesterDeinit();
  }
//+------------------------------------------------------------------+
//|  Event handling on chart                                         |
//+------------------------------------------------------------------+
void OnChartEvent(const int id,const long &lparam,const double &dparam,const string &sparam)
  {
   //--- starts playback of frames upon completion of optimization when clicking on header
   fg.OnChartEvent(id,lparam,dparam,sparam,100); // 100 - this is pause in ms between frames
  }
//+------------------------------------------------------------------+
As an example, a standard-supplied EA Moving Averages.mq5 was taken. Insert the code and save Expert Advisor with the following name Moving Averages With Frames.mq5. Compile and run optimization.
Go to article end and look at attached files. There are four files with the *.mqh extension there. Upload them and sort it out:
- specialchart.mqh (7.61 KB) — a class of a special chart on which balance lines of each tester pass and the balance lines when reproducing the completed optimization process, are drawn;
- colorprogressbar.mqh (4.86 KB) — a progress bar class that displays the optimization process, getting filled with colored columns during optimization. Green is for a profitable series, red is for a loss one, located at the bottom of a special chart;
- simpletable.mqh (10.74 KB) — a class of a simple table that displays data of each optimization pass — the result obtained and the values of EA's configuration parameters, with which the EA was launched on this pass. Two tables are located to the left of charts of a special chart;
- framegenerator.mqh (14.88 KB) — a class for exchanging data between the testing agent and the terminal and displaying information on a special chart. It is the main class for implementing visual optimization.
Based on the knowledge gained, we decide to make the following: (1) a progress bar class, (2) a special chart class, and (3) a frame viewer class. We already have a class of tables (4), it was uploaded to the folder of the future Expert Advisor and slightly modified.
Implementing another small class, a frame class (5), is required. What is the purpose of it? We will select and display charts of top three passes for each of the four optimization criteria — the Sharpe Ratio, Total Profit, Profitability, and Recovery Factor. It will be convenient to do this if we have a list of objects created based on the class of a dynamic array of pointers to instances of CObject class and its descendants of the Standard Library. It is sufficient to sort the list by the desired criterion, and all the objects in the list will be sorted by the value of the property of the selected criterion. An object with the maximum parameter value will be at the end of the list. It remains to find two objects that have a property value less than that of the previous found object. And methods for such a search are already all implemented in the mentioned class.
Progress bar class, special chart class, and frame viewer class are created based on the codes downloaded from the article — we just look at how it's done there, and use this foundation to implement our own classes, correcting, removing unnecessary things, and adding something necessary. Look at the resulting codes, and if desired, they can be compared with those taken from the old article — an archive with old files will be attached at the end of this article.
We will write all classes in a single file. Create it (if we have created it yet) in \MQL5\Experts\FrameViewer\FrameViewer.mqh and start filling it in.
Connect files of required classes and libraries to the created file and define some macro substitutions:
//+------------------------------------------------------------------+
//|                                                  FrameViewer.mqh |
//|                                  Copyright 2025, MetaQuotes Ltd. |
//|                                             https://www.mql5.com |
//+------------------------------------------------------------------+
#property copyright "Copyright 2025, MetaQuotes Ltd."
#property link      "https://www.mql5.com"

#include "Controls.mqh"                               // Classes of controls
#include "Table.mqh"                                  // Table class
#include <Arrays\ArrayDouble.mqh>                     // Array of physical data

#define  CELL_W               128                     // Width of table cells
#define  CELL_H               19                      // Height of table cell
#define  BUTT_RES_W           CELL_W+30               // Width of optimization result selection button
#define  DATA_COUNT           8                       // Amount of data
#define  FRAME_ID             1                       // Frame ID
#define  TABLE_OPT_STAT_ID    1                       // ID of statistics table on optimization tab
#define  TABLE_OPT_STAT_ID    2                       // ID of statistics table on optimization tab
Almost every graphic object that will be used for drawing has several CCanvas objects. One can serve as a substrate on which two more are located: background image is drawn on the first one, and the second one shows what should be drawn on top of the background. For objects which methods are intended for drawing, a pointer to the desired canvas object is passed to these methods, on which the method will draw.
Since there is a lot of class code, and each class and its methods are fully commented on, we will not describe everything in detail and step by step here. Simply look at codes of classes and methods, for which we will give a brief overview of the presented code.
So, progress bar class:
//+------------------------------------------------------------------+
//|  Progress bar class that draws in two colors                     |
//+------------------------------------------------------------------+
class CColorProgressBar :public CObject
  {
private:
   CCanvas          *m_background;                    // Pointer to CCanvas class object for drawing on background
   CCanvas          *m_foreground;                    // Pointer to CCanvas class object for drawing on foreground
   CRect             m_bound;                         // Coordinates and dimensions of workspace
   color             m_good_color, m_bad_color;       // Colors of profitable and loss series
   color             m_back_color, m_fore_color;      // Background and frame colors
   bool              m_passes[];                      // Number of processed passes
   int               m_last_index;                    // Last pass index
public:
//--- Constructor/destructor
                     CColorProgressBar(void);
                    ~CColorProgressBar(void){};

//--- Sets pointer to canvas
   void              SetCanvas(CCanvas *background, CCanvas *foreground)
                       {
                        if(background==NULL)
                          {
                           ::Print(__FUNCTION__, ": Error. Background is NULL");
                           return;
                          }
                        if(foreground==NULL)
                          {
                           ::Print(__FUNCTION__, ": Error. Foreground is NULL");
                           return;
                          }

                        this.m_background=background;
                        this.m_foreground=foreground;
                       }
//--- Sets coordinates and dimensions of workspace on canvas
   void              SetBound(const int x1, const int y1, const int x2, const int y2)
                       {
                        this.m_bound.SetBound(x1, y1, x2, y2);
                       }
//--- Return of coordinates of bounds of rectangular area
   int               X1(void)                      const { return this.m_bound.left;   }
   int               Y1(void)                      const { return this.m_bound.top;    }
   int               X2(void)                      const { return this.m_bound.right;  }
   int               Y2(void)                      const { return this.m_bound.bottom; }

//--- Setting background color and frame
   void              SetBackColor(const color clr)       { this.m_back_color=clr;      }
   void              SetForeColor(const color clr)       { this.m_fore_color=clr;      }
//--- Returning background color and frame
   color             BackColor(void)               const { return this.m_back_color;   }
   color             ForeColor(void)               const { return this.m_fore_color;   }
//--- Resets counter to zero
   void              Reset(void)                         { this.m_last_index=0;        }
//--- Adds result for drawing strip in progress bar
   void              AddResult(bool good, const bool chart_redraw);
//--- Updates progress bar on chart
   void              Update(const bool chart_redraw);
  };
//+------------------------------------------------------------------+
//| Constructor                                                      |
//+------------------------------------------------------------------+
CColorProgressBar::CColorProgressBar() : m_last_index(0), m_good_color(clrSeaGreen), m_bad_color(clrLightPink)
  {
//--- Set size of pass array with reserve
   ::ArrayResize(this.m_passes, 5000, 1000);
   ::ArrayInitialize(this.m_passes, 0);
  }
//+------------------------------------------------------------------+
//| Adding result                                                    |
//+------------------------------------------------------------------+
void CColorProgressBar::AddResult(bool good, const bool chart_redraw)
  {
   this.m_passes[this.m_last_index]=good;
//--- Add another vertical line of desired color to progress bar
   this.m_foreground.LineVertical(this.X1()+1+this.m_last_index, this.Y1()+1, this.Y2()-1, ::ColorToARGB(good ? this.m_good_color : this.m_bad_color));
//--- Update on chart
   this.m_foreground.Update(chart_redraw);
//--- Updating index
   this.m_last_index++;
   if(this.m_last_index>=this.m_bound.Width()-1)
      this.m_last_index=0;
  }
//+------------------------------------------------------------------+
//| Updating progress bar on chart                                   |
//+------------------------------------------------------------------+
void CColorProgressBar::Update(const bool chart_redraw)
  {
//--- Fill background with background color
   this.m_background.FillRectangle(this.X1(), this.Y1(), this.X2(), this.Y2(), ::ColorToARGB(this.m_back_color));
//--- Draw border
   this.m_background.Rectangle(this.X1(), this.Y1(), this.X2(), this.Y2(), ::ColorToARGB(this.m_fore_color));
//--- Update chart
   this.m_background.Update(chart_redraw);
  }
The class doesn't have own canvas objects for drawing. To specify the canvas object on which to draw, there is a method to which a pointer to an existing canvas is passed. And it is assigned to class variables. Methods of the class will draw on this canvas. There are two objects here - one for drawing the background of the progress bar, and one for drawing in the foreground over the drawn background. CCanvas objects of a special chart class will act as canvas, on which this progress bar will be drawn.
A class for rendering statistics charts and tables of optimization results, as well as EA’s settings parameters:
//+------------------------------------------------------------------+
//| Class for rendering statistics charts and tables                 |
//| of optimization results and EA’s settings parameters             |
//+------------------------------------------------------------------+
class CStatChart: public CObject
  {
private:
   color             m_back_color;        // Background color
   color             m_fore_color;        // Border color
   int               m_line_width;        // Line width in pixels
   int               m_lines;             // Number of lines on chart
   CArrayDouble      m_seria[];           // Arrays for storing chart values
   bool              m_profitseria[];     // Profitable series or not
   int               m_lastseria_index;   // Index of fresh line on chart
   color             m_profit_color;      // Color of profitable series
   color             m_loss_color;        // Color of loss series
   color             m_selected_color;    // Color of selected best series

protected:
   CCanvas          *m_background;        // Pointer to object of CCanvas class for drawing on background
   CCanvas          *m_foreground;        // Pointer to CCanvas class object for drawing on foreground
   CRect             m_bound_chart;       // Workspace of chart
   CRect             m_bound_head;        // Chart header workspace
   CColorProgressBar m_progress_bar;      // Progress bar
   CButton           m_button_replay;     // Replay button
   CButtonSwitch     m_button_res;        // Button for selecting one of top three results
   int               m_tab_id;            // Tab ID

public:
//--- Constructor/destructor
                     CStatChart() : m_lastseria_index(0), m_profit_color(clrForestGreen), m_loss_color(clrOrangeRed), m_selected_color(clrDodgerBlue), m_tab_id(0) {};
                    ~CStatChart() { this.m_background=NULL; this.m_foreground=NULL; }

//--- Sets pointer to canvas
   void              SetCanvas(CCanvas *background, CCanvas *foreground)
                       {
                        if(background==NULL)
                          {
                           ::Print(__FUNCTION__, ": Error. Background is NULL");
                           return;
                          }
                        if(foreground==NULL)
                          {
                           ::Print(__FUNCTION__, ": Error. Foreground is NULL");
                           return;
                          }
                        this.m_background=background;
                        this.m_foreground=foreground;
                        this.m_progress_bar.SetCanvas(background, foreground);
                       }
//--- Sets coordinates and dimensions of chart workspace and progress bar on canvas
   void              SetChartBounds(const int x1, const int y1, const int x2, const int y2)
                       {
                        this.m_bound_chart.SetBound(x1, y1, x2, y2);
                        this.SetBoundHeader(x1, y1-CELL_H, x2, y1);
                        this.m_progress_bar.SetBound(x1, y2-CELL_H, x2, y2);
                       }
//--- Sets coordinates and dimensions of chart header on canvas
   void              SetBoundHeader(const int x1, const int y1, const int x2, const int y2)
                       {
                        this.m_bound_head.SetBound(x1, y1, x2, y2);
                       }
//--- Returns pointer to (1) itself, (2) progress bar
   CStatChart       *Get(void)                           { return &this;                     }
   CColorProgressBar*GetProgressBar(void)                { return(&this.m_progress_bar);     }

//--- Setting/returning tab ID
   void              SetTabID(const int id)              { this.m_tab_id=id;                 }
   int               TabID(void)                   const { return this.m_tab_id;             }

//--- Returning coordinates of bounds of chart’s rectangular area
   int               X1(void)                      const { return this.m_bound_chart.left;   }
   int               Y1(void)                      const { return this.m_bound_chart.top;    }
   int               X2(void)                      const { return this.m_bound_chart.right;  }
   int               Y2(void)                      const { return this.m_bound_chart.bottom; }
//--- Return of coordinates of bounds of rectangular header area
   int               HeaderX1(void)                const { return this.m_bound_head.left;    }
   int               HeaderY1(void)                const { return this.m_bound_head.top;     }
   int               HeaderX2(void)                const { return this.m_bound_head.right;   }
   int               HeaderY2(void)                const { return this.m_bound_head.bottom;  }
//--- Return of coordinates of bounds of rectangular area of progress bar
   int               ProgressBarX1(void)           const { return this.m_progress_bar.X1();  }
   int               ProgressBarY1(void)           const { return this.m_progress_bar.Y1();  }
   int               ProgressBarX2(void)           const { return this.m_progress_bar.X2();  }
   int               ProgressBarY2(void)           const { return this.m_progress_bar.Y2();  }

//--- Returns pointer to button of: (1) replay, (2) result selection (3) worst, (4) average, (5) best result
   CButton          *ButtonReplay(void)                  { return(&this.m_button_replay);    }
   CButtonSwitch    *ButtonResult(void)                  { return(&this.m_button_res);       }
   CButtonTriggered *ButtonResultMin(void)               { return(this.m_button_res.GetButton(0)); }
   CButtonTriggered *ButtonResultMid(void)               { return(this.m_button_res.GetButton(1)); }
   CButtonTriggered *ButtonResultMax(void)               { return(this.m_button_res.GetButton(2)); }

//--- (1) Hides, (2) shows, (3) brings results selection button to foreground
   bool              ButtonsResultHide(void)             { return(this.m_button_res.Hide());       }
   bool              ButtonsResultShow(void)             { return(this.m_button_res.Show());       }
   bool              ButtonsResultBringToTop(void)       { return(this.m_button_res.BringToTop()); }

//--- Creates replay button
   bool              CreateButtonReplay(void)
                       {
                        if(this.m_background==NULL)
                          {
                           ::PrintFormat("%s: Фон не задан (сначала используйте функцию SetCanvas())");
                           return false;
                          }
                        string text="Optimization Completed: Click to Replay";
                        int w=this.m_background.TextWidth(text);

                        //--- Upper-left coordinate of button
                        CPoint cp=this.m_bound_head.CenterPoint();
                        int x=cp.x-w/2;
                        int y=this.Y1()+this.m_bound_head.top-2;

                        //--- Create button and set new colors for it, hide created button
                        if(!this.m_button_replay.Create(::StringFormat("Tab%d_ButtonReplay", this.m_tab_id), text, x, y, w, CELL_H-1))
                           return false;

                        this.m_button_replay.SetDefaultColors(COLOR_BACKGROUND, STATE_OFF, C'144,238,144', C'144,228,144', C'144,218,144', clrSilver);
                        this.m_button_replay.SetDefaultColors(COLOR_BORDER, STATE_OFF, C'144,238,144', C'144,228,144', C'144,218,144', clrSilver);
                        this.m_button_replay.SetDefaultColors(COLOR_FOREGROUND, STATE_OFF, clrBlack, clrBlack, clrBlack, clrGray);
                        this.m_button_replay.ResetUsedColors(STATE_OFF);
                        this.m_button_replay.Draw(false);
                        this.m_button_replay.Hide();
                        return true;
                       }

//--- Creates results selection button
   bool              CreateButtonResults(void)
                       {
                        if(this.m_background==NULL)
                          {
                           ::PrintFormat("%s: Фон не задан (сначала используйте функцию SetCanvas())");
                           return false;
                          }
                        //--- Upper-left coordinate of button
                        int x=this.m_bound_head.left+1;
                        int y=this.m_progress_bar.Y1()+CELL_H+2;
                        int w=BUTT_RES_W;

                        //--- Creatу button and set new colors for it, hidу created button
                        if(!this.m_button_res.Create(::StringFormat("Tab%u_ButtonRes",this.m_tab_id), "", x, y, w, CELL_H-1))
                           return false;

                        string text[3]={"Worst result of the top 3", "Average result of the top 3", "Best result of the top 3"};
                        if(!this.m_button_res.AddNewButton(text, w))
                           return false;
                        this.m_button_res.GetButton(0).SetDefaultColors(COLOR_BORDER, STATE_OFF, C'228,228,228', C'228,228,228', C'228,228,228', clrSilver);
                        this.m_button_res.GetButton(0).ResetUsedColors(STATE_OFF);
                        this.m_button_res.GetButton(1).SetDefaultColors(COLOR_BORDER, STATE_OFF, C'228,228,228', C'228,228,228', C'228,228,228', clrSilver);
                        this.m_button_res.GetButton(1).ResetUsedColors(STATE_OFF);
                        this.m_button_res.GetButton(2).SetDefaultColors(COLOR_BORDER, STATE_OFF, C'228,228,228', C'228,228,228', C'228,228,228', clrSilver);
                        this.m_button_res.GetButton(2).ResetUsedColors(STATE_OFF);
                        this.m_button_res.Draw(false);
                        this.m_button_res.Hide();
                        return true;
                       }

//--- Sets background color
   void              SetBackColor(const color clr)
                       {
                        this.m_back_color=clr;
                        this.m_progress_bar.SetBackColor(clr);
                       }
//--- Sets border color
   void              SetForeColor(const color clr)
                       {
                        this.m_fore_color=clr;
                        this.m_progress_bar.SetForeColor(clr);
                       }

//--- Sets number of lines on chart
   void              SetLines(const int num)
                       {
                        this.m_lines=num;
                        ::ArrayResize(this.m_seria, num);
                        ::ArrayResize(this.m_profitseria, num);
                       }

//--- Setting color of (1) profitable, (2) loss, (3) selected series
   void              SetProfitColorLine(const color clr)    { this.m_profit_color=clr;    }
   void              SetLossColorLine(const color clr)      { this.m_loss_color=clr;      }
   void              SetSelectedLineColor(const color clr)  { this.m_selected_color=clr;  }

//--- Updating object on screen
   void              Update(color clr, const int line_width, const bool chart_redraw);
//--- Adding data from array
   void              AddSeria(const double  &array[], bool profit);
//--- Draws chart
   void              Draw(const int seria_index, color clr, const int line_width, const bool chart_redraw);
//--- Draws line in usual coordinates (from left to right, from bottom to top)
   void              Line(int x1, int y1, int x2, int y2, uint col, int size);
//--- Getting max. and min. values in the series
   double            MaxValue(const int seria_index);
   double            MinValue(const int seria_index);

//--- Event handler
   void OnChartEvent(const int id,const long& lparam,const double& dparam,const string& sparam)
     {
      //--- If replay button is not hidden, call its event handler
      if(!this.m_button_replay.IsHidden())
         this.m_button_replay.OnChartEvent(id, lparam, dparam, sparam);
      //--- If result selection button is not hidden, call its event handler
      if(!this.m_button_res.IsHidden())
         this.m_button_res.OnChartEvent(id, lparam, dparam, sparam);
     }
  };
On the specified canvas (background and foreground) the class draws tables of parameters and test results, charts of passes, a progress bar, and buttons to start replay of the completed optimization process and select the best results on certain optimization criteria.
It should be noted that to specify bounds of the rectangular area of the canvas inside which the tracked object or area is located the classes discussed here use the CRect structure.
The structure is described in \MQL5\Include\Controls\Rect.mqh, and it serves as a convenient tool for specifying bounds of a rectangular area containing important elements. For example, on the canvas we can limit the area within which the mouse cursor should be tracked, or we can specify the size of the bounding rectangle for the entire canvas size. In this case, the entire area of the entire object will be available for interaction with the cursor. The methods that return coordinates of the bounds of a rectangular area are created within the structure. Moreover, it is possible to set bounds and obtain their values in several ways — it all depends on the needs and structure of objects. Methods for moving and shifting a rectangular area are also implemented. In general, it is a convenient tool for specifying bounds of any area that must be tracked in any way.
In the classes under consideration, these areas are required to interact with the mouse cursor and indicate where objects are located on the canvas.
A method for updating the chart:
//+------------------------------------------------------------------+
//| Updating chart                                                   |
//+------------------------------------------------------------------+
void CStatChart::Update(color clr, const int line_width, const bool chart_redraw)
  {
//--- If canvas for background or foreground is not installed, exit
   if(this.m_background==NULL || this.m_foreground==NULL)
      return;
//--- StatChart fill in background
   this.m_background.FillRectangle(this.X1(), this.Y1(), this.X2(), this.Y2(), ::ColorToARGB(this.m_back_color));
//--- StatChart draw border
   this.m_background.Rectangle(this.X1(), this.Y1(), this.X2(), this.Y2(), ::ColorToARGB(this.m_fore_color));

//--- ProgressBar fill in background and draw border
   this.m_progress_bar.Update(false);

//--- Draw each series for 80% of available chart area vertically and horizontally
   for(int i=0; i<this.m_lines; i++)
     {
      //--- If color is set missing, use colors of profitable and loss series
      if(clr==clrNONE)
        {
         clr=this.m_loss_color;
         if(this.m_profitseria[i])
            clr=this.m_profit_color;
        }
      //--- otherwise, use color set for selected line
      else
         clr=this.m_selected_color;

      //--- Draw a chart of optimization results
      this.Draw(i, clr, line_width, false);
     }
//--- Update both canvases
   this.m_background.Update(false);
   this.m_foreground.Update(chart_redraw);
  }
The rectangular area of the canvas intended for drawing passage charts is erased, and a balance line and a progress bar are drawn on it.
A method that adds a new series of data to be drawn on a chart:
//+------------------------------------------------------------------+
//| Adds new series of data to be drawn on chart                     |
//+------------------------------------------------------------------+
void CStatChart::AddSeria(const double &array[], bool profit)
  {
//--- Adding array to series number m_lastseria_index
   this.m_seria[this.m_lastseria_index].Resize(0);
   this.m_seria[this.m_lastseria_index].AddArray(array);
   this.m_profitseria[this.m_lastseria_index]=profit;
//--- Track index of last line (not currently in use)
   this.m_lastseria_index++;
   if(this.m_lastseria_index>=this.m_lines)
      this.m_lastseria_index=0;
  }
Each new pass of the optimizer, its data array, must be entered into the series array, which is what this method implements.
Methods for getting the maximum and minimum values of the specified series in the array of optimizer passes:
//+------------------------------------------------------------------+
//| Getting maximum value of specified series                        |
//+------------------------------------------------------------------+
double CStatChart::MaxValue(const int seria_index)
  {
   double res=this.m_seria[seria_index].At(0);
   int total=this.m_seria[seria_index].Total();
//--- Iterate through array and compare every two adjacent series
   for(int i=1; i<total; i++)
     {
      if(this.m_seria[seria_index].At(i)>res)
         res=this.m_seria[seria_index].At(i);
     }
//--- result
   return res;
  }
//+------------------------------------------------------------------+
//| Getting minimum value of specified series                        |
//+------------------------------------------------------------------+
double CStatChart::MinValue(const int seria_index)
  {
   double res=this.m_seria[seria_index].At(0);;
   int total=this.m_seria[seria_index].Total();
//--- Iterate through array and compare every two adjacent series
   for(int i=1; i<total; i++)
     {
      if(this.m_seria[seria_index].At(i)<res)
         res=this.m_seria[seria_index].At(i);
     }
//--- result
   return res;
  }
To position the optimizer's pass charts relative to the center of a special chart, you should know the maximum and minimum values in the pass series. Then, using these values, you can calculate the relative coordinates of the line on the chart so that the line fits into 80% of the chart space allocated for drawing balance charts of optimizer passes.
A method for drawing a balance line on a chart:
//+------------------------------------------------------------------+
//| Overloading the basic drawing function                           |
//+------------------------------------------------------------------+
void CStatChart::Line(int x1, int y1, int x2, int y2, uint col, int size)
  {
//--- If canvas is not set, exit
   if(this.m_foreground==NULL)
      return;
//--- Since Y-axis is inverted, invert y1 and y2
   int y1_adj=this.m_bound_chart.Height()-CELL_H-y1;
   int y2_adj=this.m_bound_chart.Height()-CELL_H-y2;

//--- Draw smoothed line
//--- If line thickness is less than 3, draw line using the Wu smoothing algorithm
//--- (for thicknesses of 1 and 2, LineWu() method is called in LineThick() method),
//--- otherwise, draw smoothed line of given thickness using LineThick
   this.m_foreground.LineThick(x1, y1_adj, x2, y2_adj,::ColorToARGB(col), (size<1 ? 1 : size), STYLE_SOLID, LINE_END_ROUND);
  }
This is an overloaded method of CCanvas class method of the same name. Coordinates on the chart start from the upper-left corner. And usual coordinates of balance charts start from the bottom left one.
In this method, the screen Y coordinates are flipped over to draw a non-inverted balance line based on values of balance points from the array.
A method that draws balance lines on a chart:
//+------------------------------------------------------------------+
//| Drawing balance line on chart                                    |
//+------------------------------------------------------------------+
void CStatChart::Draw(const int seria_index, color clr, const int line_width, const bool chart_redraw)
  {
//--- If canvas is not set, exit
   if(this.m_foreground==NULL)
      return;

//--- Preparing coefficients for converting values into pixels
   double min=this.MaxValue(seria_index);
   double max=this.MinValue(seria_index);
   double size=this.m_seria[seria_index].Total();

//--- Indentations from chart edge
   double x_indent=this.m_bound_chart.Width()*0.05;
   double y_indent=this.m_bound_chart.Height()*0.05;

//--- Calculate coefficients
   double k_y=(max-min)/(this.m_bound_chart.Height()-2*CELL_H-2*y_indent);
   double k_x=(size)/(this.m_bound_chart.Width()-2*x_indent);

//--- Coefficients
   double start_x=this.m_bound_chart.left+x_indent;
   double start_y=this.m_bound_chart.bottom-2*CELL_H*2-y_indent;

//--- Now draw polyline passing through all points of series
   for(int i=1; i<size; i++)
     {
      //--- convert values to pixels
      int x1=(int)((i-0)/k_x+start_x);  // set value number horizontally
      int y1=(int)(start_y-(m_seria[seria_index].At(i)-min)/k_y);    // vertically
      int x2=(int)((i-1-0)/k_x+start_x);// set value number horizontally
      int y2=(int)(start_y-(m_seria[seria_index].At(i-1)-min)/k_y);  // vertically
      //--- Draw line from previous point to current one
      this.Line(x1, y1, x2, y2, clr, line_width);
     }
//--- Updating canvas with chart redrawing (if flag is set)
   this.m_foreground.Update(chart_redraw);
  }
Here, the necessary coordinates of the balance line on the chart are calculated (inside the chart area intended for drawing balance charts), and in a loop, according to the array of the specified series, draw lines between all the balance points recorded in the array.
Frame data class:
//+------------------------------------------------------------------+
//| Enumerations                                                     |
//+------------------------------------------------------------------+
enum ENUM_FRAME_PROP                                              // Frame properties
  {
   FRAME_PROP_PASS_NUM,                                           // Pass number
   FRAME_PROP_SHARPE_RATIO,                                       // Sharpe Ratio result
   FRAME_PROP_NET_PROFIT,                                         // Net Profit result
   FRAME_PROP_PROFIT_FACTOR,                                      // Profit Factor result
   FRAME_PROP_RECOVERY_FACTOR,                                    // Recovery Factor result
  };
//+------------------------------------------------------------------+
//| Frame data class                                                 |
//+------------------------------------------------------------------+
class CFrameData : public CObject
  {
protected:
   ulong             m_pass;                                      // Pass number
   double            m_sharpe_ratio;                              // Sharpe Ratio
   double            m_net_profit;                                // Total profit
   double            m_profit_factor;                             // Profitability
   double            m_recovery_factor;                           // Recovery factor
public:
//--- Setting frame properties (pass results)
   void              SetPass(const ulong pass)                    { this.m_pass=pass;              }
   void              SetSharpeRatio(const double value)           { this.m_sharpe_ratio=value;     }
   void              SetNetProfit(const double value)             { this.m_net_profit=value;       }
   void              SetProfitFactor(const double value)          { this.m_profit_factor=value;    }
   void              SetRecoveryFactor(const double value)        { this.m_recovery_factor=value;  }
//--- Returning frame properties (pass results)
   ulong             Pass(void)                             const { return this.m_pass;            }
   double            SharpeRatio(void)                      const { return this.m_sharpe_ratio;    }
   double            NetProfit(void)                        const { return this.m_net_profit;      }
   double            ProfitFactor(void)                     const { return this.m_profit_factor;   }
   double            RecoveryFactor(void)                   const { return this.m_recovery_factor; }

//--- Description of properties
   string            PassDescription(void)                  const { return ::StringFormat("Pass: %I64u", this.m_pass);                       }
   string            SharpeRatioDescription(void)           const { return ::StringFormat("Sharpe Ratio: %.2f", this.m_sharpe_ratio);        }
   string            NetProfitDescription(void)             const { return ::StringFormat("Net Profit: %.2f", this.m_net_profit);            }
   string            ProfitFactorDescription(void)          const { return ::StringFormat("Profit Factor: %.2f", this.m_profit_factor);      }
   string            RecoveryFactorDescription(void)        const { return ::StringFormat("Recovery Factor: %.2f", this.m_recovery_factor);  }

//--- Printing frame properties to log
   void              Print(void)
                       {
                        ::PrintFormat("Frame %s:", this.PassDescription());
                        ::PrintFormat(" - %s", this.SharpeRatioDescription());
                        ::PrintFormat(" - %s", this.NetProfitDescription());
                        ::PrintFormat(" - %s", this.ProfitFactorDescription());
                        ::PrintFormat(" - %s", this.RecoveryFactorDescription());
                       }

//--- A method for comparing two objects
   virtual int       Compare(const CObject *node,const int mode=0) const
                       {
                        //--- Compare real values as two-digit values
                        const CFrameData *obj=node;
                        switch(mode)
                          {
                           case FRAME_PROP_SHARPE_RATIO     :  return(::NormalizeDouble(this.SharpeRatio(),2)   > ::NormalizeDouble(obj.SharpeRatio(),2)    ?  1 :
                                                                      ::NormalizeDouble(this.SharpeRatio(),2)   < ::NormalizeDouble(obj.SharpeRatio(),2)    ? -1 : 0);
                           case FRAME_PROP_NET_PROFIT       :  return(::NormalizeDouble(this.NetProfit(),2)     > ::NormalizeDouble(obj.NetProfit(),2)      ?  1 :
                                                                      ::NormalizeDouble(this.NetProfit(),2)     < ::NormalizeDouble(obj.NetProfit(),2)      ? -1 : 0);
                           case FRAME_PROP_PROFIT_FACTOR    :  return(::NormalizeDouble(this.ProfitFactor(),2)  > ::NormalizeDouble(obj.ProfitFactor(),2)   ?  1 :
                                                                      ::NormalizeDouble(this.ProfitFactor(),2)  < ::NormalizeDouble(obj.ProfitFactor(),2)   ? -1 : 0);
                           case FRAME_PROP_RECOVERY_FACTOR  :  return(::NormalizeDouble(this.RecoveryFactor(),2)> ::NormalizeDouble(obj.RecoveryFactor(),2) ?  1 :
                                                                      ::NormalizeDouble(this.RecoveryFactor(),2)< ::NormalizeDouble(obj.RecoveryFactor(),2) ? -1 : 0);
                           //---FRAME_PROP_PASS_NUM
                           default                          :  return(this.Pass()>obj.Pass() ?  1  :  this.Pass()<obj.Pass()  ? -1  :  0);
                          }
                       }

//--- Constructors/destructor
                     CFrameData (const ulong pass, const double sharpe_ratio, const double net_profit, const double profit_factor, const double recovery_factor) :
                        m_pass(pass), m_sharpe_ratio(sharpe_ratio), m_net_profit(net_profit), m_profit_factor(profit_factor), m_recovery_factor(recovery_factor) {}
                     CFrameData (void) :
                        m_pass(0), m_sharpe_ratio(0), m_net_profit(0), m_profit_factor(0), m_recovery_factor(0) {}
                    ~CFrameData (void) {}
  };
After each pass of the optimizer is completed, a frame is sent to the terminal. It contains all the data that was received at the end of this pass. To access the data of any pass, one should search for a frame with the desired number in a loop through all the received frames and retrieve its data. This is not expedient at all. We should be able to quickly access the data of the desired pass, and be able to sort all the passes by the specified property, since we will need to select the top three passes: one from each of the four optimization criteria.
The way out is to cache passes. To do this, we need a frame object class. After completing each pass and sending a frame to the terminal, you need to create a frame object, fill in its properties with the data of the received test frame and locate the frame object in the list. Further, after the optimization process is completed and all frames are retrieved, we will have copies of all frames in the frame list. And now you can sort this list of frames by required properties and quickly retrieve data of the desired frame from it.
It is worth noting that in Compare() method, we had to compare real numbers not by comparing the normalized difference with zero, but by comparing two normalized numbers with each other. Why so?
There are different ways to compare two real numbers. The first one is to compare unnormalized numbers. First, compare with the ternary operator by "more", then by "less", and at the end, what is left means "equal". Alternatively, you can compare the normalized difference of two numbers with zero. However, here we had to normalize both numbers to two digits, and compare these values.
The fact is that in the terminal, the results table shows two-digit numbers in optimization results. But internally, these numbers are not normalized to two digits. In other words, a two-digit representation of the results is reflected only in the results table. And if there are values in the table, for example, 1.09 and 1.08, then in fact this may not be the case. There may be such numbers as: 1.085686399864 and 1.081254322375. Both numbers are rounded up to 1.09 and 1.08 in the table. But when comparing, you may come across the fact that both numbers are rounded by normalization to the same value. And if not normalize, then the value of 1.09 may be missing. And this will lead to an incorrect search for the best passes.
The solution is to normalize both numbers to two digits, and only then compare their rounded values.
Frame Viewer Class:
//+------------------------------------------------------------------+ //| ▸Frame viewer class | //+------------------------------------------------------------------+ class CFrameViewer : public CObject { private: int m_w; // Chart width int m_h; // Chart height color m_selected_color; // Color of selected series from top three uint m_line_width; // Width of line of selected series from top three bool m_completed; // Optimization completion flag CFrameData m_frame_tmp; // Frame object for searching by property CArrayObj m_list_frames; // List of frames CTabControl m_tab_control; // Tab Control //--- Declare tab objects on Tab Control //--- Tab 0 (Optimization) of Tab Control CTableDataControl m_table_inp_0; // Table of optimization parameters on tab 0 CTableDataControl m_table_stat_0; // Table of optimization results on tab 0 CTableDataControl m_table_stat_0; // Table of optimization results on tab 0 CColorProgressBar*m_progress_bar; // Progress bar on optimization chart on tab 0 //--- Tab 1 (Sharpe Ratio) of Tab Control CTableDataControl m_table_inp_1; // Table of optimization parameters on tab 1 CTableDataControl m_table_stat_1; // Table of optimization results on tab 1 CStatChart m_chart_stat_1; // Table of optimization results on tab 1 //--- Tab 2 (Net Profit) of Tab Control CTableDataControl m_table_inp_2; // Table of optimization parameters on tab 2 CTableDataControl m_table_stat_2; // Table of optimization results on tab 2 CStatChart m_chart_stat_2; // Chart of optimization results on tab 2 //--- Tab 3 (Profit Factor) of Tab Control CTableDataControl m_table_inp_3; // Table of optimization parameters on tab 3 CTableDataControl m_table_stat_3; // Table of optimization results on tab 3 CStatChart m_chart_stat_3; // Chart of optimization results on tab 3 //--- Tab 4 (Recovery Factor) of Tab Control CTableDataControl m_table_inp_4; // Table of optimization parameters on tab 4 CTableDataControl m_table_stat_4; // able of optimization results on tab 4 CStatChart m_chart_stat_4; // Chart of optimization results on tab 4 protected: //--- Returns pointer to table of optimization parameters by tab index CTableDataControl*GetTableInputs(const uint tab_id) { switch(tab_id) { case 0 : return this.m_table_inp_0.Get(); case 1 : return this.m_table_inp_1.Get(); case 2 : return this.m_table_inp_2.Get(); case 3 : return this.m_table_inp_3.Get(); case 4 : return this.m_table_inp_4.Get(); default: return NULL; } } //--- Returns pointer to table of optimization results by tab index CTableDataControl*GetTableStats(const uint tab_id) { switch(tab_id) { case 0 : return this.m_table_stat_0.Get(); case 1 : return this.m_table_stat_1.Get(); case 2 : return this.m_table_stat_2.Get(); case 3 : return this.m_table_stat_3.Get(); case 4 : return this.m_table_stat_4.Get(); default: return NULL; } } //--- Returns pointer to chart of optimization results by tab index CStatChart *GetChartStats(const uint tab_id) { switch(tab_id) { case 0 : return this.m_chart_stat_0.Get(); case 1 : return this.m_chart_stat_1.Get(); case 2 : return this.m_chart_stat_2.Get(); case 3 : return this.m_chart_stat_3.Get(); case 4 : return this.m_chart_stat_4.Get(); default: return NULL; } } //--- Adds frame object to list bool AddFrame(CFrameData *frame) { if(frame==NULL) { ::PrintFormat("%s: Error: Empty object passed",__FUNCTION__); return false; } this.m_frame_tmp.SetPass(frame.Pass()); this.m_list_frames.Sort(FRAME_PROP_PASS_NUM); int index=this.m_list_frames.Search(frame); if(index>WRONG_VALUE) return false; return this.m_list_frames.Add(frame); } //--- Draws table of optimization statistics on specified tab void TableStatDraw(const uint tab_id, const int x, const int y, const int w, const int h, const bool chart_redraw); //--- Draws table of input optimization parameters on specified tab void TableInpDraw(const uint tab_id, const int x, const int y, const int w, const int h, const uint rows, const bool chart_redraw); //--- Draws chart of optimization on specified tab void ChartOptDraw(const uint tab_id, const bool opt_completed, const bool chart_redraw); //--- Draws data tables and optimization chart void DrawDataChart(const uint tab_id); //--- Draws charts of top three passes by optimization criterion void DrawBestFrameData(const uint tab_id, const int res_index); //--- Controls view of control objects on optimization charts void ControlObjectsView(const uint tab_id); //--- Replaying frames after optimization completion void ReplayFrames(const int delay_ms); //--- Retrieving data of current frame and printing it on specified tab in table and on optimization results chart bool DrawFrameData(const uint tab_id, const string text, color clr, const uint line_width, ulong &pass, string ¶ms[], uint &par_count, double &data[]); //--- Prints data of specified frame to optimization chart bool DrawFrameDataByPass(const uint tab_id, const ulong pass_num, const string text, color clr, const uint line_width, double &data[]); //--- Fills array with frame indexes of top three passes for specified optimization criterion (by tab index) bool FillArrayBestFrames(const uint tab_id, ulong &array_passes[]); //--- Prints out three best passes on each tab on optimization results charts void DrawBestFrameDataAll(void); //--- Searches for and returns pointer to frame object with a property value less than sample CFrameData *FrameSearchLess(CFrameData *frame, const int mode); public: //--- Setting thickness of selected line void SetSelectedLineWidth(const uint width) { this.m_line_width=width; } //--- Setting color of profitable series void SetProfitColorLine(const color clr) { int total=this.m_tab_control.TabsTotal(); for(int i=1; i<total; i++) { CStatChart *chart=this.GetChartStats(i); if(chart!=NULL) chart.SetProfitColorLine(clr); } } //--- Setting color of loss series void SetLossColorLine(const color clr) { int total=this.m_tab_control.TabsTotal(); for(int i=1; i<total; i++) { CStatChart *chart=this.GetChartStats(i); if(chart!=NULL) chart.SetLossColorLine(clr); } } //--- Setting color of selected series void SetSelectedLineColor(const color clr) { int total=this.m_tab_control.TabsTotal(); for(int i=1; i<total; i++) { CStatChart *chart=this.GetChartStats(i); if(chart!=NULL) chart.SetSelectedLineColor(clr); } } //--- Event handlers of strategy tester void OnTester(const double OnTesterValue); int OnTesterInit(const int lines, const int selected_line_width, const color selected_line_color); void OnTesterPass(void); void OnTesterDeinit(void); //--- Chart event handlers void OnChartEvent(const int id,const long &lparam,const double &dparam,const string &sparam,const int delay_ms); protected: //--- Handler for (1) changing tab of Tab Control element, (2) selecting Button Switch void OnTabSwitchEvent(const int tab_id); void OnButtonSwitchEvent(const int tab_id, const uint butt_id); public: //--- Constructor/destructor CFrameViewer(void); ~CFrameViewer(void){ this.m_list_frames.Clear(); } };
We know exactly how many tabs there will be, and which elements will be located on each tab. Therefore, there is no creation of new objects here, but simply instances of the necessary objects for each tab, access methods to them, and methods for the class to work are declared.
Constructors
//+------------------------------------------------------------------+
//| Constructor                                                      |
//+------------------------------------------------------------------+
CFrameViewer::CFrameViewer(void) : m_completed(false), m_progress_bar(NULL), m_selected_color(clrDodgerBlue), m_line_width(1)
  {
//--- Chart window size
   this.m_w=(int)::ChartGetInteger(0, CHART_WIDTH_IN_PIXELS);
   this.m_h=(int)::ChartGetInteger(0, CHART_HEIGHT_IN_PIXELS);
//--- Get pointer to progress bar from statistics chart object
   this.m_progress_bar=this.m_chart_stat_0.GetProgressBar();
   this.m_list_frames.Clear();
  }
In the constructor, we get and store the width and height of the chart on which the Expert Advisor is running, find and write a pointer to the progress bar and clear the list of frames.
When launching optimization, before it starts, prepare a chart on which a copy of the Expert Advisor in frame mode will be launched in the client terminal. The chart will be detached from the terminal, Tab Control will be located on it in its full size. And the remaining elements will be located on its tabs, which will display balance charts of passes and control buttons.
All this must be done in OnTesterInit() handler. To do this, the class provides handlers of the same name, which are launched in the Expert Advisor from an instance of CFrameViewer class.
Handler OnTesterInit:
//+------------------------------------------------------------------+
//| It must be called in handler of OnTesterInit() Expert Advisor    |
//+------------------------------------------------------------------+
int CFrameViewer::OnTesterInit(const int lines, const int selected_line_width, const color selected_line_color)
  {
//--- Chart ID with expert running in Frame mode
   long chart_id=::ChartID();

//--- Preparing a floating chart for drawing statistics tables and balance lines
   ::ResetLastError();
   if(!::ChartSetInteger(chart_id, CHART_SHOW, false))
     {
      ::PrintFormat("%s: ChartSetInteger() failed. Error %d",__FUNCTION__, GetLastError());
      return INIT_FAILED;
     }
   if(!::ChartSetInteger(chart_id, CHART_IS_DOCKED, false))
     {
      ::PrintFormat("%s: ChartSetInteger() failed. Error %d",__FUNCTION__, GetLastError());
      return INIT_FAILED;
     }
//--- Clearing chart completely of all graphical objects
   ::ObjectsDeleteAll(chart_id);

//--- Based on chart size create Tab Control with five tabs
   int w=(int)::ChartGetInteger(chart_id, CHART_WIDTH_IN_PIXELS);
   int h=(int)::ChartGetInteger(chart_id, CHART_HEIGHT_IN_PIXELS);
   if(this.m_tab_control.Create("TabControl", "", 0, 0, w, h))
     {
      //--- If control is created successfully, add five tabs to it
      bool res=true;
      for(int i=0; i<5; i++)
        {
         string tab_text=(i==1 ? "Sharpe Ratio" : i==2 ? "Net Profit" : i==3 ? "Profit Factor" : i==4 ? "Recovery Factor" : "Optimization");
         res &=this.m_tab_control.AddTab(i, tab_text);
        }
      if(!res)
        {
         ::PrintFormat("%s: Errors occurred while adding tabs to the Tab Control",__FUNCTION__);
         return INIT_FAILED;
        }
     }
   else
     {
      Print("Tab Control creation failed");
      return INIT_FAILED;
     }

//--- CCanvas objects in workspace of tab 0 (Optimization) for drawing background images and text
   CCanvas *tab0_background=this.m_tab_control.GetTabBackground(0);
   CCanvas *tab0_foreground=this.m_tab_control.GetTabForeground(0);
//--- CCanvas objects in workspace of tab 1 (Sharpe Ratio) for drawing background images and text
   CCanvas *tab1_background=this.m_tab_control.GetTabBackground(1);
   CCanvas *tab1_foreground=this.m_tab_control.GetTabForeground(1);
//--- CCanvas objects in workspace of tab 2 (Net Profit) for drawing background images and text
   CCanvas *tab2_background=this.m_tab_control.GetTabBackground(2);
   CCanvas *tab2_foreground=this.m_tab_control.GetTabForeground(2);
//--- CCanvas objects in workspace of tab 3 (Profit Factor) for drawing background images and text
   CCanvas *tab3_background=this.m_tab_control.GetTabBackground(3);
   CCanvas *tab3_foreground=this.m_tab_control.GetTabForeground(3);
//--- CCanvas objects in workspace of tab 4 (Recovery Factor) for drawing background images and text
   CCanvas *tab4_background=this.m_tab_control.GetTabBackground(4);
   CCanvas *tab4_foreground=this.m_tab_control.GetTabForeground(4);

//--- Set tab identifiers for objects of optimization statistics charts
   this.m_chart_stat_0.SetTabID(0);
   this.m_chart_stat_1.SetTabID(1);
   this.m_chart_stat_2.SetTabID(2);
   this.m_chart_stat_3.SetTabID(3);
   this.m_chart_stat_4.SetTabID(4);

//--- Indicate for objects of statistics charts that we draw on tab with corresponding index
   this.m_chart_stat_0.SetCanvas(tab0_background, tab0_foreground);
   this.m_chart_stat_1.SetCanvas(tab1_background, tab1_foreground);
   this.m_chart_stat_2.SetCanvas(tab2_background, tab2_foreground);
   this.m_chart_stat_3.SetCanvas(tab3_background, tab3_foreground);
   this.m_chart_stat_4.SetCanvas(tab4_background, tab4_foreground);

//--- Set number of series on optimization statistics charts
   this.m_chart_stat_0.SetLines(lines);
   this.m_chart_stat_1.SetLines(lines);
   this.m_chart_stat_2.SetLines(lines);
   this.m_chart_stat_3.SetLines(lines);
   this.m_chart_stat_4.SetLines(lines);

//--- Setting background and foreground colors of optimization statistics charts
   this.m_chart_stat_0.SetBackColor(clrIvory);
   this.m_chart_stat_0.SetForeColor(C'200,200,200');
   this.m_chart_stat_1.SetBackColor(clrIvory);
   this.m_chart_stat_1.SetForeColor(C'200,200,200');
   this.m_chart_stat_2.SetBackColor(clrIvory);
   this.m_chart_stat_2.SetForeColor(C'200,200,200');
   this.m_chart_stat_3.SetBackColor(clrIvory);
   this.m_chart_stat_3.SetForeColor(C'200,200,200');
   this.m_chart_stat_4.SetBackColor(clrIvory);
   this.m_chart_stat_4.SetForeColor(C'200,200,200');

//--- Set thickness and color of selected line of best pass
   this.SetSelectedLineWidth(selected_line_width);
   this.SetSelectedLineColor(selected_line_color);

//--- Draw two tables with optimization results and input parameters on tab 0 (Optimization),
//--- and window with progress bar for printing charts and optimization process
   this.TableStatDraw(0, 4, 4, CELL_W*2, CELL_H, false);
   this.TableInpDraw(0, 4, this.m_table_stat_0.Y2()+4, CELL_W*2, CELL_H, 0, false);
   this.ChartOptDraw(0, this.m_completed, true);
//--- Create optimization replay button on tab 0
   if(!this.m_chart_stat_0.CreateButtonReplay())
     {
      Print("Button Replay creation failed");
      return INIT_FAILED;
     }

//--- Draw two tables with optimization results and input parameters on tab 1 (Sharpe Ratio),
//--- and window to print charts of optimization results
   this.TableStatDraw(1, 4, 4, CELL_W*2, CELL_H, false);
   this.TableInpDraw(1, 4, this.m_table_stat_1.Y2()+4, CELL_W*2, CELL_H, 0, false);
   this.ChartOptDraw(1, this.m_completed, true);
//--- Create result selection button on tab 1
   if(!this.m_chart_stat_1.CreateButtonResults())
     {
      Print("Tab1: There were errors when creating the result buttons");
      return INIT_FAILED;
     }

//--- Draw two tables with optimization results and input parameters on tab 2 (Net Profit),
//--- and window to print charts of optimization results
   this.TableStatDraw(2, 4, 4, CELL_W*2, CELL_H, false);
   this.TableInpDraw(2, 4, this.m_table_stat_1.Y2()+4, CELL_W*2, CELL_H, 0, false);
   this.ChartOptDraw(2, this.m_completed, true);
//--- Create result selection button on tab 2
   if(!this.m_chart_stat_2.CreateButtonResults())
     {
      Print("Tab2: There were errors when creating the result buttons");
      return INIT_FAILED;
     }

//--- Draw two tables with optimization results and input parameters on tab 3 (Profit Factor),
//--- and window to print charts of optimization results
   this.TableStatDraw(3, 4, 4, CELL_W*2, CELL_H, false);
   this.TableInpDraw(3, 4, this.m_table_stat_1.Y2()+4, CELL_W*2, CELL_H, 0, false);
   this.ChartOptDraw(3, this.m_completed, true);
//--- Create result selection button on tab 3
   if(!this.m_chart_stat_3.CreateButtonResults())
     {
      Print("Tab3: There were errors when creating the result buttons");
      return INIT_FAILED;
     }

//--- Draw two tables with optimization results and input parameters on tab 4 (Recovery Factor),
//--- and window to print charts of optimization results
   this.TableStatDraw(4, 4, 4, CELL_W*2, CELL_H, false);
   this.TableInpDraw(4, 4, this.m_table_stat_1.Y2()+4, CELL_W*2, CELL_H, 0, false);
   this.ChartOptDraw(4, this.m_completed, true);
//--- Create result selection button on tab 4
   if(!this.m_chart_stat_4.CreateButtonResults())
     {
      Print("Tab4: There were errors when creating the result buttons");
      return INIT_FAILED;
     }

   return INIT_SUCCEEDED;
  }
Here, all elements are created block-by-block. Each block of code is responsible for creating some element of the program interface.
After the optimization is completed, it is necessary to make some changes to the created interface — to repaint chart headers, change texts on them and print the replay start button on the first tab (with identifier of 0). All this must be implemented in OnTesterDeinit() handler.
Handler OnTesterDeinit:
//+------------------------------------------------------------------+
//| It must be called in handler of OnTesterDeinit() Expert Advisor  |
//+------------------------------------------------------------------+
void CFrameViewer::OnTesterDeinit(void)
  {
//--- Get pointers to canvas to draw background and foreground
   CCanvas *background=this.m_tab_control.GetTabBackground(0);
   CCanvas *foreground=this.m_tab_control.GetTabForeground(0);

   if(background==NULL || foreground==NULL)
      return;

//--- Set optimization completion flag
   this.m_completed=true;

//--- Chart header coordinates
   int x1=this.m_chart_stat_0.HeaderX1();
   int y1=this.m_chart_stat_0.HeaderY1();
   int x2=this.m_chart_stat_0.HeaderX2();
   int y2=this.m_chart_stat_0.HeaderY2();

   int x=(x1+x2)/2;
   int y=(y1+y2)/2;

//--- Repaint background and erase header text
   background.FillRectangle(x1, y1, x2, y2, ::ColorToARGB(clrLightGreen));
   foreground.FillRectangle(x1, y1, x2, y2, 0x00FFFFFF);

//--- Change text and color of header
   string text="Optimization Complete: Click to Replay";
   foreground.FontSet("Calibri", -100, FW_BLACK);
   foreground.TextOut(x, y, text, ::ColorToARGB(clrMidnightBlue), TA_CENTER|TA_VCENTER);
   background.Update(false);
   foreground.Update(true);

//--- Get active tab index and call method for controlling print of control objects on optimization charts
   int tab_selected=this.m_tab_control.GetSelectedTabID();
   this.ControlObjectsView(tab_selected);

//--- On each tab (1-4), draw charts of three best optimization passes
   this.DrawBestFrameDataAll();
   ::ChartRedraw();
  }
Upon completion of each optimizer pass, a Tester event is generated, which can be handled in OnTester() handler. It is launched on the side of EA instance running on the testing agent.
In this handler, it is necessary to collect all the data about the completed pass, form a frame and send it to the client terminal using FrameAdd() function.
Handler OnTester:
//+------------------------------------------------------------------+
//| Prepares array of balance values and sends it in frame           |
//| It must be called in Expert Advisor in OnTester() handler        |
//+------------------------------------------------------------------+
void CFrameViewer::OnTester(const double OnTesterValue)
  {
//--- Variables for working with pass results
   double balance[];
   int    data_count=0;
   double balance_current=::TesterStatistics(STAT_INITIAL_DEPOSIT);

//--- Temporary variables for working with trades
   ulong  ticket=0;
   double profit;
   string symbol;
   long   entry;

//--- Request entire trading history
   ::ResetLastError();
   if(!::HistorySelect(0, ::TimeCurrent()))
     {
      PrintFormat("%s: HistorySelect() failed. Error ",__FUNCTION__, ::GetLastError());
      return;
     }

//--- Collect data of trades
   uint deals_total=::HistoryDealsTotal();
   for(uint i=0; i<deals_total; i++)
     {
      ticket=::HistoryDealGetTicket(i);
      if(ticket==0)
         continue;
      symbol=::HistoryDealGetString(ticket, DEAL_SYMBOL);
      entry =::HistoryDealGetInteger(ticket, DEAL_ENTRY);
      profit=::HistoryDealGetDouble(ticket, DEAL_PROFIT);
      if(entry!=DEAL_ENTRY_OUT && entry!=DEAL_ENTRY_INOUT)
         continue;

      balance_current+=profit;
      data_count++;
      ::ArrayResize(balance, data_count);
      balance[data_count-1]=balance_current;
     }
//--- data[] array to send data to frame
   double data[];
   ::ArrayResize(data, ::ArraySize(balance)+DATA_COUNT);
   ::ArrayCopy(data, balance, DATA_COUNT, 0);

//--- Fill in first DATA_COUNT values of array with test results
   data[0]=::TesterStatistics(STAT_SHARPE_RATIO);           // Sharpe Ratio
   data[1]=::TesterStatistics(STAT_PROFIT);                 // net profit
   data[2]=::TesterStatistics(STAT_PROFIT_FACTOR);          // profit factor
   data[3]=::TesterStatistics(STAT_RECOVERY_FACTOR);        // recovery factor
   data[4]=::TesterStatistics(STAT_TRADES);                 // number of trades
   data[5]=::TesterStatistics(STAT_DEALS);                  // number of deals
   data[6]=::TesterStatistics(STAT_EQUITY_DDREL_PERCENT);   // maximum drawdown of funds as percentage
   data[7]=OnTesterValue;                                   // value of user optimization criterion
   if(data[2]==DBL_MAX)
      data[2]=0;
//--- Create data frame and send it to terminal
   if(!::FrameAdd(::MQLInfoString(MQL_PROGRAM_NAME), FRAME_ID, deals_total, data))
      ::PrintFormat("%s: Frame add error: ",__FUNCTION__, ::GetLastError());
  }
When the Expert Advisor receives a frame sent from the agent in the client terminal, a TesterPass event is generated, which is handled in the OnTesterPass() handler.
In this handler, take information from the frame, draw a graph of the balance of this pass on the chart, and fill in the tables of test results and parameters. Save the handled frame in a new frame object and add it to a list of frames for working with it when it is necessary to search for the necessary passes to print them on charts.
Handler OnTesterPass:
//+------------------------------------------------------------------+
//| Retrieves data frame during optimization and prints chart        |
//| It must be called in Expert Advisor in OnTesterPass() handler    |
//+------------------------------------------------------------------+
void CFrameViewer::OnTesterPass(void)
  {
//--- Variables to work with frames
   string name;
   ulong  pass;
   long   id;
   double value, data[];
   string params[];
   uint   par_count;

//--- Auxiliary variables
   static datetime start=::TimeLocal();
   static int      frame_counter=0;

//--- When receive new frame, we receive data from it
   while(!::IsStopped() && ::FrameNext(pass, name, id, value, data))
     {
      frame_counter++;
      string text=::StringFormat("Frames completed (tester passes): %d in %s", frame_counter,::TimeToString(::TimeLocal()-start, TIME_MINUTES|TIME_SECONDS));
      //--- Get input parameters of Expert Advisor, for which frame was formed, and send them to tables and on chart
      //--- Upon successful retrieval of frame write its data to frame object and locate it in list
      if(this.DrawFrameData(0, text, clrNONE, 0, pass, params, par_count, data))
        {
         //--- Results of tester's pass
         double sharpe_ratio=data[0];
         double net_profit=data[1];
         double profit_factor=data[2];
         double recovery_factor=data[3];

         //--- Create new frame object and save it in list
         CFrameData *frame=new CFrameData(pass, sharpe_ratio, net_profit, profit_factor, recovery_factor);
         if(frame!=NULL)
           {
            if(!this.AddFrame(frame))
               delete frame;
           }
         ::ChartRedraw();
        }
     }
  }
After the optimization process is completed, the Expert Advisor running in frame mode will remain working in the terminal on the floating chart. And all work with this Expert Advisor will be organized inside OnChartEvent() handler, since we will control the processes we need using buttons on the chart and the mouse cursor.
Handler OnChartEvent:
//+------------------------------------------------------------------+
//|  Event handling on chart                                         |
//+------------------------------------------------------------------+
void CFrameViewer::OnChartEvent(const int id,const long &lparam,
                                   const double &dparam,const string &sparam,
                                   const int delay_ms)
  {
//--- Call event handlers for the tab control object and optimization result charts
   this.m_tab_control.OnChartEvent(id, lparam, dparam, sparam);
   this.m_chart_stat_0.OnChartEvent(id, lparam, dparam, sparam);
   this.m_chart_stat_1.OnChartEvent(id, lparam, dparam, sparam);
   this.m_chart_stat_2.OnChartEvent(id, lparam, dparam, sparam);
   this.m_chart_stat_3.OnChartEvent(id, lparam, dparam, sparam);
   this.m_chart_stat_4.OnChartEvent(id, lparam, dparam, sparam);

//--- If chart change event has arrived
   if(id==CHARTEVENT_CHART_CHANGE)
     {
      //--- get chart size
      int w=(int)::ChartGetInteger(0, CHART_WIDTH_IN_PIXELS);
      int h=(int)::ChartGetInteger(0, CHART_HEIGHT_IN_PIXELS);
      if(w!=this.m_w || h!=this.m_h)
        {
         if(w==0 || h==0)
            return;

         //--- Change size of Tab Control
         this.m_tab_control.Resize(w, h);

         //--- Get ID of selected tab and draw data tables and optimization chart on tab
         int tab_selected=this.m_tab_control.GetSelectedTabID();
         this.DrawDataChart(tab_selected);

         //--- Get pointer to toggle button and selected button for printing optimization results
         CButtonSwitch *button_switch=(tab_selected>0 ? this.GetChartStats(tab_selected).ButtonResult() : NULL);
         uint res_index=(button_switch!=NULL ? button_switch.SelectedButton() : -1);

         //--- Depending on selected tab
         switch(tab_selected)
           {
            //--- tab 0 (Optimization)
            case 0 :
               //--- Draw chart with line of last pass and two empty tables
               this.DrawDataChart(0);
               //--- It starts replay of performed optimization,
               //--- which stops working with the rest while replay goes on
               //if(this.m_completed)
               //   this.ReplayFrames(1);
              break;

            //--- tabs 1 - 4
            default:
               //--- Retrieve index of selected optimization pass button
               res_index=button_switch.SelectedButton();
               //--- Draw chart with results of three best passes of selected tab
               this.DrawDataChart(tab_selected);
               this.DrawBestFrameData(tab_selected, -1);
               this.DrawBestFrameData(tab_selected, res_index);

               //--- On tab 0 draw chart with line of last pass and two empty tables
               this.DrawDataChart(0);
               //--- It starts replay of performed optimization,
               //--- which stops working with the rest while replay goes on
               //--- To re-draw charts of all passes, you can click replay button
               //if(this.m_completed)
               //   this.ReplayFrames(1);
              break;
           }

         //--- Remember new dimensions for later verification
         this.m_w=w;
         this.m_h=h;
        }
     }

//--- If optimization process is not completed, exit
   if(!this.m_completed)
      return;

//--- If custom event has arrived
   if(id>CHARTEVENT_CUSTOM)
     {
      //--- If Replay button event has arrived and optimization is complete
      if(sparam==this.m_chart_stat_0.ButtonReplay().Name() && this.m_completed)
        {
         //--- hide Replay button,
         this.m_chart_stat_0.ButtonReplay().Hide();

         //--- Initialize chart of optimization results,
         this.ChartOptDraw(0, this.m_completed, true);

         //--- start replay,
         this.m_completed=false;       // block it so as not to run it several times in a row
         this.ReplayFrames(delay_ms);  // replay procedure
         this.m_completed=true;        // unlock

         //--- After replay is complete, show Replay button and redraw chart
         this.m_chart_stat_0.ButtonReplay().Show();
         ::ChartRedraw();
        }

      //--- Get pointers to tab buttons
      CTabButton *tab_btn0=this.m_tab_control.GetTabButton(0);
      CTabButton *tab_btn1=this.m_tab_control.GetTabButton(1);
      CTabButton *tab_btn2=this.m_tab_control.GetTabButton(2);
      CTabButton *tab_btn3=this.m_tab_control.GetTabButton(3);
      CTabButton *tab_btn4=this.m_tab_control.GetTabButton(4);
      if(tab_btn0==NULL || tab_btn1==NULL || tab_btn2==NULL || tab_btn3==NULL || tab_btn4==NULL)
         return;

      //--- Get ID of selected tab
      int tab_selected=this.m_tab_control.GetSelectedTabID();

      //--- If switch event has arrived to tab 0
      if(sparam==tab_btn0.Name())
        {
         //--- On tab 0, draw chart with last pass line and two tables with empty results
         this.DrawDataChart(0);
         //--- It starts replay of performed optimization
         //--- (it can take a long time - if desired, you can click Replay button to print charts)
         //if(this.m_completed)
         //   this.ReplayFrames(1);
         ::ChartRedraw();
         return;
        }

      //--- Get pointer to chart of selected tab
      CStatChart *chart_stat=this.GetChartStats(tab_selected);
      if(tab_selected==0 || chart_stat==NULL)
         return;
      //--- Get pointers to chart buttons of selected tab (tab index 1-4)
      CButtonTriggered *button_min=chart_stat.ButtonResultMin();
      CButtonTriggered *button_mid=chart_stat.ButtonResultMid();
      CButtonTriggered *button_max=chart_stat.ButtonResultMax();
      if(button_min==NULL || button_mid==NULL || button_max==NULL)
         return;

      //--- If switch event has arrived to tab 1
      if(sparam==tab_btn1.Name())
        {
         //--- call handler for switching to tab
         this.OnTabSwitchEvent(1);
        }
      //--- If switch event has arrived to tab 2
      if(sparam==tab_btn2.Name())
        {
         //--- call handler for switching to tab
         this.OnTabSwitchEvent(2);
        }
      //--- If switch event has arrived to tab 3
      if(sparam==tab_btn3.Name())
        {
         //--- call handler for switching to tab
         this.OnTabSwitchEvent(3);
        }
      //--- If switch event has arrived to tab 4
      if(sparam==tab_btn4.Name())
        {
         //--- call handler for switching to tab
         this.OnTabSwitchEvent(4);
        }

      //--- If event has arrived click on minimum result button of selected tab
      if(sparam==button_min.Name())
        {
         //--- call handler for toggle button switching
         this.OnButtonSwitchEvent(tab_selected, 0);
        }
      //--- If event has arrived click on mid result button of selected tab
      if(sparam==button_mid.Name())
        {
         //--- call handler for toggle button switching
         this.OnButtonSwitchEvent(tab_selected, 1);
        }
      //--- If event has arrived click on max result button of selected tab
      if(sparam==button_max.Name())
        {
         //--- call handler for toggle button switching
         this.OnButtonSwitchEvent(tab_selected, 2);
        }
     }
  }
The tab switching events of the tab control and the click of the toggle buttons are handled in the corresponding custom handlers. All the actions performed in them are identical. The only difference is in tab ID. Therefore, these events are designed to be handled in their own handlers.
Tab switching handler:
//+------------------------------------------------------------------+
//| ▸Tab switching handler                                           |
//+------------------------------------------------------------------+
void CFrameViewer::OnTabSwitchEvent(const int tab_id)
  {
   //--- Get pointer to chart of selected tab
   CStatChart *chart_stat=this.GetChartStats(tab_id);
   if(chart_stat==NULL)
      return;

   //--- Get pointer to chart toggle button of selected tab
   CButtonSwitch *button_switch=chart_stat.ButtonResult();
   if(button_switch==NULL)
      return;

   //--- Index of pressed button
   uint butt_index=button_switch.SelectedButton();
   //--- Initialize chart of results on tab_id and
   this.DrawDataChart(tab_id);
   //--- call method that controls display of control elements on all tabs
   this.ControlObjectsView(tab_id);

   //--- Draw all three best passes
   this.DrawBestFrameData(tab_id, -1);
   //--- Highlight pass selected by button
   this.DrawBestFrameData(tab_id, butt_index);
  }
Handler for toggle button switching:
//+------------------------------------------------------------------+
//| Handler for toggle button switching                              |
//+------------------------------------------------------------------+
void CFrameViewer::OnButtonSwitchEvent(const int tab_id, const uint butt_id)
  {
   //--- Initialize chart of results on tab_id
   this.DrawDataChart(tab_id);
   //--- Draw all three best passes
   this.DrawBestFrameData(tab_id, -1);
   //--- Highlight pass selected by butt_id button
   this.DrawBestFrameData(tab_id, butt_id);
  }
A method that draws data tables and optimization chart:
//+------------------------------------------------------------------+
//| Draws data tables and optimization chart                         |
//+------------------------------------------------------------------+
void CFrameViewer::DrawDataChart(const uint tab_id)
  {
//--- Draw table of statistics, table of input parameters, and optimization chart
   this.TableStatDraw(tab_id, 4, 4, CELL_W*2, CELL_H, false);
   this.TableInpDraw(tab_id, 4, this.GetTableStats(tab_id).Y2()+4, CELL_W*2, CELL_H, this.GetTableInputs(tab_id).RowsTotal(), false);
   this.ChartOptDraw(tab_id, this.m_completed, true);
   //--- call method that controls display of control elements on all tabs
   this.ControlObjectsView(tab_id);
  }
After all the tables and charts are drawn, it is necessary to arrange the controls correctly. Hide buttons on inactive tabs and display buttons on the active one. This is implemented by ControlObjectsView method.
A method that controls the display of controls on optimization charts:
//+-------------------------------------------------------------------+
//|Controls view of control objects on optimization charts            |
//+-------------------------------------------------------------------+
void CFrameViewer::ControlObjectsView(const uint tab_id)
  {
//--- Get index of active tab
   int tab_index=this.m_tab_control.GetSelectedTabID();

//--- Get pointer to active tab and optimization statistics table
   CTab              *tab=this.m_tab_control.GetTab(tab_index);
   CTableDataControl *table_stat=this.GetTableStats(tab_index);

   if(tab==NULL || table_stat==NULL)
      return;

//--- Coordinates of left and right boundaries of header of optimization results chart
   int w=0, cpx=0, x=0, y=0;
   int x1=table_stat.X2()+10;
   int x2=tab.GetField().Right()-10;

//--- Depending on selected tab index
   switch(tab_index)
     {
      //--- Optimization
      case 0 :
         //--- Shift Replay button to center of header
         w=this.m_chart_stat_0.ButtonReplay().Width();
         cpx=(x1+x2)/2;
         x=cpx-w/2;
         this.m_chart_stat_0.ButtonReplay().MoveX(x);

         //--- If optimization is completed, show button in foreground
         if(this.m_completed)
           {
            this.m_chart_stat_0.ButtonReplay().Show();
            this.m_chart_stat_0.ButtonReplay().BringToTop();
           }

         //--- Hide buttons of all other tabs
         this.m_chart_stat_1.ButtonsResultHide();
         this.m_chart_stat_2.ButtonsResultHide();
         this.m_chart_stat_3.ButtonsResultHide();
         this.m_chart_stat_4.ButtonsResultHide();
        break;

      //--- Sharpe Ratio
      case 1 :
         //--- Hide Replay button
         this.m_chart_stat_0.ButtonReplay().Hide();

         //--- Get Y coordinate and move toggle button to it
         y=this.m_chart_stat_1.ProgressBarY1()+CELL_H+2;
         this.m_chart_stat_1.ButtonResult().MoveY(y);

         //--- Move toggle button on tab 1 to foreground,
         //--- and hide all other buttons on other tabs
         this.m_chart_stat_1.ButtonsResultBringToTop();
         this.m_chart_stat_2.ButtonsResultHide();
         this.m_chart_stat_3.ButtonsResultHide();
         this.m_chart_stat_4.ButtonsResultHide();
        break;

      //--- Net Profit
      case 2 :
         this.m_chart_stat_0.ButtonReplay().Hide();

         //--- Get Y coordinate and move toggle button to it
         y=this.m_chart_stat_2.ProgressBarY1()+CELL_H+2;
         this.m_chart_stat_2.ButtonResult().MoveY(y);

         //--- Move toggle button on tab 2 to foreground,
         //--- and hide all other buttons on other tabs
         this.m_chart_stat_2.ButtonsResultBringToTop();
         this.m_chart_stat_1.ButtonsResultHide();
         this.m_chart_stat_3.ButtonsResultHide();
         this.m_chart_stat_4.ButtonsResultHide();
        break;

      //--- Profit Factor
      case 3 :
         this.m_chart_stat_0.ButtonReplay().Hide();

         //--- Get Y coordinate and move toggle button to it
         y=this.m_chart_stat_3.ProgressBarY1()+CELL_H+2;
         this.m_chart_stat_3.ButtonResult().MoveY(y);

         //--- Move toggle button on tab 3 to foreground,
         //--- and hide all other buttons on other tabs
         this.m_chart_stat_3.ButtonsResultBringToTop();
         this.m_chart_stat_1.ButtonsResultHide();
         this.m_chart_stat_2.ButtonsResultHide();
         this.m_chart_stat_4.ButtonsResultHide();
        break;

      //--- Recovery Factor
      case 4 :
         this.m_chart_stat_0.ButtonReplay().Hide();

         //--- Get Y coordinate and move toggle button to it
         y=this.m_chart_stat_4.ProgressBarY1()+CELL_H+2;
         this.m_chart_stat_4.ButtonResult().MoveY(y);

         //--- Move toggle button on tab 4 to foreground,
         //--- and hide all other buttons on other tabs
         this.m_chart_stat_4.ButtonsResultBringToTop();
         this.m_chart_stat_1.ButtonsResultHide();
         this.m_chart_stat_2.ButtonsResultHide();
         this.m_chart_stat_3.ButtonsResultHide();
        break;
      default:
        break;
     }
//--- Redraw chart
   ::ChartRedraw();
  }
A method that replays frames after optimization is complete:
//+------------------------------------------------------------------+
//| Replaying frames after optimization completion                   |
//+------------------------------------------------------------------+
void CFrameViewer::ReplayFrames(const int delay_ms)
  {
//--- Variables to work with frames
   string name;
   ulong  pass;
   long   id;
   double value, data[];
   string params[];
   uint   par_count;

//--- Frame counter
   int frame_counter=0;

//--- Reset progress bar counters
   this.m_progress_bar.Reset();
   this.m_progress_bar.Update(false);

//--- Move frame pointer to the beginning and start iterating through frames
   ::FrameFirst();
   while(!::IsStopped() && ::FrameNext(pass, name, id, value, data))
     {
      //--- Increase frame counter and prepare header text of optimization chart
      frame_counter++;
      string text=::StringFormat("Playing with pause %d ms: frame %d", delay_ms, frame_counter);
      //--- Get input parameters of Expert Advisor, for which frame is formed, frame data, and print them on chart
      if(this.DrawFrameData(0, text, clrNONE, 0, pass, params, par_count, data))
         ::ChartRedraw();

      //--- Wait for delay_ms milliseconds
      ::Sleep(delay_ms);
     }
  }
All received frames are available for viewing after optimization. Here, in a simple loop, from the very first frame, we move through all the available frames and print their data in tables and on the chart.
A method that prints data of the specified frame on optimization chart:
//+------------------------------------------------------------------+
//| Prints data of specified frame on optimization chart             |
//+------------------------------------------------------------------+
bool CFrameViewer::DrawFrameDataByPass(const uint tab_id, const ulong pass_num, const string text, color clr, const uint line_width, double &data[])
  {
//--- Variables to work with frames
   string name;
   ulong  pass;
   long   id;
   uint   par_count;
   double value;
   string params[];

//--- Move frame pointer to the beginning and start search of pass_num frame
   ::FrameFirst();
   while(::FrameNext(pass, name, id, value, data))
     {
      //--- If passe number matches the desired one -
      //--- get frame data and print it in table
      //--- and on chart on tab tab_id
      if(pass==pass_num)
        {
         if(DrawFrameData(tab_id, text, clr, line_width, pass, params, par_count, data))
            return true;
        }
     }
//--- Pass not found
   return false;
  }
Since the frames available after optimization can only be retrieved in a loop of iterating through FrameFirst() --> FrameNext(), and using standard methods, here we loop through all available frames in search of the one which pass number we want. As soon as the desired frame is found, its data is printed on the chart.
Basically, after optimization, we have a ready-made list of frame objects, and we can quickly get the desired object from the list. You can use such access to the desired frame, but in this case you will have to implement more methods to retrieve data from the frame object and the series array, convert them to the desired format and print them on the chart. But for now, access has been left exactly as presented in the method above, in order to reduce the amount of code in the class and simplify its understanding.
A method that draws charts of top three passes by optimization criterion:
//+------------------------------------------------------------------+
//| Draws charts of top three passes by optimization criterion       |
//+------------------------------------------------------------------+
void CFrameViewer::DrawBestFrameData(const uint tab_id, const int res_index)
  {
//--- If incorrect identifiers of table and pressed button are passed, exit
   if(tab_id<1 || tab_id>4 || res_index>2)
     {
      ::PrintFormat("%s: Error. Incorrect table (%u) or selected button (%d) identifiers passed",__FUNCTION__, tab_id, res_index);
      return;
     }

//--- Arrays for getting results of passes
   ulong array_passes[3];
   double data[];

//--- Create header text of pass chart
   string res=
     (
      tab_id==1 ? "Results by Sharpe Ratio"     :
      tab_id==2 ? "Results by Net Profit"       :
      tab_id==3 ? "Results by Profit Factor"    :
      tab_id==4 ? "Results by Recovery Factor"  :
      ""
     );
   string text="Optimization Completed: "+res;

//--- Fill in array_passes array by indexes of three best passes
   this.FillArrayBestFrames(tab_id, array_passes);
//--- If index of pass button is set to negative number -
   if(res_index<0)
     {
      //--- print all three passes on chart
      //--- (line color is specified as clrNONE for automatic line color selection of profitable or loss series)
      for(int i=0; i<(int)array_passes.Size(); i++)
         this.DrawFrameDataByPass(tab_id, array_passes[i], text, clrNONE, 0, data);
     }
   //--- Otherwise, print series indicated by index of pressed button on chart (res_index),
   //--- by color set in m_selected_color, and width specified in m_line_width
   else
      this.DrawFrameDataByPass(tab_id, array_passes[res_index], text, this.m_selected_color, this.m_line_width, data);
  }
Here, the array is first filled with the frame indexes of the top three passes in the FillArrayBestFrames() method, and then the desired pass (or all three of them) is printed on the chart.
A method that fills an array with frame indexes of the top three passes for the specified optimization criterion:
//+------------------------------------------------------------------+
//| Fills array with frame indexes of top three passes               |
//| for specified optimization criterion (by tab index)              |
//+------------------------------------------------------------------+
bool CFrameViewer::FillArrayBestFrames(const uint tab_id, ulong &array_passes[])
  {
//--- Clear array of optimization pass indexes passed to method
   ::ZeroMemory(array_passes);

   //FRAME_PROP_PASS_NUM,           // Pass number
   //FRAME_PROP_SHARPE_RATIO,       // Sharpe Ratio result
   //FRAME_PROP_NET_PROFIT,         // Net Profit result
   //FRAME_PROP_PROFIT_FACTOR,      // Profit Factor result
   //FRAME_PROP_RECOVERY_FACTOR,    // Recovery Factor result

//--- By using tab ID, determine property by which best optimization passes will be searched
//--- Check tab ID to be within 1 to 4
   if(tab_id<FRAME_PROP_SHARPE_RATIO || tab_id>FRAME_PROP_RECOVERY_FACTOR)
     {
      ::PrintFormat("%s: Error: Invalid tab ID passed (%u)",__FUNCTION__, tab_id);
      return false;
     }

//--- Convert table ID to frame property
   ENUM_FRAME_PROP prop=(ENUM_FRAME_PROP)tab_id;

//--- Sort frame list in ascending order by property,
//--- which corresponds to tab_id value as ENUM_FRAME_PROP
   this.m_list_frames.Sort(prop);

//--- After sorting, frame with best result will be at list end
//--- Using index, get frame from list with maximum result value and
   int index=this.m_list_frames.Total()-1;
   CFrameData *frame_next=this.m_list_frames.At(index);
   if(frame_next==NULL)
      return false;

//--- register pass number to last cell of array_passes
   array_passes[2]=frame_next.Pass();

//--- Now find objects for which optimization result in descending order is less than maximum found
//--- In loop from 1 to 0 (remaining cells of array_passes)
   for(int i=1; i>=0; i--)
     {
      //--- look for previous object with property value less than that of frame_next object
      frame_next=this.FrameSearchLess(frame_next, prop);
      //--- In next cell of array_passes, enter pass number of found object
      //--- If object is not found, it means that there are no objects with value less than that of frame_next object,
      //--- and in this case, enter its previous value to next cell of array_passes
      array_passes[i]=(frame_next!=NULL ? frame_next.Pass() : array_passes[i+1]);
     }
//--- Success
   return true;
  }
The entire method's logic is fully explained in comments to the code. At the end of method run in the array, the numbers of the top three passes will be recorded with size 3 by the optimization criterion corresponding to the tab number, on which chart the data of these passes must be printed. The FrameSearchLess() method is used to search for frames with a property value lower than that of the current one.
A method for searching for and returning a pointer to a frame object with a property value less than the sample:
//+------------------------------------------------------------------+
//| Searches for and returns pointer to frame object,                |
//| with property value less than sample                             |
//+------------------------------------------------------------------+
CFrameData *CFrameViewer::FrameSearchLess(CFrameData *frame, const int mode)
  {
//--- Depending on type of frame property
   switch(mode)
     {
      //--- to temporary object record corresponding property of object passed to method
      case FRAME_PROP_SHARPE_RATIO     :  this.m_frame_tmp.SetSharpeRatio(frame.SharpeRatio());       break;
      case FRAME_PROP_NET_PROFIT       :  this.m_frame_tmp.SetNetProfit(frame.NetProfit());           break;
      case FRAME_PROP_PROFIT_FACTOR    :  this.m_frame_tmp.SetProfitFactor(frame.ProfitFactor());     break;
      case FRAME_PROP_RECOVERY_FACTOR  :  this.m_frame_tmp.SetRecoveryFactor(frame.RecoveryFactor()); break;
      default                          :  this.m_frame_tmp.SetPass(frame.Pass());                     break;
     }
//--- Sort array of frames by specified property and
   this.m_list_frames.Sort(mode);
//--- get index of nearest object with lower property value, or -1
   int index=this.m_list_frames.SearchLess(&this.m_frame_tmp);
//--- Get object by index from list and return pointer to it, or NULL
   CFrameData *obj=this.m_list_frames.At(index);
   return obj;
  }
A frame is passed to the method, and in the sorted list of frames, SearchLess() method of CArrayObj class of the Standard Library is used to search for the nearest object whose property value is less than that of the one passed to the method.
A method that prints three best passes on optimization results charts on each tab
//+------------------------------------------------------------------+
//| Prints on optimization results charts                            |
//| on each tab three best passes                                    |
//+------------------------------------------------------------------+
void CFrameViewer::DrawBestFrameDataAll(void)
  {
//--- In a loop through all tabs from tab 1, draw charts of top three passes for each tab
   for(int i=1; i<this.m_tab_control.TabsTotal(); i++)
      this.DrawBestFrameData(i,-1);
  }
A method for retrieving data of current frame and printing it on specified tab in table and on optimization results chart:
//+-------------------------------------------------------------------+ //| Retrieving data of current frame and printing it on specified tab | //| in table and on optimization results chart | //+-------------------------------------------------------------------+ bool CFrameViewer::DrawFrameData(const uint tab_id, const string text, color clr, const uint line_width, ulong &pass, string ¶ms[], uint &par_count, double &data[]) { //--- Check passed tab ID if(tab_id>4) { ::PrintFormat("%s: Error: Invalid tab ID passed (%u)",__FUNCTION__, tab_id); return false; } //--- Get pointers to objects used on specified tab CCanvas *foreground=this.m_tab_control.GetTabForeground(tab_id); CTableDataControl *table_stat=this.GetTableStats(tab_id); CTableDataControl *table_inp=this.GetTableInputs(tab_id); CStatChart *chart_stat=this.GetChartStats(tab_id); if(foreground==NULL || table_stat==NULL || table_inp==NULL || chart_stat==NULL) return false; //--- Get input parameters of Expert Advisor, for which frame is formed, frame data, and print them on chart ::ResetLastError(); if(::FrameInputs(pass, params, par_count)) { //--- Draw table of input parameters on chart this.TableInpDraw(tab_id, 4, table_stat.Y2()+4, CELL_W*2, CELL_H, par_count, false); //--- Iterate through parameters, params[i], string looks as "parameter=value" for(uint i=0; i<par_count; i++) { //--- Fill in table with names and values of input parameters string array[]; //--- Split string in params[i] into two substrings and update cells in string of test parameters table if(::StringSplit(params[i],'=',array)==2) { //--- Fill in strings of optimized parameters with pale yellow color, //--- parameters that are not available for optimization - to pale pink, the rest - to default colors bool enable=false; double value=0, start=0, step=0, stop=0; color clr=clrMistyRose; if(::ParameterGetRange(array[0], enable, value, start, step, stop)) clr=(enable ? clrLightYellow : clrNONE); //--- Get two cells of table by parameter index and print text of parameter name and its value to them CTableCell *cell_0=table_inp.GetCell(i, 0); CTableCell *cell_1=table_inp.GetCell(i, 1); if(cell_0!=NULL && cell_1!=NULL) { //--- Update captions in cells cell_0.SetText(array[0]); cell_1.SetText(array[1]); cell_0.TextOut(foreground, 4, CELL_H/2, clr, 0, TA_VCENTER); cell_1.TextOut(foreground, 4, CELL_H/2, clr, 0, TA_VCENTER); } } } //--- Update optimization statistics table //--- Table header string foreground.FillRectangle(table_stat.X1()+1, 4+1, table_stat.X1()+CELL_W*2-1, 4+CELL_H-1, 0x00FFFFFF); foreground.FontSet("Calibri", -100, FW_BLACK); foreground.TextOut(4+(CELL_W*2)/2, 4+CELL_H/2, ::StringFormat("Optimization results (pass %I64u)", pass), ::ColorToARGB(clrMidnightBlue), TA_CENTER|TA_VCENTER); //--- In loop by number of strings in table int total=table_stat.RowsTotal(); for(int i=0; i<total; i++) { //--- get two cells of current string and CTableCell *cell_0=table_stat.GetCell(i, 0); CTableCell *cell_1=table_stat.GetCell(i, 1); if(cell_0!=NULL && cell_1!=NULL) { //--- update values of pass results in second cell string text="---"; switch(i) { case 0 : text=::StringFormat("%.2f", data[0]); break; // Sharpe Ratio case 1 : text=::StringFormat("%.2f", data[1]); break; // Net Profit case 2 : text=::StringFormat("%.2f", data[2]); break; // Profit Factor case 3 : text=::StringFormat("%.2f", data[3]); break; // Recovery Factor case 4 : text=::StringFormat("%.0f", data[4]); break; // Trades case 5 : text=::StringFormat("%.0f", data[5]); break; // Deals case 6 : text=::StringFormat("%.2f%%", data[6]);break; // Equity DD case 7 : text=::StringFormat("%G", data[7]); break; // OnTester() default: break; } //--- Highlight background of table string corresponding to selected tab with color. //--- Remaining strings will have default color color clr=(tab_id>0 ? (i==tab_id-1 ? C'223,242,231' : clrNONE) : clrNONE); //--- Update captions in cells cell_0.TextOut(foreground, 4, CELL_H/2, clr, 0, TA_VCENTER); cell_1.SetText(text); cell_1.TextOut(foreground, 4, CELL_H/2, clr, 0, TA_VCENTER); } } //--- Array for accepting values of balance of current frame double seria[]; ::ArrayCopy(seria, data, 0, DATA_COUNT, ::ArraySize(data)-DATA_COUNT); //--- Send array for printing on special balance chart chart_stat.AddSeria(seria, data[1]>0); //--- Update balance lines on chart chart_stat.Update(clr, line_width, false); //--- Update progress bar (only for tab with ID 0) if(tab_id==0) this.m_progress_bar.AddResult(data[1]>0, false); //--- Update caption on chart header int x1=chart_stat.HeaderX1(); int y1=chart_stat.HeaderY1(); int x2=chart_stat.HeaderX2(); int y2=chart_stat.HeaderY2(); int x=(x1+x2)/2; int y=(y1+y2)/2; foreground.FillRectangle(x1, y1, x2, y2, 0x00FFFFFF); foreground.FontSet("Calibri", -100, FW_BLACK); foreground.TextOut(x, y, text, ::ColorToARGB(clrMidnightBlue), TA_CENTER|TA_VCENTER); foreground.Update(false); //--- Success return true; } //--- Failed... else PrintFormat("%s: FrameInputs() failed. Error %d",__FUNCTION__, ::GetLastError()); return false; }
In the method, data is retrieved from the frame, all tables are filled with this data, and a chart of the balance of this optimization pass is drawn.
A method that draws a table of optimization statistics on the specified tab:
//+------------------------------------------------------------------+
//| Draws table of optimization statistics on specified tab          |
//+------------------------------------------------------------------+
void CFrameViewer::TableStatDraw(const uint tab_id, const int x, const int y, const int w, const int h, const bool chart_redraw)
  {
//--- Check passed tab ID
   if(tab_id>4)
     {
      ::PrintFormat("%s: Error: Invalid tab ID passed (%u)",__FUNCTION__, tab_id);
      return;
     }
//--- Get pointers to objects used on specified tab
   CCanvas           *background=this.m_tab_control.GetTabBackground(tab_id);
   CCanvas           *foreground=this.m_tab_control.GetTabForeground(tab_id);
   CTableDataControl *table_stat=this.GetTableStats(tab_id);

   if(background==NULL || foreground==NULL || table_stat==NULL)
      return;

//--- Draw header of optimization results table
   background.FillRectangle(x, y, x+CELL_W*2, y+CELL_H, ::ColorToARGB(C'195,209,223'));   // C'180,190,230'
   foreground.FillRectangle(x+1, y+1, x+CELL_W*2-1, y+CELL_H-1, 0x00FFFFFF);
   foreground.FontSet("Calibri", -100, FW_BLACK);
   foreground.TextOut(x+(CELL_W*2)/2, y+CELL_H/2, "Optimization results", ::ColorToARGB(clrMidnightBlue), TA_CENTER|TA_VCENTER);

//--- Set table's identifier and draw table grid
   table_stat.SetID(TABLE_OPT_STAT_ID+10*tab_id);
   table_stat.DrawGrid(background, x, y+CELL_H, 0, DATA_COUNT, 2, CELL_H, CELL_W, C'200,200,200', false);

//--- Draw empty table of optimization results - only headers, without values
//--- In a loop by table rows
   int total=table_stat.RowsTotal();
   for(int row=0; row<total; row++)
     {
      //--- iterate through columns of rows
      for(int col=0; col<2; col++)
        {
         //--- Get table cell in current row and column
         CTableCell *cell=table_stat.GetCell(row, col);
         //--- Define text in cell
         //--- For left cell, these will be headers of results of parameters optimized
         if(col%2==0)
           {
            string text="OnTester()";
            switch(row)
              {
               case 0 : text="Sharpe Ratio";    break;
               case 1 : text="Net Profit";      break;
               case 2 : text="Profit Factor";   break;
               case 3 : text="Recovery Factor"; break;
               case 4 : text="Trades";          break;
               case 5 : text="Deals";           break;
               case 6 : text="Equity DD";       break;
               default: break;
              }
            cell.SetText(text);
           }
         //--- For right cell, text will be strikeout for table initialized
         else
            cell.SetText(tab_id==0 ? " --- " : "");

         //--- Print corresponding text in cell
         cell.TextOut(foreground, 4, CELL_H/2, clrNONE, 0, TA_VCENTER);
        }
     }

//--- Update background and foreground canvas
   background.Update(false);
   foreground.Update(chart_redraw);
  }
The method draws a table of optimization results, filling in only the row headers of the table. The data cells are entered into the table using the above described method.
A method that draws a table of input optimization parameters on the specified tab:
//+------------------------------------------------------------------+
//|Draws table of input optimization parameters on the specified tab |
//+------------------------------------------------------------------+
void CFrameViewer::TableInpDraw(const uint tab_id, const int x, const int y, const int w, const int h, const uint rows, const bool chart_redraw)
  {
//--- Check passed tab ID
   if(tab_id>4)
     {
      ::PrintFormat("%s: Error: Invalid tab ID passed (%u)",__FUNCTION__, tab_id);
      return;
     }
//--- Get pointers to objects used on specified tab
   CCanvas           *background=this.m_tab_control.GetTabBackground(tab_id);
   CCanvas           *foreground=this.m_tab_control.GetTabForeground(tab_id);
   CTableDataControl *table_inp=this.GetTableInputs(tab_id);

   if(background==NULL || foreground==NULL || table_inp==NULL)
      return;

//--- Draw header of optimization parameters table
   background.FillRectangle(x, y, x+CELL_W*2, y+CELL_H, ::ColorToARGB(C'195,209,223'));
   foreground.FillRectangle(x+1, y+1, x+CELL_W*2-1, y+CELL_H-1, 0x00FFFFFF);
   foreground.FontSet("Calibri", -100, FW_BLACK);
   foreground.TextOut(x+(CELL_W*2)/2, y+CELL_H/2, "Input parameters", ::ColorToARGB(clrMidnightBlue), TA_CENTER|TA_VCENTER);

//--- Set table's identifier and draw table grid
   table_inp.SetID(TABLE_OPT_INP_ID+10*tab_id);
   table_inp.DrawGrid(background, x, y+CELL_H, 0, rows, 2, CELL_H, CELL_W, C'200,200,200', false);

//--- Update background and foreground canvas
   background.Update(false);
   foreground.Update(chart_redraw);
  }
This method, just like the previous one, draws an empty table of optimization parameters, which is filled with data in the DrawFrameData() method, where the parameters with which a pass of the tester was performed are already known.
A method that draws the optimization chart on the specified tab:
//+------------------------------------------------------------------+
//| Draws chart of optimization on specified tab                     |
//+------------------------------------------------------------------+
void CFrameViewer::ChartOptDraw(const uint tab_id, const bool opt_completed, const bool chart_redraw)
  {
//--- Check passed tab ID
   if(tab_id>4)
     {
      ::PrintFormat("%s: Error: Invalid tab ID passed (%u)",__FUNCTION__, tab_id);
      return;
     }
//--- Get pointers to objects used on specified tab
   CCanvas           *background=this.m_tab_control.GetTabBackground(tab_id);
   CCanvas           *foreground=this.m_tab_control.GetTabForeground(tab_id);
   CTab              *tab=this.m_tab_control.GetTab(tab_id);
   CTableDataControl *table_stat=this.GetTableStats(tab_id);
   CStatChart        *chart_stat=this.GetChartStats(tab_id);

   if(background==NULL || foreground==NULL || tab==NULL || table_stat==NULL || chart_stat==NULL)
      return;

//--- Calculate coordinates of four corners of optimization results chart
   int x1=table_stat.X2()+10;
   int y1=table_stat.Y1();
   int x2=tab.GetField().Right()-10;
   int y2=tab.GetField().Bottom()-tab.GetButton().Height()-12;

//--- Check size limits by minimum width and height (480 x 180)
   int w_min=480;
   if(x2-x1<w_min)
      x2=x1+w_min;
   if(y2-y1<180)
      y2=y1+180;

//--- Set dimensions of bounding rectangle of optimization results chart
   chart_stat.SetChartBounds(x1, y1, x2, y2);

//--- Color and text of chart header
   color clr=clrLightGreen;   // header color at optimization completion
   string suff=
     (
      tab_id==1 ? "Results by Sharpe Ratio"     :
      tab_id==2 ? "Results by Net Profit"       :
      tab_id==3 ? "Results by Profit Factor"    :
      tab_id==4 ? "Results by Recovery Factor"  :
                     "Click to Replay"
     );
   string text="Optimization Completed: "+suff;

//--- If optimization is not completed, specify color and text of header
   if(!opt_completed)
     {
      clr=C'195,209,223';
      text=::StringFormat("Optimization%sprogress%s", (tab_id==0 ? " " : " in "), (tab_id==0 ? "" : ": Waiting ... "));
     }

//--- Draw header and text
   background.FillRectangle(x1, 4, x2, y1, ::ColorToARGB(clr));
   foreground.FillRectangle(x1, 4, x2, y2, 0x00FFFFFF);
   foreground.FontSet("Calibri", -100, FW_BLACK);
   foreground.TextOut((x1+x2)/2, 4+CELL_H/2, text, ::ColorToARGB(clrMidnightBlue), TA_CENTER|TA_VCENTER);

//--- Erase whole chart of optimization results
   background.FillRectangle(x1, y1, x2, y2, 0x00FFFFFF);
   foreground.FillRectangle(x1, y1, x2, y2, 0x00FFFFFF);

//--- Update optimization chart
   chart_stat.Update(clrNONE, 0, chart_redraw);
  }
The method prepares a clean chart with a header, on which balance lines of completed optimization passes are printed from drawing methods.
We have fully implemented all the necessary classes for visual optimization. Now, the CFrameViewer class file can be attached to any Expert Advisor to view the progress of its optimization on a separate chart in the terminal.
Connect functionality to the Expert Advisor
Let’s check what we have.
Take the EA from the standard delivery from the location: \MQL5\Experts\Advisors\ExpertMAMA.mq5 and save it in a new, previously created folder \MQL5\Experts\FrameViewer\ named as ExpertMAMA_Frames.mq5.
All that should be added to it is to connect the CFrameViewer class file at the end of the listing, declare an object with the type of this class and add handlers in which handlers of the same name of the created class must be called.
The length of EA's input variables can be slightly shortened by removing the underscores ("_") from the variable names. This will give them more space to fit into the width of table cells.
//+------------------------------------------------------------------+
//|                                                   ExpertMAMA.mq5 |
//|                             Copyright 2000-2025, MetaQuotes Ltd. |
//|                                             https://www.mql5.com |
//+------------------------------------------------------------------+
#property copyright "Copyright 2000-2025, MetaQuotes Ltd."
#property link      "https://www.mql5.com"
#property version   "1.00"
//+------------------------------------------------------------------+
//| Include                                                          |
//+------------------------------------------------------------------+
#include <Expert\Expert.mqh>
#include <Expert\Signal\SignalMA.mqh>
#include <Expert\Trailing\TrailingMA.mqh>
#include <Expert\Money\MoneyNone.mqh>
//+------------------------------------------------------------------+
//| Inputs                                                           |
//+------------------------------------------------------------------+
//--- inputs for expert
input string             InpExpertTitle      =  "ExpertMAMA";
int                      Expert_MagicNumber  =  12003;
bool                     Expert_EveryTick    =  false;
//--- inputs for signal
input int                InpSignalMAPeriod   =  12;
input int                InpSignalMAShift    =  6;
input ENUM_MA_METHOD     InpSignalMAMethod   =  MODE_SMA;
input ENUM_APPLIED_PRICE InpSignalMAApplied  =  PRICE_CLOSE;
//--- inputs for trailing
input int                InpTrailingMAPeriod =  12;
input int                InpTrailingMAShift  =  0;
input ENUM_MA_METHOD     InpTrailingMAMethod =  MODE_SMA;
input ENUM_APPLIED_PRICE InpTrailingMAApplied=  PRICE_CLOSE;
//+------------------------------------------------------------------+
//| Global expert object                                             |
//+------------------------------------------------------------------+
CExpert ExtExpert;
//+------------------------------------------------------------------+
//| Initialization function of the expert                            |
//+------------------------------------------------------------------+
int OnInit(void)
  {
//--- Initializing expert
   if(!ExtExpert.Init(Symbol(),Period(),Expert_EveryTick,Expert_MagicNumber))
     {
      //--- failed
      printf(__FUNCTION__+": error initializing expert");
      ExtExpert.Deinit();
      return(-1);
     }
//--- Creation of signal object
   CSignalMA *signal=new CSignalMA;
   if(signal==NULL)
     {
      //--- failed
      printf(__FUNCTION__+": error creating signal");
      ExtExpert.Deinit();
      return(-2);
     }
//--- Add signal to expert (will be deleted automatically))
   if(!ExtExpert.InitSignal(signal))
     {
      //--- failed
      printf(__FUNCTION__+": error initializing signal");
      ExtExpert.Deinit();
      return(-3);
     }
//--- Set signal parameters
   signal.PeriodMA(InpSignalMAPeriod);
   signal.Shift(InpSignalMAShift);
   signal.Method(InpSignalMAMethod);
   signal.Applied(InpSignalMAApplied);
//--- Check signal parameters
   if(!signal.ValidationSettings())
     {
      //--- failed
      printf(__FUNCTION__+": error signal parameters");
      ExtExpert.Deinit();
      return(-4);
     }
//--- Creation of trailing object
   CTrailingMA *trailing=new CTrailingMA;
   if(trailing==NULL)
     {
      //--- failed
      printf(__FUNCTION__+": error creating trailing");
      ExtExpert.Deinit();
      return(-5);
     }
//--- Add trailing to expert (will be deleted automatically))
   if(!ExtExpert.InitTrailing(trailing))
     {
      //--- failed
      printf(__FUNCTION__+": error initializing trailing");
      ExtExpert.Deinit();
      return(-6);
     }
//--- Set trailing parameters
   trailing.Period(InpTrailingMAPeriod);
   trailing.Shift(InpTrailingMAShift);
   trailing.Method(InpTrailingMAMethod);
   trailing.Applied(InpTrailingMAApplied);
//--- Check trailing parameters
   if(!trailing.ValidationSettings())
     {
      //--- failed
      printf(__FUNCTION__+": error trailing parameters");
      ExtExpert.Deinit();
      return(-7);
     }
//--- Creation of money object
   CMoneyNone *money=new CMoneyNone;
   if(money==NULL)
     {
      //--- failed
      printf(__FUNCTION__+": error creating money");
      ExtExpert.Deinit();
      return(-8);
     }
//--- Add money to expert (will be deleted automatically))
   if(!ExtExpert.InitMoney(money))
     {
      //--- failed
      printf(__FUNCTION__+": error initializing money");
      ExtExpert.Deinit();
      return(-9);
     }
//--- Set money parameters
//--- Check money parameters
   if(!money.ValidationSettings())
     {
      //--- failed
      printf(__FUNCTION__+": error money parameters");
      ExtExpert.Deinit();
      return(-10);
     }
//--- Tuning of all necessary indicators
   if(!ExtExpert.InitIndicators())
     {
      //--- failed
      printf(__FUNCTION__+": error initializing indicators");
      ExtExpert.Deinit();
      return(-11);
     }
//--- succeed
   return(INIT_SUCCEEDED);
  }
//+------------------------------------------------------------------+
//| Deinitialization function of the expert                          |
//+------------------------------------------------------------------+
void OnDeinit(const int reason)
  {
   ExtExpert.Deinit();
  }
//+------------------------------------------------------------------+
//| Function-event handler "tick"                                    |
//+------------------------------------------------------------------+
void OnTick(void)
  {
   ExtExpert.OnTick();
  }
//+------------------------------------------------------------------+
//| Function-event handler "trade"                                   |
//+------------------------------------------------------------------+
void OnTrade(void)
  {
   ExtExpert.OnTrade();
  }
//+------------------------------------------------------------------+
//| Function-event handler "timer"                                   |
//+------------------------------------------------------------------+
void OnTimer(void)
  {
   ExtExpert.OnTimer();
  }
//+------------------------------------------------------------------+
//| Code required to visualize optimization                          |
//+------------------------------------------------------------------+
//--- When debugging, if press "Stop" during optimization, next run of optimization will continue incomplete passes from stop point
//--- In order for each new optimization run to start anew, define preprocessor directive
#property tester_no_cache

//--- Define macro substitutions
#define   REPLAY_DELAY_MS      100           // Optimization replay delay in milliseconds
#define   STAT_LINES           1             // Number of optimization statistics lines displayed
#define   SELECTED_LINE_WD     3             // Thickness of line of selected optimization passage
#define   SELECTED_LINE_CLR    clrDodgerBlue // Color of line of selected optimization passage

//--- Connect code to work with the optimization results by frame viewer
#include  "FrameViewer.mqh"

//--- Declare frame viewer object
CFrameViewer fw;

//+------------------------------------------------------------------+
//| Tester function                                                  |
//+------------------------------------------------------------------+
double OnTester()
  {
//--- here insert your own function to calculate optimization criterion
   double TesterCritetia=MathAbs(TesterStatistics(STAT_SHARPE_RATIO)*TesterStatistics(STAT_PROFIT));
   TesterCritetia=TesterStatistics(STAT_PROFIT)>0?TesterCritetia:(-TesterCritetia);
//--- call at each end of testing and pass optimization criterion as parameter
   fw.OnTester(TesterCritetia);
//---
   return(TesterCritetia);
  }
//+------------------------------------------------------------------+
//| TesterInit function                                              |
//+------------------------------------------------------------------+
void OnTesterInit()
  {
//--- prepare chart for displaying balance lines
//--- STAT_LINES sets number of balance lines on chart,
//--- SELECTED_LINE_WD - sets width, SELECTED_LINE_CLR - sets color of line of selected passage
   fw.OnTesterInit(STAT_LINES, SELECTED_LINE_WD, SELECTED_LINE_CLR);
  }
//+------------------------------------------------------------------+
//| TesterDeinit function                                            |
//+------------------------------------------------------------------+
void OnTesterDeinit()
  {
//--- completing optimization
   fw.OnTesterDeinit();
  }
//+------------------------------------------------------------------+
//| TesterPass function                                              |
//+------------------------------------------------------------------+
void OnTesterPass()
  {
//--- handle test results and display graphics
   fw.OnTesterPass();
  }
//+------------------------------------------------------------------+
//|  Event handling on chart                                         |
//+------------------------------------------------------------------+
void OnChartEvent(const int id,const long &lparam,const double &dparam,const string &sparam)
  {
//--- starts playback of frames upon completion of optimization when clicking on header
   fw.OnChartEvent(id,lparam,dparam,sparam,REPLAY_DELAY_MS); // REPLAY_DELAY_MS - pause in ms between replay frames
  }
These are all the changes and additions to the Expert Advisor that must be made (except for shortening variable names) in order for visual optimization to work.
Let's compile the Expert Advisor and run it for optimization.
Optimization settings for the test of the program itself are not particularly important, set them like this:
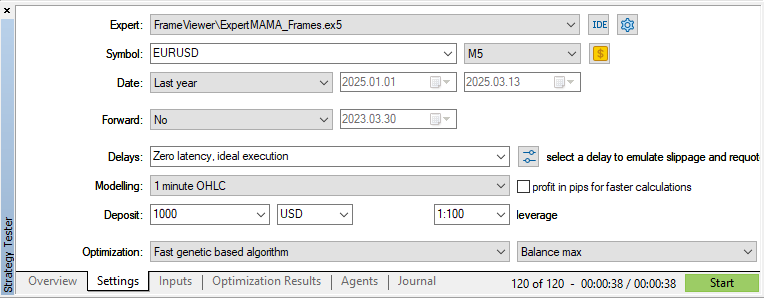
and run optimization:
Before starting the optimization process, a new chart window opens. All the controls are located on it. This is convenient so that you don't have to switch between the attached charts of optimization results and the chat of visual optimization. You can move this separate window outside the terminal, or onto a second monitor, and simultaneously have access to all optimization charts.
Conclusion
In conclusion, I would like to say that we have considered only a small example of how additional functionality can be implemented to control the optimization process. On the visual optimization chart you can print any data obtained from tester's reports, or independently calculated after each optimization pass. What the functionality and visual display can be is a matter of taste and the needs of each developer who uses visual optimization to achieve the desired results and convenience in using the obtained data. Here, in this situation, it is important that we have discussed at specific examples how you can implement and use everything you need for yourself.
All the files discussed in the article are attached to the article for self-study. Old_article_files.zip contains files from the article, based on which information everything was realised today.
The MQL5.zip archive is also attached. After unpacking it, you can immediately get the installed test files in the necessary terminal folders.
Programs used in the article:
| # | Name | Type | Description |
|---|---|---|---|
| 1 | Table.mqh | Class Library | Class Library for table creation |
| 2 | Controls.mqh | Class Library | A class library for creating UI controls |
| 3 | FrameViewer.mqh | Class Library | A class library for implementing visual optimization functionality in the Expert Advisor |
| 4 | ExpertMAMA_Frames.mq5 | Expert Advisor | Expert Advisor to test visual optimization |
| 5 | MQL5.zip | Archive | An archive of the files presented above for unpacking into the MQL5 directory of the client terminal |
| 6 | Old_article_files.zip | Archive | Archive of files from the original article, on the basis of which all files of this article were created |
Translated from Russian by MetaQuotes Ltd.
Original article: https://www.mql5.com/ru/articles/17457
Warning: All rights to these materials are reserved by MetaQuotes Ltd. Copying or reprinting of these materials in whole or in part is prohibited.
This article was written by a user of the site and reflects their personal views. MetaQuotes Ltd is not responsible for the accuracy of the information presented, nor for any consequences resulting from the use of the solutions, strategies or recommendations described.

- Free trading apps
- Over 8,000 signals for copying
- Economic news for exploring financial markets
You agree to website policy and terms of use
After the disclosure of the opt-format, the use of frames remained appropriate only when transferring data that is not in the opt-file.
In the example of this article, the proposed GUI could be used to visualise an opt-file.
After the disclosure of the opt format, the use of frames remained appropriate only when transmitting data that is not in the opt file.
In the example of this article, the proposed GUI could be used to visualise an opt-file.