Gartley Projection D
- Indicatori
-
Oleksandr Medviediev
 Let Algo Shine 🙂
Faccio trading sul mercato FX da oltre 22 anni, concentrandomi sull'automazione (ho iniziato nel 2004, all'epoca su MT3).
- Ogni transazione è un mestiere, tranne l'amore.
- Le tendenze umane naturali non sono redditizie. - Versione: 3.23
- Aggiornato: 22 agosto 2017
- Attivazioni: 20
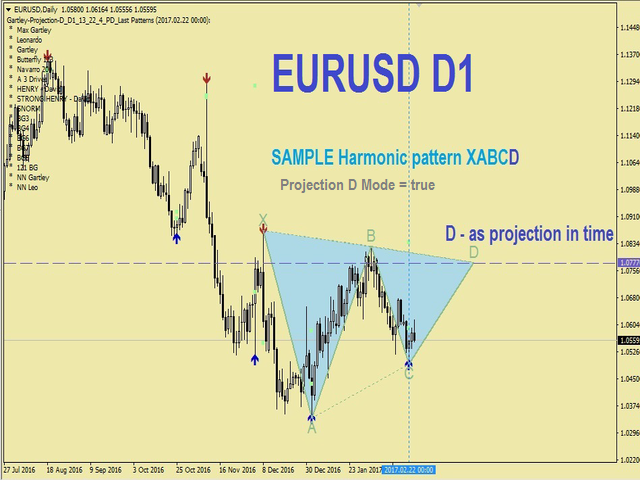
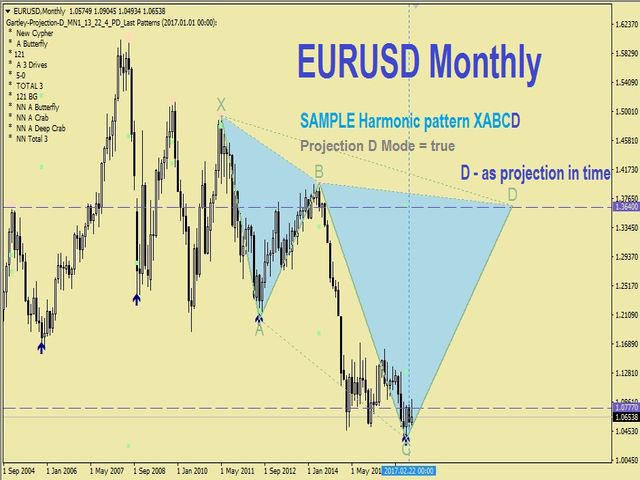
The indicator identifies the harmonic patterns (XABCD) according to developments of H.M.Gartley ("Profits in the Stock Market", 1935г).
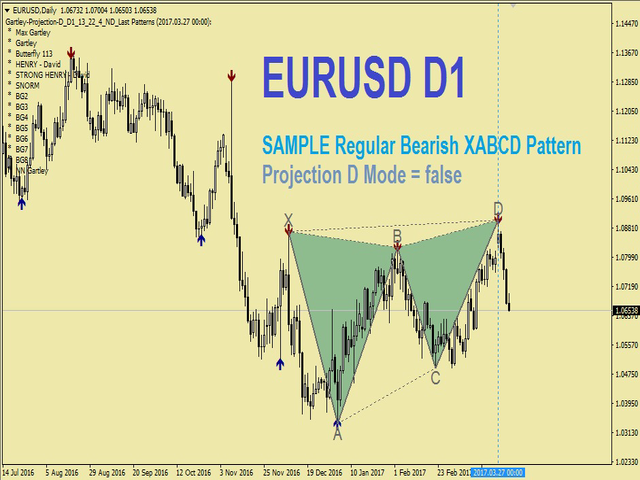
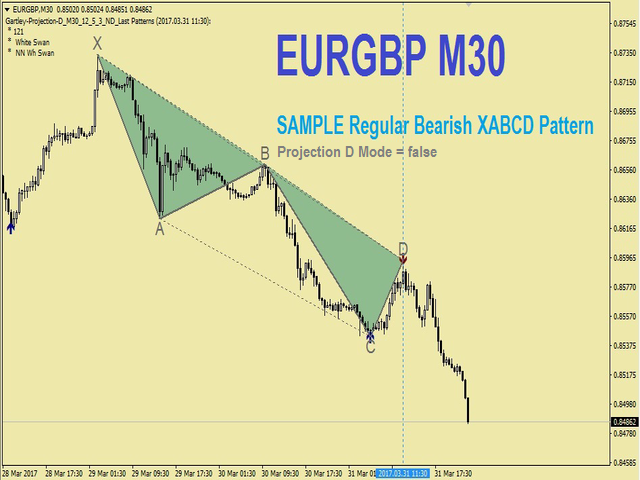
It projects D-point as a point in the perspective projection (specify ProjectionD_Mode = true in the settings).
Does not redraw. When a bar of the working timeframe closes, if the identified pattern point has not moved during Patterns_Fractal_Bars bars, an arrow appears on the chart (in the direction of the expected price movement). From this moment on, the arrow permanently remains on the chart.
2-3 and more arrows in a row - this is changing market conditions, NOT repaint/redraw (must not switch time-frames back and forth).
NOTE: 2-3 and more arrows in a row - this is changing market conditions, NOT redraw.
The total number of patterns is 85 (including Gartley-222 and Gartley-222WS, the full list is available in the Comments section). Only the latest identified pattern is filled with a solid color among all identified patterns.
Parameters
- DrawPatterns (true/false) - draw a pattern with a solid color
- ProjectionD_Mode (true/false) - mode for defining the D-point as a projection in perspective
- Patterns_Fractal_Bars - the number of the working timeframe bars, during which the latest identified pattern point must remain fixed for it to be considered a formed fractal (an arrow appears on the chart)
- Patterns_Deviation - allowed percentage deviation from the reference values of side proportions in a pattern (allowed value range)
- Patterns_XA_MinLength_Bars - the minimum allowed number of bars on the initial segment XA
- Patterns_XA_MinHeight_Points - the minimum allowed size of the initial segment XA in points
- ZigZag_Depth - parameter of the ZigZag indicator
- ZigZag_Deviation - parameter of the ZigZag indicator
- ZigZag_Backstep - parameter of the ZigZag indicator
- ShowInfo (true/false) - display the list of identified patterns at the left side of the chart
- PrintInfo (true/false) - print the information to the log
For clarity and better practical use, I prefer to split all harmonic patterns into 12 groups:
-
Golden-Ratio – classic Fibonacci symmetry
-
Moderate-Retracement – shallow B-point pullbacks
-
Deep-Retracement – deep B-point retracements
-
Extreme-Extension – stretched BD/XB extensions
-
Reciprocal-Structure – mirror-symmetric AC legs
-
Shark-Family – specific 0.752 / 1.373 AC ratios
-
Anti-Patterns – inverse-logic harmonic structures
-
Extreme-Expansion – oversized XB or XD legs
-
Special-Symmetry – BD ≈ XD proportional symmetry
-
Balanced-Complex – multi-condition blended ratios
-
BG-Series – XB=0.507, XD=1.00 proprietary set
-
Swan-Patterns – Black/White Swan extreme models
-


Updated review: I rented this indicator awhile back but came back to started using it once again because if you really study these patterns use both True and False settings it will allow you to see the whole picture of the particular pair you're trading.........This is just the way i like to use it following the False setting to trade but also using the True setting to be able to calculate my exit area to take profit at........Simply the best out there recommend is 1,000%!!! Thanks for your hard work on this huge winner, Oleksandr!!
Awesome Indicator, Great Work!! Truly no repainting arrows plus nice Gartley patterns respecting prices as far as I can see I can't wait to use it long term but short term I've had it already had a couple of winners following longer 1h,4h time frames THANKS!