Wick Fill Trend
- Indicators
- Version: 1.0
- Activations: 5

-Wick Fill Trend concept
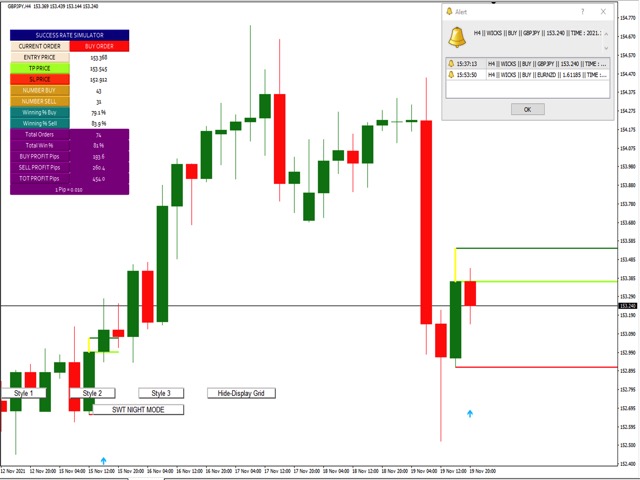
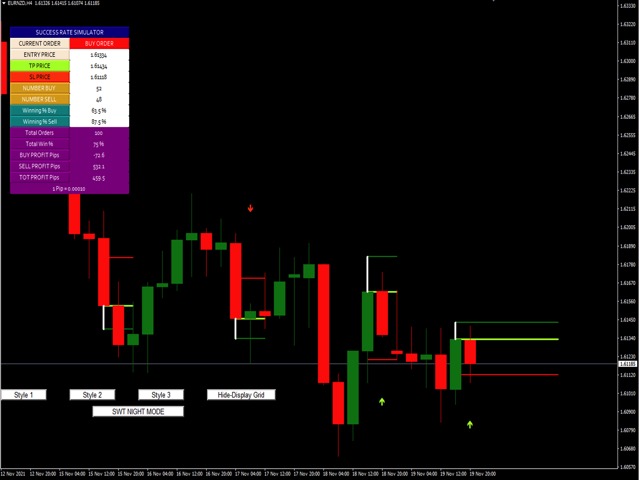
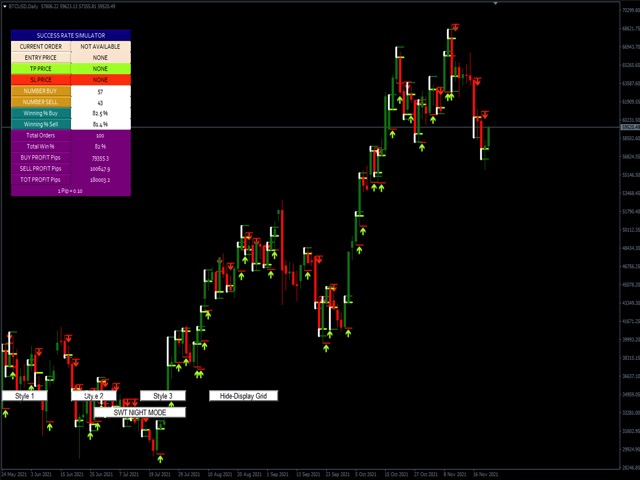
During a high volatility events in the market, candles tend to create wicks along the way on their moves. A wick in a candlestick reflects a rejection in the price. The majority of times these wicks are filled because have a huge volume pushing in that direction. Wick Fill Trend scans those opportunities focusing on trend markets.
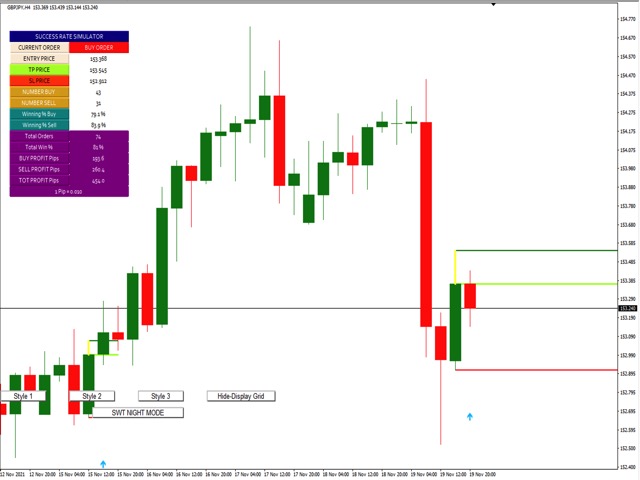
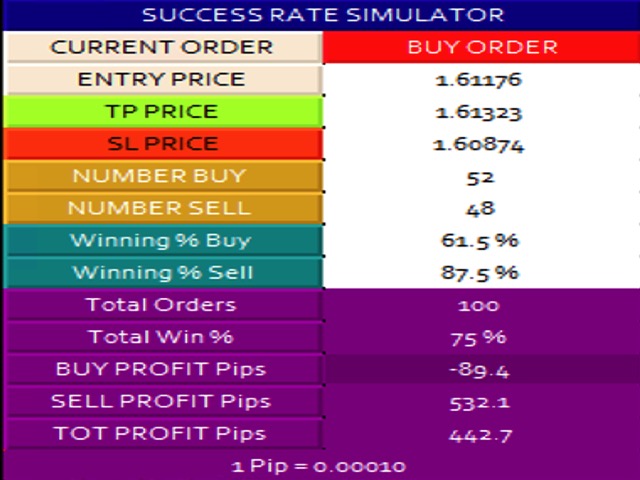
It has a success rate simulator dashboard which displays live signal with entry point, take profit and stop loss. This success rate simulator can be used as backtest to check which inputs have better profits in the past. It calculates profit on pips and percentage to give an overall idea what is the best parameter to use based on past performances.
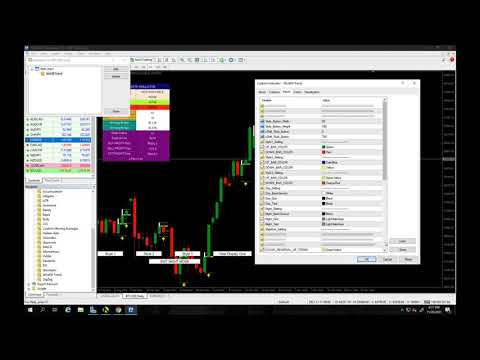
-Inputs
-Trend wicks: This input determine the size of the wick that the indicator has to scan. It is measured on %. It has 20 % by default.
-Number of signals: This is for the number of signals to be scanned for the Success Rate Simulator.
-Moving average: This filter is a combination of the moving average indicator and RSI. Users have the opportunity to set RSI and moving the average to their own need.
-Previous bar direction: This feature either avoid or allow the signal based on the previous candle. If It is true, the indicator will ONLY consider wicks as signals if the previous is in the same direction of the trend. If it is false, it will consider all the wicks.
-Last Higher highs, lower Lows Bars: This feature allows traders to scan for the last higher highs and lower lows in the last "x" bars in order to avoid range period.
-Minimum candle size: This input is for the minimum Bar size that the indicator will consider scanning wicks
-Maximum candle size: This input is the maximum bar size that the indicator will consider scanning wicks.
-Stop-loss Ratio: By default, the stop loss is the HH or LL of the candle of the signal candle. This feature allows users to set a bigger or smaller stop loss based on the wick signal. For example, If the user choose 2: It will be a double stop loss based on the Wick of the candle.
-Alert Setting :This indicator has alerts that can be sent to your mobile device activating the alert and the push notifications. First, in order to receive the signal from the indicator to your app. users must get he Metaquotes ID from the Setting>Chat and message> from your MetaTrader app. Then, Go to the desktop version Tools>Options>Notifications -----There insert the Metaquotes Id. Then, It will receive notification of live signal.
Try MetaTrader 5 here: https://www.mql5.com/en/market/product/71086
Try the Screener Here: https://www.mql5.com/en/market/product/71712
**************************ATTENTION*******************
This indicator use M1 timeframe to gather the data to have the most accurate result for the Success rate simulator. Some Brokers do not have the best data or it is just incomplete, therefore the results can differ from one broker to another scanning signal from the past.
I recommend to use data from Metaquotes. There is a video in my blog to watch how to download the data.
Also, You can check this post https://www.mql5.com/en/blogs/post/746811
Because style matters
I know how annoying is to click properties every time to change candles color, the background to light or dark and put or remove the grid. Here is the solution with one click that I include in the majority of my products:
- Three customizable buttons to choose the candle style that traders want.
- One button to switch between Day and Night mode.
- One button to show or hide the Grid on the charts.
*****On the settings, you can choose the colors and where the buttons should be displayed on the screen*****
Please consider checking my other products https://www.mql5.com/en/users/javimorales.fer/seller
Author
Javier Morales, founder of Algorithms for Trading.