
TM Elliott Wave Zigzag Multi Scale
- Indicators
-
Ramandeep Singh
 I am an algorithmic trader, technical analyst and MT5 tool developer focused on Gold (XAUUSD), Silver and Forex. I have applied Elliott Wave analysis in live markets since 2020, supported by market structure, trendline analysis, momentum, volatility and trading psychology.
 - Version: 1.0
TM Elliott Wave Zigzag Multi Scale is a clean chart indicator designed to identify Elliott Wave A-B-C Zigzag corrections across multiple structural degrees.
Instead of using one fixed swing sensitivity, the indicator analyses three independent pattern scales on the same chart:
• Micro structures – smaller and faster A-B-C formations
• Standard structures – balanced medium-sized patterns
• Macro structures – broader corrections based on major swings
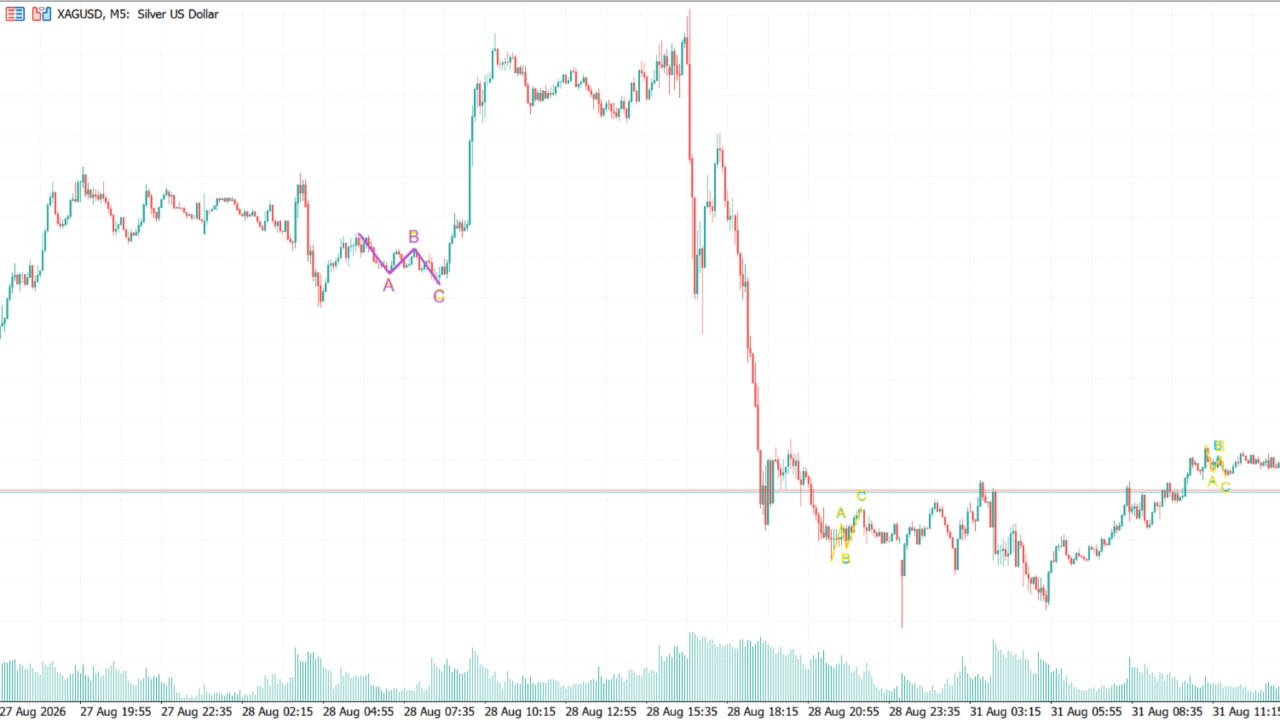
Each scale has its own colour and line thickness, making small and large A-B-C patterns easy to distinguish without overcrowding the chart.
KEY FEATURES
• Automatic Elliott Wave A-B-C Zigzag detection
• Micro, Standard and Macro structures on one chart
• Clear A, B and C labels with connecting wave lines
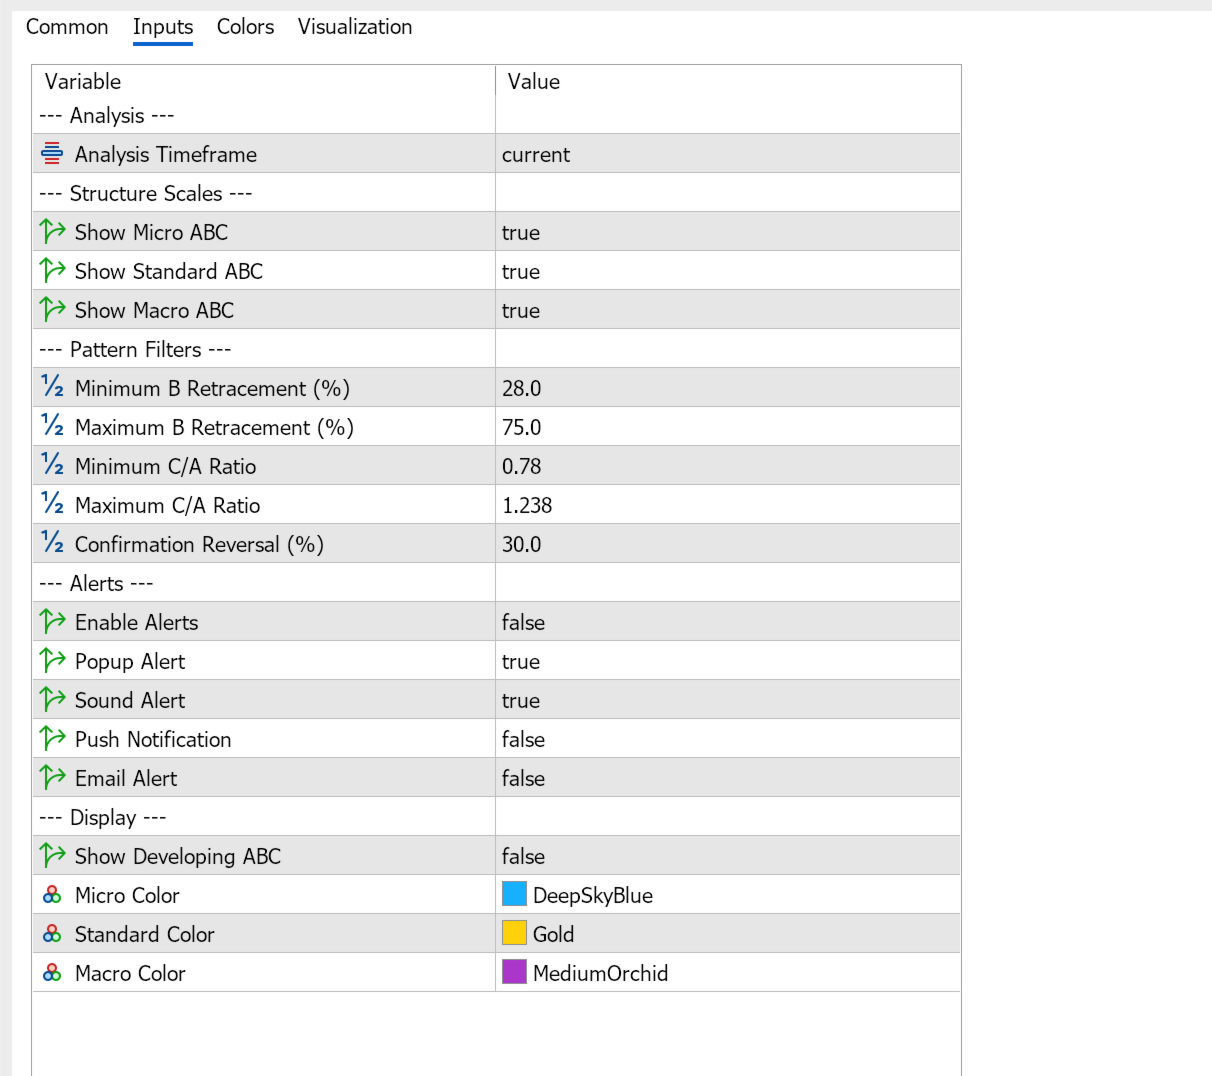
• Configurable B-wave retracement range
• Configurable C/A relationship for identifying the A=C zone
• ATR-based structure and movement filters
• Prior-wave validation and Wave 2 retracement filters
• Current-chart or selectable analysis timeframe
• Optional display of developing A-B-C structures
• Popup, sound, push and email alert options
• Customisable colours, line widths and label spacing
• Optional CSV export for advanced research
• Works with different symbols and chart timeframes
CLEAN DEFAULT DISPLAY
By default, the indicator displays completed and confirmed A-B-C structures only. Developing formations are hidden to keep the chart clean.
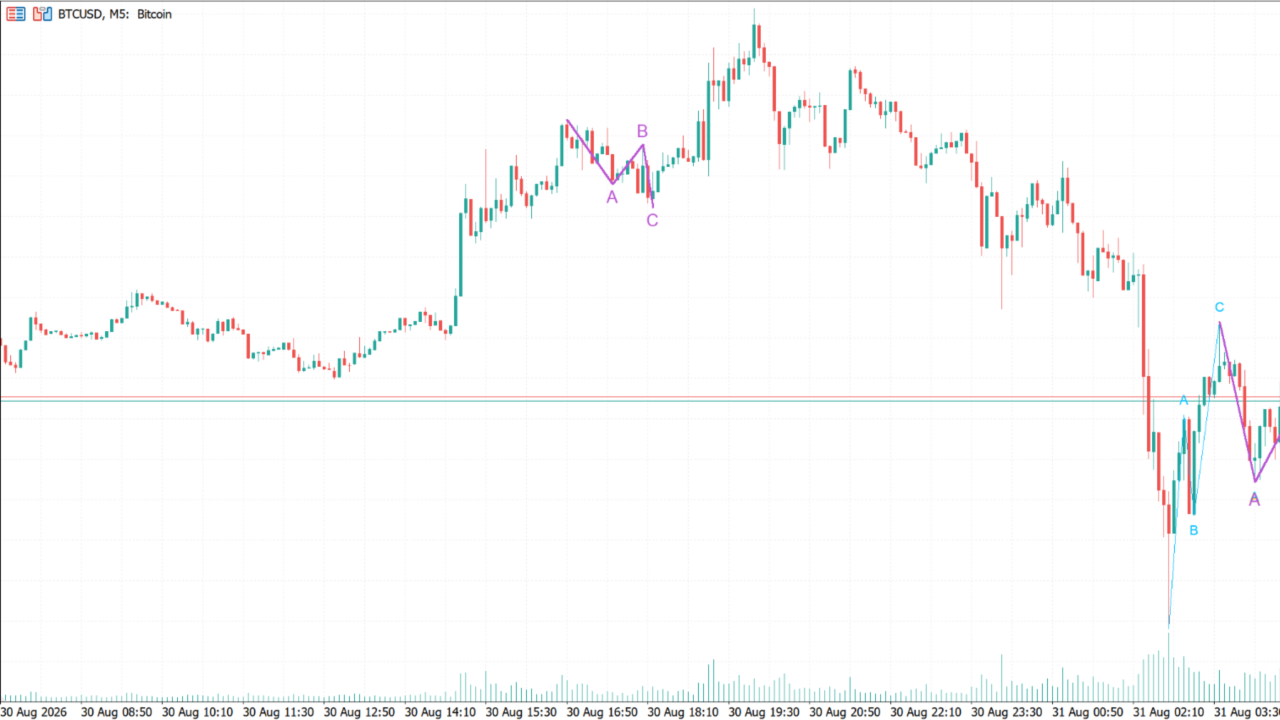
Traders who want to monitor patterns while they are still forming can enable “Show Developing ABC.” Developing structures are displayed with dotted lines and may update as new price data changes the swing points.
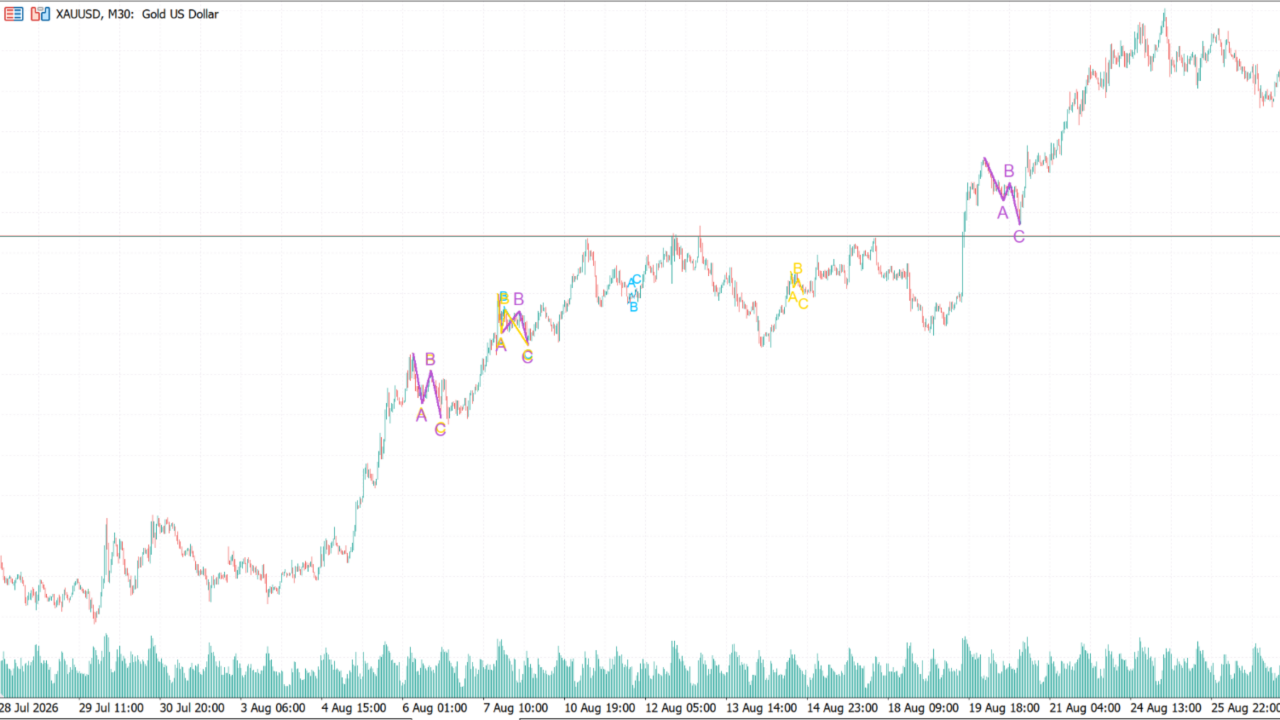
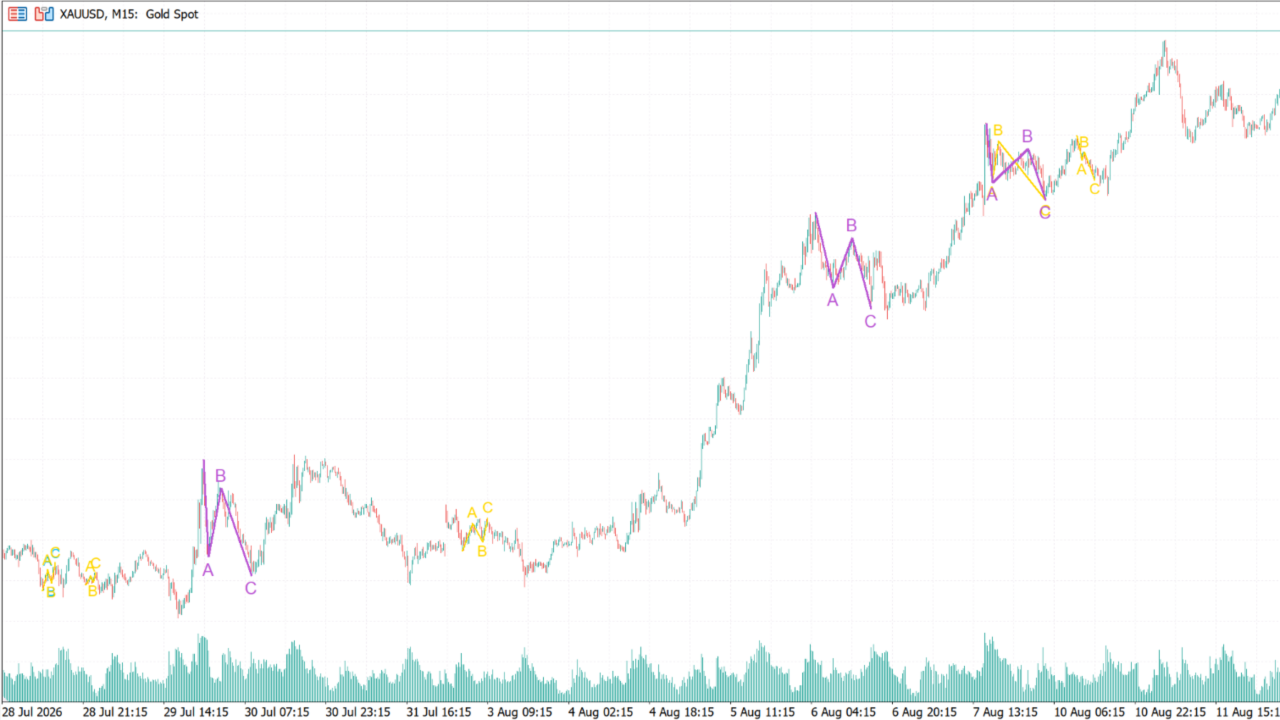
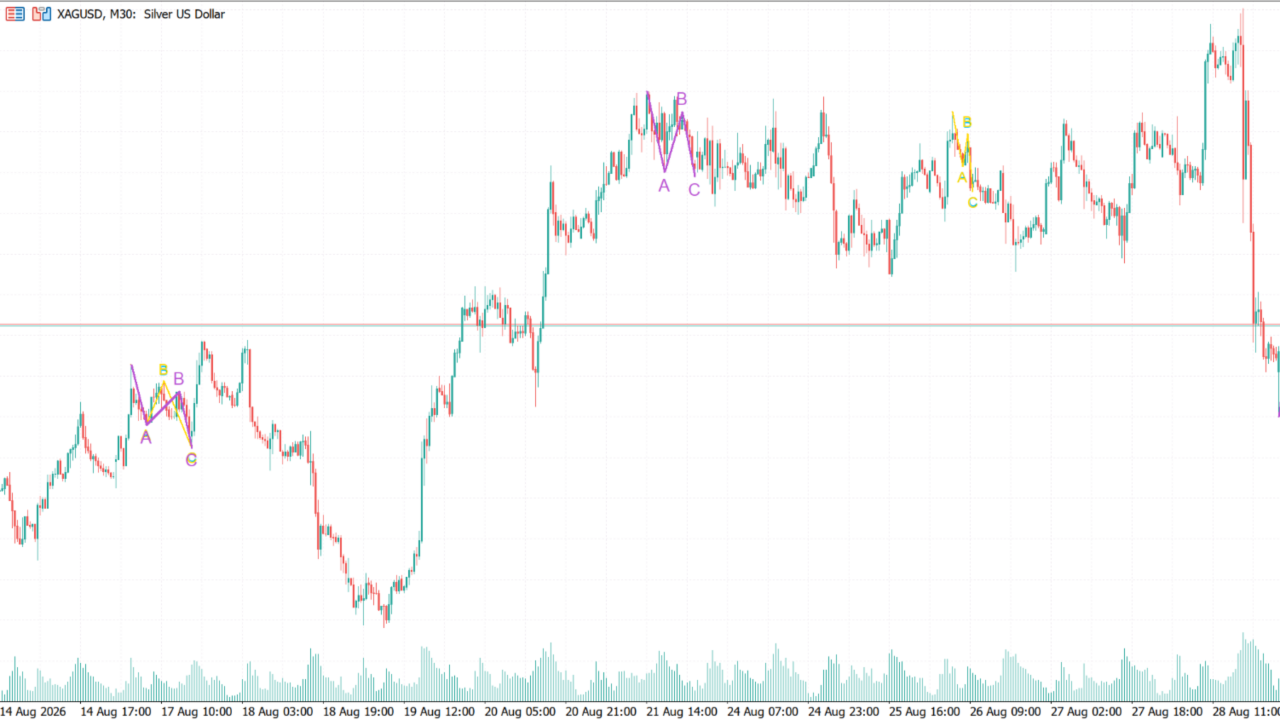
MULTI-SCALE VISUAL SYSTEM
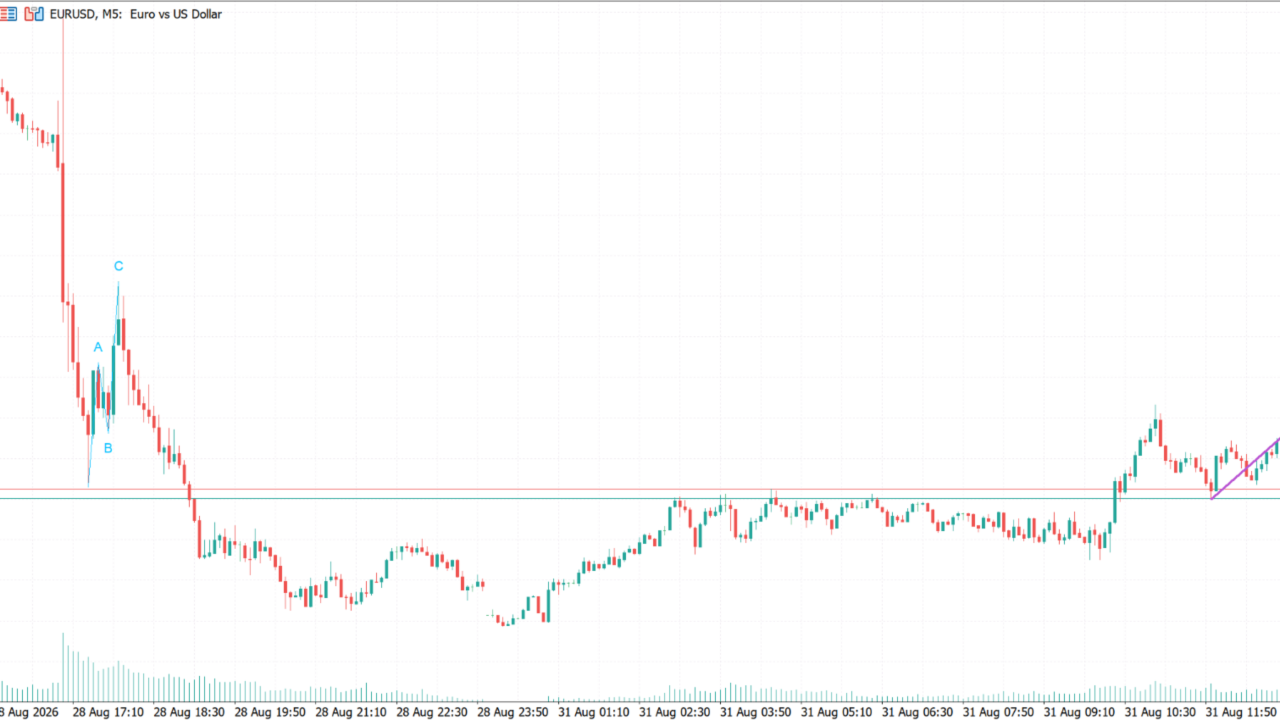
Micro structures are displayed with thin blue lines.
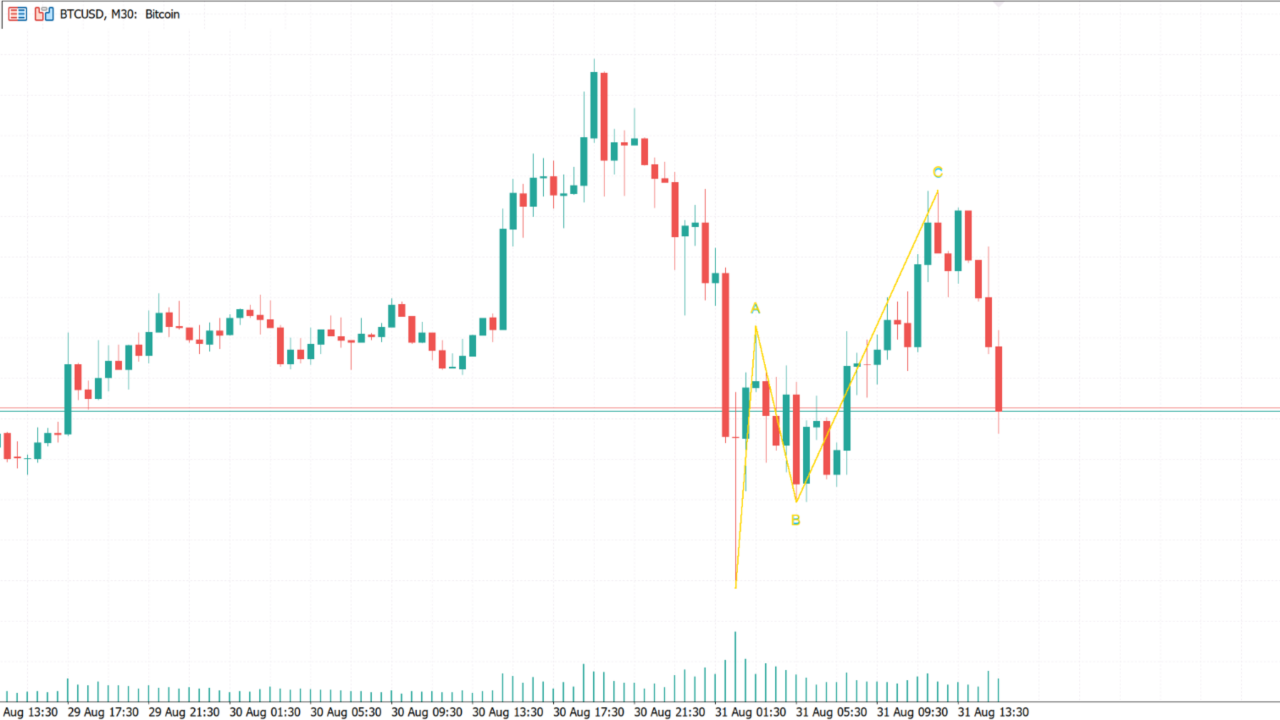
Standard structures are displayed with medium gold lines.
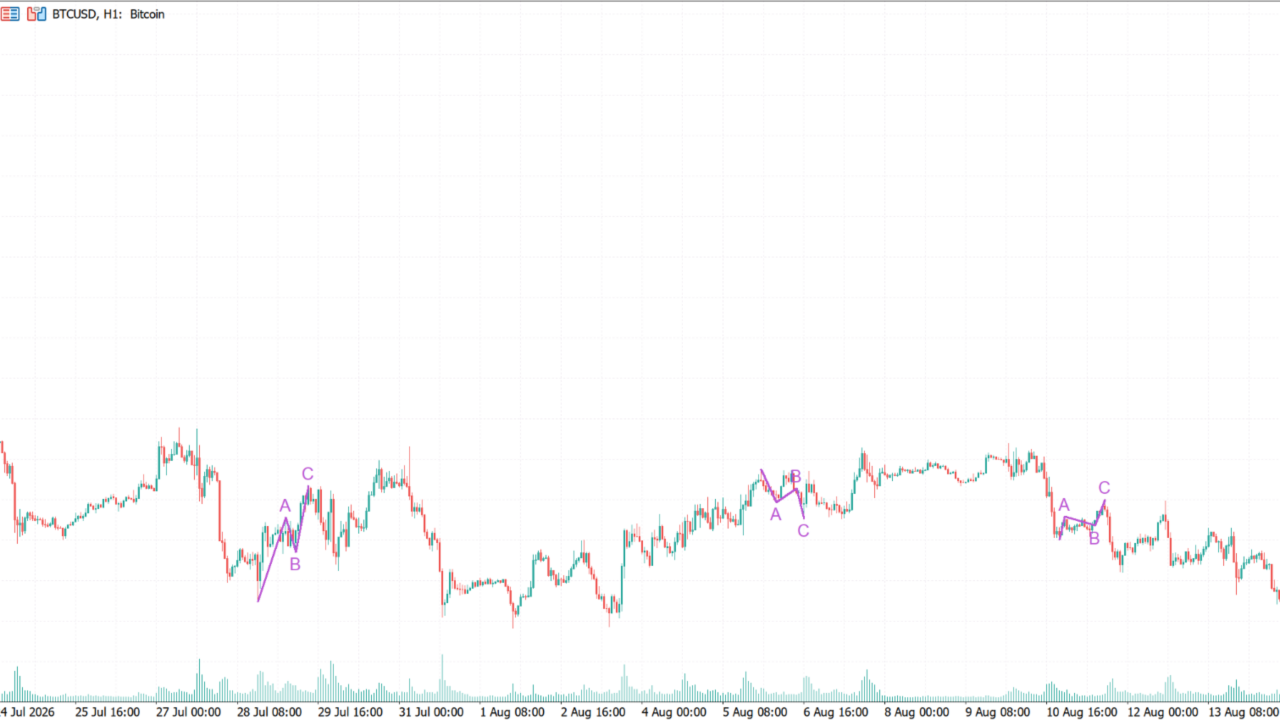
Macro structures are displayed with thicker purple lines.
This visual hierarchy helps traders observe the fractal nature of Elliott Wave corrections without changing charts or repeatedly adjusting Zigzag sensitivity.
HOW TO USE
-
Attach the indicator to any MetaTrader 5 chart.
-
Keep Analysis Timeframe set to Current for normal use.
-
Use the default settings as the starting point.
-
Observe the labelled A-B-C structures.
-
Adjust Micro, Standard or Macro pivot settings only when a different level of sensitivity is required.
-
Enable alerts if you want notifications when qualified structures are completed or confirmed.
IMPORTANT INFORMATION
This indicator is a technical-analysis and chart-visualisation tool. It does not open, manage or close trades.
Developing structures can change until the pattern is confirmed. The indicator should be combined with the trader’s own market analysis, risk management and trading plan.
No indicator can guarantee future price movement or trading profitability.










































User didn't leave any comment to the rating