TM Untapped Levels Oscillator
- Indicators
-
Ramandeep Singh
 I am an algorithmic trader, technical analyst and MT5 tool developer focused on Gold (XAUUSD), Silver and Forex. I have applied Elliott Wave analysis in live markets since 2020, supported by market structure, trendline analysis, momentum, volatility and trading psychology.
 - Version: 3.1
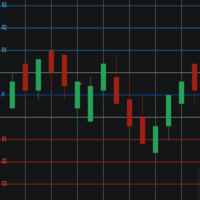
TM Untapped Levels Oscillator is a dual-display market pressure indicator for MetaTrader 5. It combines a clear oscillator panel with smooth trailing levels directly on the main price chart.
The indicator tracks prior highs and lows that remain untapped by later price action. Their persistence is converted into bullish and bearish pressure scores from 0 to 100. This helps traders see which side of the market is retaining more unresolved structure without covering the chart with buy and sell arrows.
KEY FEATURES
• Bullish and bearish pressure lines
• Centered two-color histogram around the 50 balance level
• Adjustable upper and lower reference thresholds
• Smooth upper and lower trailing levels on the main chart
• Optional shaded chart zone between the trails
• Up to 1,500 overlay bars displayed by default
• Quality-weighted scoring using level age and ATR-normalized distance
• Optional popup, push, email and sound alerts
• No buy or sell arrows on the chart
• Works on all symbols and timeframes
HOW TO READ IT
The green line represents pressure from persistent untapped lows. The red line represents pressure from persistent untapped highs.
Readings above the 50 balance level show stronger persistence on that side. The 80 and 20 reference levels provide additional context for unusually concentrated pressure. Crossovers and threshold transitions can be used as confirmation alongside price action, trend structure, support and resistance, or another trading method.
The main-chart overlay adds smooth ATR-based upper and lower trails. These trails provide immediate visual context for trend direction, volatility and dynamic market structure, while the separate oscillator keeps the detailed pressure reading easy to analyze.
MAIN SETTINGS
Core Calculation
• Level Capacity — maximum number of active highs and lows tracked
• Maximum Level Age — maximum lifetime of a tracked level
• ATR Period — volatility period used for normalization
• Weighted Scoring — enables age and distance quality weighting
• Age Decay Bars — controls how quickly older levels lose influence
• Distance Scale ATR — controls the effect of distance from price
• Quality Influence — strength of weighted scoring
• Maximum Bars — historical bars calculated
Signal and Alerts
• Enable Signals — enables confirmed internal signal events
• Signal Level — required pressure threshold
• Crossover Floor — minimum score for balance-shift confirmation
• Popup, Push, Email and Sound — individual alert options
Chart Overlay
• Show Chart Overlay — displays the trails on the price chart
• Trail Period — lookback period for the overlay
• ATR Multiplier — controls trail distance
• Overlay Bars — maximum historical chart bars drawn
• Show Overlay Zone — enables or disables the shaded zone
• Colors and Line Width — complete visual customization
IMPORTANT
This indicator is an analytical tool and does not guarantee future results. Signals and pressure readings should be combined with appropriate risk management and independent market analysis.