MiniBull Location of the Price and Volume
- Indicators
- Yusuf Levent Aksun
- Version: 1.10
- Activations: 5
See exactly where price stands — across every timeframe that matters — without switching charts.
MiniBull LOP is a multi-timeframe dashboard indicator built for traders who think in more than one timeframe at a time. Instead of flipping between M5, H1, Daily and Weekly charts to check "where are we relative to yesterday, last week, last month," MiniBull LOP puts all of it in one place: a live on-chart panel, persistent price levels, an adaptive trend read, and volume-confirmed breakout alerts.
What it shows, for every tracked timeframe
- Location vs. the last closed bar — Breakout Up, Breakout Down, Inside Up, Inside Down, or At Close.
- Absolute and % change vs. that timeframe's previous close.
- Trend regime — a Kaufman Adaptive Moving Average (AMA) crossover: a fast AMA vs. a slow AMA. When the fast one is above the slow one, that timeframe is Bull; otherwise it's Bear.
- Tick-volume ratio — the last closed bar's volume compared to its own recent average, so you can see at a glance whether a move is backed by real participation or just noise.
Timeframes covered
Monthly, Weekly, Daily, H8, H4, H1, M30, M15, M5, and M1 — all ten are tracked internally for the trend read, and you choose which ones get their own dashboard row, chart lines, and alerts. Defaults on: Monthly, Weekly, Daily, H1, M5. Everything else is one click away in settings.
On the chart
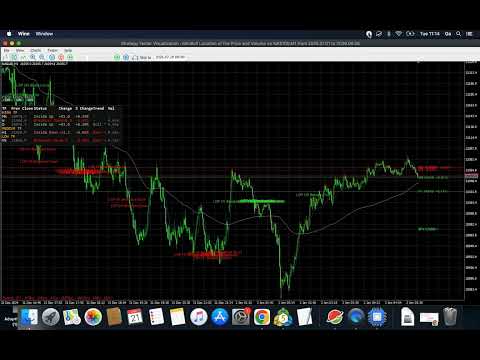
- Dashboard panel (top-left, toggle with one click): every enabled timeframe's status, change, trend, and volume in a compact table, grouped by High / Medium / Low timeframe.
- Persistent price-level lines: the previous close of every enabled timeframe is drawn as a line that automatically colors itself — green when price is above it (acting as support), red when price is below it (acting as resistance). Same logic for the AMA levels.
- Continuous AMA overlay: two moving lines that actually follow price bar by bar (a fast AMA and a slow AMA on the chart's own timeframe) — the classic adaptive-moving-average look, drawn directly on the candles.
- One-line trend summary: a compact readout at the bottom of the chart showing every tracked timeframe's Bull/Bear regime at once, so you can spot alignment or divergence across timeframes instantly.
- Breakout markers: when a breakout happens, a small permanent label drops right on the bar where it occurred — and the indicator backfills recent history on load, so you can see where past breakouts happened too, not just future ones.
Alerts that filter out noise
Breakout alerts (sound + on-chart popup) can require volume confirmation before firing — a breakout only triggers a notification once its volume also clears a threshold you set, filtering out thin, low-conviction fakeouts. If volume hasn't confirmed yet, the indicator keeps checking on each new closed bar until it does (or price returns inside the range).
Full parameter list
Display
- Show Panel (Dashboard) — toggle the on-chart table.
- Show Chart Lines — toggle the persistent price-level lines.
- Show AMA Lines — toggle the AMA-based level lines specifically.
- Panel vertical offset — push the panel down if it overlaps your broker's Buy/Sell quick-trade panel.
Timeframes
- Show MN / Week / Day / H8 / H4 / H1 / M30 / M15 / M5 / M1 — one switch per timeframe. Disabled timeframes are still tracked for the trend summary, just shown in parentheses there.
AMA Settings
- AMA Slow Period (default 200) / AMA Fast Period (default 9) — the two lookback lengths compared for the trend regime.
- AMA Fast/Slow EMA Constant (default 2 / 30) — the smoothing constants shared by both AMA calculations.
Chart Overlay AMA
- Show continuous AMA lines on chart — the price-following AMA lines (separate from the level lines).
- Fast/Slow line period — periods for the two continuous overlay lines.
Volume Settings
- Volume Average Period (default 20) — how many bars the volume ratio is averaged over.
- Require Volume Confirmation for Alerts — gate breakout alerts behind a volume check.
- Volume Confirmation Threshold (default 1.5x) — how far above average volume must be to confirm.
Alerts
- Sound Alert on Breakout / Popup Alert on Breakout — choose your notification style.
- Sound file — leave empty for the default alert sound, or point to your own.
- Backfill breakout markers for this many recent bars on load — how far back the indicator retroactively marks past breakouts when first attached (0 disables this).
Who it's for
Traders who trade one timeframe but want the context of the others — swing traders checking daily/weekly alignment before an intraday entry, scalpers who want a volume filter on their breakout signals, or anyone tired of manually eyeballing "is price above or below yesterday's close" across five different chart windows.