Minibull multi time frames sophisticated observer
- Indicators
-
Yusuf Levent Aksun
 Platform Engineer и сертифицированный специалист AWS с более чем 20-летним опытом
в разработке программного обеспечения, облачной архитектуре и DevOps-трансформации.
В настоящее время руковожу инициативами платформенной инженерии в World Wide Technology - Version: 1.9
- Updated: 25 August 2026
- Activations: 5
Version 1.5 2026.07.09
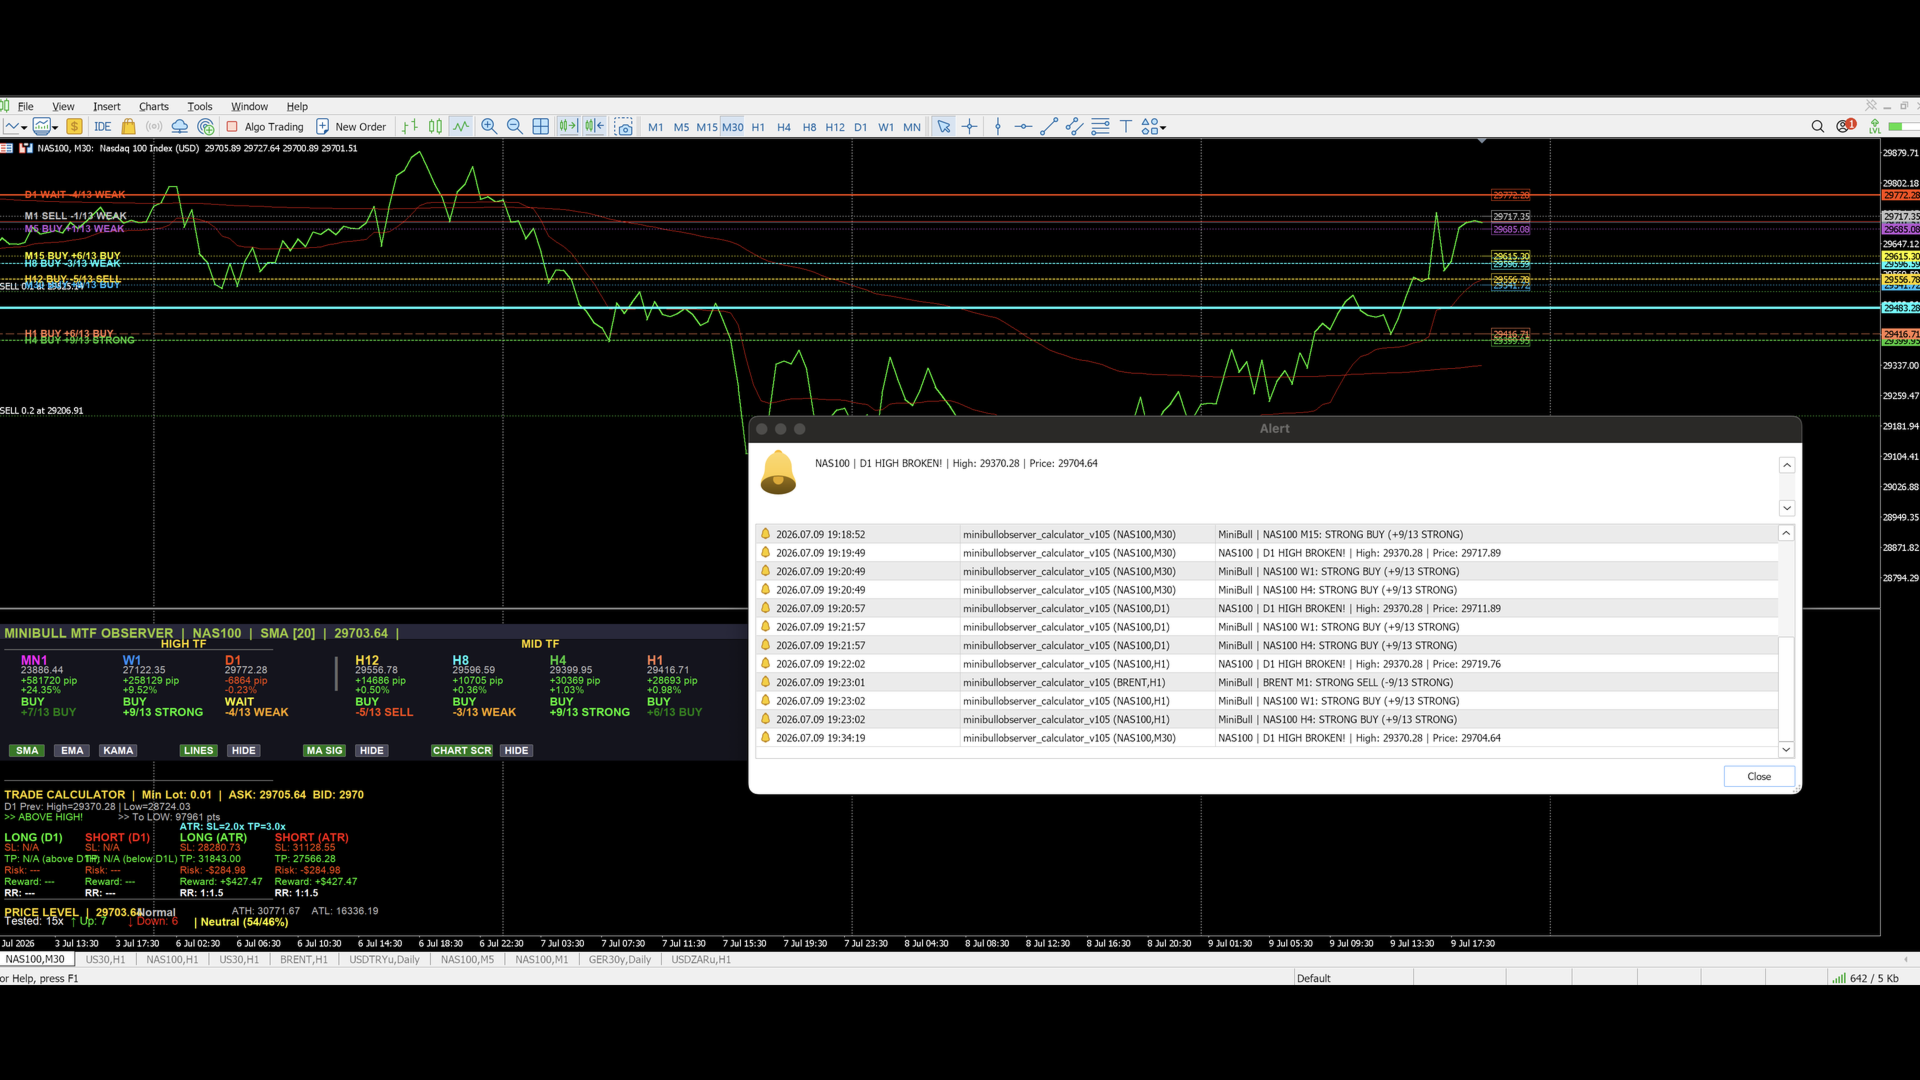
Version 1.05: Added chart overlay for the built-in Adaptive Moving Average indicator — AMA(9) and AMA(200), Fast EMA 2 / Slow EMA 30, applied to Close, plotted in red on the main chart. Sound Alert is now disabled by default; Popup Alert remains enabled by default and fires instantly when price crosses above the last closed D1 bar's High or drops below its Low.
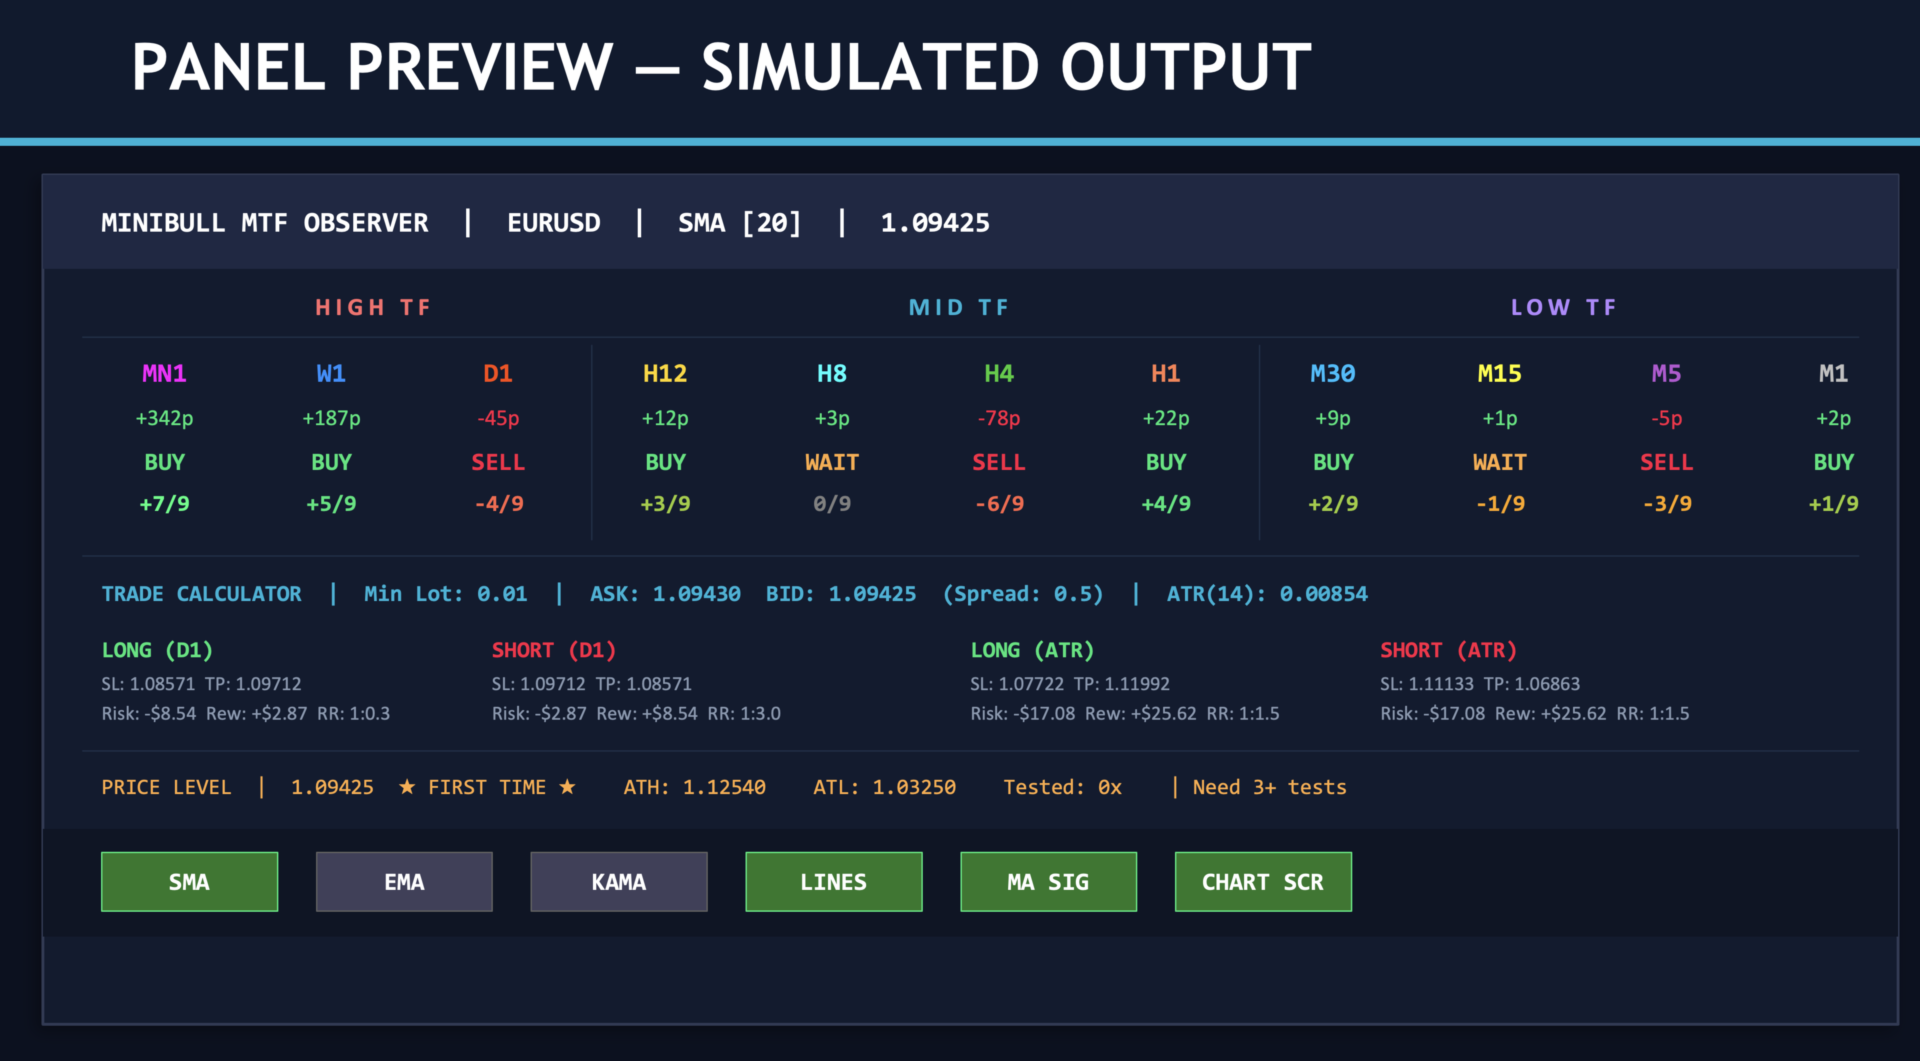
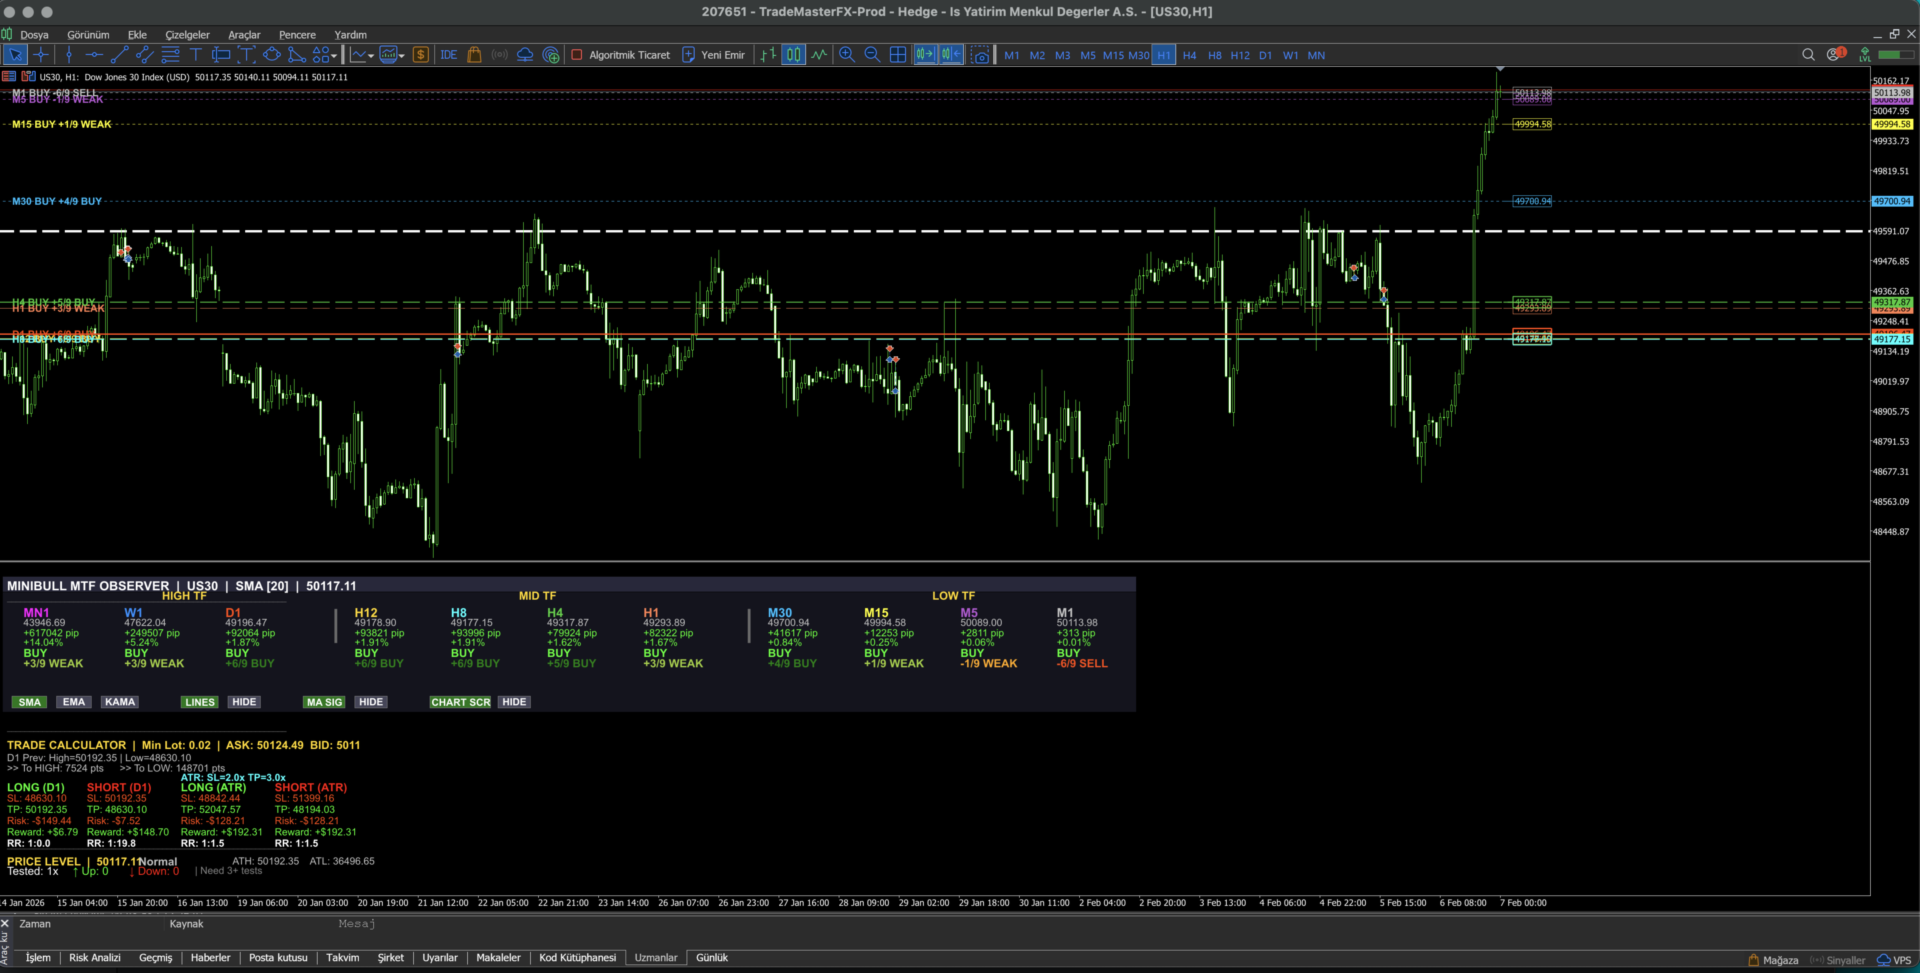
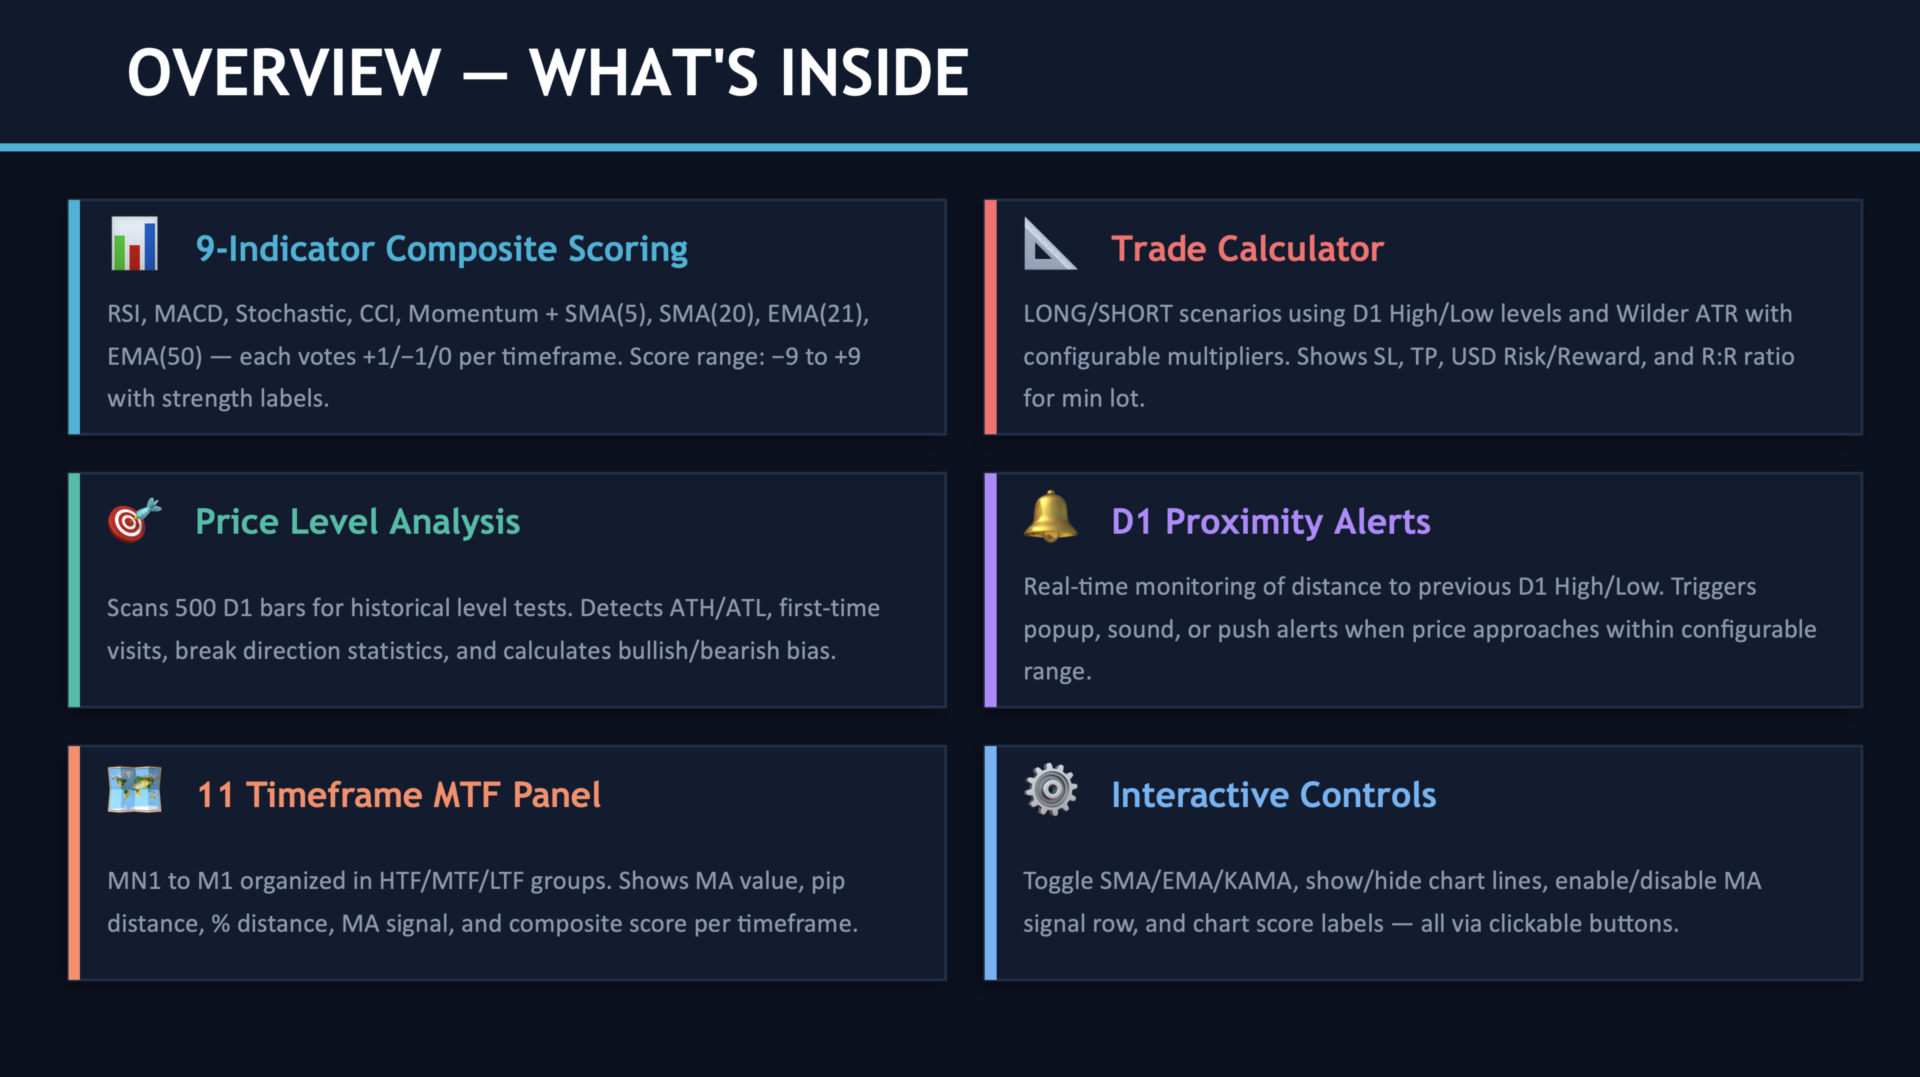
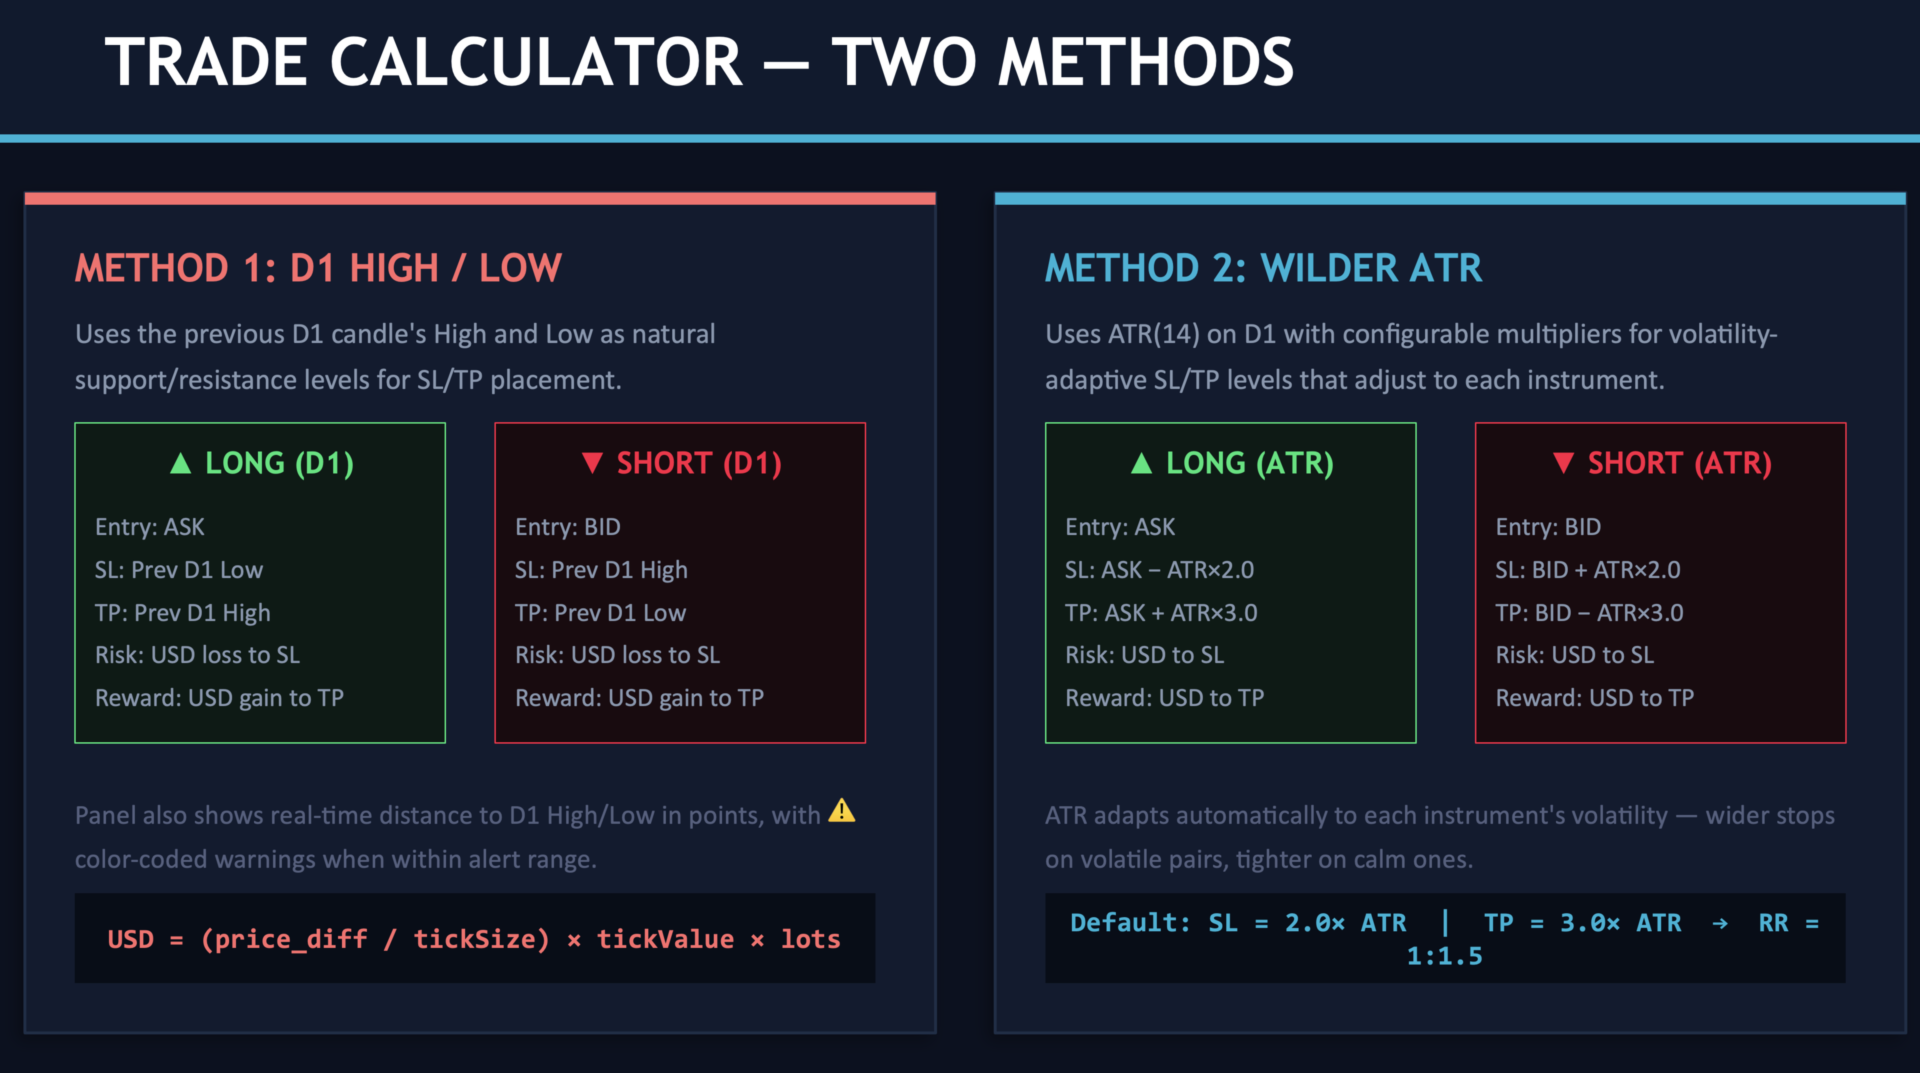
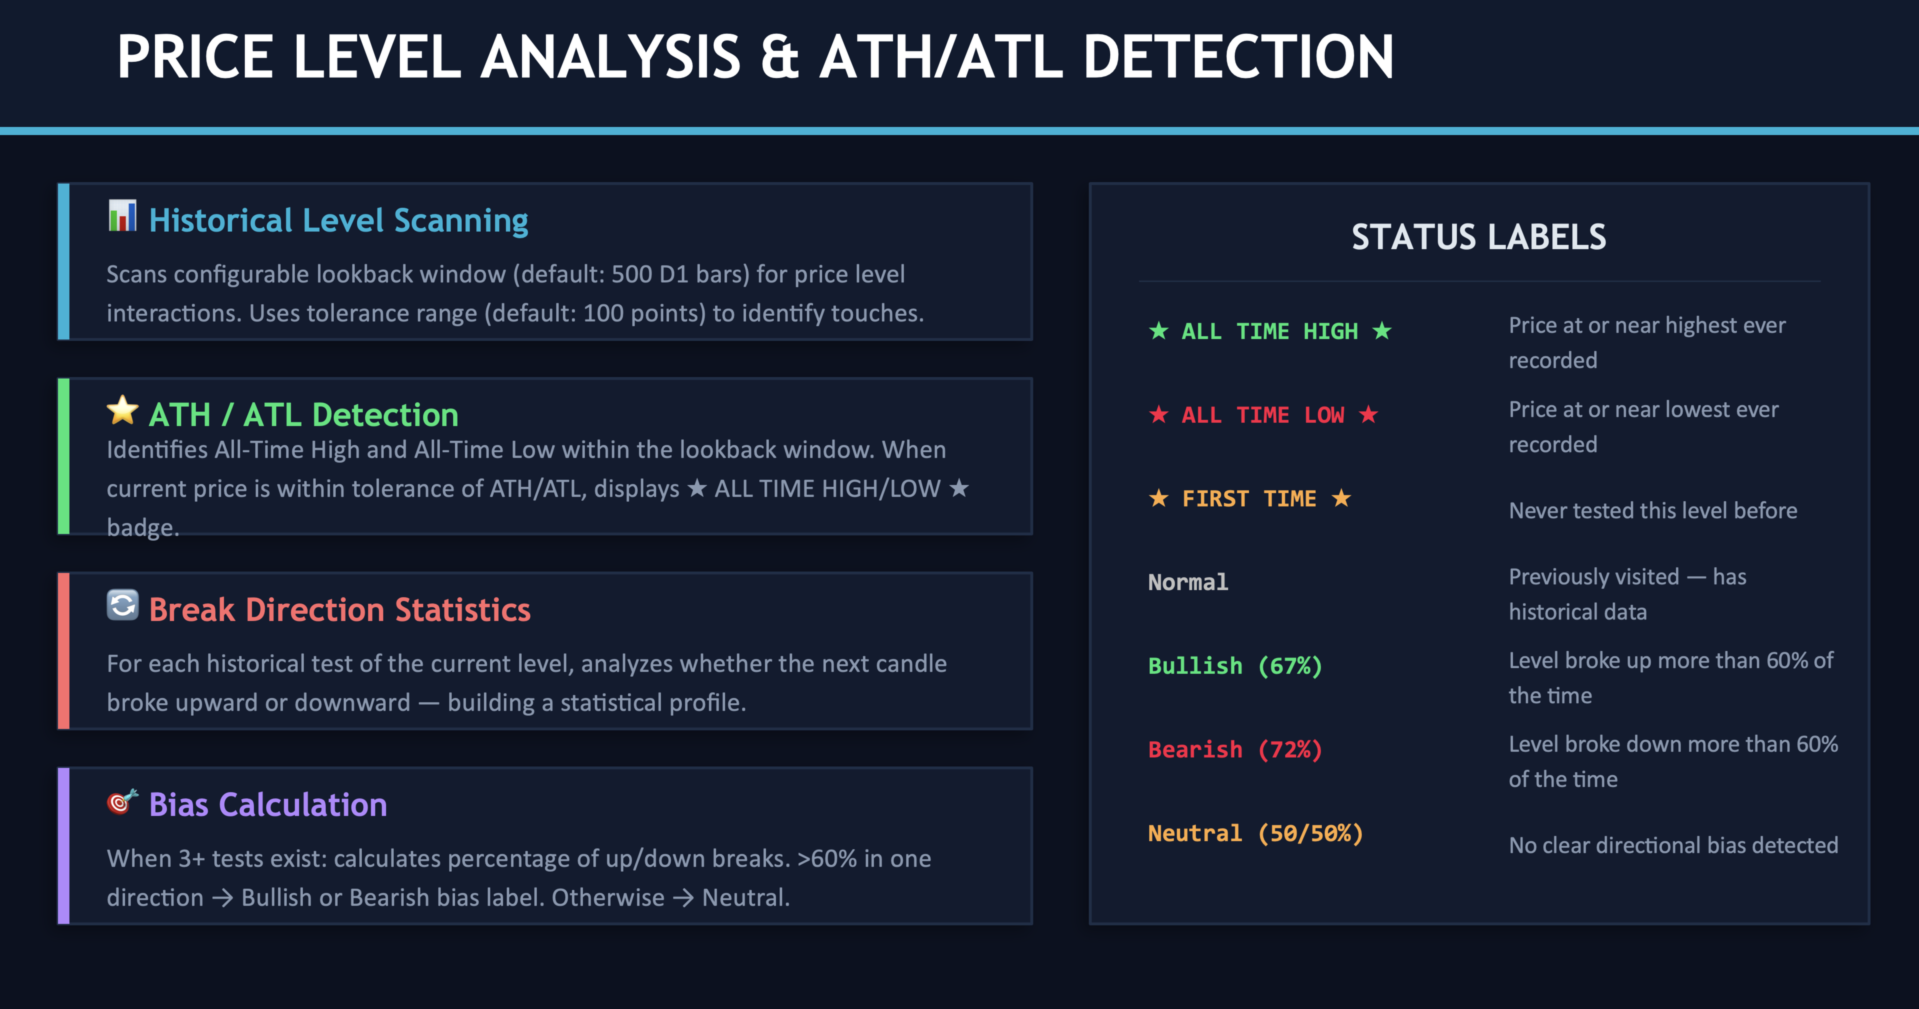
MiniBull Observer Calculator is a multi-timeframe market analysis panel with weighted composite scoring (EMA50 and MACD carry 2x weight, scale -13 to +13), covering 11 timeframes with selectable MA type (SMA/EMA/Adaptive KAMA) and oscillators (RSI, MACD, Stochastic, CCI, Momentum). A Trend Alignment row summarizes bullish/bearish/neutral timeframe counts with a visual bar. D1 High/Low proximity and break alerts, plus Strong Score alerts (≥9/13), can notify via popup, sound, or push. A built-in Trade Calculator shows LONG/SHORT scenarios using D1 High/Low or Wilder ATR as SL/TP, with Risk/Reward in USD for the minimum lot size. Price Level Analysis tracks historical D1 level breaks and detects all-time highs/lows. An Economic News Panel pulls today's + next 36h high-impact events via MT5's built-in Calendar API, showing Actual vs Forecast (no external URLs needed). New in v1.05: chart overlay of the built-in Adaptive Moving Average — AMA(9) and AMA(200) — plotted directly on the main chart; Sound Alert now defaults to off while Popup Alert remains on and fires instantly on D1 High/Low breaks.
MiniBull Observer Calculator is a multi-timeframe market analysis panel with weighted composite scoring (EMA50 and MACD carry 2x weight, scale -13 to +13), covering 11 timeframes with selectable MA type (SMA/EMA/Adaptive KAMA) and oscillators (RSI, MACD, Stochastic, CCI, Momentum). A Trend Alignment row summarizes bullish/bearish/neutral timeframe counts with a visual bar. D1 High/Low proximity and break alerts, plus Strong Score alerts (≥9/13), can notify via popup, sound, or push. A built-in Trade Calculator shows LONG/SHORT scenarios using D1 High/Low or Wilder ATR as SL/TP, with Risk/Reward in USD for the minimum lot size. Price Level Analysis tracks historical D1 level breaks and detects all-time highs/lows. An Economic News Panel pulls today's + next 36h high-impact events via MT5's built-in Calendar API, showing Actual vs Forecast (no external URLs needed). New in v1.05: chart overlay of the built-in Adaptive Moving Average — AMA(9) and AMA(200) — plotted directly on the main chart; Sound Alert now defaults to off while Popup Alert remains on and fires instantly on D1 High/Low breaks.
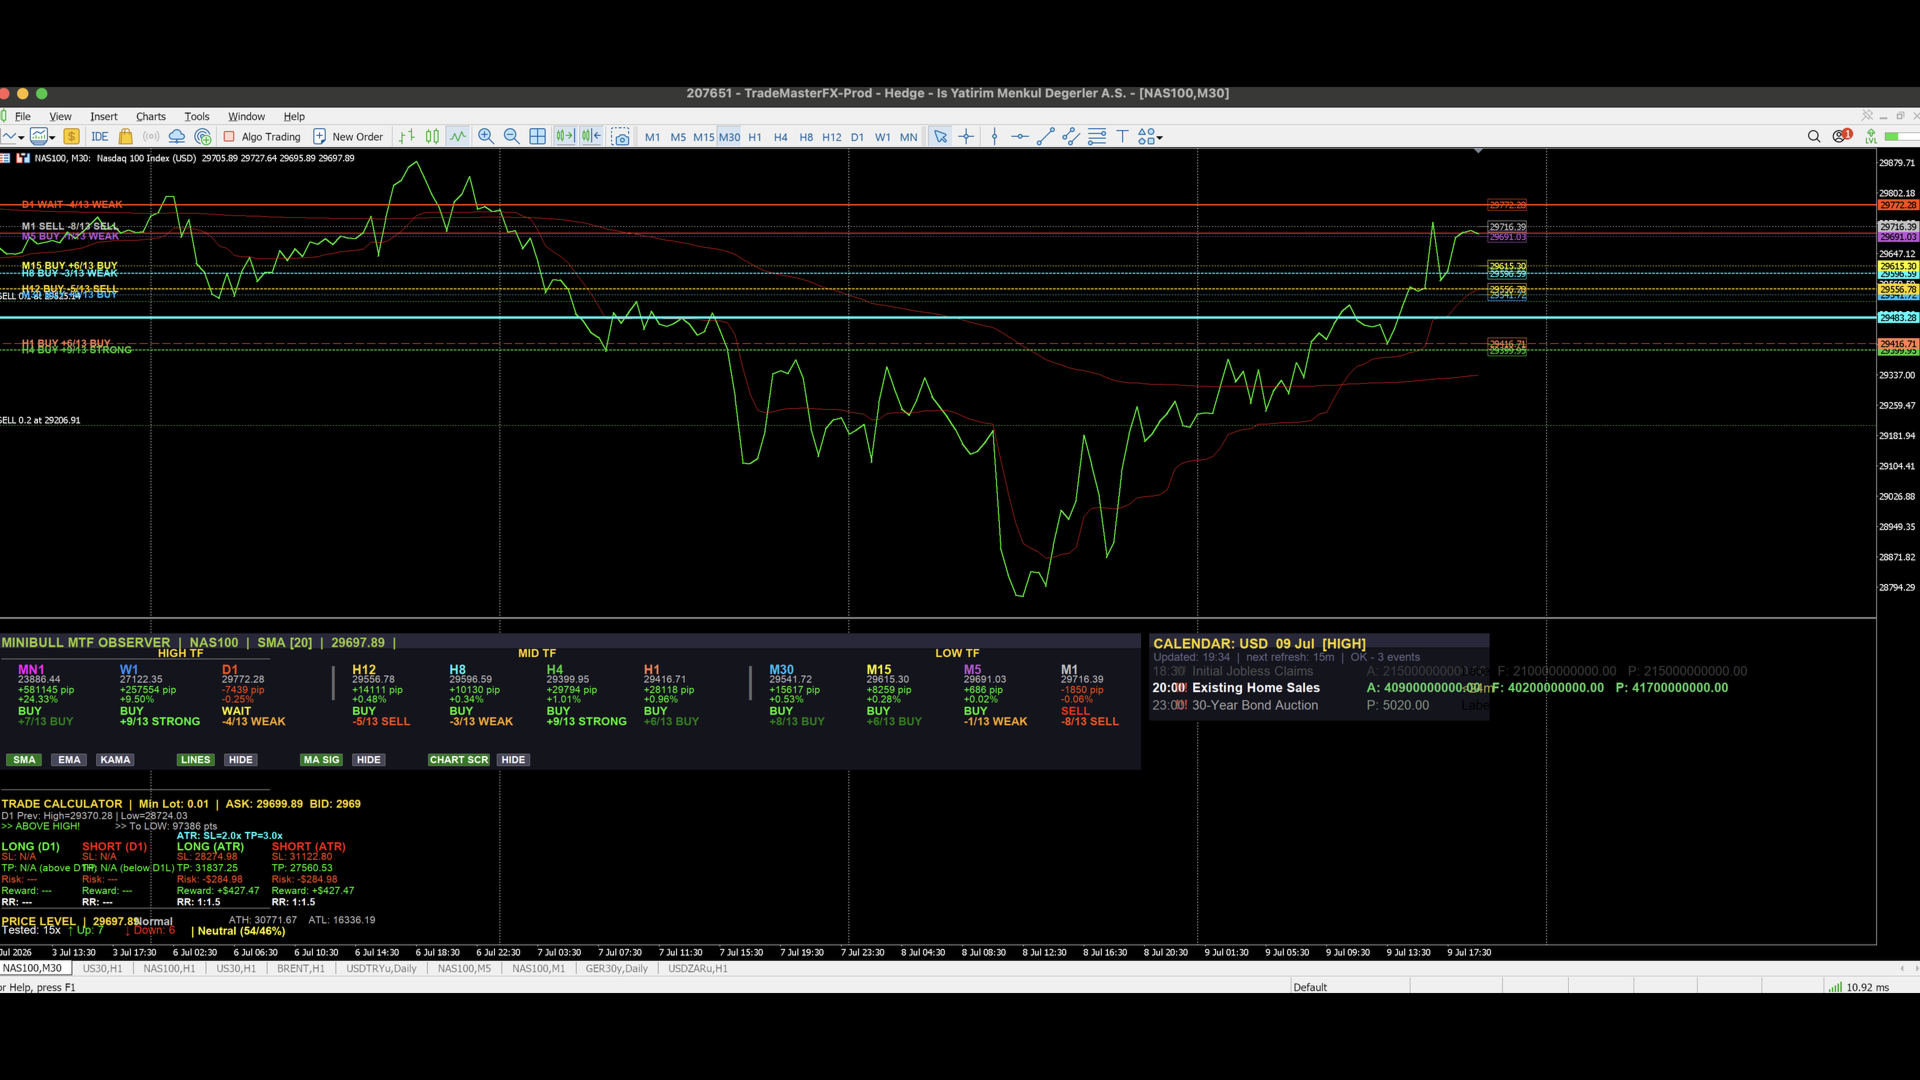
v1.04 — Economic Calendar Panel
This update adds a real-time Economic News panel displayed alongside the main analysis panel in the indicator sub-window.
What's new:
- Live economic events fetched directly from MT5's built-in Calendar — no WebRequest, no external URLs, no setup required
- Filters by currency (default: USD) and minimum importance level (default: High only)
- Shows events from the past 2 hours through the next 36 hours, sorted by time
- Upcoming events within 1 hour are highlighted in white/bold with a live countdown timer (<15m, <5m, <30s)
- Past events are dimmed for easy visual separation
- Actual vs Forecast displayed with color coding: green = beat, red = miss
- Auto-refreshes every 15 minutes (configurable)
- Event name language follows your MT5 terminal language setting
New inputs:
- Currency Filter — USD / EUR / GBP / JPY / ALL
- Min Importance — 1 = Low+, 2 = Medium+, 3 = High only
- Refresh Interval — minutes between calendar updates
- Panel X Position — 0 = auto-placed to the right of the main panel
Multi-Timeframe Composite Signal Analyzer: 9 indicators across 11 TFs with scoring system (-9 to +9).
### Full Description:
**🎯 Say goodbye to watching multiple timeframe charts!**
MiniBull MTF Observer - Multi-Timeframe Composite Signal Analyzer
The ultimate multi-indicator dashboard! Analyzes 9 different technical indicators across 11 timeframes simultaneously and provides a composite score from -9 to +9 for each timeframe.
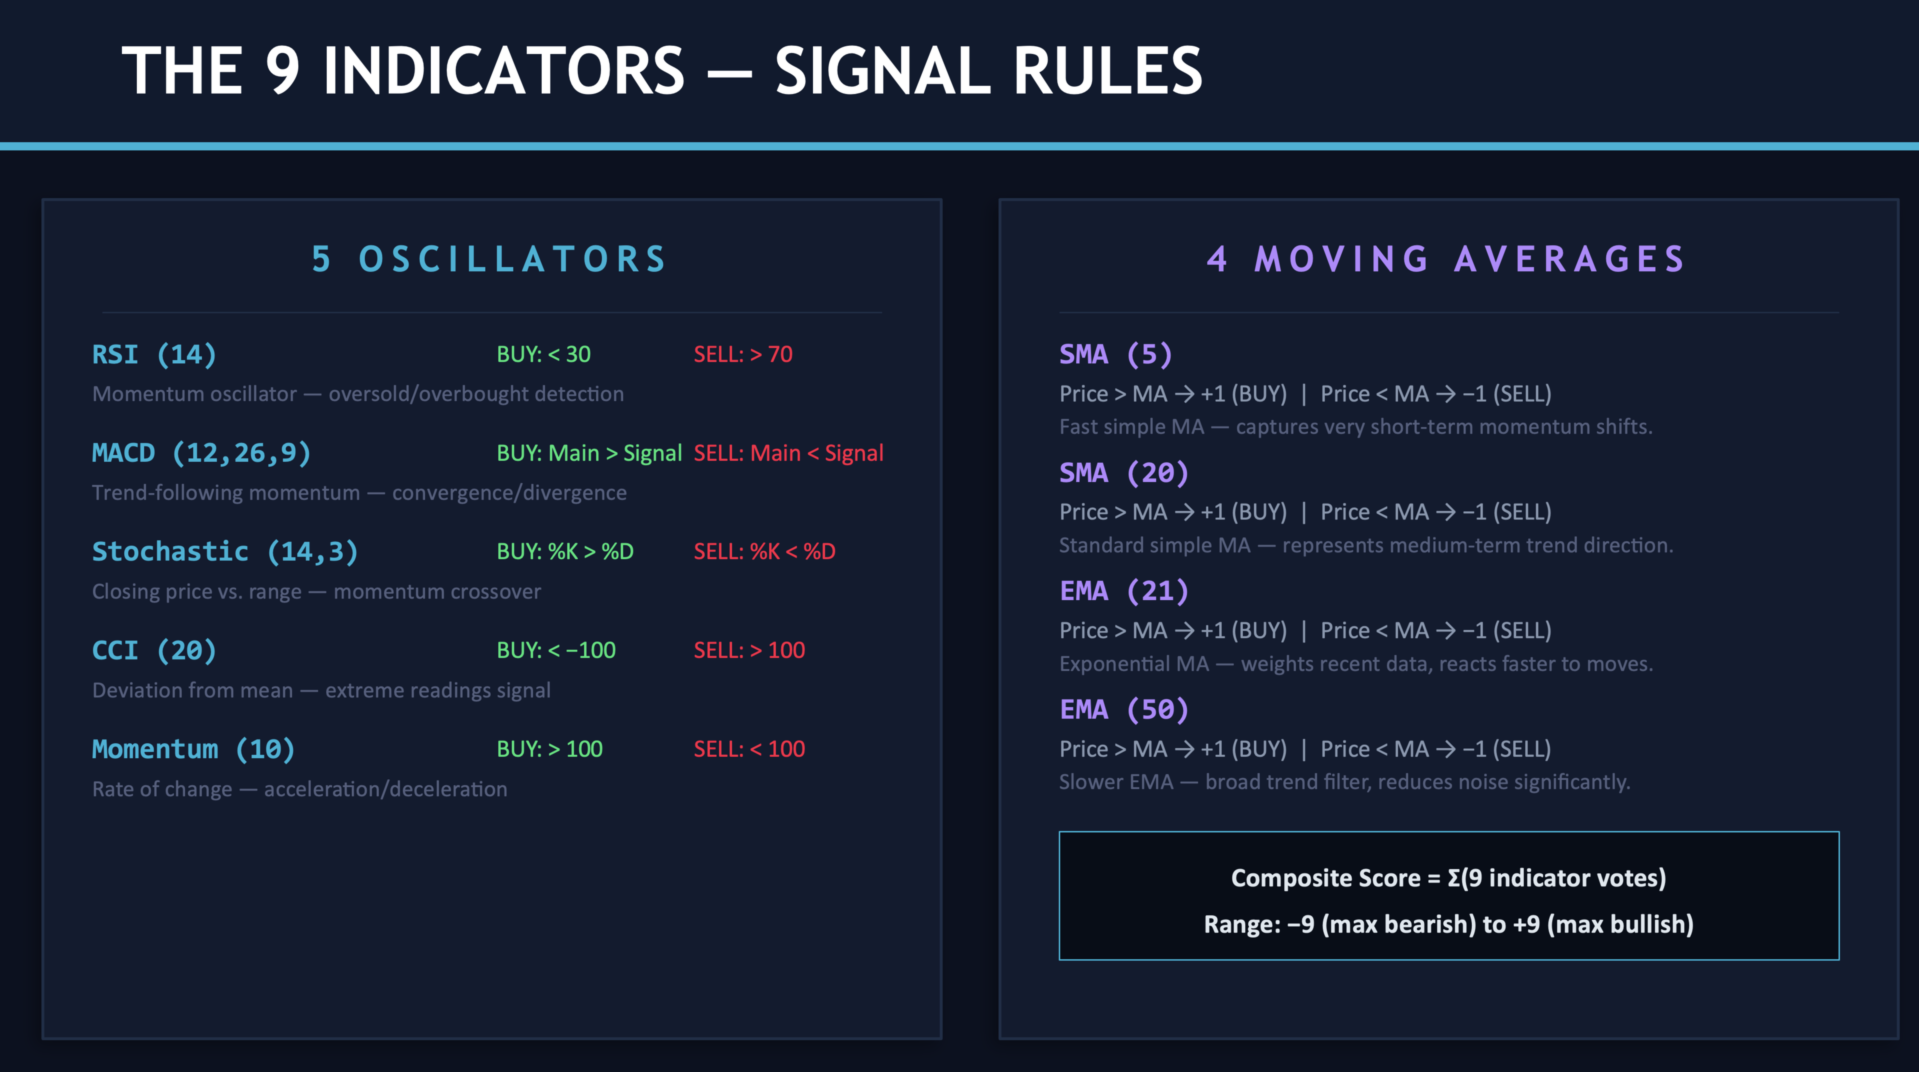
**9 INDICATORS ANALYZED:**
• RSI (Relative Strength Index)
• MACD (Moving Average Convergence Divergence)
• Stochastic Oscillator
• CCI (Commodity Channel Index)
• Momentum
• SMA 5 (Simple Moving Average)
• SMA 20
• EMA 21 (Exponential Moving Average)
• EMA 50
**KEY FEATURES:**
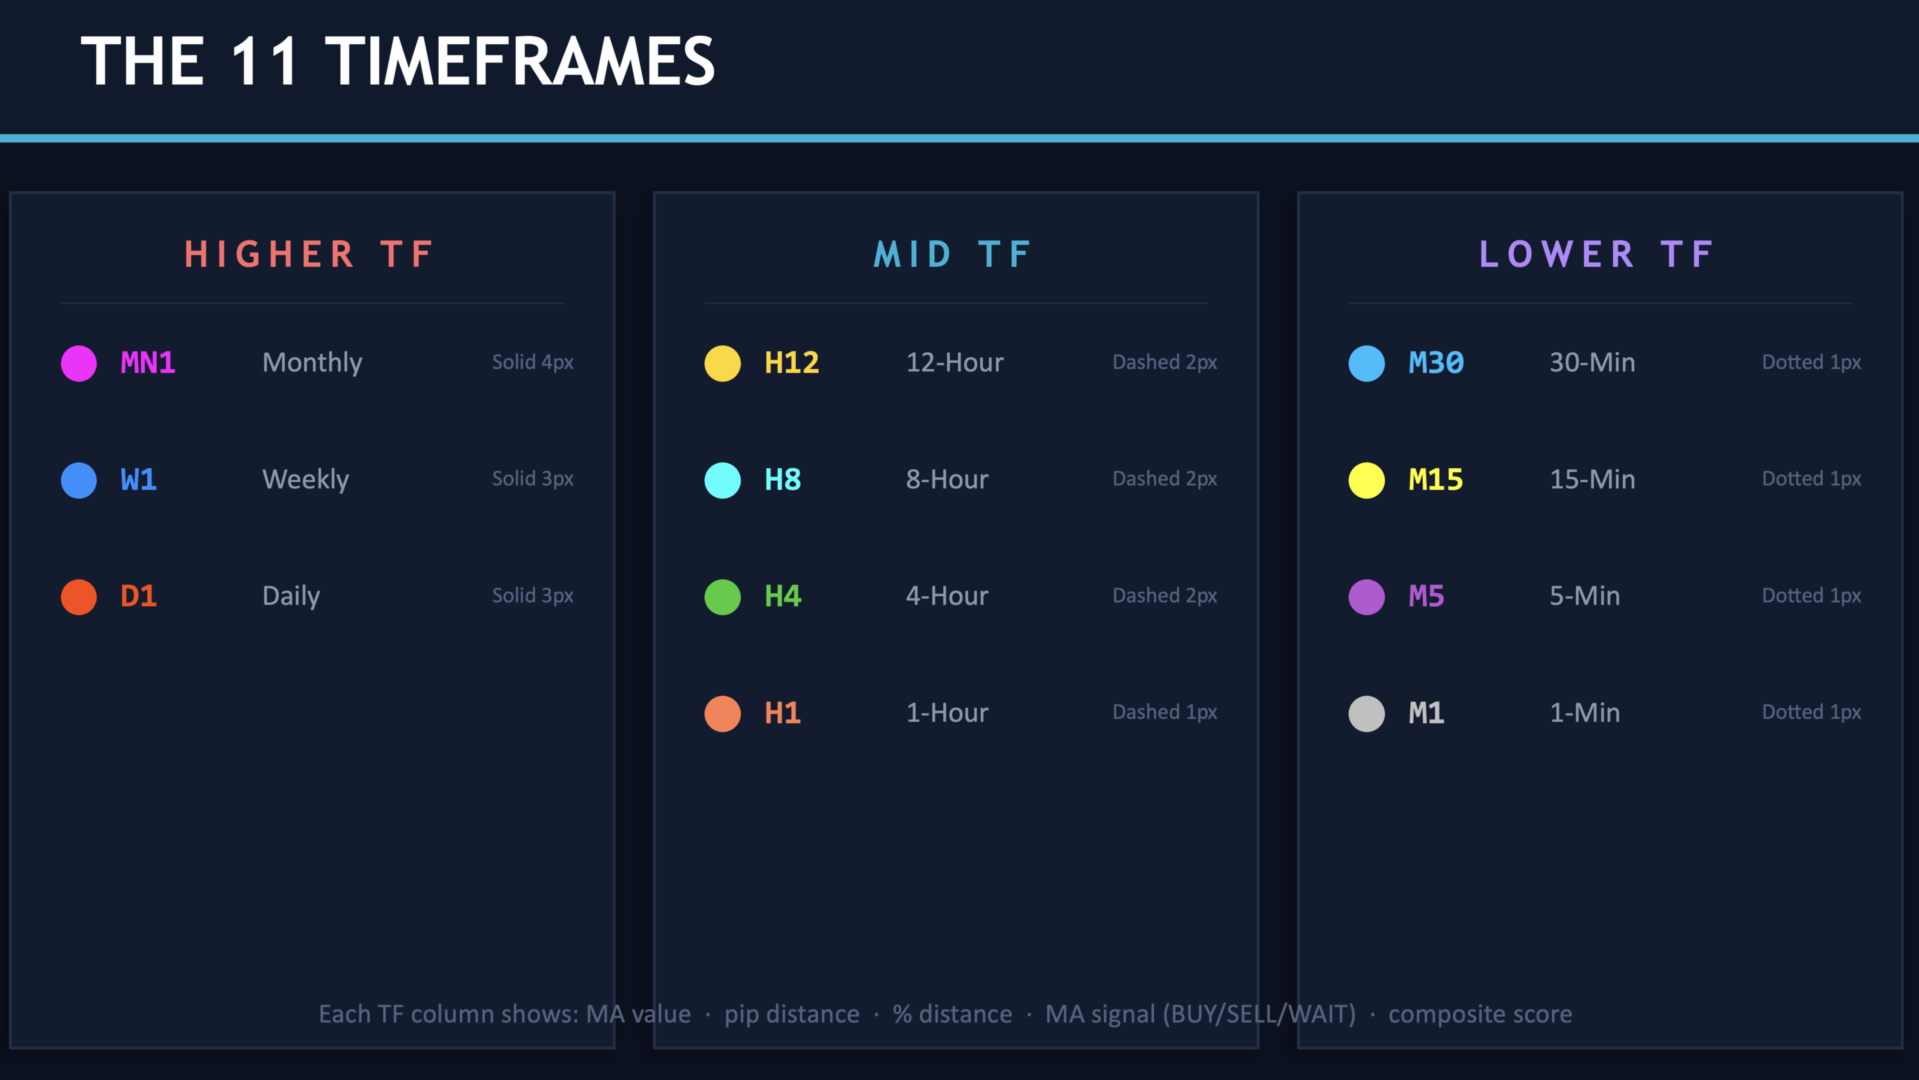
• 11 Timeframes: MN1, W1, D1, H12, H8, H4, H1, M30, M15, M5, M1
• Composite Score: -9 to +9 for each timeframe
• Score Strength: STRONG (±7-9) / BUY-SELL (±4-6) / WEAK (±1-3) / NEUTRAL (0)
• MA Position Signal: Optional BUY/SELL/WAIT based on price vs MA
• 3 MA Types: Switch between SMA, EMA, KAMA with one click
• Visual Chart Lines: Horizontal MA lines with unique colors per timeframe
• Distance Display: Pips and Percentage from MA
• Interactive Buttons: Change settings without reloading
• Smart Alerts: Notifications on strong signals (score ≥6 or ≤-6)
• All calculations use CLOSED BAR data for reliability
**HOW SCORING WORKS:**
Each of the 9 indicators votes: +1 (bullish), -1 (bearish), or 0 (neutral)
Total score ranges from -9 (all bearish) to +9 (all bullish)
Score Interpretation:
• +7 to +9: STRONG BUY signal
• +4 to +6: Moderate BUY signal
• +1 to +3: WEAK BUY signal
• 0: NEUTRAL
• -1 to -3: WEAK SELL signal
• -4 to -6: Moderate SELL signal
• -7 to -9: STRONG SELL signal
**INPUT PARAMETERS:**
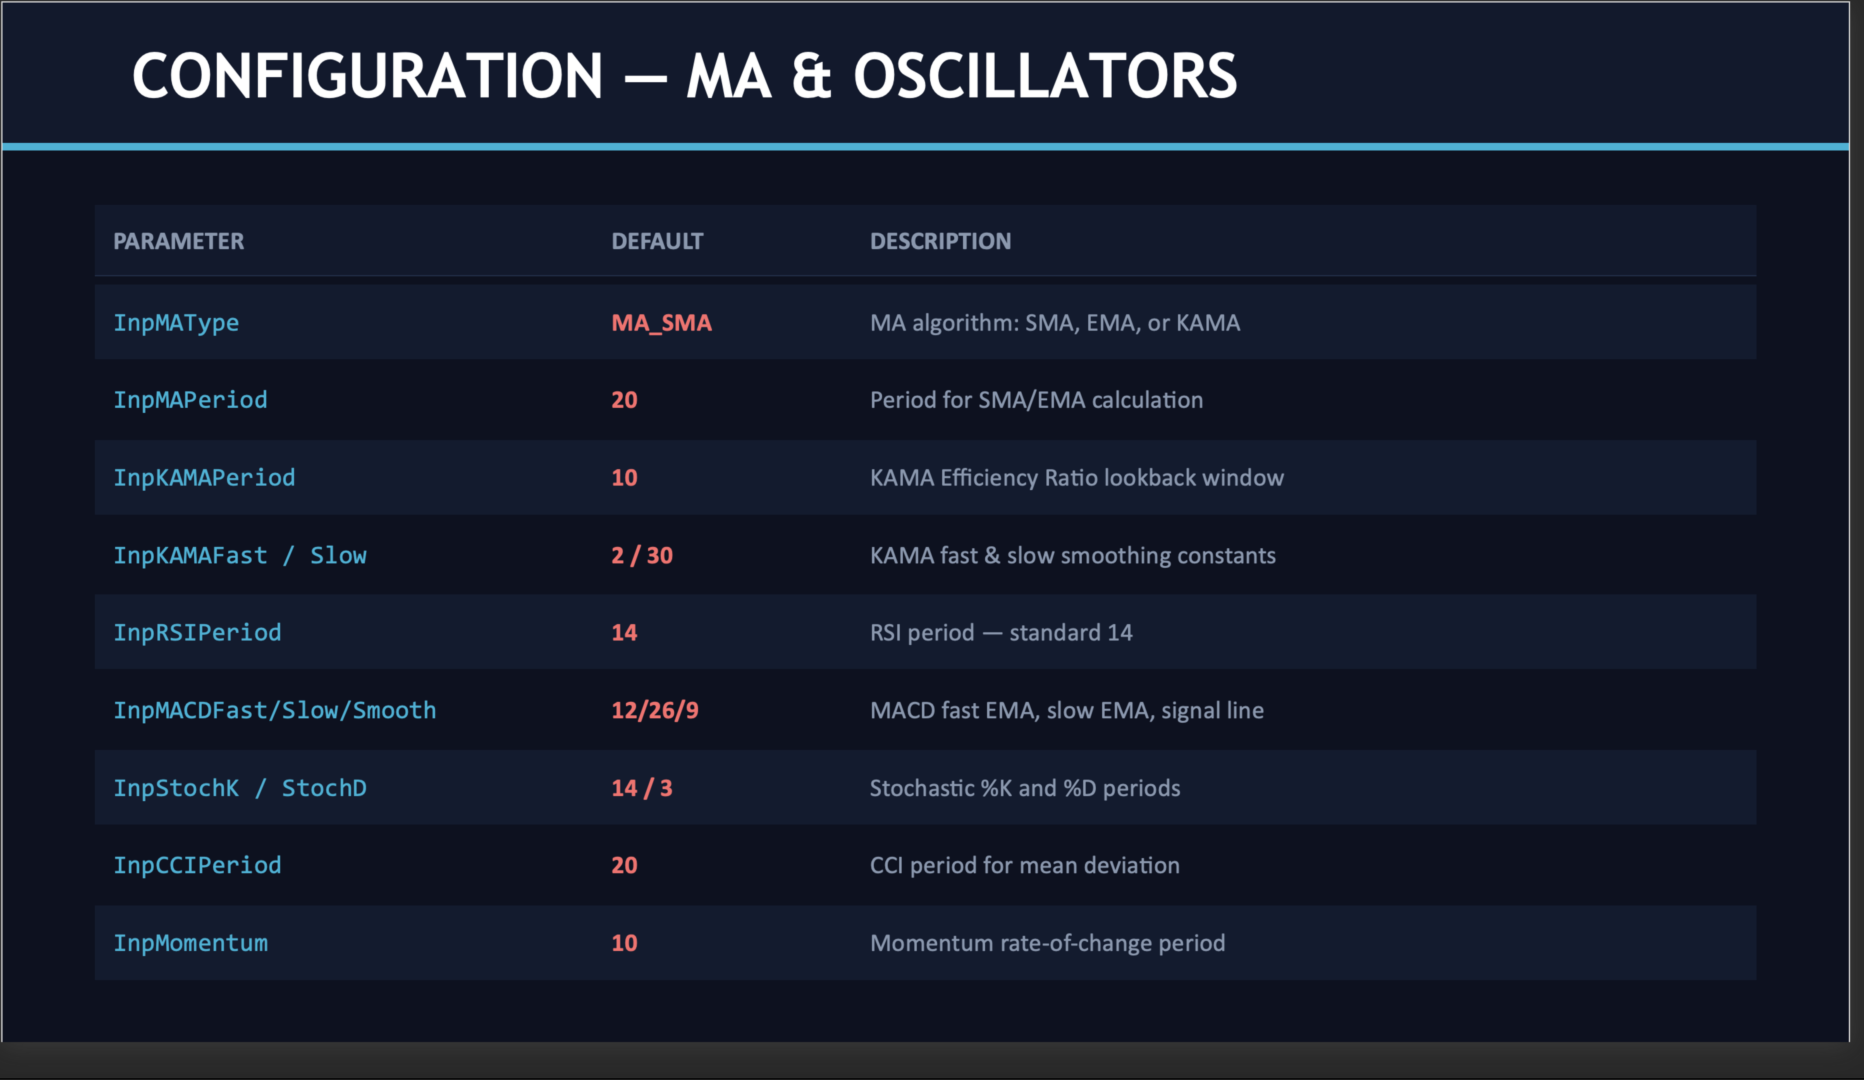
MA Settings:
- MA Type: SMA / EMA / KAMA
- MA Period: Default 20
- KAMA Parameters: 10, 2, 30 (Kaufman standard)
Oscillator Settings:
- RSI Period: Default 14
- MACD: 12, 26, 9
- Stochastic: 14, 3
- CCI Period: Default 20
- Momentum: Default 10
Display & Alert Settings:
- Show/Hide MA lines, MA signals, Score on chart
- Popup, Sound, Push notification options
**RECOMMENDED USE:**
- Confluence Trading: Look for multiple TFs with same direction
- Scalping: Focus on M1-M15 with score ≥6
- Day Trading: H1-H4 alignment with D1 trend
- Swing Trading: D1-W1 strong signals
**REQUIREMENTS:**
- MetaTrader 5
- Any symbol (Forex, Metals, Crypto, Indices, Stocks)
================================================================================
MINIBULL MTF OBSERVER - PERFORMANCE REPORT
Statistical Signal Accuracy Test
================================================================================
+--------------------------------------------------------------------------+
| IMPORTANT: This indicator is useful for quickly assessing market |
| conditions. It should be used as a decision support tool, not as a |
| standalone trading signal generator. |
+--------------------------------------------------------------------------+
WHAT THIS INDICATOR DOES:
[✓] Visualizes market conditions at a glance
[✓] Displays multiple timeframes in a single panel
[✓] Can be used as a decision support tool
[✓] Summarizes 9 indicators in one view
Document Info
-------------
Product: MiniBull MTF Observer v1.01
Test Date: February 2026
Test Period: May 2024 - January 2026 (Backtest + Forward Test)
Author: Yusuf Levent Aksun
================================================================================
1. TEST METHODOLOGY
================================================================================
PURPOSE
-------
This test measures DIRECTIONAL ACCURACY of composite signals.
Question: "When score >= 6, does price move in predicted direction within 10 bars?"
WHY THIS METHOD?
- No SL/TP manipulation - Results cannot be curve-fitted
- Pure direction measurement - Tests indicator logic only
- Objective evaluation - Same criteria for all symbols/timeframes
================================================================================
2. TEST SETTINGS
================================================================================
STRATEGY TESTER
---------------
Platform: MetaTrader 5
Mode: Every tick based on real ticks
Backtest Period: 2024.05.01 - 2025.08.18
Forward Period: 2025.08.19 - 2026.01.25
Deposit: $10,000
Leverage: 1:10
INDICATOR INPUTS
----------------
Minimum Score: 6 (signal threshold)
Bars to Evaluate: 10 (bars after signal)
RSI Period: 14
MACD: 12/26/9
Stochastic: 14/3
CCI Period: 20
Momentum Period: 10
COMPOSITE SCORE (9 Indicators)
------------------------------
+1 BUY: RSI<30, MACD>Signal, K>D, CCI<-100, Mom>100, Price>MA
-1 SELL: RSI>70, MACD<Signal, K<D, CCI>100, Mom<100, Price<MA
Score Range: -9 to +9
Signal: Score >= +6 (BUY) or Score <= -6 (SELL)
================================================================================
3. TIMEFRAME COMPARISON
================================================================================
RANK TF TOTAL PIPS AVG WR% BUY WR% SELL WR% POS/NEG VERDICT
--------------------------------------------------------------------------------
1 H4 +322,551 49.4% 52.3% 45.0% 44/34 ✓ RECOMMENDED
2 H1 -149,376 49.1% 50.6% 47.1% 41/37 ! WEAK
3 D1 -273,315 46.8% 47.6% 37.3% 33/45 X NOT RECOMMENDED
4 M5 -584,298 47.9% 48.8% 46.8% 20/58 X NOT RECOMMENDED
KEY FINDING: H4 is the ONLY timeframe with positive results.
================================================================================
4. BEST PERFORMERS (H4)
================================================================================
RANK SYMBOL TOTAL PIPS AVG PIP WIN RATE BUY WR SELL WR
--------------------------------------------------------------------------------
1 BTCUSD +354,195 3,472 51.0% 48.8% 52.5%
2 ETHUSD +21,990 202 49.5% 46.0% 52.5%
3 JPN225 +9,310 141 63.6% 66.7% 60.0% <-- BEST WR
4 XAUUSD +7,736 131 52.5% 70.0% 15.8%
5 NAS100 +6,390 34 53.7% 60.7% 42.3%
6 DOGEUSD +5,948 22 51.9% 52.3% 51.5%
7 US30 +4,800 24 56.2% 61.0% 51.0%
8 SpotCrude +4,191 19 56.4% 56.1% 56.8% <-- BALANCED
9 GER40 +2,639 15 55.6% 63.0% 46.3%
================================================================================
5. CONSISTENTLY PROFITABLE (BT + FWD)
================================================================================
Both Backtest AND Forward Test positive:
SYMBOL_TF TOTAL PIPS AVG WR% STATUS
------------------------------------------------
XAUUSD_H4 +13,883 51.6% ⭐ HIGHLY RECOMMENDED
XAUUSD_H1 +18,814 51.2% ⭐ HIGHLY RECOMMENDED
USDJPY_H1 +4,692 49.8% ✓ RECOMMENDED
NAS100_H1 +4,479 47.6% ✓ RECOMMENDED
GER40_H4 +3,591 51.7% ✓ RECOMMENDED
GER40_D1 +4,467 57.1% ✓ RECOMMENDED
US30_H4 +5,912 54.0% ✓ RECOMMENDED
SpotBrent_H1 +3,211 49.5% ✓ RECOMMENDED
================================================================================
6. WORST PERFORMERS
================================================================================
AVOID THESE:
SYMBOL TOTAL PIPS AVG WR% ISSUE
---------------------------------------------------------
BTCUSD* -316,658 45.9% * Only good on H4
USDZAR -292,102 46.5% Exotic, wide spreads
XPDUSD -77,396 52.7% Low liquidity
ETHUSD* -21,001 45.4% * Only good on H4
Cotton -9,076 43.0% Poor signal quality
================================================================================
7. BUY vs SELL ANALYSIS
================================================================================
TF BUY WIN RATE SELL WIN RATE DIFFERENCE
------------------------------------------------
H4 52.3% 45.0% +7.3% <-- BUY stronger
H1 50.6% 47.1% +3.5%
D1 47.6% 37.3% +10.3% <-- SELL very weak
M5 48.8% 46.8% +2.0%
CONCLUSION: BUY signals significantly more reliable than SELL signals.
================================================================================
8. RECOMMENDATIONS
================================================================================
OPTIMAL CONFIGURATION:
----------------------
Timeframe: H4
Min Score: 6 (or 7 for fewer, better signals)
Best Symbols: XAUUSD, JPN225, US30, GER40, NAS100, SpotCrude
Signal Bias: Favor BUY signals
RISK PROFILES:
--------------
CONSERVATIVE MODERATE AGGRESSIVE
Min Score: 7-8 6 5
Eval Bars: 15-20 10 5
Symbols: Top 5 only Top 10 All
================================================================================
9. CONCLUSION
================================================================================
SUMMARY
-------
MTF Observer shows statistically significant directional accuracy on H4:
✓ XAUUSD (Gold) - Most consistent performer
✓ JPN225 (Nikkei) - Highest win rate (63.6%)
✓ US30 (Dow Jones) - Strong BUY signals
✓ GER40 (DAX) - Reliable H4 and D1
✓ SpotCrude - Balanced BUY/SELL
FINAL RATINGS
-------------
Overall Accuracy: ★★★☆☆ (~50% with positive pip expectancy on H4)
Best Timeframe: H4 (only profitable TF)
Signal Reliability: ★★★☆☆ (BUY better than SELL)
Symbol Coverage: ★★☆☆☆ (works on select instruments)
Recommended Use: ★★★★☆ (as confirmation tool, not standalone)
================================================================================
DISCLAIMER
================================================================================
Past performance does not guarantee future results. This statistical test
measures directional accuracy only. Actual trading results will vary based
on entry timing, position sizing, risk management, and market conditions.
================================================================================
© 2026 Yusuf Levent Aksun - All Rights Reserved
linkedin.com/in/levent-aksun
================================================================================