Support Resistance Catcher
- Indicators
- Taiba Mazhar
- Version: 1.0
- Activations: 5
Support Resistance Catcher Indicator Features and Explanation
Overview:
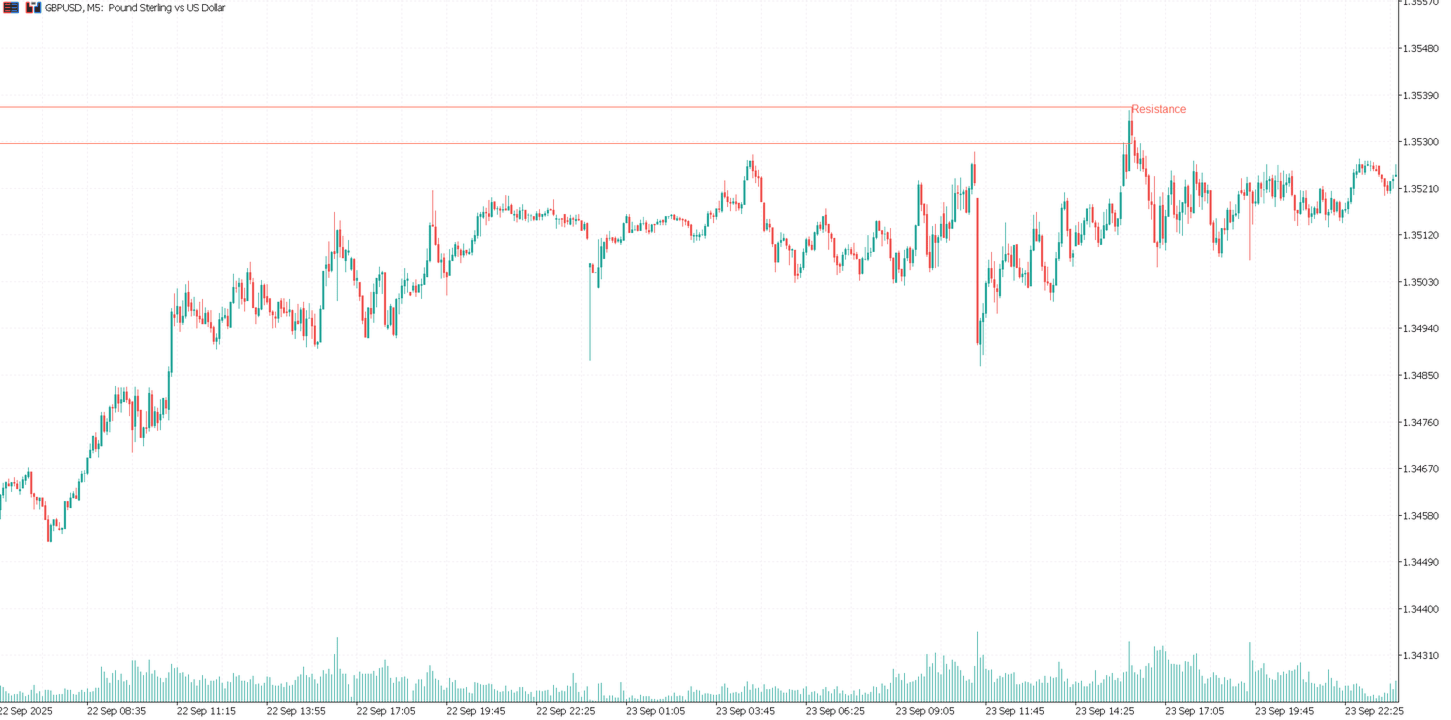
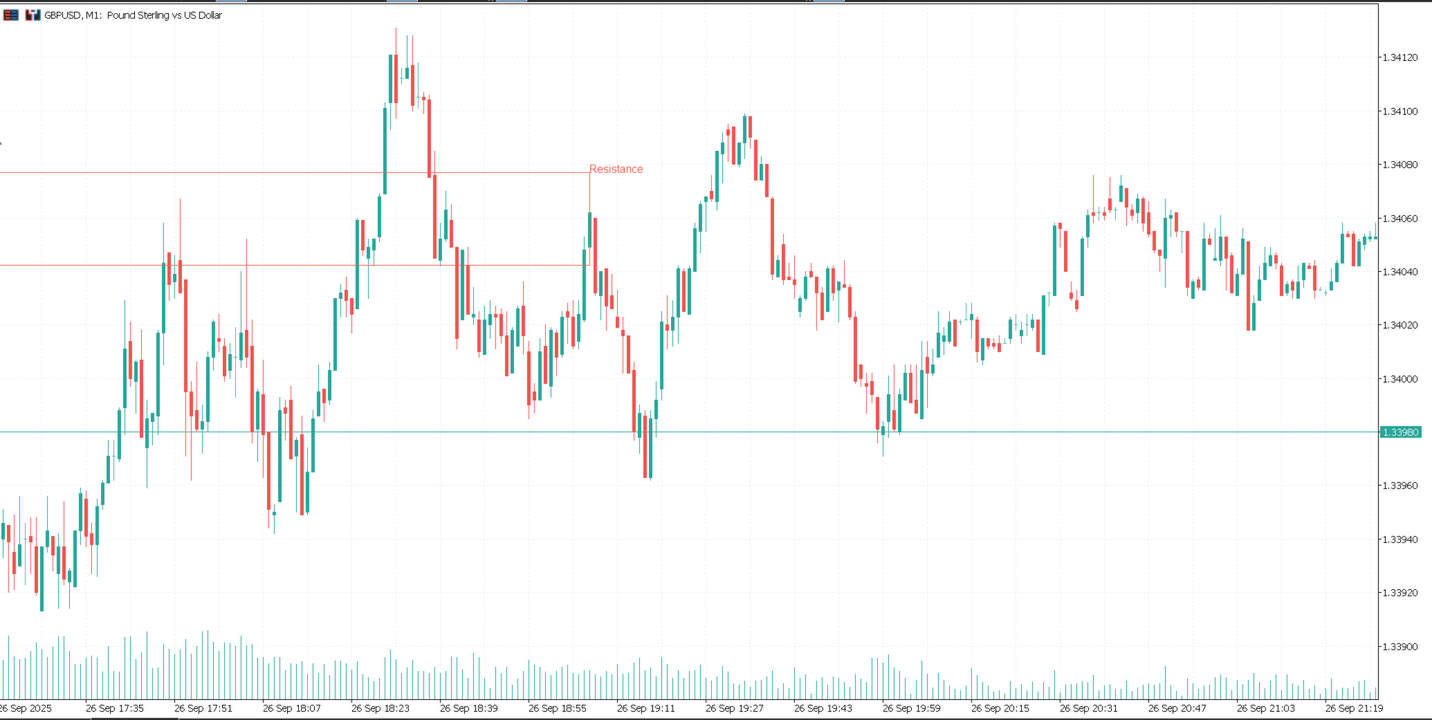
The Support Resistance Catcher is a custom MT5 indicator designed to identify and visualize supply (resistance) and demand (support) zones based on candlestick price action. It detects zones where price has reversed after rallies or drops, using wick rejections and clustering. The indicator draws horizontal rectangles for active and historical zones, with customizable colors, labels, and alerts.
Key Features:
1. Zone Detection:
- Identifies supply zones (resistance) from upper wick rejections at local highs
- Identifies demand zones (support) from lower wick rejections at local lows
- Uses configurable lookback period (PivotPeriod) for local max/min detection
- Clusters zones with minimum distance control (Overlook)
- Adjusts zone width based on Sensitivity parameter
2. Zone Management:
- Limits active zones to NumberOfZones (default 3)
- Displays up to HistoricalZones (default 100) historical zones
- Zones persist until broken through by price
- Historical zones shown with dashed style
3. Visual Elements:
- Supply zones: Tomato-colored rectangles (configurable)
- Demand zones: YellowGreen-colored rectangles (configurable)
- Optional fill with 30-40% opacity
- Labels showing "Resistance" or "Support"
- Optional arrows pointing to new zones
- Historical zones drawn thinner/dashed
4. Alerts:
- Popup alerts when price approaches zones within Alert_Pip_Distance
- Prevents spam with 60-second cooldown
- Compatible with sound/email/push (uses standard Alert() function)
5. Performance Optimizations:
- Processes only BarsToCalculate (default 3000) recent bars
- Incremental calculations to avoid lag
- Efficient looping and caching
- No repainting after candle close
6. Testing Mode:
- Fully compatible with Strategy Tester visual mode
- Draws historical zones accurately during backtesting
Inputs:
- Leverage: Account leverage (included but not actively used, default 100)
- NumberOfZones: Maximum active zones displayed (default 3)
- HistoricalZones: Maximum historical zones displayed (default 100)
- BarsToCalculate: Number of bars to process (default 3000)
- PivotPeriod: Lookback for local highs/lows (default 20)
- Overlook: Minimum bars between zones (default 10)
- SupportResistanceStrength: Reserved for future strength filtering (default 10)
- Sensitivity: Zone width adjustment (0.8 = wider zones, lower = wider)
- Show_Arrows: Enable arrows for new zones (default false)
- Color_of_Supply: Color for supply zones (default clrTomato)
- Color_of_Demand: Color for demand zones (default clrYellowGreen)
- Fill_Zones: Enable rectangle fill (default false)
- Show_Distance_from_Levels: Reserved for distance display (default false)
- Alert_Allowed: Enable alerts (default false)
- Alert_Pip_Distance: Pip distance for alerts (default 1)
How to Use:
1. Attach to any timeframe chart (tested on EURUSD H4)
2. Adjust inputs for your preferences
3. Observe rectangle zones on chart
4. Use as support/resistance levels for trading decisions
5. Enable alerts for notifications near zones
6. Historical zones provide context for zone strength
Compatibility:
- MetaTrader 5 only
- Works on any symbol and timeframe
- Optimized for real-time and backtesting use
Note: Zones are detected on closed bars only, ensuring no repainting.

User didn't leave any comment to the rating