Ouroboros
- Indicators
- Version: 1.0

Ouroboros: Adaptive Causality Indicator
Ouroboros is a unique technical analysis tool developed based on "Root Theory" and the concept of Adaptive Causality. Unlike standard oscillators or lagging moving averages, Ouroboros integrates volume-weighted price action to identify market "thrust" zones and structural shifts.
Core Logic
The indicator maps the market's biological growth, where the initial "Root" (price action) interacts with "Nutrient Conditions" (volume). When these forces align, Ouroboros provides a clear visual representation of market expansion and contraction cycles.
Key Features
-
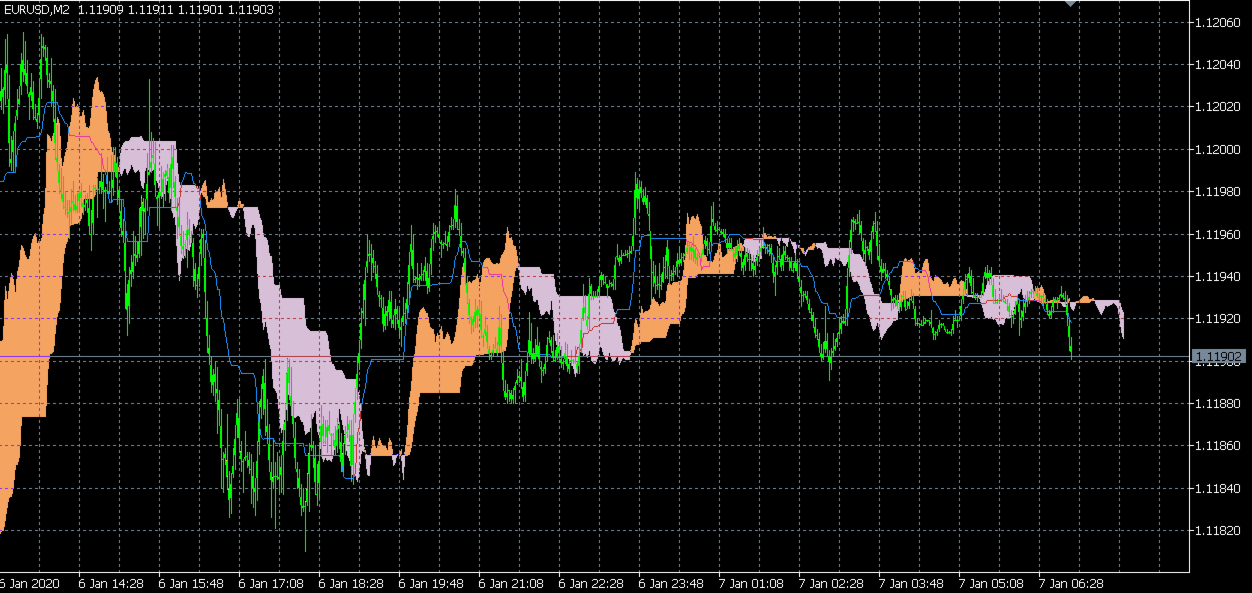
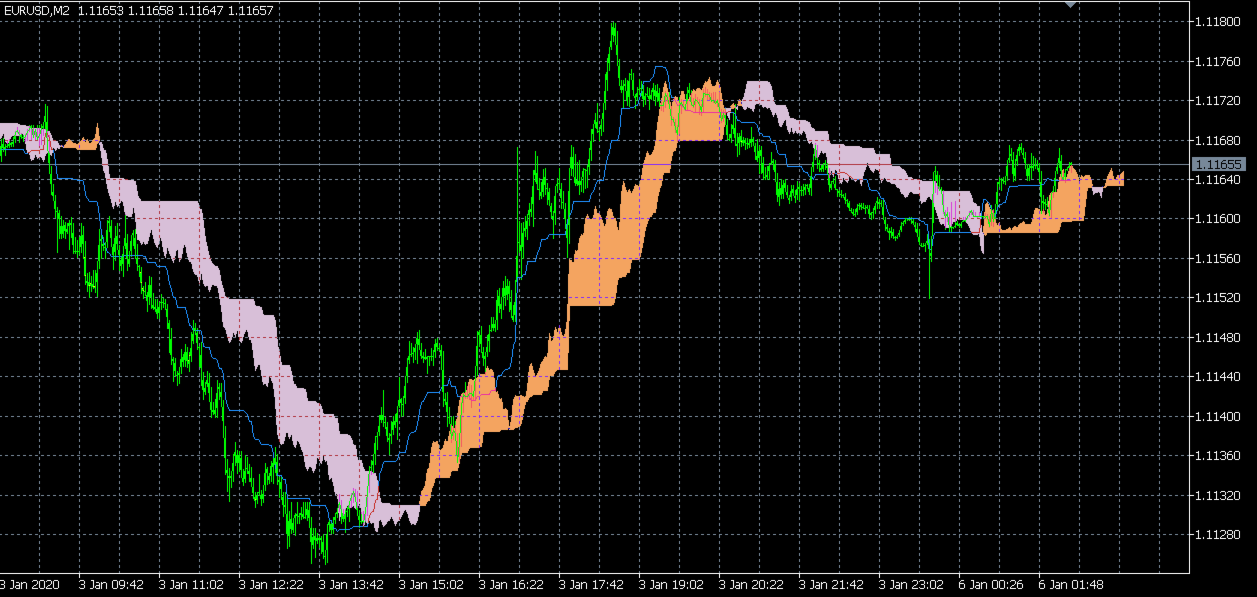
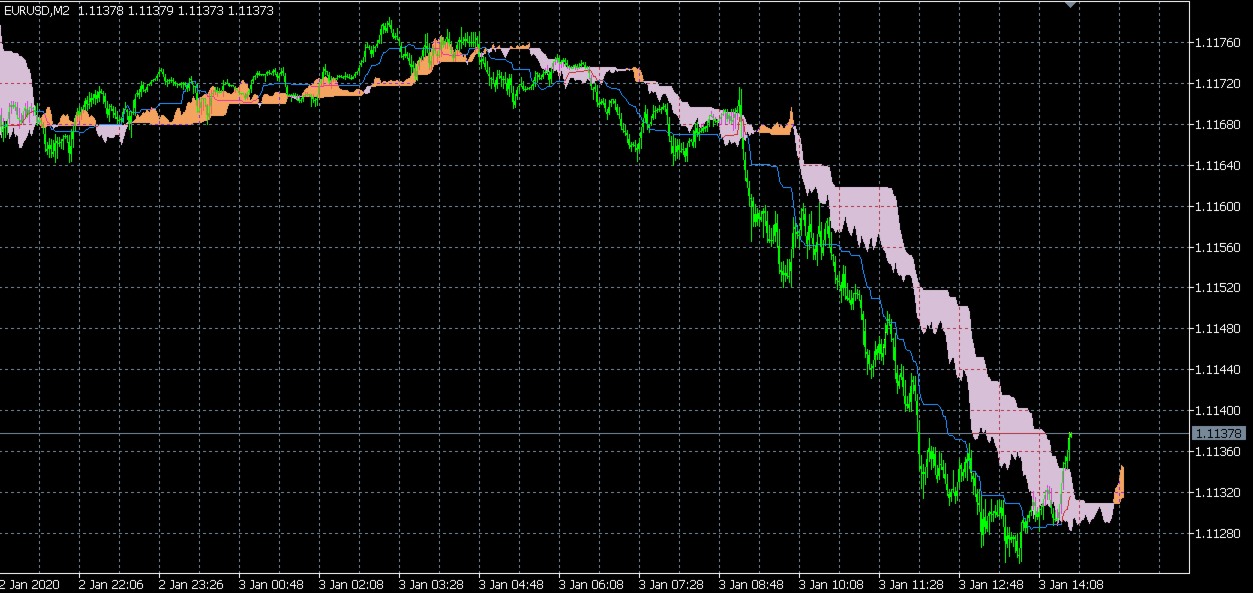
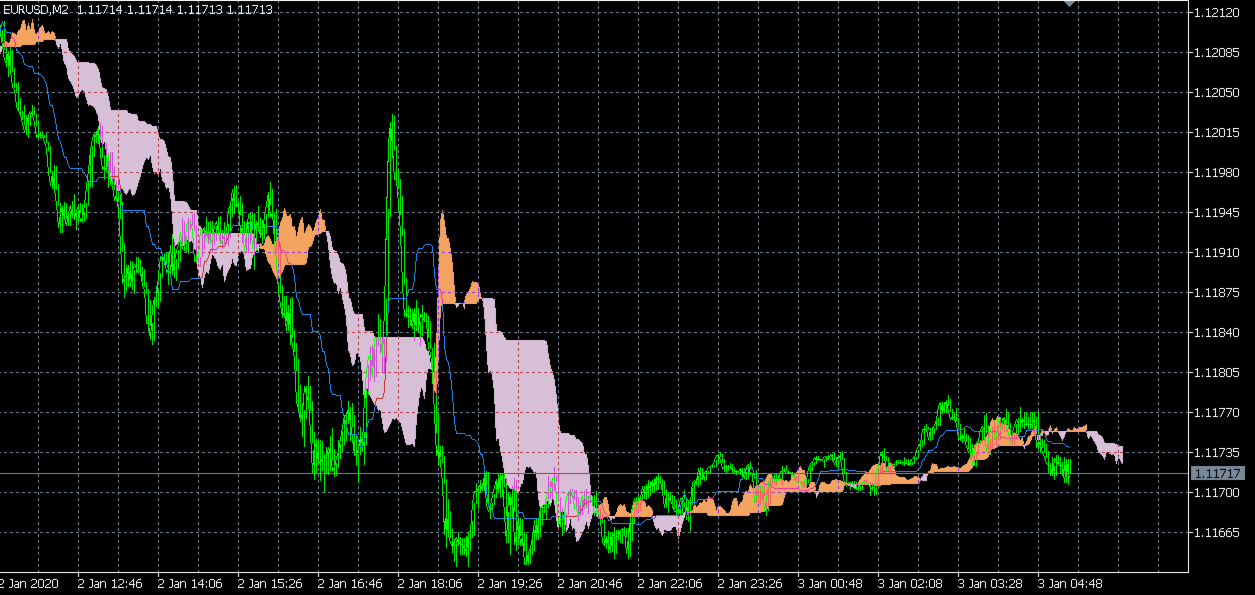
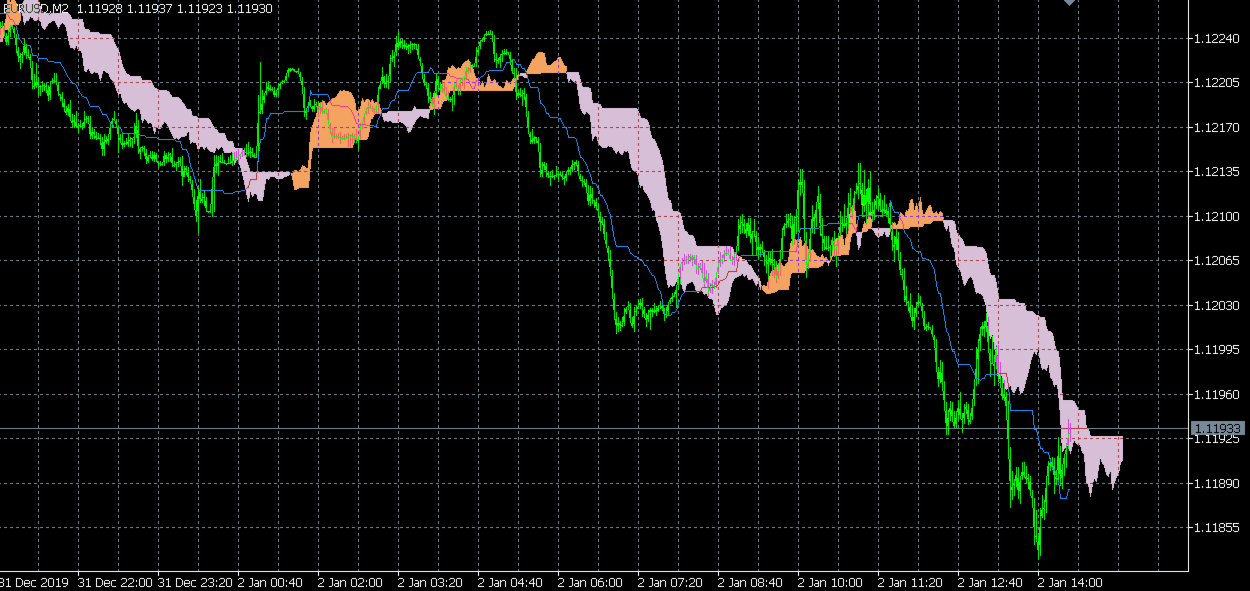
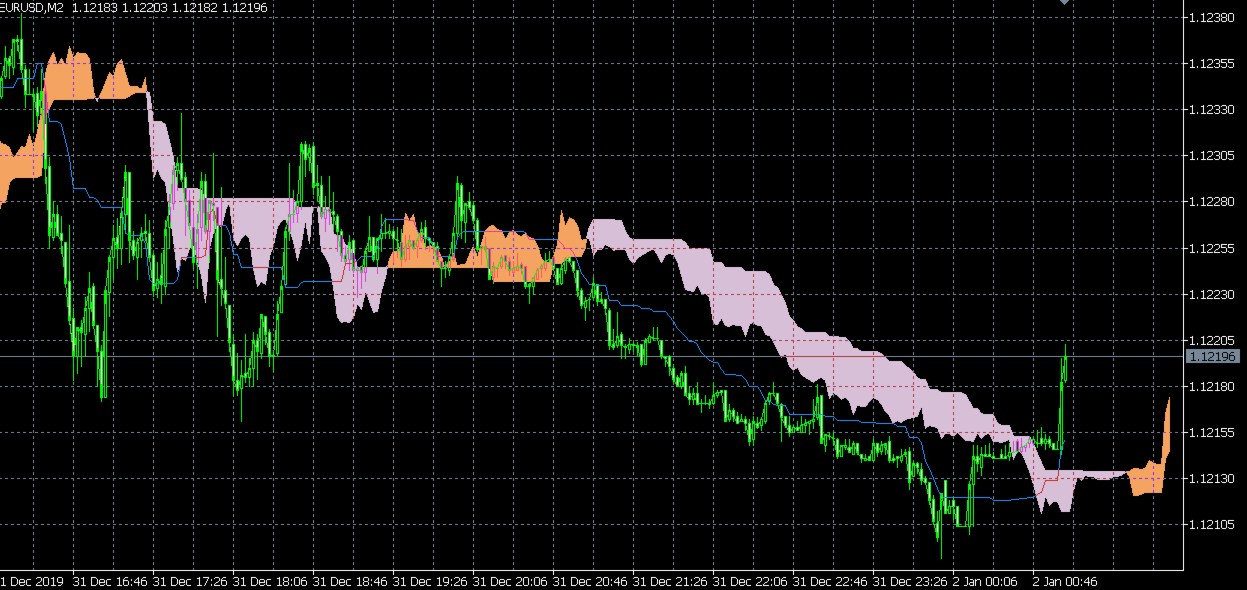
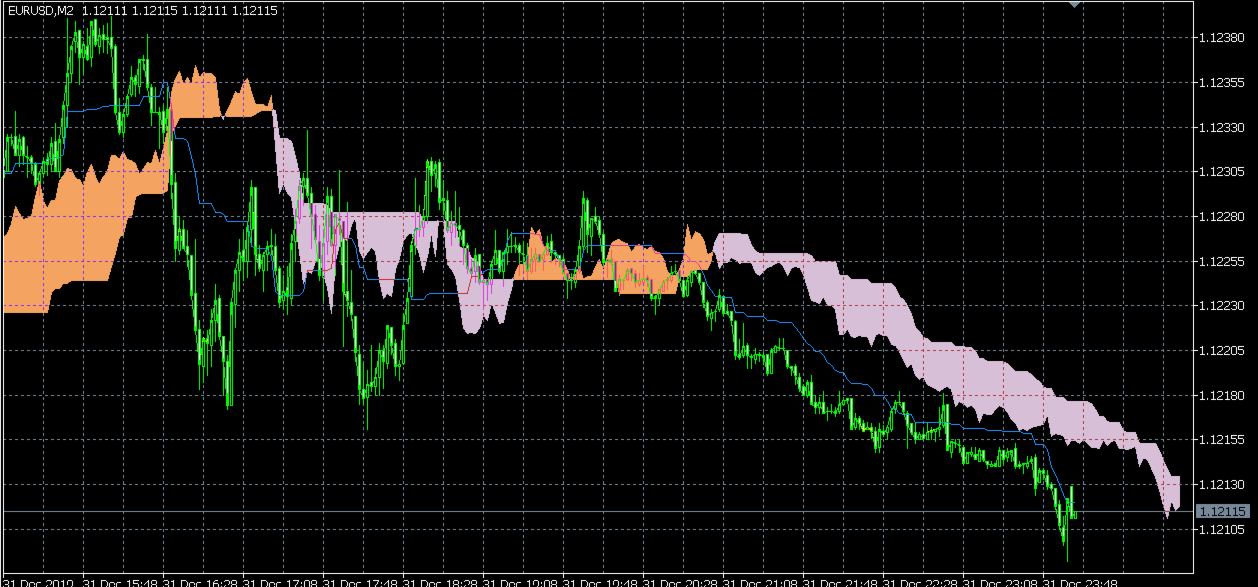
Root Thrust Line: A dynamic yellow line that reacts to price bodies and volume, identifying periods of high-energy market movement versus stagnation.
-
Sottosopra Cloud: A sophisticated visual cloud system that highlights areas of institutional liquidity and potential support/resistance zones, shifted to anticipate future market cycles.
-
Pure Analysis: Designed as a clean, non-intrusive technical tool, making it ideal for Smart Money Concept (SMC) traders and quantitative researchers.
-
No Trading Functions: This is an analytical tool only. It does not execute trades or contain automated strategies, ensuring full compatibility with your existing setups.
Input Parameters
-
Root Thrust Period (Default 9): Adjusts the sensitivity of the thrust line to short-term price movements.
-
Structural Period (Default 26): Defines the cycle length for structural support/resistance.
-
Cycle Period (Default 52): Controls the look-back period for the cloud formation.
Note: Ouroboros is designed for traders seeking to understand market dynamics through the lens of Root Theory. Use it to identify deviance and propagation points on your charts.