CiSD MT4

CiSD | Change in State Delivery

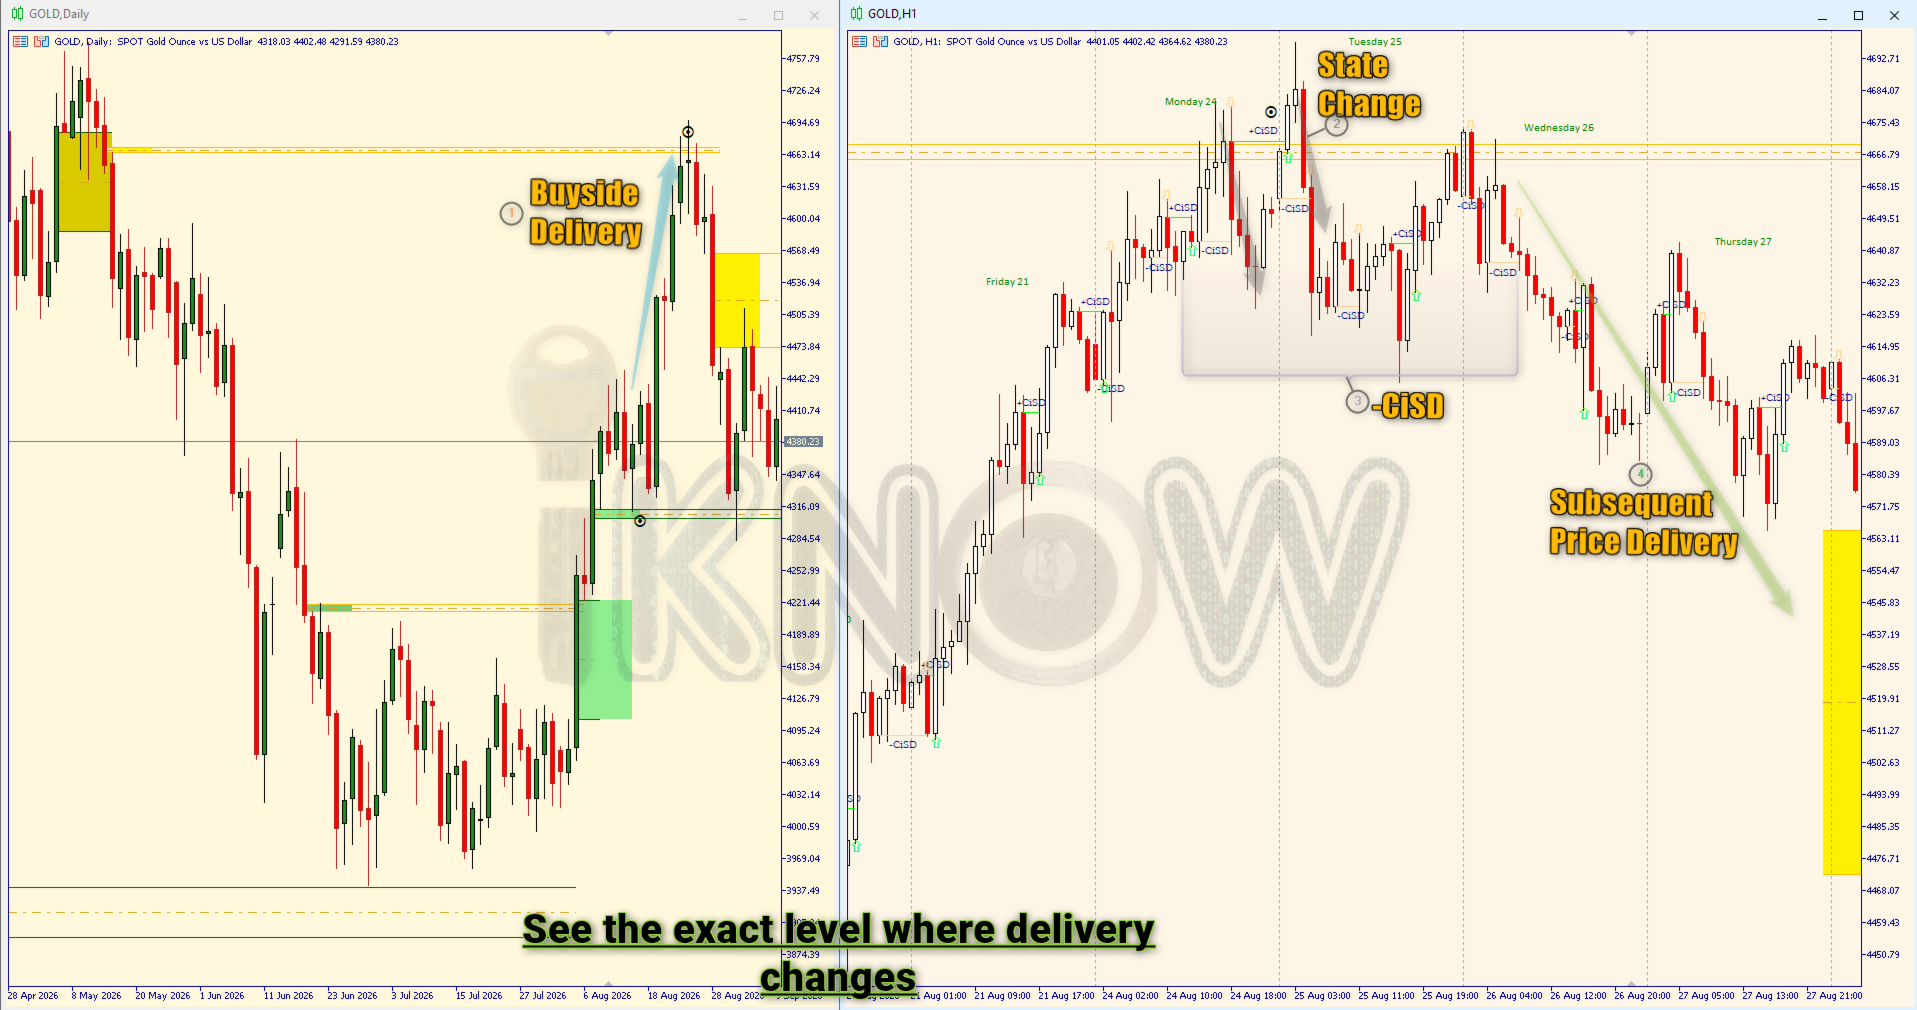
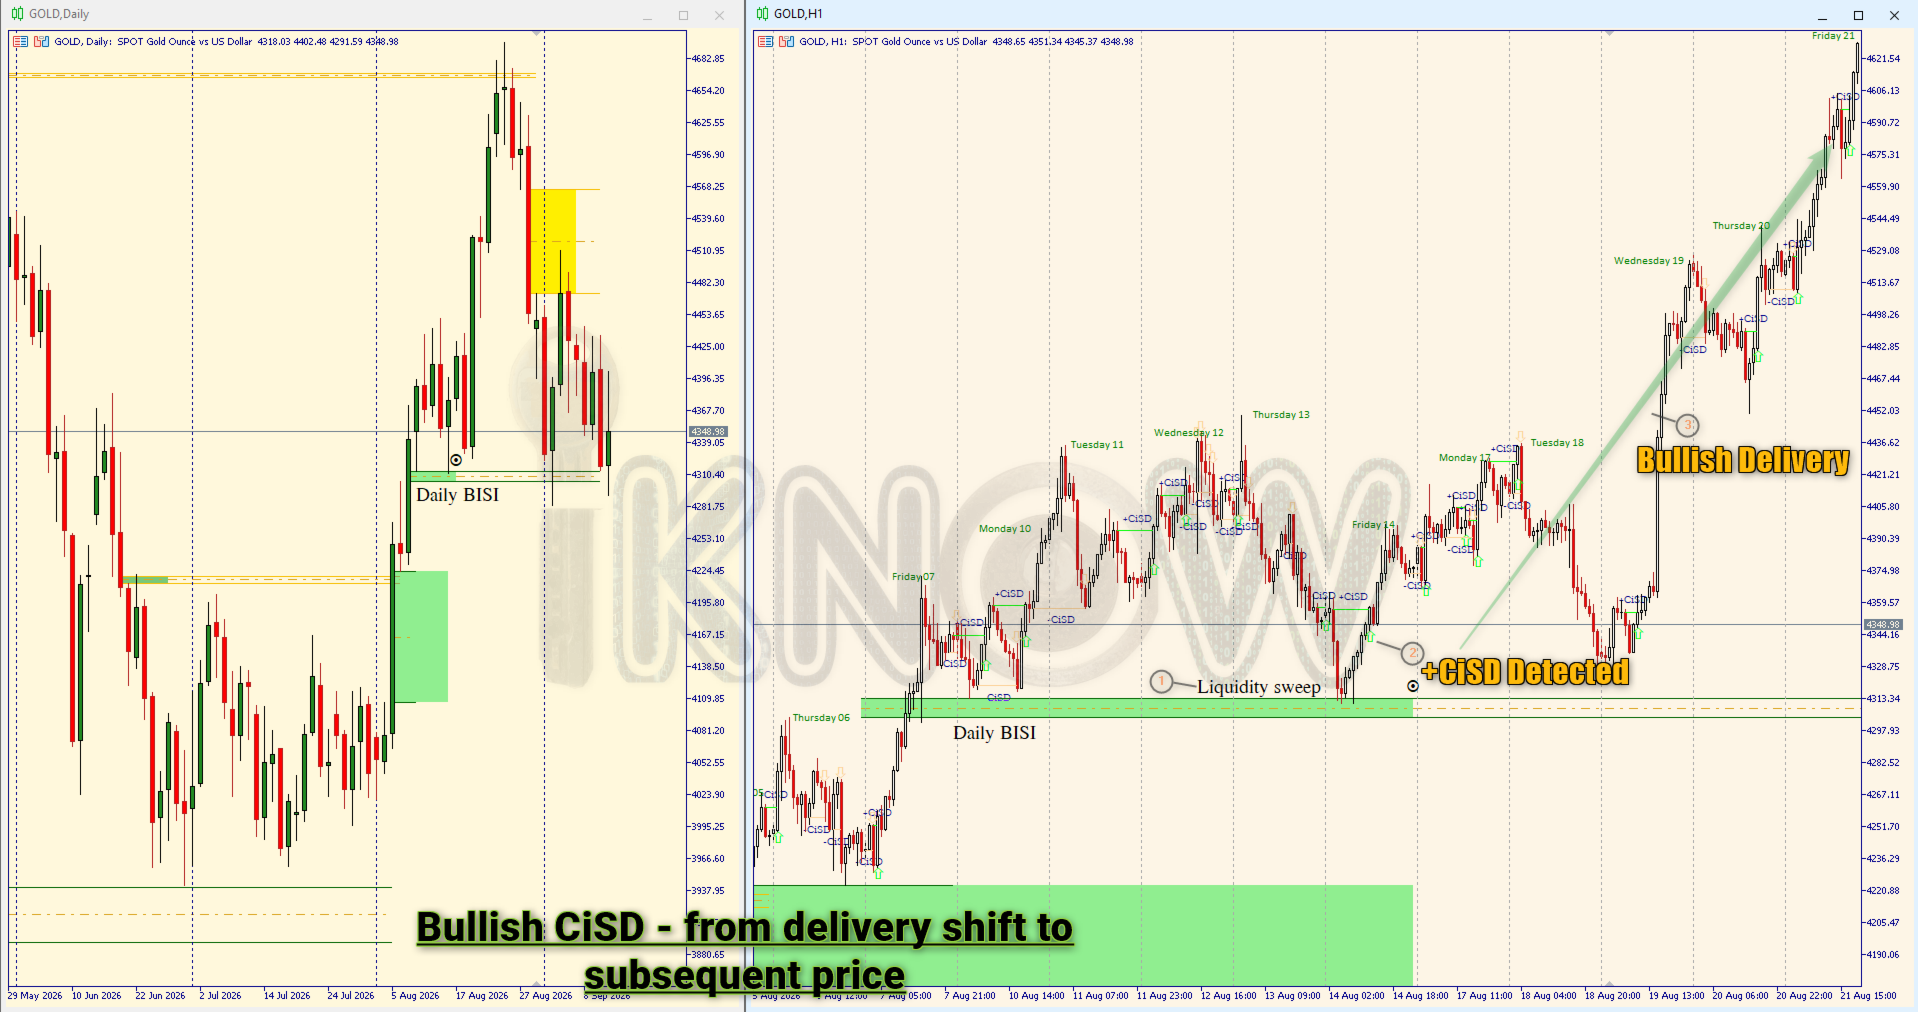
See exactly where price delivery changes direction.

CiSD automatically detects Change in State Delivery and plots the critical price associated with the shift - giving ICT/SMC traders a precise reference level without manually searching through candle sequences.

DETECT → MARK → CONFIRM → ANALYZE

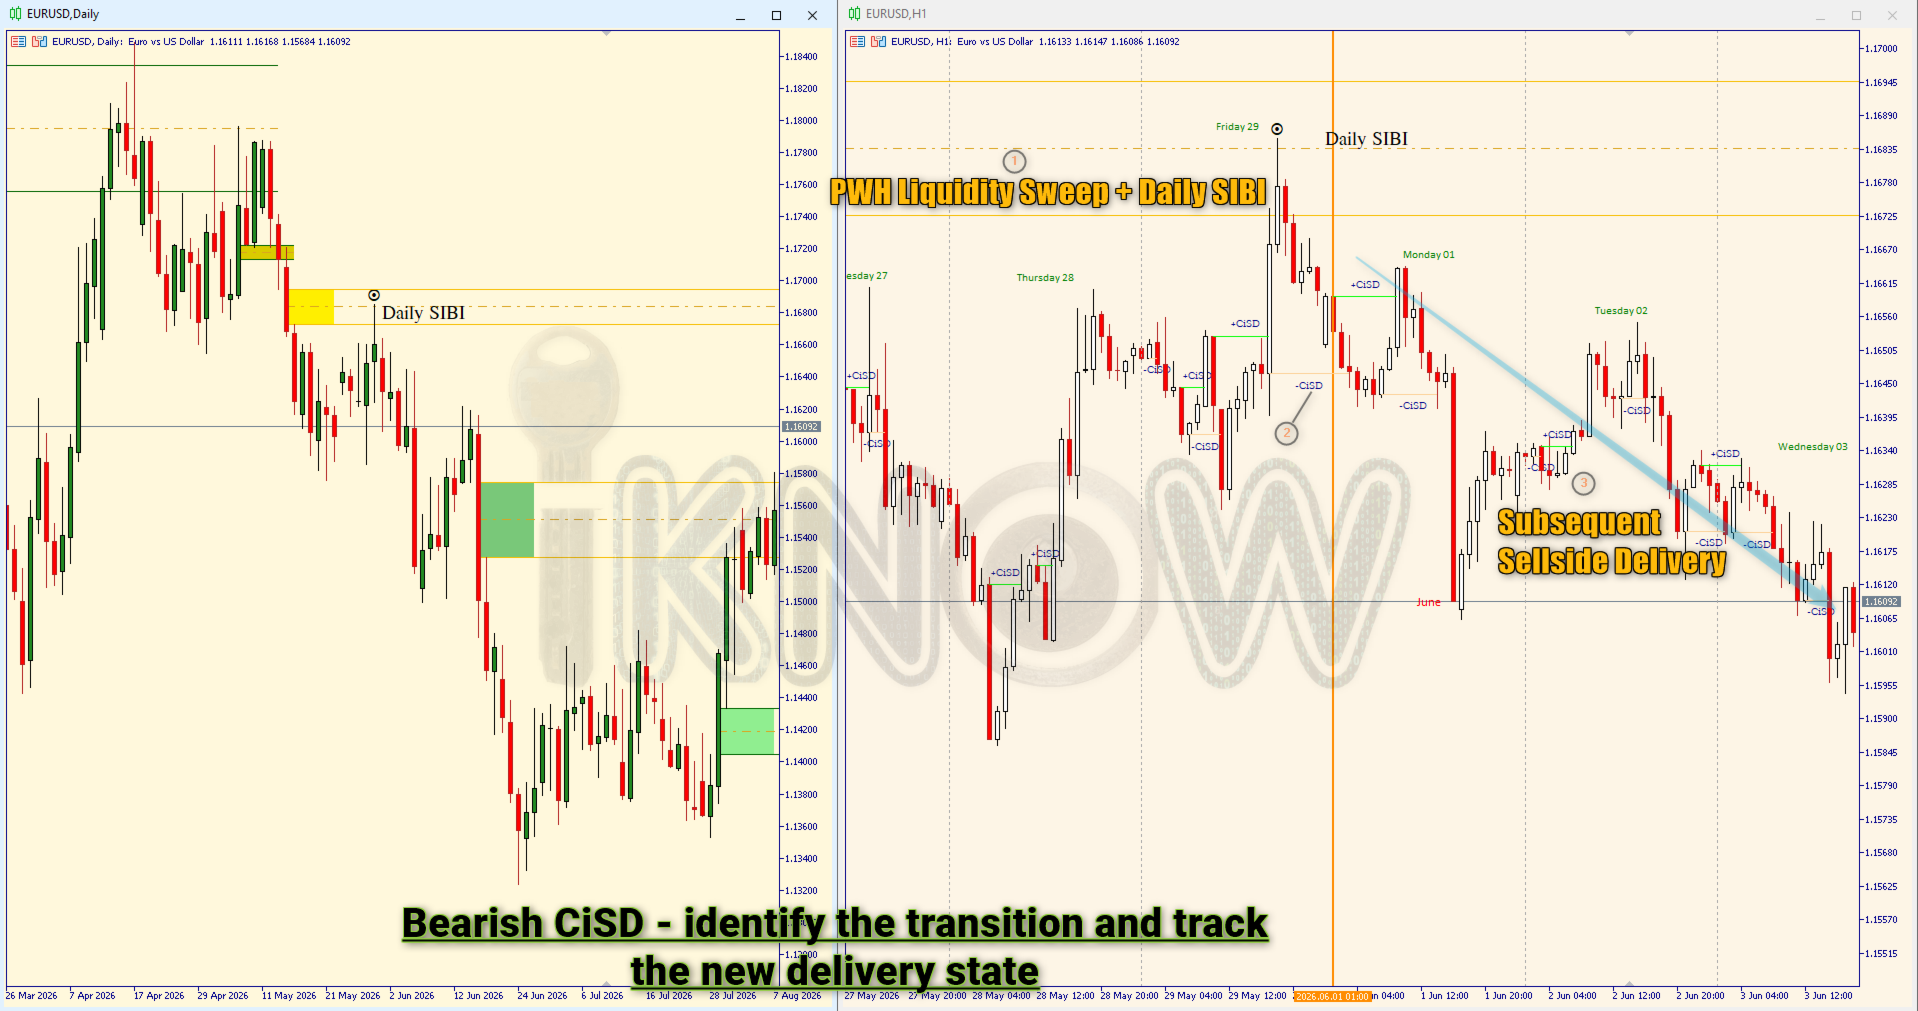
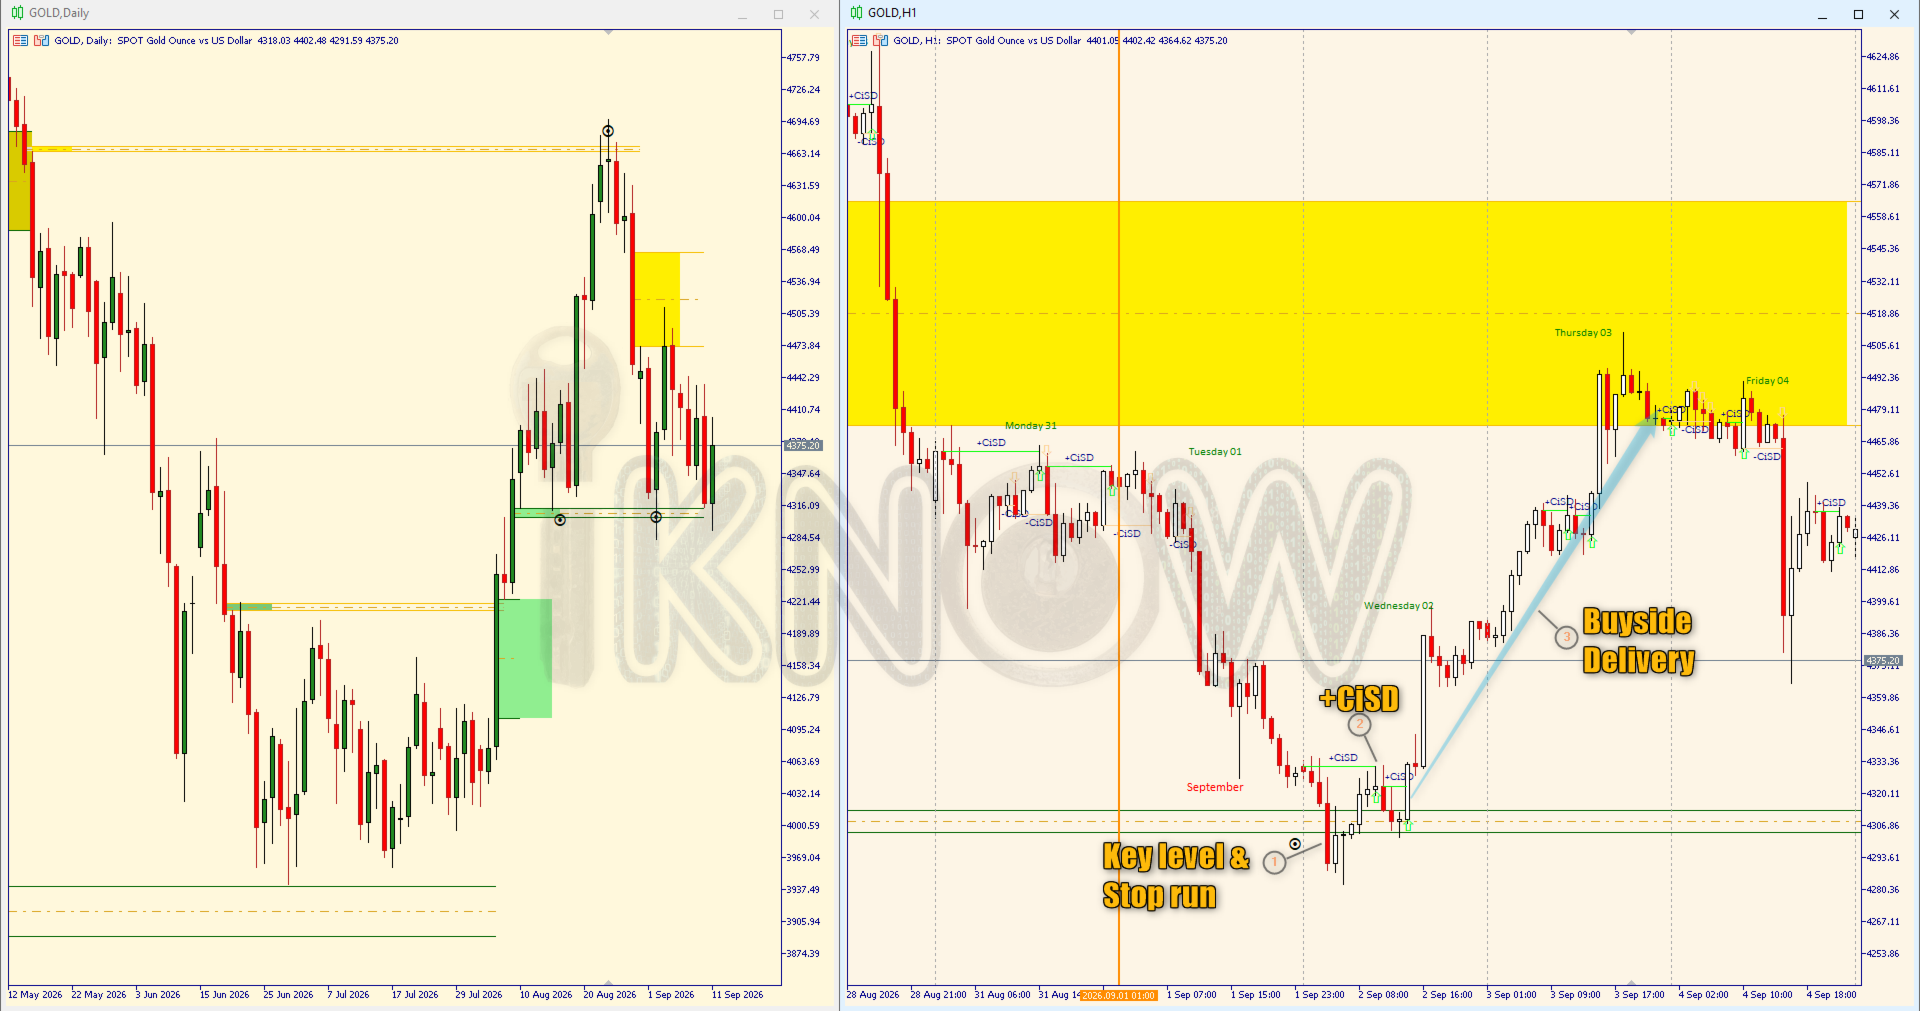
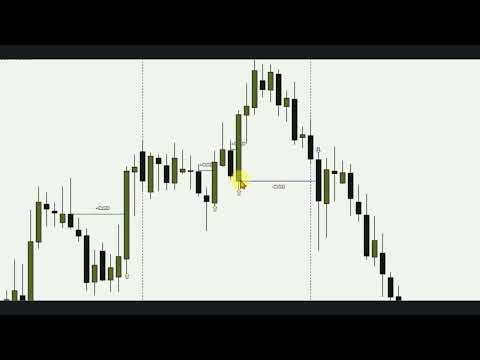
Figure 1: See the exact level where the delivery state changes.

CiSD is designed for traders who use liquidity, displacement, market structure, FVGs/Imbalances and premium/discount Arrays as part of their analysis.

Instead of manually identifying every delivery-state transition and marking the originating price, CiSD does the repetitive chart work for you.

The objective isn't to give you another buy/sell arrow. It's to show you the level where the delivery state changed.

What CiSD Gives You

🎯 Precise CiSD Levels

Automatically identifies and plots the relevant opening price associated with the Change in State Delivery.

↔ Bullish & Bearish State Changes.

Clearly distinguish transitions toward bullish or bearish delivery.

📍 Persistent Chart Reference

Keep the CiSD levels visible so you can study subsequent price action around the originating level.

📚 Historical Analysis

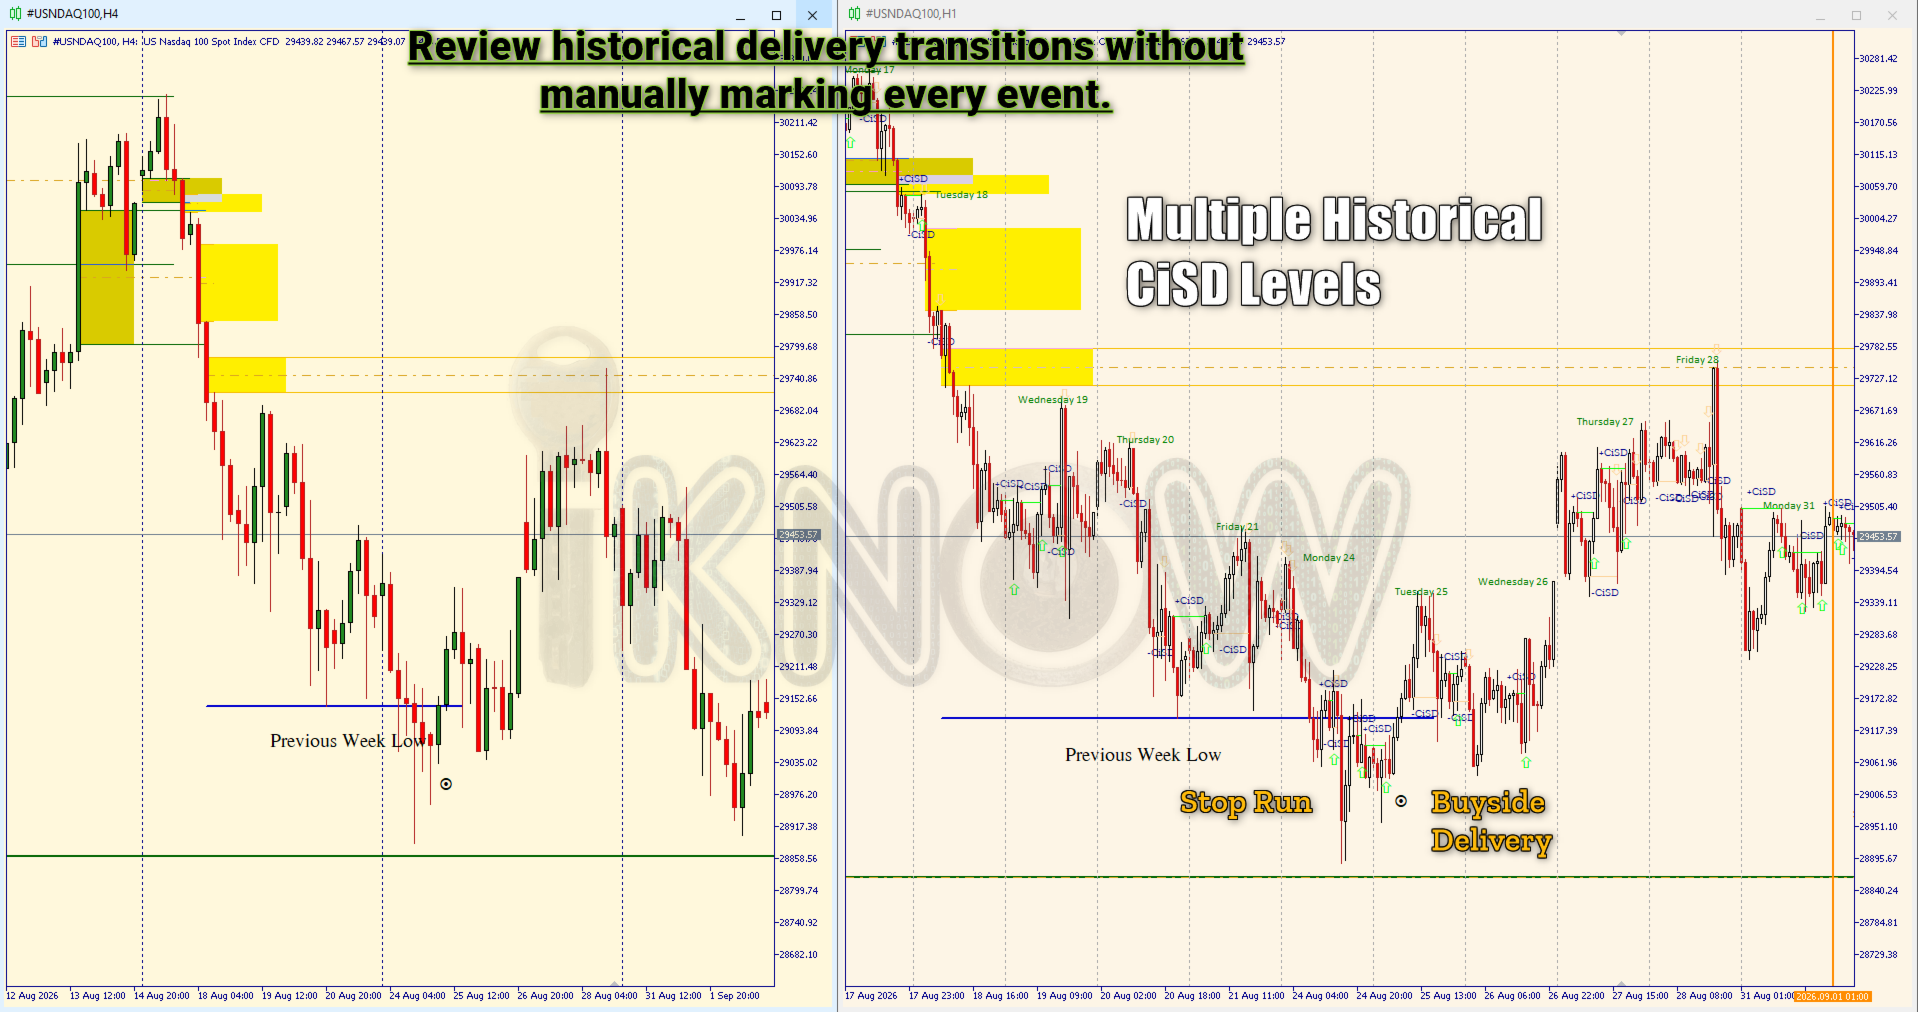
Review previous CiSD events directly on the chart instead of manually reconstructing historical examples.

🤖 Automated Detection

Continuously monitor price action for qualifying CiSD events while you focus on market interpretation.

⏱ Time-Saving Workflow

Reduce repetitive chart marking and focus your attention on context, confirmation and execution.


How It Works

01

Price Delivers

Price is delivering toward liquidity or inefficiency in one direction.

02

Delivery Changes

Price action satisfies the conditions defining a Change in State Delivery.

03

CiSD Is Identified

The indicator identifies the corresponding delivery transition.

04

Level Is Plotted.

The associated opening price is displayed directly on the chart

05

You Analyze the Context

Evaluate Continuation, Retracement, Liquidity targets, FVG/Imbalance interaction, Structure and invalidation.


How It Works

Why Traders Use CiSD

Manual CiSD analysis can require repeatedly:
Watch candles → identify the transition → located the correct candle →find its opening price → monitor price → repeat.
CiSD automates that repetitive process.

Instead of asking:

"Where exactly did the delivery change?"

You can immediately see:

"This is the CiSD level. Now what is price doing around it?"

That makes the tool useful for both live analysis and historical chart study.


Manual analysis vs. CiSD Automation?

Spend less time maintaining your chart and more time interpreting price action — no more drawing lines and second-guessing whether a true state change occurred.

Manual Process

  1. Watch candle sequences continuously.
  2. Identify delivery state transition
  3. Locate the specific initiating candle
  4. Manually draw line at opening price
  5. Monitor interaction and repeat

The CiSD Workflow

  1. Monitor: Indicator tracks algorithm behaviour
  2. Detect: Instant shift identification
  3. Mark:Automatic level plotting
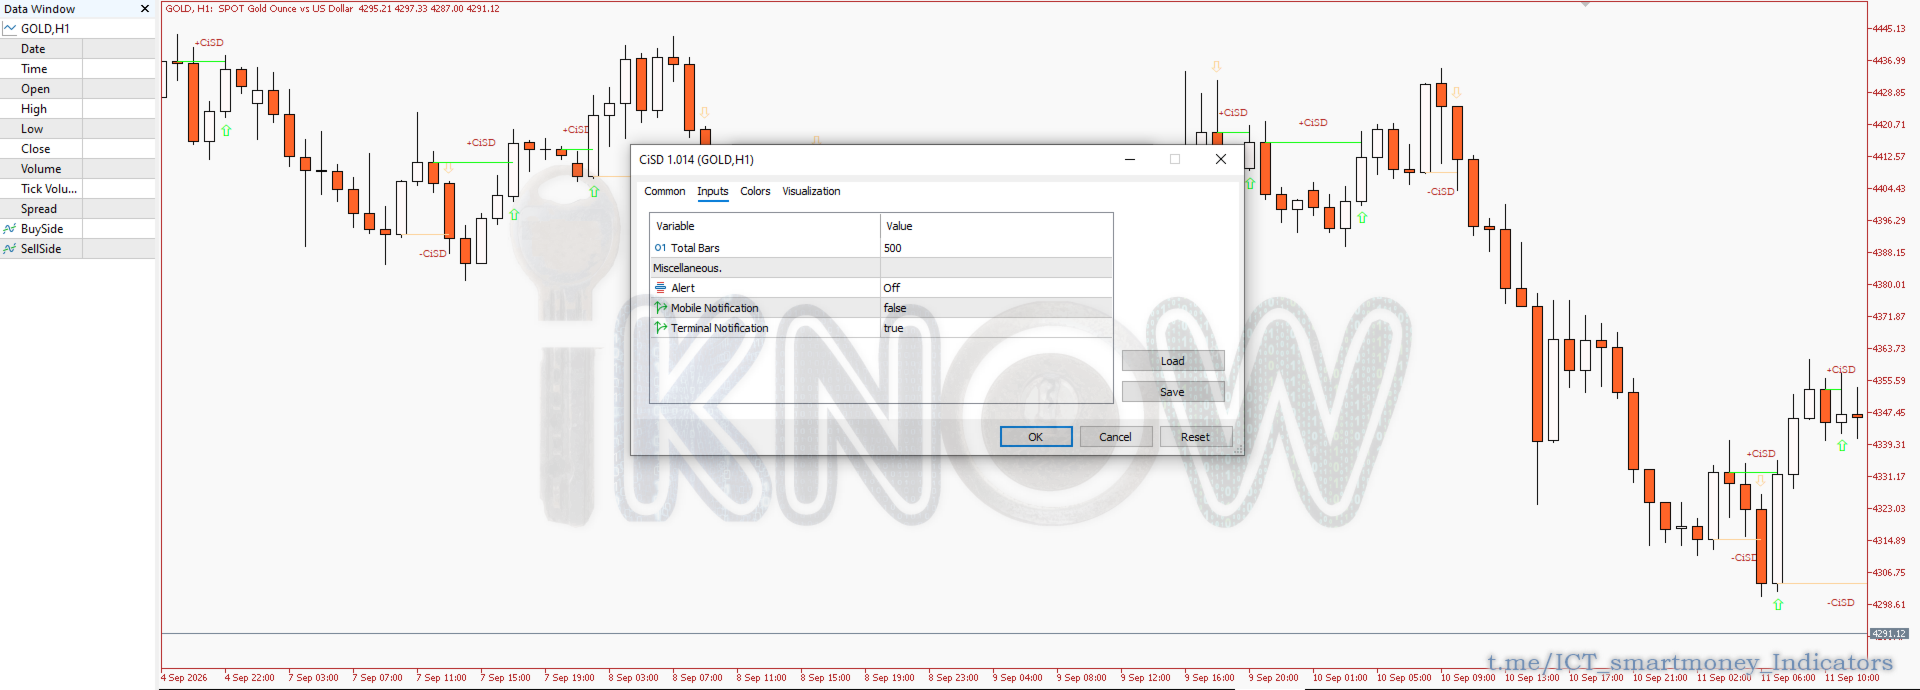
  4. Alert: Terminal & mobile notifications
  5. Analyze: Focus purely on trade execution

How to Trade with CiSD Levels

  1. Price Delivers: Price moves toward liquidity in a single direction.
  2. State Shifts: Candle conditions satisfy a CiSD transition.
  3. Level Plotted: The exact opening price level is locked onto the chart.
  4. Execution Analysis: Evaluate price action around the level for continuation setups, retracement entries, or invalidation.

Built for Traders who Already Understand the Framework

CiSD is intended for traders already familiar with concepts such as:

Change in State Delivery Buyside/Sellside Liquidity Displacement PD Arrays Fair Value Gaps/Imbalance. Market Structure Liquidity Sweeps

Already familiar with CiSD?

Go directly to the demo and verify the indicator's output on your own charts.

New to CiSD?

Learn the underlying ICT concept first. The indicator is an analysis tool, not a substitute for understanding the methodology.

CiSD does not replace your model - it adds the missing timing trigger.


Understanding Change in State Delivery

The Change in State delivery (CiSD) is a microstructure indicator that identifies critical pivotal points where the market (Price delivery Algorithm) shifts its directional focus from seeking liquidity on one side of the market to the other. Specifically, it signals a transition from buyside-driven liquidity to sellside-driven liquidity. CiSD marks the precise opening price that signals  a fundamental change in market structure and delivery direction.

What is State Delivery?

State delivery refers to the Market algorithm's active pursuit of liquidity pools and price inefficiencies. The market operates in two distinct delivery states:

  • Bullish State Delivery: Actively seeking Buyside liquidity (buystops, sell limits above highs) and premium inefficiencies.
  • Bearish State Delivery: Actively seeking Sellside Liquidity (sellstops, buy limits below lows) and discount inefficiencies.

What is a Change in State Delivery (CiSD)?

A CiSD occurs when price transitions from one delivery directive to the opposite:

  • Bullish to Bearish: Price stops seeking buyside liquidity and pivots to target sellside liquidity.
  • Bearish to Bullish: Price stops seeking sellside liquidity and pivots to target buyside liquidity.

The CiSD opening price is the specific candle open that initiates this directional shift. This level becomes a critical reference point as it marks where the market's intent changed, establishing a new delivery bias.


Key Components/Features

  1. CiSD Opening Price
  2. The opening price of the candle that triggers the change in state delivery. This price level acts as:

    • A pivot point for the new directional bias
    • A potential invalidation level for the current delivery state
    • A reference for measuring premium/discount zones

  3. Delivery Direction
  4. Once a CiSD is identified, the indicator determines the new market directive:

    • Bullish CiSD: Market now seeks premium inefficiencies and/or Buyside liquidity
    • Bearish CiSD: Market now seeks discount inefficiencies and/or Sellside liquidity

  5. Target Zones
  6. Based on the CiSD, the market will now pursue:

    • Premium Inefficiencies: Fair Value Gaps (FVG), imbalances, and unfilled orders above current price
    • Discount Inefficiencies: Fair Value Gaps (FVG), imbalances, and unfilled orders below current price
    • Liquidity Pools: Buyside (above) or Sellside (below) concentrations
    • Combination Targets: Both inefficiencies and liquidity on the same side

Features

The indicator displays:

  1. CiSD Level Line: Horizontal line at the opening price where state change occurred.
  2. Directional Arrow: Visual indicator showing new delivery direction.
  3. Color Coding:
    • -Bullish CiSD: Blue/Green tones
    • -Bearish CiSD: Red/Orange tones
  4. Label: Text showing "CiSD" with timestamp and price level

Pricing

Rent it to try CiSD in live market conditions, or buy once and keep it.

Monthly

$40
per month

Lower initial commitment for traders who want to test the product over a shorter period.

Best value

Lifetime

$100
one-time purchase

Own the current product permanently instead of paying a recurring monthly fee.

A free demo is available so you can verify the indicator's behaviour on your charts before purchasing.


Frequently Asked Questions

  • What is CiSD?
  • CiSD (Change in State Delivery) identifies a transition from one directional delivery state to the opposite state, according to the indicator's defined methodology.
  • How does CiSD work?
  • CiSD monitors price action for a change in delivery state. When the conditions are met, it marks the opening price of the candle that initiated the transition and indicates the new delivery direction.

  • Is CiSD a buy/sell signal?
  • No, CiSD is primarily a market-analysis reference. Evaluate a CiSD event alongside liquidity, market structure, displacement, FVGs/imbalance, and your own execution model.
  • Does CiSD predict reversals?
  • No. A CiSD identifies a change in delivery according to its rules. It does not guarantee that price will reverse or continue in a particular direction.
  • Can I use CiSD with ICT/SMC concepts?
  • Yes. It's designed to complement workflows involving liquidity, displacement, FVGs/imbalance, market structure, and PD arrays.
  • Can I use it for historical analysis?
  • Yes. You can display historical CiSD events so traders can study previous delivery transitions and subsequent price action.
  • Does it work on all timeframes?
  • Yes. CiSD is designed to work across all timeframes.
  • Does the indicator repaint?
  • No. The indicator does not repaint.
  • Which Markets does it work on?
  • CiSD works across various financial markets, including forex, stocks, and futures.
  • Which timeframes?
  • It works on all timeframes.
  • Can I use the demo before buying?
  • Yes. The demo lets you verify the indicator's behaviour on your own charts before purchasing.
  • I think the indicator generated an incorrect CiSD. What should I do?
  • Please provide the following:
    • Chart screenshot
    • Symbol
    • Timeframe
    • Date/Time
    • Relevant candles
    • Expected result
    • Methodology/Reference used

    This allows the result to be investigated properly.


    Glossary of Terms

    • Liquidity: Areas where large numbers of pending orders are concentrated (typically above/below key price levels).
    • Buyside Liquidity: Concentration of buy-stop orders above current price (targets for bearish moves).
    • Sellside Liquidity: Concentration of sell-stop orders below current price (targets for bullish moves).
    • State Delivery: The market's current directional focus in seeking liquidity pools.
    • Premium Zone: Price area above a reference level (generally considered "expensive").
    • Discount Zone: Price area below a reference level (generally considered "cheap").
    • Inefficiency: Price imbalances or gaps where one-directional order flow dominated, leaving unfilled orders.

    ⚠️ Risk Disclaimer

    This indicator is a tool for market analysis and does not guarantee trading profits. Past performance does not indicate future results. Trading forex, stocks, and other financial instruments involves significant risk of loss and is not suitable for all investors. Always use proper risk management and never risk more than you can afford to lose. You should carefully consider your investment objectives, level of experience, and risk appetite before making any trading decisions.
    Recommended products
    Alpha Trend sign has been a very popular trading tool in our company for a long time. It can verify our trading system and clearly indicate trading signals, and the signals will not drift. Main functions: Based on the market display of active areas, indicators can be used to intuitively determine whether the current market trend belongs to a trend market or a volatile market. And enter the market according to the indicator arrows, with green arrows indicating buy and red arrows indicating se
    Auto Fibo Pro m
    DMITRII GRIDASOV
    "Auto FIBO Pro"   Crypto_Forex  indicator  - is great auxiliary tool in trading! Indicator automatically calculate and place on chart Fibo levels and local trend lines (red color). Fibonacci levels indicate key areas where price can reverse. Most important levels are 23.6%, 38.2%, 50% and 61.8%. You can use it   for reversal scalping  or for zone grid trading. There are plenty of opportunities to  improve your current system using Auto FIBO Pro indicator as well. It has Info Spread Swap Displa
    Happy Scalping Indicator
    Leandro Bernardez Camero
    This indicator was designed for aggressive scalping and quick entries in binary options , generating signals on every candle , so you can know exactly what is happening at all times. Join the Happy Scalping channel: MQL5 It does not repaint : the current candle's signal is generated in REAL TIME , which means it may change while the candle is still forming, depending on whether the price rises or falls compared to the previous candle's close. But once the candle closes , the signal color becom
    Price Magnet — Price Density and Attraction Levels Indicator Price Magnet is a professional analytical tool designed to identify key support and resistance levels based on statistical Price Density. The indicator analyzes a specified historical period and detects price levels where the market spent the most time. These zones act as “magnets,” attracting price action or forming a structural base for potential reversals. Unlike traditional Volume Profile tools, Price Magnet focuses on price-time d
    Binary Options Support Resistance Indicator This indicator is designed for binary options trading and effectively shows retracements from support and resistance levels. Signals appear on the current candle. A red arrow pointing downwards indicates a potential selling opportunity, while a blue arrow pointing upwards suggests buying opportunities. All that needs adjustment is the color of the signal arrows. It is recommended to use it on the M1-M5 timeframes as signals are frequent on these timef
    Line Magnit
    Aleksey Trenin
    The LineMagnit Indicator for MT4 is a highly precise tool that builds support and resistance levels which magnetically attract prices. This feature allows traders to easily determine the most probable entry and exit points in the market, as well as identify the market's directional forces, as levels are based on capital inflows into the instrument. Equipped with an intuitively understandable graphical interface, the LineMagnit Indicator enables users to quickly locate and analyze support and res
    Trend PA
    Mikhail Nazarenko
    5 (3)
    The Trend PA indicator uses   Price Action   and its own filtering algorithm to determine the trend. This approach helps to accurately determine entry points and the current trend on any timeframe. The indicator uses its own algorithm for analyzing price changes and Price Action. Which gives you the advantage of recognizing, without delay, a new nascent trend with fewer false positives. Trend filtering conditions can be selected in the settings individually for your trading style. The indicator
    The Th3Eng PipFinite indicator is based on a very excellent analysis of the right trend direction with perfect custom algorithms. It show the true direction and the best point to start trading. With StopLoss point and Three Take Profit points. Also it show the right pivot of the price and small points to order to replace the dynamic support and resistance channel, Which surrounds the price. And Finally it draws a very helpful Box on the left side on the chart includes (take profits and Stop loss
    Crypto_Forex Indicator "MFI FLAT Detector" - is an efficient auxiliary tool in trading! No Repaint. I offer you to upgrade your trading methods with this great indicator for MT4. - Indicator shows price Flat areas on the chart. It has "Flat sensitivity" parameter - which is responsible for flat detection. - "MFI FLAT Detector" is very useful for divergence detection and it is great to combine with Price Action as well. - You can use it for trend following systems to detect flat zones and avoid
    The King of Forex Trend Cloud Indicator is a trend following indicator based on moving averages. The Indicator is meant to Capture both the beginning and the end of a trend. This indicator can be used to predict both short and long terms market trends.  The king of Forex Trend Cloud if paired together with the King of Forex Trend Indicator can give a broad picture in market analysis and forecasts. I have attached images for both the  The king of Forex Trend Cloud on its own and  The king of Fore
    Indicador Taurus All4
    Fabio Oliveira Magalhaes
    Taurus All4 Taurus All4 is a high-performance indicator, it will tell you the strength of the trend, and you will be able to observe the strength of the candle. Our indicator has more than 4 trend confirmations. It is very simple and easy to use. Confirmation Modes Candle Trend Confirmations: When the candle switches to light green the trend is high. When the candle switches to light red the trend is reverting down. When the candle changes to dark red the trend is low. Trendline Trend Confirm

    Night ghost
    Dmitriy Kashevich
    Night Ghost - Arrow indicator for binary options. This is a reliable assistant to you in the future! - No redrawing on the chart -Works great on EUR/USD currency pairs! -Indicator accuracy up to 90% (Especially at night) -No long setup required (Perfectly set up for Binary Options) - Not late signals - The appearance of a signal on the current candle -Perfect for M1 period (No More!) - Eye-friendly candle color (Red and Blue) -Installed Alert Working with it: - Blue arrow shows signa
    Robot scalper for M5 timeframe. Trades on the GBPUSD currency pair. This robot has been specially developed by a company of professional traders for trading in the pound sterling. The robot approximately opens 5 to 15 trades every day. It is best to trade with brokers that have a low spread on GBPUSD up to 10 pips. The recommended minimum deposit to start is $500 or more. Advantages: does not use martingale. not a net. every trade has a stop loss. professional bot specifically for the GBPUSD p
    Money Flow Profile MT5 HERE   Here   our more valuable tools SMC Trend Trading   ,  Easy SMC Trading  ,  Institutional SMC Architect Volume Analysis Tools  ,  Volume flow Profile  ,  Market volume profile  , FVG with Volume  , Liquidity Heatmap Profile  ,  Volume Spread Analysis This Master Edition is engineered for clarity and speed, featuring a unique Auto-Theme Sync system that instantly beautifies your chart layout upon loading. Key Features: True Money Flow Calculation: Goes beyond stand
    Chart Patterns Detect 15 patterns (Ascending Triangle, Descending Triangle, Rising Wedge, Falling Wedge, Bullish Flag, Bearish Flag, Bullish Rectangle, Bearish Rectangle Symmetrical triangle, Head and Shoulders, Inverted Head and Shoulders, Triple top, Triple Bottom, Double Top, Double Bottom) Use historical data to calculate the probability of each pattern to succeed (possibility to filter notification according to the chance of success) gives graphic indication about the invalidation level and
    Heiken Ashi Smoothed Strategy is a very simple but powerful system to get forex market trend direction. This indicator is actually 2 indicators in 1 pack, Heiken Ashi and Heiken Ashi Smoothed Moving Average both included. Because HA (Heiken Ashi) and HAS (Heiken Ashi Smoothed) are calculated in the same one system event with necessary buffers and loop only, so it is the FAST, OPTIMIZED and EFFICIENT HA having the combined indicator of MetaTrader 4. You can choose to display HA and HAS in the sam
    VR Cub
    Vladimir Pastushak
    VR Cub is an indicator for getting high-quality entry points. The indicator was developed to facilitate mathematical calculations and simplify the search for entry points into a position. The trading strategy for which the indicator was written has been proving its effectiveness for many years. The simplicity of the trading strategy is its great advantage, which allows even novice traders to successfully trade with it. VR Cub calculates position opening points and Take Profit and Stop Loss targe
    Introduction It is common practice for professional trades to hide their stop loss / take profit from their brokers. Either from keeping their strategy to the themselves or from the fear that their broker works against them. Using this indicator, the stop loss / take profit points will be drawn on the product chart using the bid price. So, you can see exactly when the price is hit and close it manually.  Usage Once attached to the chart, the indicator scans the open orders to attach lines for t
    Crosskalp1
    Mikhail Bilan
    Добрый День уважаемые трейдеры!  Вашему вниманию индикатор созданный и работающий на базе трендовика ADX,  для торговли на смене направления движения который учитывает коррекцию и даёт возможность на ней заработать.  Применяю этот индикатор для скальпинга. Рекомендую таймфреймы от 15 ти минутного(М15) до часового (Н1) периодов.  Красный кружок сигнал на продажу- Sell) Зелёный кружок  сигнал на покупку Buy) Чем меньше ваш таймфрейм тем меньше пунктов вы зарабатываете.   Важно выставлять стопы! !В
    Volume Profile Sniper v11.1 is a comprehensive market analysis tool A professional approach to trading Volume Profile Sniper v11.1 combines more than 15 key filters in one indicator, providing clear signals based on a comprehensive assessment of the market situation. Main features Volume imbalance analysis – the algorithm calculates the share of buyers and sellers in each candle, signaling the predominance of one of the parties (configurable threshold from 50% to 90%). Multilevel signal filte
    Infinity Trend Pro
    Yaroslav Varankin
    1 (1)
    This is a trend indicator without redrawing Developed instead of the binary options strategy (by the color of the Martingale candlestick) Also works well in forex trading When to open trades (binary options) A signal will appear in the place with a candle signaling the current candle It is recommended to open a deal for one candle of the current timeframe M1 and M5 When a blue dot appears, open a deal up When a red dot appears, open a trade down. How to open trades on Forex. When a signal is rec
    Trend Ray
    Andriy Sydoruk
    The indicator shows the potential trend direction by cyclical-wave dependence. Thus, all the rays of the intersection will be optimal rays, in the direction of which the price is expected to move, taking into account the indicator period. Rays can be used as a direction for potential market movement. But we must not forget that the approach must be comprehensive, the indicator signals require additional information to enter the market.
    Crypto_Forex Indicator "Hammer and Shooting Star pattern" for MT4, No repaint, No delay. - Indicator "Hammer and Shooting Star pattern" is very powerful indicator for Price Action trading. - Indicator detects bullish Hammer and bearish Shooting Star patterns on chart: - Bullish Hammer - Blue arrow signal on chart (see pictures). - Bearish Shooting Star - Red arrow signal on chart (see pictures). - With PC, Mobile & Email alerts. - Indicator "Hammer and Shooting Star pattern" is excellent to com
    Reversal Edge System is a professional top-bottom reversal indicator built for MetaTrader 5. It identifies potential trend reversal zones and generates clear trade signals, filtered by multi-timeframe trend analysis to reduce false setups. The indicator displays market sentiment in real time: Strong Bullish Strong Bearish Bullish Bias Bearish Bias Bull-Bear Divergence Each signal comes with predefined Take Profit and Stop Loss levels for proper risk management. It includes signal backtest functi
    [ZhiBiCCI] indicators are suitable for all cycle use, and are also suitable for all market varieties. [ZhiBiCCI] Green solid line is a reversal of bullish divergence. The green dotted line is a classic bullish divergence. [ZhiBiCCI] The solid line to the red is a reverse bearish divergence. The red dotted line is a classical bearish divergence. [ZhiBiCCI] can be set in the parameters (Alert, Send mail, Send notification), set to (true) to send instant signals to the alarm window, email, insta
    Trend Oscillator - is an advanced custom  Crypto_Forex indicator, efficient trading tool! Advanced new calculation method is used - 20 options for parameter "Price for calculation". Smoothest oscillator ever developed. Green color for upward trends,  Red color for downward trends. Oversold values: below 5, O verbought values: over 95. There are plenty of opportunities to upgrade even standard strategies with this indicator. With PC and Mobile alerts. Click here to see high quality Trading Robot
    VWAP Volume Price Customized Cycle FX-AIEA — Multi-Timeframe Anchored VWAP Indicator (Technical Features & Parameter Discussion) Overview This indicator extends the traditional VWAP (Volume Weighted Average Price) with multi-timeframe anchoring and customizable session reset mechanisms, aiming to provide a dynamic "fair value" reference area. The indicator constructs symmetric volatility boundaries via triple standard deviation channels (±1σ/±2σ/±3σ), which can serve as reference dynamic support
    Renko, Heiken Ashi, Ticks Bar, Range Bar.    Easy switching, easy setup, all in one window.        Place the Custom Chart indicator and view Renko, Heiken Ashi, Tick bar, Range bar charts in real time at real chart.    Position the offline chart window so that the indicator control panel is visible.    Switch the chart mode by click of a button.    Connect to the output chart any indicator, expert advisor without any restrictions.    No, it doesn't work in the tester.    Yes, you can use an
    Kalman Cone Forecast MT4 Adaptive forecast cone, trend pressure, and exhaustion detection in one clean trading panel. Kalman Cone Forecast is an adaptive predictive indicator for MetaTrader 4. It uses Kalman filter smoothing to reduce market noise, estimate current trend pressure, and project a forward price cone based on live volatility conditions. Instead of showing only a moving average line or a basic volatility band, Kalman Cone Forecast gives you a clearer answer to three important quest
    Spread and Close MT4
    Alexander Denisovich Jegorov
    Spread & Candle Close Timer Indicator for MT4  Optimize your trading with this lightweight and efficient indicator, designed to display the real-time spread and candle close countdown directly on your MT4 chart. Features: Live Spread Monitoring – Instantly see market conditions. Candle Close Timer – Stay prepared for the next price movement. Simple & Non-Intrusive Design – No unnecessary settings, just clear and accurate data. Ideal for scalpers, day traders, and those who need real-time exec
    Buyers of this product also purchase
    Trend SniperX MT4
    Sarvarbek Abduvoxobov
    5 (5)
    Trend Sniper X is a multi-timeframe trend-following indicator for MetaTrader 5 that helps traders identify trend direction and potential reversal points with clarity and precision. For MT5: https://www.mql5.com/en/market/product/181101 Price Information: The current price is promotional and is subject to change as upcoming updates and new features are released. Code2Profit Channel Master the Market with Multi-Timeframe Analysis! How to Maximize Your Win Rate with Trend Sniper X: Key Rules & Sess
    SR Liquidity
    Oleg Rodin
    5 (2)
    SR Liquidity is a trading indicator designed to reveal the hidden zones where market liquidity concentrates and price reacts most strongly. These special liquidity areas act as powerful support and resistance levels, giving you a clear map of where the market is most likely to reverse. Instead of drawing ordinary Support/Resistance lines, SR Liquidity analyzes real price behavior to detect the zones where buying and selling pressure accumulate. These are actually the pools of liquidity that driv
    Super Signal – Skyblade Edition Professional No-Repaint / No-Lag Trend Signal System with Exceptional Win Rate | For MT4 / MT5 It works best on lower timeframes, such as 1-minute, 5-minute, and 15-minute charts. Core Features: Super Signal – Skyblade Edition is a smart signal system designed specifically for trend trading. It applies a multi-layered confirmation mechanism to detect only strong, directional moves supported by real momentum. This system does not attempt to predict tops or bottoms
    Trend Lines PRO
    Roman Podpora
    5 (1)
    TREND LINES PRO    helps understand where the market is truly changing direction. The indicator shows real trend reversals and points where major players re-enter. You see   BOS lines   Trend changes and key levels on higher timeframes — without complex settings or unnecessary noise. Signals don't repaint and remain on the chart after the bar closes. VERSION MT 5     -     Reveals its maximum potential when paired with the   RFI LEVELS PRO  indicator What the indicator shows: Real shifts   tren
    M1 Sniper
    Oleg Rodin
    4.97 (30)
    M1 SNIPER  is an easy to use trading indicator system. It is an arrow indicator which is designed for M1 time frame. The indicator can be used as a standalone system for scalping on M1 time frame and it can be used as a part of your existing trading system. Though this trading system was designed specifically for short-term trading, it still can be helpful for all traders. This trading system can be used with any forex pair and time frame, though lower time frames are recommended from M1 up to M
    PRO Renko System
    Oleg Rodin
    5 (31)
    PRO Renko System is a highly accurate trading system specially designed for trading RENKO charts. The ARROWS and Trend Indicators DO NOT REPAINT! The system effectively neutralizes so called market noise giving you access to accurate reversal signals. The indicator is very easy to use and has only one parameter responsible for signal generation. You can easily adapt the tool to any trading instrument of your choice and the size of the renko bar. I am always ready to provide extra support to help
    Currency Strength Wizard is a very powerful indicator that provides you with all-in-one solution for successful trading. The indicator calculates the power of this or that forex pair using the data of all currencies on multiple time frames. This data is represented in a form of easy to use currency index and currency power lines which you can use to see the power of this or that currency. All you need is attach the indicator to the chart you want to trade and the indicator will show you real str
    Scalper Vault
    Oleg Rodin
    5 (40)
    Scalper Vault is a powerful, fully-equipped trading system designed for traders who want to achieve consistency in intraday trading . This high-precision indicator serves as a complete, standalone trading system that delivers institutional-grade analysis for both Forex and Binary Options traders. PLEASE CONTACT ME AFTER PURCHASE TO GET MY TRADING TIPS PLUS A GREAT BONUS! By eliminating the guesswork and complex manual analysis, Scalper Vault allows you to focus purely on execution using easy t
    Currency Strength Exotics
    Bernhard Schweigert
    4.88 (33)
    CURRENTLY 20% OFF ! Best Solution for any Newbie or Expert Trader! This Indicator is specialized to show currency strength for any symbols like Exotic Pairs Commodities, Indexes or Futures. Is first of its kind, any symbol can be added to the 9th line to show true currency strength of Gold, Silver, Oil, DAX, US30, MXN, TRY, CNH etc. This is a unique, high quality and affordable trading tool because we have incorporated a number of proprietary features and a new formula. Imagine how your trading
    Scalper Inside PRO
    Alexey Minkov
    4.74 (69)
    Scalper Inside PRO helps you read the intraday trend and plan a trade before you enter the market. It is built around three exclusive strategies for a sharper read of the market. The moment a signal appears, the indicator evaluates market direction and calculates the key levels, so you see the potential entry, the expected stop-loss and several profit-taking levels in advance. Detailed performance statistics show how different instruments and strategies performed in history and help you pick ass
    Miraculous Indicator Binary & Forex v3 StrategySafe Miraculous Indicator Binary & Forex v3 StrategySafe is a professional trading indicator designed for traders who want clear signals, powerful confirmation tools, and a structured way to analyze both Binary and Forex markets. This version brings a stronger trading experience with advanced dashboards, GANN Law analysis, Square of 9 levels, angle confirmation, and a clean StrategySafe approach that helps traders filter stronger setups instead of e
    "The Squeeze indicator attempts to identify periods of consolidation in a market. In general the market is either in a period of quiet consolidation or vertical price discovery. By identifying these calm periods, we have a better opportunity of getting into trades with the potential for larger moves. Once a market enters into a "squeeze," we watch the overall market momentum to help forecast the market direction and await a release of market energy." Modified TTM Squeeze Indicator is a modifica
    Gann Made Easy
    Oleg Rodin
    4.84 (172)
    Gann Made Easy is a professional and easy to use Forex trading system which is based on the best principles of trading using the theory of W.D. Gann. The indicator provides accurate BUY and SELL signals including Stop Loss and Take Profit levels. You can trade even on the go using PUSH notifications. PLEASE CONTACT ME AFTER PURCHASE TO GET TRADING  INSTRUCTIONS   AND GREAT EXTRA INDICATORS  FOR FREE! Probably you already heard about the Gann trading methods before. Usually the Gann theory is a
    All in One package includes the  Oscillator Predictor ,  MACD Predictor ,  Thrust Scanner  and  Advanced Fibonacci  indicators which are mandatory for applying  Dinapoli  trade plans.  Please visit below links for detailed explanations of indicators. Advanced Fibonacci Indicator =>  https://www.mql5.com/en/market/product/52834 Thrust Scanner Indicator => https://www.mql5.com/en/market/product/52830 Overbought /Oversold Predictor indicator => https://www.mql5.com/en/market/product/52621 Macd P
    GoldRush Trend Arrow Signal V1.6 The GoldRush Trend Arrow Signal indicator V1.6 continues to provide precise, real-time trend analysis tailored for high-speed, short-term scalpers in XAU/USD , but it now has additional features and improved efficiency and reliability. Built specifically for the 1-minute time frame, this tool displays directional arrows for clear entry points, allowing scalpers to navigate volatile market conditions with confidence. The indicator consists of PRIMARY and SECONDARY
    Neuro Poseidon MT4
    Daria Rezueva
    4.74 (46)
    Neuro Poseidon is a new indicator by Daria Rezueva. It combines precise trading signals with adaptive TP/SL levels - creating best possible trades as a result! Message me and get  Neuro Poseidon Assistant  as a gift to automize your trading process! What makes it stand out? 1. Proven profitability on all assets and timeframes 2. Only confirmed BUY and SELL signals present on the chart 3. Adaptive TP & SL levels generated by the software for each trade 4. Easy to understand - suitable for all
    PTS Precision Index Oscillator V2
    PrecisionTradingSystems
    5 (1)
    The Precision Index Oscillator (Pi-Osc) by Roger Medcalf of Precision Trading Systems First of all, if you have any questions please contact me via my website which you can find by searching the above title. Version 2 has been carefully recoded to be super fast to load up on your chart and some other technical improvements have been incorporated to enhance experience. Pi-Osc was created to provide accurate trade timing signals designed to find extreme   exhaustion points, the points that markets
    KURAMA GOLD SIGNAL PRO (MT4) — 7-Layer Filter, Auto TP/SL, Quality Score & Signal History Save | Complete XAUUSD Trading System No repaint in real time. The moment a signal appears, the arrow, entry, TP and SL are locked on the spot and never move afterward. What you trade is this real-time signal. And in v7.20, every signal that is actually sent is auto-saved and restored exactly after restart. BUYER BONUS Buy the lifetime license and receive AI Zone Radar (
    OrderFlow Absorption – Professional Delta & Absorption Signal Indicator for MT4 Unlock the power of true order flow analysis with   OrderFlow Absorption   – the ultimate delta histogram and absorption signal indicator for MetaTrader 4. Designed for traders who want to see what’s really happening behind every price move, this tool reveals hidden buy/sell pressure and absorption events that drive the market. Features Delta Histogram Visualization:   Instantly see buy and sell pressure with clear,
    Quantum Naked SMC Prime is a streamlined Smart Money Concepts indicator designed for traders who prefer a clean chart, structured market analysis and clear visual trade setups without unnecessary complexity. The indicator combines market structure, liquidity behavior, institutional zones and confirmation logic into a compact analytical framework. Instead of flooding the chart with technical indicators, Quantum Naked SMC Prime focuses on the core elements of price action and Smart Money Concepts
    PZ Divergence Trading
    PZ TRADING SLU
    5 (2)
    Unlock hidden profits: accurate divergence trading for all markets Tricky to find and scarce in frequency, divergences are one of the most reliable trading scenarios. This indicator finds and scans for regular and hidden divergences automatically using your favourite oscillator. [ Installation Guide | Update Guide | Troubleshooting | FAQ | All Products ] Easy to trade Finds regular and hidden divergences Supports many well known oscillators Implements trading signals based on breakouts Display
    Elliott Wave Trend was designed for the scientific wave counting. This tool focuses to get rid of the vagueness of the classic Elliott Wave Counting using the guideline from the template and pattern approach. In doing so, firstly Elliott Wave Trend offers the template for your wave counting. Secondly, it offers Wave Structural Score to assist to identify accurate wave formation. It offers both impulse wave Structural Score and corrective wave Structure Score. Structural Score is the rating to sh
    PZ Swing Trading
    PZ TRADING SLU
    5 (4)
    Protect against whipsaws: revolutionize your swing trading approach Swing Trading is the first indicator designed to detect swings in the direction of the trend and possible reversal swings. It uses the baseline swing trading approach, widely described in trading literature. The indicator studies several price and time vectors to track the aggregate trend direction and detects situations in which the market is oversold or overbought and ready to correct. [ Installation Guide | Update Guide | Tro
    Supply and Demand Dashboard PRO
    Bernhard Schweigert
    4.81 (21)
    Trading Special – 30% OFF This dashboard is a very powerful piece of software working on multiple symbols and up to 9 timeframes. It is based on our main indicator (Best reviews:   Advanced Supply Demand ). The dashboard gives a great overview. It shows: Filtered Supply and Demand values including zone strength rating, Pips distances to/and within zones, It highlights nested zones, It gives 4 kind of alerts for the chosen symbols in all (9) time-frames. It is highly configurable for your pers
    Introduction to Fractal Pattern Scanner Fractal Indicator refers to the technical indicator that makes use of the fractal geometry found in the financial market. Fractal Pattern Scanner is the advanced Fractal Indicator that brings the latest trading technology after the extensive research and development work in the fractal geometry in the financial market. The most important feature in Fractal Pattern Scanner is the ability to measure the turning point probability as well as the trend probabi
    TPA True Price Action indicator reveals the true price action of the market makers through 100% non-repainting signals (except early signals mode) strictly at the close of a candle! TPA shows entries and re-entries, every time the bulls are definitely stronger than the bears and vice versa. Not to confuse with red/green candles. The shift of power gets confirmed at the earliest stage and is ONE exit strategy of several. There are available now two free parts of the TPA User Guide for our custom
    Introduction Excessive Momentum Indicator is the momentum indicator to measure the excessive momentum directly from raw price series. Hence, this is an extended price action and pattern trading. Excessive Momentum Indicator was originally developed by Young Ho Seo. This indicator demonstrates the concept of Equilibrium Fractal Wave and Practical Application at the same time. Excessive Momentum detects the market anomaly. Excessive momentum will give us a lot of clue about potential reversal and
    When it comes to trading in the financial markets, there's no question that the banks have a major advantage. They have access to vast amounts of resources, including high-powered trading algorithms, in-depth market research, and teams of experienced traders. But what if you could level the playing field and trade like the banks do? That's exactly what our Smart Money Indicator allows you to do. By providing you with critical insights into market structure and supply and demand zones, you can ma
    Tick Volume Dots — Uptick/Downtick Confirmation Indicator A simple visual filter to confirm momentum, spot exhaustion, and add tick-level confluence to your existing strategy. Description: "Read Real Order Flow, Not Just Candle Color" — shows a run of red dots quietly warning of a reversal before the candles confirm it, then the flip to green dots at the exact turn. "Confirm Scalp Entries in Seconds" — pairs the on-chart dots with the histogram subwindow, showing how a burst of green dots + a
    BTMM State Engine Pro by G-Labs — Beat The Market Maker indicator for MetaTrader 4. Asian session range, London and New York kill zones, level progression (L1/L2/L3), peak formation detection (PFH/PFL), entry signals, and a multi-pair scanner from one chart. Stop scanning charts one pair at a time. The State Engine tracks the BTMM daily cycle automatically — Asian box, room boundaries, level blocks, peak formations, and filtered entries — while the scanner dashboard shows level, peak status,
    More from author
    IPDA and PD Ranges MT4
    Thank-god Avwerosuoghene Odukudu
    5 (1)
    IPDA AND PD RANGES. Interbank Price Delivery Algorithm (IPDA) Range Liquidity and trades in the FX market take place in a decentralized manner as banks, brokers and electronic communication networks (ECNs) interact with one another to set prices. In FX, and ECN is a trading platform or electronic broker that hosts bids and offers and transmit them to users worldwide. ECN broadcasts a price around the world as various participants leave orders to buy and sell. Banks provide streaming prices based
    IPDA and PD Ranges
    Thank-god Avwerosuoghene Odukudu
    IPDA AND PD RANGES. Interbank Price Delivery Algorithm (IPDA) Range Liquidity and trades in the FX market take place in a decentralized manner as banks, brokers and electronic communication networks (ECNs) interact with one another to set prices. In FX, and ECN is a trading platform or electronic broker that hosts bids and offers and transmit them to users worldwide. ECN broadcasts a price around the world as various participants leave orders to buy and sell. Banks provide streaming prices base
    CiSD
    Thank-god Avwerosuoghene Odukudu
    CiSD | Change in State Delivery See exactly where price delivery changes direction. CiSD automatically detects Change in State Delivery and plots the critical price associated with the shift - giving ICT/SMC traders a precise reference level without manually searching through candle sequences. DETECT → MARK → CONFIRM → ANALYZE Figure 1: See the exact level where the delivery state changes. CiSD is designed for traders who use liquidity, displacement, market structure, FVGs/Imbalances and premi
    Filter:
    László Varga
    279
    László Varga 2026.02.04 10:08 

    User didn't leave any comment to the rating

    Reply to review