Aklamavo ATR

This indicator is a versatile MetaTrader 5 tool that calculates and displays Average True Range (ATR) levels on your chart. It draws horizontal lines representing price levels based on ATR multiples from the daily opening price, helping traders identify potential support and resistance zones.

1. Multiple ATR Levels

  • ATR1: Standard ATR level (default: 1x ATR)

  • ATR2: Intermediate level (default: 2x ATR)

  • ATR3: Extreme level (default: 3x ATR)

  • Each level displays both upper (High) and lower (Low) price lines

2. Customizable Settings

  • ATR Period: Adjustable calculation period (default: 14 days)

  • Individual Toggle: Turn each ATR level on/off independently

  • Custom Multipliers: Set any multiplier for each ATR level (e.g., 1.5x, 2.5x, 4x)


3. Visual Customization

  • Color Control: Separate colors for each ATR level's high and low lines

  • Line Style: Choose from various line styles (dashed, solid, dotted, etc.)

  • Line Width: Adjustable line thickness

  • Labels: Optional price labels for each level with adjustable font size

4. Flexible Extension Modes

The indicator offers three ways to display the lines:

A. Daily Extension

  • Lines extend only for the current trading day

  • Best for: Intraday traders focusing on today's price action

  • Time range: Today's market open to today's market close

B. Weekly Extension (Default)

  • Lines extend through the entire trading week

  • Best for: Swing traders and weekly analysis

  • Time range: Monday 00:00 to Friday 23:59

C. Chart Extension

  • Lines extend across the entire visible chart

  • Best for: Long-term analysis and historical context

  • Time range: First visible bar to last visible bar

  • Automatically adjusts when you scroll/zoom the chart

How It Works

Calculation

  1. ATR Value: Calculates the 14-day Average True Range using daily data

  2. Daily Open: Uses today's opening price as the baseline

  3. Level Calculation:

    • Upper Levels = Daily Open + (ATR × Multiplier)

    • Lower Levels = Daily Open - (ATR × Multiplier)

Example

If today's open is $100 and ATR is $5:

  • ATR1 High = $105, ATR1 Low = $95

  • ATR2 High = $110, ATR2 Low = $90

  • ATR3 High = $115, ATR3 Low = $85

Practical Applications

1. Volatility-Based Trading

  • Breakout Trading: Enter trades when price breaks through ATR levels

  • Range Trading: Fade moves to extreme ATR levels (ATR3)

  • Stop Placement: Use ATR levels for dynamic stop-loss positioning

2. Risk Management

  • Position Sizing: Adjust position size based on current volatility (ATR value)

  • Profit Targets: Set targets at subsequent ATR levels

  • Support/Resistance: Use ATR levels as dynamic support/resistance zones

3. Market Context

  • Volatility Assessment: Higher ATR = wider levels = more volatile market

  • Day vs Week Analysis: Compare intraday moves to daily/weekly volatility ranges

Installation & Setup

  1. Copy the .mq5 file to your MT5 Indicators folder

  2. Compile the indicator in MetaEditor (F7)

  3. Attach to your chart from Navigator window

  4. Configure settings according to your trading style

Recommended Settings

For Day Traders

  • Extension Mode: Daily

  • Show: ATR1 & ATR2

  • Multipliers: 1.0, 2.0

  • Colors: Bright, contrasting colors

For Swing Traders

  • Extension Mode: Weekly

  • Show: ATR1, ATR2, ATR3

  • Multipliers: 1.0, 2.0, 3.0

  • Colors: Distinct colors for each level

For Long-term Analysis

  • Extension Mode: Chart

  • Show: ATR3 (for extreme levels)

  • Multipliers: 3.0 or higher

  • Line Style: Solid

Benefits

  1. Automated Updates: Levels automatically recalculate each new trading day

  2. Clean Visualization: Horizontal lines with optional labels

  3. Flexible Configuration: Adapts to any trading style or timeframe

  4. No Repainting: Levels are fixed for each trading day

  5. Resource Efficient: Lightweight calculation and drawing

Limitations

  1. Daily Basis: Uses daily ATR calculation, regardless of chart timeframe

  2. Historical Levels: Only shows current day's levels, not past days

  3. Fixed Open: Based on daily open price, doesn't adjust intraday

Tips for Best Results

  1. Combine with Other Indicators: Use with trend indicators, moving averages, or volume

  2. Timeframe Awareness: Remember ATR is calculated on daily data

  3. Market Conditions: Works best in ranging or trending markets with clear volatility

  4. Adjust for News Events: Consider widening stops around major news events

This indicator provides a clean, customizable way to visualize volatility-based price levels, helping traders make more informed decisions based on market volatility rather than arbitrary price point.


Recommended products
Free automatic Fibonacci is an indicator that automatically plots a Fibonacci retracement based on the number of bars you select on the BarsToScan setting in the indicator. The Fibonacci is automatically updated in real time as new highest and lowest values appears amongst the selected bars. You can select which level values to be displayed in the indicator settings. You can also select the color of the levels thus enabling the trader to be able to attach the indicator several times with differe
FREE
Auto Fib Retracements
Ross Adam Langlands Nelson
4.2 (5)
Automatic Fibonacci Retracement Line Indicator. This indicator takes the current trend and if possible draws Fibonacci retracement lines from the swing until the current price. The Fibonacci levels used are: 0%, 23.6%, 38.2%, 50%, 61.8%, 76.4%, 100%. This indicator works for all charts over all timeframes. The Fibonacci levels are also recorded in buffers for use by other trading bots. Any comments, concerns or additional feature requirements are welcome and will be addressed promptly. 
FREE
Fibonacci Retracement Zones of the Latest Swing Leg FibRetrace Zones is the free visual companion to the FibRetrace Expert Advisor. It draws the Fibonacci retracement levels and highlights the pullback zone on the latest swing leg, so you can see where retracement entries line up before you trade. The zone is color-coded by direction: green for bullish setups, red for bearish setups. Works on any symbol and any timeframe. KEY FEATURES Automatic swing detection with adjustable lookback Classic Fi
FREE
Development of the previous version of the indicator ZigZag WaveSize MT4 ZigZag WaveSize - modified standard ZigZag indicator with added information about wave length in points, levels, and different alert logic General Improvements: Code adaptation for MetaTrader 5 Optimized work with graphical objects New Features: Horizontal levels at extremes Selection of level types: horizontal/rays/segments Filter for liquidity levels (not broken by price) Buffer for breakouts: adjusting sensitivity to f
FREE
Fractal Structure Auto Fibonacci This tool is designed for price action traders and structural analysts who want to optimize their charting. It automatically identifies valid market swings using fractal logic, draws clear ZigZag lines, and automatically draws Fibonacci retracement levels for the most recent trading range. Key Features Dynamic Fractal Detection: Identifies valid swing peaks and troughs based on a user-defined review period (n). It filters out market noise and visually marks
FREE
The jcoworld OTE EA is an automated trading bot for MetaTrader 5 built on Smart Money Concepts (SMC) . It accurately identifies market impulse moves and automatically enters trades within the Optimal Trade Entry (OTE) zone (61.8% – 79.0% Fibonacci) as soon as a confirmation candle closes. Optimized for: XAUEUR, XAUUSD, and Major Forex Pairs Features: Automatic risk management, dynamic lot sizing & automated Stop Loss/Take Profit. Try for free: This demo version is 100% free! Pricing Plans for Fu
FREE
-- Simple but effective. Inversion Indicator -  What is it? A trend-following overlay indicator that combines SuperTrend logic with exponential curve technology. It detects trend direction, draws a dynamic channel on the chart, and sends real-time alerts when the trend reverses. How does it work? The indicator calculates an exponential baseline using ATR and a SuperTrend factor. When price closes above or below this baseline, a trend reversal is confirmed. A green arrow marks the start of a
FREE
Pi Cycle Projections
Andres Felipe Carvajal Rodriguez
5 (1)
What Is Pi Cycle Projections? Pi Cycle Projections is a technical analysis indicator for MetaTrader 5 that helps identify potential changes in market direction through moving average crossovers. When projections are enabled, it also displays potential price targets and estimated dates. 1. Pi Moving Average Signals The indicator compares a fast moving average with a slow moving average calculated using the Pi multiplier. When the two averages cross on a closed candle , the indicator can generate
FREE
Easy GOLD MT5
Franck Martin
3.87 (45)
Easy Gold is the latest addition to the BotGPT family. It is surprising and very powerful. It is ideal for beginners due to its simplicity.  There is absolutely nothing to do, it's 100% automated, simply indicate the percentage of risk you want to take per trade and the EA is ready. Whatever your capital, the EA takes care of everything. Optimized on (XAUUSD).  Unleash all the power with the professional version (AGI Gold) and its connection to the neural network, available in my store. My othe
FREE
Fibonacci Trend Indicator
Vinoth Durairaj Durairaj
Fibonacci Trend Indicator for MT5 Unlock the power of Fibonacci analysis on your MetaTrader 5 charts! Our   Fibonacci Trend Indicator   automatically plots dynamic support and resistance levels so you can spot trends, reversals, and breakout opportunities at a glance. Features & Advantages Automatic Fibonacci Levels Instantly displays seven key Fibonacci retracement levels based on the highest and lowest prices from your chosen lookback period — no manual work required. Dynamic Trend Adaptatio
FREE
FiboZone OTE Map
Katsuhei Yamamaru
See where the pullback should end before it happens. FiboZone OTE Map finds impulse legs that broke market structure and draws their optimal trade entry (OTE) zone, the 0.705 to 0.95 retracement of the move, on up to three timeframes at once. It tells you when price reaches a zone and when a lower timeframe confirms the turn inside it. What it shows OTE zones: for every impulse that breaks structure by at least 1.5 ATR, the 0.705 to 0.95 retracement zone is drawn from the impulse extreme to the
FREE
Fibonacci Moving Averages
Brendan Jonathan Stoyanowski-campbell
2 (1)
OVERVIEW The Fibonacci Moving Averages are a toolkit which allows the user to configure different types of Moving Averages based on key Fibonacci numbers. Moving Averages are used to visualise short-term and long-term support and resistance which can be used as a signal where price might continue or retrace. Moving Averages serve as a simple yet powerful tool that can help traders in their decision-making and help foster a sense of where the price might be moving next. The aim of this scrip
FREE
Inverse Liquidity Grab Ultimate EA
Stephen Muriithi Muraguri
5 (1)
This EA finds Fair Value Liquidity (FVL) on the chart, tracks when they get mitigated , and then looks for an inversion signal (price “fails” through the zone). When that inversion happens, it places a trade in the opposite direction of the original Liquidity gap (an Inverse FVG approach). It also lets you control when it trades using market sessions , and it can auto-close positions at New York open (all positions or profitable-only). Key advantages Clear, rule-based entries (no guessing): trad
FREE
The indicator identifies liquidity levels using fractals, which are local price highs and lows, and tracks when price reaches these levels. It works on any trading instrument and chart timeframe and can calculate fractals using a separately selected timeframe. Features Identifies local highs and lows using a configurable number of bars to the left and right. Active levels appear as rays extending to the right. Once reached by price, they appear as dashed lines ending at the bar where the level w
FREE
Support Resistance Channels Advanced is a MetaTrader 5 indicator that finds the strongest support and resistance from pivot points and draws them as channels (zones) rather than single lines, which better reflects how price reacts to areas. Features Automatic level detection: identifies pivot highs and lows and ranks the strongest current levels. Zone-based levels: shows support and resistance as channels, not thin lines, matching how price actually reacts. Cleaner reading: focuses on the most s
FREE
Automatic fibonacci with alerts is an indicator that automatically plots a fibonacci retracement based on the number of bars you select on the BarsToScan setting in the indicator. The fibonacci is automatically updated in real time as new highest and lowest values appear amongst the selected bars. You can select which level values to be displayed in the indicator settings. You can also select the color of the levels thus enabling the trader to be able to attach the indicator several times with d
FREE
LZ Auto Fibo Retracement automatically detects the most significant swing highs and lows on your chart and instantly draws accurate Fibonacci retracement levels between them. Stop drawing Fibs manually—let the indicator do it for you dynamically as the market evolves. Feature highlights - Auto Swing Detection: identifies the most relevant market extremes based on a configurable swing period and lookback range. - Dynamic Updates: the Fibonacci levels automatically adjust to new highs and lows
FREE
Fibo Pivot Optimus
Syamsurizal Dimjati
5 (1)
Ritz Smart FIBOPIVOT Optimus Pro Advanced Multi-Timeframe Fibonacci Trading System SMART PREDICTION & ACCURATE FORECAST Revolutionary Fibonacci Pivot Technology combines traditional pivot points with advanced Fibonacci extensions, creating a powerful predictive tool for professional traders. Our algorithm intelligently detects significant price levels across multiple timeframes, delivering laser-accurate support and resistance zones before the market moves . INTELLIGENT VOLUME-VALIDATED SIGNALS
FREE
Asian Range BreakOut
Wachinou Lionnel Pyrrhus Sovi Guidi
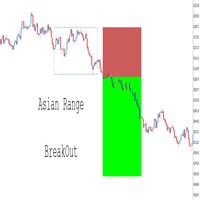
Fully Customizable – Adapt the indicator to your personal trading style by modifying parameters such as range time, colors, line styles, and risk-reward settings. Trade Levels Visualization – Automatically draws entry price, stop loss (SL), and take profit (TP) levels based on breakout conditions. Seamless Integration with Expert Advisors (EAs) – Take full control of your automated strategies by adding extra confirmations such as RSI, Moving Averages, Break of Structure (BOS), and more. Yo
FREE
ENGLISH VERSION (FREE INDICATOR) Smart ZigZag Signal & Statistics Monitor – FREE Multi‑Timeframe Indicator Free automated trading signals based on ZigZag peak ratios, live trade tracking, win/loss statistics, and one‑click signal inversion – designed to work with the commercial Smart Logic Executor PRO EA. This indicator is completely FREE.   Use it standalone or as a signal source for the paid Expert Advisor   Smart Logic Executor PRO   (sold separately). Key Features   6 Adjustable Ran
FREE
Alert Waves for mt5
Zhi Xian Hou
4.5 (2)
Indicator introduction: The indicator draws wave lines and histograms, It has small price lag, and the signal will not drift. The indicator can send emails, alerts and notifications to you when previous k line has an up arrow and it is under the histogram sections or it has a down arrow. you can choose whether or not to send the two kind of alerts, the alerts repetition times can also be changed. If the indicator appears red and green histograms, this is a buy zone. It can be used to analyze mar
FREE
TrendVision AI
Murtadha Majid Jeyad Al-Khuzaie
TrendVision AI – Smart Trend Channels & Price Forecasting for MetaTrader 5 Discover market structure and explore potential future price direction with TrendVision AI, an advanced technical indicator for MetaTrader 5 that combines automatic trendline analysis with a machine-learning-based price forecasting model. How Does TrendVision AI Work? TrendVision AI analyzes historical candlestick data within a configurable lookback window. It automatically draws two trendlines directly on the chart:
FREE
TradeDeck Lot Calculator
Joaquin Nicolas Metayer
LotCalc is a minimalist MT5 indicator designed for fast, precise position sizing. Set your risk amount in dollars, click the button, then click your entry and stop-loss levels directly on the chart — the lot size and point distance are calculated and displayed instantly. No clutter, no extra panels, just the one tool you actually need before placing a trade.
FREE
Reversal Composite Candles
MetaQuotes Ltd.
3.69 (16)
The idea of the system is to indentify the reversal patterns using the calculation of the composite candle. The reversal patterns is similar to the "Hammer" and "Hanging Man" patterns in Japanese candlestick analysis. But it uses the composite candle instead the single candle and doesn't need the small body of the composite candle to confirm the reversal. Input parameters: Range - maximal number of bars, used in the calculation of the composite candle. Minimum - minimal size of the composite can
FREE
Linear Regression Trending indicator analyzes price trends by plotting a linear regression channel based on user-defined parameters such as source (for example, close prices), channel length, and deviation multiplier. How It Works: - The indicator calculates a linear regression line over the specified length, forming a channel with upper and lower boundaries offset by the deviation value. - It detects price breaks from the channel and optionally displays broken channel lines (in a customizable
FREE
Fast Fibonacci Grid MT5
Grzegorz Korycki
2.5 (2)
Did you ever feel irritated by manually adjusting Fibonacci retracement levels? Do you ever want to have a tool that was automatically adjust to certain Fibonacci levels with your trading? Well here is a tool for you: Fast Fibonacci indicator and Grid trader allows you to quickly adjust Fibonacci retracement levels or construct Fibonacci extension grid! You can also quickly setup your grid trading based on these levels - only with few clicks. Adjustable graphics, font sizes and graphics panels m
FREE
VFI Quantum
Nikita Berdnikov
5 (1)
Introducing VFI (Volume Flow Indicator) – a trading indicator that analyzes the relationship between volume and price movement to identify key trading opportunities. The indicator displays the strength and direction of volume flow, providing clear signals about potential entry and exit points. Signals are formed based on zero line crossovers, crossovers between the VFI line and its exponential moving average (EMA), and when the indicator exits overbought and oversold zones. Attention! This stra
FREE
ControlEA — Trading Control & Prop Firm Utility for MT5 ControlEA is an on-chart trading control and risk-management utility for MetaTrader 5. It helps discretionary traders organize positions, execute manual trades with risk-based volume, visualize market structure, and monitor important account and Prop Firm information from one chart. ControlEA does not generate trading signals or promise trading results. You remain in control of every trading decision. See how it works on the YouTube livestr
FREE
Trading Stats Panel Your Trading Performance. At a Glance. Trading Stats Panel is a professional MetaTrader 5 indicator designed to give traders a clear and convenient overview of their recent trading activity directly on the chart. Instead of constantly opening the MT5 History tab and manually calculating your results, the panel presents key trading statistics in one easy-to-read dashboard. What Does Trading Stats Panel Show? The dashboard provides important performance information including
FREE
# DAILY SUPPORT AND RESISTANCE LEVELS - SEO OPTIMIZED DESCRIPTION ## SHORT DESCRIPTION (160 characters max) ``` Free pivot points indicator with daily support resistance levels for MT5. Perfect for intraday forex day trading and scalping strategies. ``` **Character count:** 159 **Keywords included:** pivot points, support, resistance, MT5, forex, day trading, scalping, free --- ## FULL DESCRIPTION (HTML Formatted for MQL5) ### Main Title **Daily Support and Resistance Levels - Free Pivot
FREE
Buyers of this product also purchase
Trend Sniper X
Sarvarbek Abduvoxobov
4.86 (43)
Trend Sniper X is a multi-timeframe trend-following indicator for MetaTrader 5 that helps traders identify trend direction and potential reversal points with clarity and precision. for MT4: https://www.mql5.com/en/market/product/193245 Price Information: The current price is promotional and is subject to change as upcoming updates and new features are released. Bonus Offer: To get the FREE Auto-Trade Assistant EA for this indicator, please message the author after purchasing. Code2Profit Channe
Smart Trend Trading System — MetaTrader 5 Message me on MQL5 after purchase to receive Smart Universal Expert Advisor for FREE, plus the online course, PDF manual, and private group access. STTS brings trend direction, entry and exit signals, reversal zones, and important price levels together on your chart. Follow the system manually, or connect a separate compatible EA for automated execution using your chosen settings. ONE SYSTEM. FOUR TRADING APPROACHES. STTS organizes its trading approaches
A new King in town - Indicator + Order management indications(tp1+tp2+tp3) + Optional Telegram Signal sender   INCLUDED (FREE) + Bonus EA Robot ( FULL TRADING  and SIGNAL SYSTEM ) Our best EA for Gold: Gold Slayer TRY > Reversion Queen  Expert advisor >JOIN Community Channel < NEW Free Automation EA link < click here ( disclaimer: this is new and still on testing and phase , use at your risk on demo) Free Telegram Bridge < click here  This indicator includes an advanced Strategy, a trading sys
Zoryk Gold
Reda El Koutbane
4.78 (18)
discount ends SOON next price 69 $ ZORYK — Advanced XAUUSD Signal System for MetaTrader 5 You know the feeling. You spend time analyzing gold. You wait for the entry. You finally open the trade, and price immediately moves against you. You close too early, move the Stop Loss or hesitate for a few seconds. Then the market reaches the exact destination you originally expected without you. The direction was not always the problem. The real problem was uncertainty. You did not know exactly where th
M5 Sniper
MeanFX
5 (3)
Get your trading edge in the line of sight M5 Sniper   is a new indicator by MeanFX. It combines   precise trading signals   with   adaptive TP/SL levels   - creating best possible statistical trades as a result! The price increases every 5 purchases, the next price is 79$ Message me after purchase to receive tips/guide and bonus EA Auto Optimisation only works on LIVE chart , needs data feed >JOIN Community Channel < What makes it stand out?   Proven statistical performance   on Gold XAUUSD
Ultra Indicator
Ihor Otkydach
5 (1)
ULTRA is a technical indicator that operates on an “all-in-one” basis—it independently analyzes the market, generates trading signals, displays levels for setting stop-loss orders, and suggests when to close trades to lock in profits or minimize losses. In other words, it doesn't matter if you don't know how to analyze the market, determine levels—where to set your stop-loss—or struggle with money management. ULTRA will do all of that for you! BUYER BONUS: After purchasing the ULTRA indicator, s
In 2019 I showed the whole world what this indicator can do. I traded its signals by hand, on a real account, in the open — the account was monitored live on Myfxbook, and I covered my experiment in detail on Facebook. The result: $10,000 became $941,411 in four months. The risk was deliberately extreme — the drawdown reached 54%, because in our profession profit and risk always go hand in hand. The Myfxbook screenshot is the first picture in the gallery. Looks like congratulations are in order:
SuperScalp Pro
Van Minh Nguyen
4.54 (37)
SuperScalp Pro - Professional Multi-Layer Confluence Scalping System SuperScalp Pro is an advanced scalping indicator that upgrades the classic Supertrend with multiple intelligent confirmation filters. It helps you identify higher-probability Buy/Sell opportunities while significantly reducing false signals. Clear Buy and Sell arrows appear directly on the chart, along with automatic ATR-based Stop Loss and Take Profit levels calculated in real time. After purchase, please message me on MQL5 to
Gann Made Easy   is a professional and easy to use Forex trading system which is based on the best principles of trading using the theory of W.D. Gann. The indicator provides accurate BUY and SELL signals including Stop Loss and Take Profit levels. You can trade even on the go using PUSH notifications. PLEASE CONTACT ME AFTER PURCHASE TO GET TRADING  INSTRUCTIONS   AND GREAT EXTRA INDICATORS  FOR FREE! Probably you already heard about the Gann trading methods before. Usually the Gann theory is a
SMC Intraday Formula
VividMind Digital Solutions
5 (26)
Secure the Lowest Price Today. After purchase, contact via   MQL5 inbox   to receive your buyer kit and bonus. Let's be honest first. No indicator will make you profitable on its own. If someone tells you otherwise, they're selling you a dream. Every indicator that shows perfect buy/sell arrows can be made to look flawless — just zoom into the right window of history and screenshot the winners. We won't do that. SMC Intraday Formula is a tool. It reads the market structure for you, maps the hig
M1 Sniper MT5
Oleg Rodin
5 (7)
M1 SNIPER  is an easy to use trading indicator system. It is an arrow indicator which is designed for M1 time frame. The indicator can be used as a standalone system for scalping on M1 time frame and it can be used as a part of your existing trading system. Though this trading system was designed specifically for short-term trading, it still can be helpful for all traders. This trading system can be used with any forex pair and time frame, though lower time frames are recommended from M1 up to M
GoldenX Entry MT5
VividMind Digital Solutions
5 (17)
Price will increase by $20 every 10 buyers to maintain premium value. After purchase, contact via   MQL5 inbox   to receive your buyer kit and bonus. You have probably tested dozens of indicators before. But we are not here to be “just another signals indicator.” Behind GoldenX Entry is intensive research & development focused on building sophisticated algorithms designed to adapt to the real behavior of every instrument — not generic signals recycled everywhere else. From advanced Auto Optim
Gold Entry Sniper
Tahir Mehmood
5 (21)
Gold Entry Sniper – Professional Multi-Timeframe ATR Dashboard for Gold Scalping & Swing Trading Gold Entry Sniper is a cutting-edge MetaTrader 5 indicator designed to give traders precise buy/sell signals for XAUUSD and other symbols, powered by ATR Trailing Stop logic and a multi-timeframe analysis dashboard . Built for both scalpers and swing traders, it combines real-time market direction , dynamic stop levels , and professional visual dashboards to help you identify high-probability gold en
Next Update — Version 2.52 Coming Soon! [NEW] Get Ready for 4 Major New Features Designed to Enhance Your Market Analysis and Trading Workflow We’re taking market analysis to the next level with 4   new features designed to meet your trading needs. Introducing: TRADE OVERVIEW DASHBOARD CONFLUENCE AT ZONE STRONG & WEAK HIGH/LOW OPTIMAL TRADE ENTRY  —   OTE 1. TADE OVERVIEW DASHBOARD  A dashboard that helps you understand the overall market picture more easily, providing guidance to support yo
Gold Trend Coach MT5
Cristhian Alexander Gaibor Cuasquer
5 (4)
Gold Trend Coach is a gold (XAUUSD) trend indicator for MetaTrader 5 with buy and sell signals, stop loss and three take profit targets confirmed on candle close (no repaint), a coach that guides you from the entry to TP3, a multi-timeframe dashboard and alerts to your phone and Telegram. Built for M1 and M5 scalping and M15 intraday during the London and New York sessions. BONUS: FREE Auto-Trade EA for Gold Trend Coach. Message me after purchase and I send you the EA that trades the indicator s
Atomic Analyst MT5
Issam Kassas
4.5 (64)
Atomic Analyst — MetaTrader 5 Message me on MQL5 after purchase to receive Smart Universal Expert Advisor for FREE, plus the online course, PDF manual, and private group access. Atomic Analyst brings price action, trend direction, entry and exit signals, Stop Loss and multiple Take Profit levels together on your chart. SEE THE SIGNAL. UNDERSTAND THE SETUP. Atomic Analyst organizes its analysis into clear visual information: • Buy and sell arrows to identify potential entries. • Stop Loss and mul
Boba Analysis Suite
Trade Ready Solutions LLC
5 (2)
Boba Analysis Suite Boba Analysis Suite is an analytical indicator for MetaTrader 5. It brings market structure, relevant price zones and broader market context together in a single chart view. Developed through practical experience as a trader and trading coach, it supports a structured analysis process: assessing market direction, identifying important levels and considering multiple timeframes together. Analysis in Context Individual signals gain meaning through context. Boba Analysis Suite h
Adaptive Price Action Engine Buy Indicator- Get EA Based on it for FREE. Self-Optimizing Multi-Timeframe Trend & Candlestick Intelligence Markets do not behave the same way all the time—and not every price-action pattern has the same value in every market regime. Adaptive Price Action Engine is designed to adapt to changing market conditions by combining trend structure, multi-timeframe analysis, candlestick patterns, and statistical optimization into one analytical framework. Two Adaptive Mode
Azimuth Pro
Ottaviano De Cicco
5 (7)
Azimuth Pro V2: Synthetic Fractal Structure and Confirmed Entries for MT5 Overview Azimuth Pro is a multi-level swing structure indicator by Merkava Labs . Four nested swing layers, swing-anchored VWAP, ABC pattern detection, three-timeframe structural filtering, and closed-bar confirmed entries — one chart, one workflow from micro-swings to macro-cycles. This is not a blind signal product. It is a structure-first workflow for traders who care about location, context, and timing. Halloween P
Auto Optimized SpeedAngle is an institutional-grade momentum vectoring system that eliminates curve-fitting through continuous Walk-Forward Optimization (WFO). Rather than relying on static inputs that degrade when market regimes shift, the indicator dynamically recalibrates its parameters using Out-of-Sample (OOS) validation, ensuring the displayed signals represent genuine statistical edges rather than historical anomalies. By shifting the focus from subjective visual angles to normalized, qua
Zain Gold Scalping
Ahmed Gamal Abdel Nasser Mohamed
A complete price-action analysis tool built around dual independent entry logic, each confirmed against a volatility band, combined with a configurable set of nine optional confirmation filters that let you shape exactly how conservative or aggressive the tool's signals behave. Core Strategy Two independent entry setups, each triggering only when price moves outside a dynamic volatility band — giving two distinct ways to spot potential reversal points, which can be used together or separately.
Tokyo mt5 Indicator
Vasiliy Strukov
5 (14)
Tokyo Indicator provides a clear visual overview of trend direction, potential trading signals, and market conditions. Its colour-coded, stepped trend line distinguishes bullish phases in blue from bearish phases in magenta. Matching directional arrows highlight potential buying and selling opportunities when the displayed trend changes. An integrated dashboard brings together the current signal, market bias, momentum, volatility, and signal quality in one convenient view. This allows traders t
FiboSniper Pro
Van Minh Nguyen
5 (4)
FiboSniper Pro - Multi-Filter Fibonacci System with Auto SL/TP and Control Panel FiboSniper Pro is a technical indicator that combines dynamic Fibonacci Envelopes with multiple confirmation filters to generate selective Buy and Sell signals. Fibonacci levels are calculated from Moving Average and ATR, then filtered by ADX, EMA, RSI, ATR, Volume, Time and Candle structure. The indicator displays automatic ATR-based Stop Loss and Take Profit levels directly on the chart, along with an interactive
Quantum TrendPulse
Bogdan Ion Puscasu
5 (26)
Introducing Quantum TrendPulse , the ultimate trading tool that combines the power of SuperTrend , RSI , and Stochastic into one comprehensive indicator to maximize your trading potential. Designed for traders who seek precision and efficiency, this indicator helps you identify market trends, momentum shifts, and optimal entry and exit points with confidence. Key Features: SuperTrend Integration: Easily follow the prevailing market trend and ride the wave of profitability. RSI Precision: Detect
Superhero
Ihor Otkydach
5 (3)
The SUPERHERO indicator is a multi-currency trading system designed on an "all-inclusive" basis. The indicator independently analyzes the market and provides signals on when to open and close trades. It uses Stop Loss and Take Profit orders. The R:R ratio is 1:1. This system can send push notifications to your smartphone, so you can place trades "on the go" without needing to be tied to a PC. It's perfect for proprietary trading firms. A BONUS FOR EVERY CUSTOMER: Every buyer of this indicator wi
Multi Currency Strength and Momentum Indicator MT5 Dynamic Forex28 Navigator is the evolution of our long-time, popular indicators, combining the power of three into one: Advanced Currency Strength28 Indicator (700 reviews) Advanced Currency IMPULSE with ALERT (530 reviews) CS28 Combo Signals (recent Bonus) The two predecessor indicators together have received more than 1,200 reviews on the MQL5 Market and have been a staple in the MT4 community since 2016. Dynamic Forex28 Navigator MT5 carries
Trend Catcher ind mt5
Ramil Minniakhmetov
5 (18)
TREND CATCHER INDICATOR Trend Catcher Indicator analyzes market price movements, using a combination of the author’s proprietary and customized adaptive trend-analysis indicators.  It identifies the true market direction by filtering out short-term noise and focusing on underlying momentum strength, volatility expansion, and price structure behavior.  It also uses a combination of smoothing and trend-filtering customized indicators such as moving averages, RSI, and volatility filters.   Real ope
Apex Patterns PRO Buy Indicator - Get Expert Advisor Based on it for FREE. Self-Optimizing Chart Pattern & Breakout Intelligence Traditional pattern scanners rely on fixed inputs, often underperforming when market volatility and structures shift. Apex Patterns PRO is designed to adapt to changing market conditions by combining structural chart pattern recognition, momentum filtering, and statistical self-optimization into one analytical framework. Adaptive Scanning Engine Self-Optimizing Patter
Neuro Poseidon MT5
Daria Rezueva
4.75 (52)
Neuro Poseidon is a new indicator by Daria Rezueva. It combines precise trading signals with adaptive TP/SL levels - creating best possible trades as a result! Message me and get  Neuro Poseidon Assistant  as a gift to automize your trading process! What makes it stand out? 1. Proven profitability on all assets and timeframes 2. Only confirmed BUY and SELL signals present on the chart 3. Adaptive TP & SL levels generated by the software for each trade 4. Easy to understand - suitable for al
Crystal Heikin Ashi Signals
Muhammad Jawad Shabir
5 (5)
Crystal Heikin Ashi Signals—Professional Trend & Signal Detection Indicator Advanced Heikin Ashi Visualization with Intelligent Signal System for Manual & Automated Trading Final Price: $149 ---------> Price goes up $10 after every 10 sales . Limited slots available — act fast . Overview User Guide PDF Crystal Heikin Ashi Signals is a professional-grade MetaTrader 5 indicator that combines pure Heikin Ashi candle visualization with an advanced momentum-shift detection system. Designed for both m
More from author
If you like this product, please give it a  5 star rating as a token of appreciation. This CRT indicator draws the premium and discount zones of a single candle from any timeframe on your chart. You choose which candle (current or previous) using CandleOffset, and the indicator automatically retrieves that candle’s high, low, and midpoint which is the same as CANDLE RANGE THEORY (CANDLE RANGE THEORY). It then visually displays: Premium Zone (Upper 50%) A shaded rectangle from the candle’s midp
FREE
If you like this product, please give it a  5 star rating as a token of appreciation. Inside Bar: A candle that is completely contained within the high-low range of the previous candle Outside Bar: A candle that completely engulfs the high-low range of the previous candle (also called an "Engulfing Bar") Inside Bars Consolidation Signals : Indicates market indecision/compression Breakout Setup : Often precedes significant price moves Continuation Patterns : Can signal pause in trend before con
FREE
Aklamavo ADR
Sylvester Aklamavo
This indicator   is a sophisticated MetaTrader 5 tool that calculates and displays Average Daily Range (ADR) levels on your chart. It draws horizontal lines representing expected price movement ranges based on historical daily volatility, helping traders identify potential daily high and low targets. ADR (Average Daily Range)   = The average difference between the daily high and low over a specified period (default: 14 days). Unlike ATR which includes gaps between days, ADR focuses purely on int
FREE
If you like this product, please give it a  5 star rating as a token of appreciation. This indicator plots horizontal trend lines at the opening price of each quarter (Q1–Q4) on the chart. These lines visually represent quarterly open levels of the current year, which traders often use as support/resistance or reference points. Automatically plots Q1–Q4 opening levels as trend lines on the chart. Lines are dashed, colored, and labeled. Handles both current and historical quarters. Cleans up line
FREE
If you like this product, please give it a  5 star rating as a token of appreciation. This indicator projects Higher-Timeframe (HTF) candles onto the current chart and optionally shows their OHLC lines and Fair Value Gaps (FVGs) using ICT 3-candle logic. Projects multiple higher timeframe candles. Accurately preserves HTF OHLC on any lower timeframe. Allows spacing adjustment between projected candles. Optionally displays OHLC horizontal reference lines. Automatically detects and draws HTF Fair
FREE
If you like this product, please give it a  5 star rating as a token of appreciation. This indicator calculates and draws pivot points and support/resistance levels for both daily and weekly timeframes: Pivot (central) level Support levels S1, S2, S3 Resistance levels R1, R2, R3 It allows showing daily, weekly, or both sets of pivots , giving traders visual references for potential support/resistance areas. Pivot mode: Choose which pivots to display (weekly, daily, or both). Colors and style: C
FREE
Aklamavo ICT FVGs
Sylvester Aklamavo
If you like this product, please give it a  5 star rating as a token of appreciation. This indicator identifies and displays Fair Value Gaps (FVG) on price charts. Fair Value Gaps are price zones where there's a significant imbalance between buying and selling pressure, creating "gaps" in price action. The indicator detects two types and when they are mitigated(touched): Bullish FVG: When a candle's low is above the high of a candle two periods earlier. Bearish FVG: When a candle's high is bel
FREE
If you like this product, please give it a  5 star rating as a token of appreciation. This indicator draws vertical lines marking key Forex trading sessions (Asian, London, New York) for a configurable number of past days. These “Silver Bullet” lines help traders quickly visualize session start and end times on the chart. DaysToDisplay: How many previous days’ session lines to show. Session colors: Customizable line colors for each session. Session start hours: Local server hours for each sessi
FREE
This   ForexTrading Sessions   indicator is a powerful visual tool for MetaTrader 5 that highlights the three major forex trading sessions (Asian, London, and New York) on your chart  with the Asian Mid-line. 1. Trading Session Visualization Asian Session : 00:00 - 09:00 GMT (blue/aqua color) London Session : 08:00 - 17:00 GMT (magenta color) New York Session : 13:00 - 22:00 GMT (orange color) 2. Time Zone Adaptation TimeZoneShift   input allows you to adjust sessions to your local time Example:
FREE
If you like this product, please give it a  5 star rating as a token of appreciation. This indicator plots horizontal lines on the chart representing the previous year’s high and low prices . These levels are widely used in technical analysis as major support/resistance references. Automatically identifies the previous calendar year’s high and low . Plots horizontal lines on the chart at these levels. Customizable color, width, and style of the lines. Deletes lines on deinitialization. Updates
FREE
The indicator reads MT5’s built-in economic calendar and organizes events into three horizontal lanes : High-impact events (red) Medium-impact events (orange) Low-impact events (gray) (optional) Each lane scrolls horizontally across the chart like a ticker. You can choose whether to show: Today’s events only Or all events for the current week This is a complete fundamental dashboard for MT5. It gives you: Real-time scrolling economic events Interpreted color-coded results Day/Week filterin
This is an extremely clean, efficient, and well-designed CBDR engine. Calculates ICT’s Central Bank Dealers Range (CBDR) Using only candle bodies — NOT wicks (open–close structure). For a defined time window (e.g., 00:00–05:00 New York). For each past day and also for today in real time. Draws the following on chart: A rectangle showing the entire CBDR body range The CBDR High line (body top) The CBDR Low line (body bottom) An optional midline A pip label showing total CBDR size Optional extens
This MetaTrader 5 indicator plots ICT Killzone session markers on the chart using vertical lines . It draws the start and end times for three institutional trading sessions— Asian , London , and New York —for a user-defined number of recent historical days. No buffers or plots are used; instead, the indicator relies entirely on chart objects (OBJ_VLINE) . 1. Inputs and Parameters The indicator allows full customization of each killzone segment: General DaysToDisplay : number of past days to dra
This MT5 (CRT) indicator displays   key price zones   from different timeframes on your current chart, helping you visualize where price might find support or resistance based on higher timeframe structure using CANDLE RANGE THEORY. The indicator draws   three price zones   from selected historical candles: Premium Zone : Upper 50% of a historical candle's range Discount Zone : Lower 50% of a historical candle's range Midline : Exactly halfway between high and low Each zone represents an area w
Aklamavo Market Sessions Monitor-EA (Expert Advisor) is a   Global Stock Exchange Market Hours Dashboard   for MetaTrader 5. It provides a comprehensive visual display of the opening status and trading hours of 7 major stock exchanges around the world. The EA creates a real-time dashboard that shows whether each stock exchange is currently: OPEN   (Green background) CLOSED   (Red background) PRE-MARKET   (Light Green background) POST-MARKET   (Light Pink background) Unique Features: Progress Ind
This EA is an   RSI Crossover Trading System   with advanced position management features . This is not one of those EAs with fake/manipulated test results out there. RSI Crossover Advanced Robot  is robust and  suitable for traders who want automated RSI-based trading with professional-grade position management. It's particularly useful in trending markets where RSI signals can provide reliable entry and exit points. Recommended settings tested with 1HR timeframe using ICMarkets Tickers on 1 y
This is a   Cumulative Volume Delta (CVD) Indicator   for MetaTrader 5 that visualizes order flow imbalance between buying and selling pressure . The indicator calculates and displays the   cumulative difference between buying (Bid) and selling (Ask) volumes   over time, providing insights into whether buyers or sellers are controlling the market. 1. Visual Displays: Cumulative Delta Line   (Blue): Running total of volume delta across multiple bars Positive Bar Delta Histogram   (Green): Individ
This is a   Market Depth (DOM - Depth of Market) Indicator   for MetaTrader 5 that displays real-time order book data in a visual ladder format. The DOM provides a comprehensive view of market depth with clear visual cues for volume imbalances, making it useful for both scalping and swing trading decisions This indicator provides traders with a professional-grade market depth visualization that can be customized to match individual trading preferences and strategies.  You can easily switch betwe
This Volume Delta Profile is an advanced MetaTrader 5 indicator that visualizes   volume delta (order flow imbalance)   using a volume profile-style histogram. It shows the difference between buying and selling pressure at specific price levels, helping traders identify supply and demand zones. This indicator provides a unique perspective on market dynamics by visualizing the imbalance between buying and selling pressure, offering insights beyond traditional volume analysis. Core Concept Positiv
This Volume Footprint indicator is essentially a   professional-grade market profile tool   that provides deep insight into market microstructure, showing exactly where trading activity is occurring and who's in control (buyers or sellers) at each price level. Key Features 1.   Footprint Display Divides each bar into multiple price levels (configurable via   PriceLevelsPerBar ) Shows   BID volume   (selling pressure) on the left side of each level Shows   ASK volume   (buying pressure) on the r
Filter:
No reviews
Reply to review