Best MA Ribbon Signal
- Indicators
- Manh Toan Do
- Version: 1.0
The Moving Average Ribbon is a technical indicator that overlays a series of moving averages (MAs) on a price chart to visualize trend direction, strength, and potential reversals or reentries. It supports both Exponential Moving Averages (EMA) and Simple Moving Averages (SMA), configurable via user input.
Key Features:
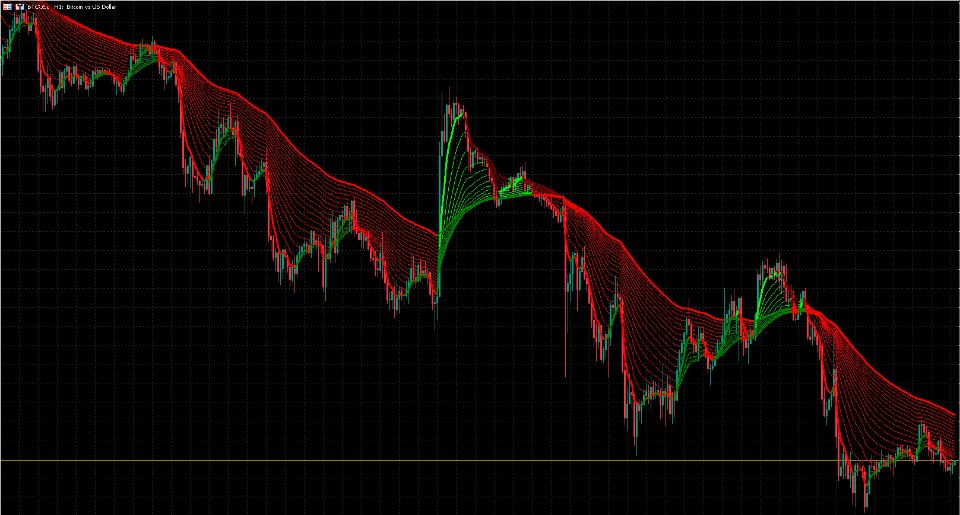
- Ribbon Composition: Displays 18 moving averages with periods ranging from 5 to 90 in increments of 5 (e.g., MA5, MA10, ..., MA90), plus an internal MA100 for reference. The MA5 and MA90 lines are thicker (linewidth 3) for emphasis, while others are thinner (linewidth 1).
- Color-Coded Trend Signals:
- Lime: Indicates an uptrend (MA rising and above the MA100 reference), suitable for long positions.
- Green: Signals a potential buy-the-dip reentry in an uptrend or a warning of downtrend reversal (MA rising but below MA100).
- Red: Indicates a downtrend (MA falling and below MA100), suitable for short positions.
- Maroon: Signals a potential sell-the-peak reentry in a downtrend or a warning of uptrend reversal (MA falling but above MA100).
- Gray: Neutral or undefined state.
- Dynamic Coloring: Each MA line's color changes bar-by-bar based on its direction (change compared to the previous bar) and position relative to the MA100 baseline.
- User Customization: Toggle between EMA (default) and SMA modes via the "Exponential MA" input option.
- Visual Style: Best viewed on dark chart backgrounds for clarity. It helps quickly identify trend continuations, pullbacks, or reversals without complex calculations.
This indicator is ideal for trend-following strategies in forex, stocks, or other markets, providing an intuitive "ribbon" effect where converging/diverging lines signal momentum shifts.






















Pak likes everything.