Zone Indicator for MetaTrader 4
- Indicators
- Eda Kaya
- Version: 1.3
Zone Indicator for MetaTrader 4
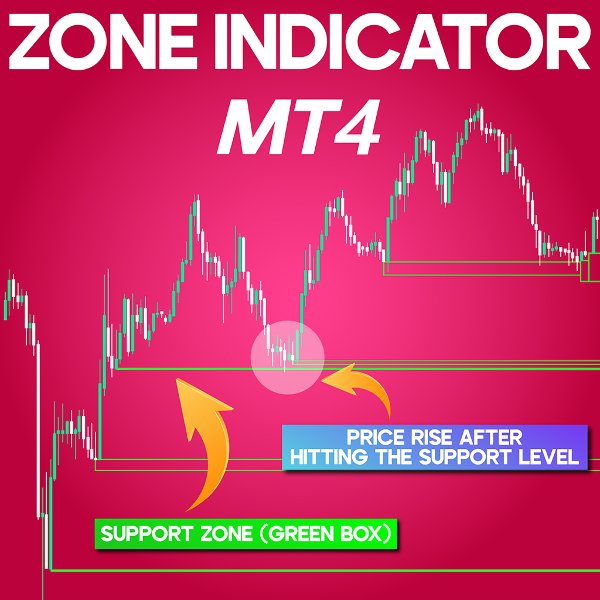
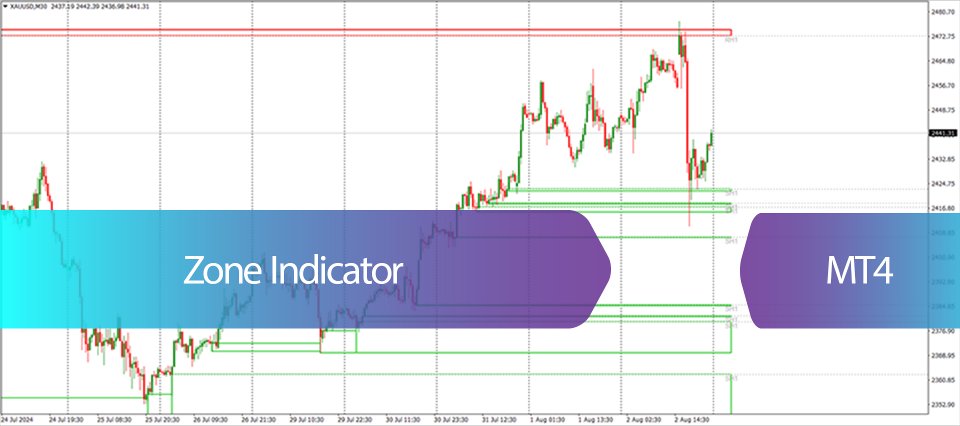
The Zone Indicator for MetaTrader 4 is a practical and efficient tool designed to assist traders in identifying important Support and Resistance zones based on historical price behavior.
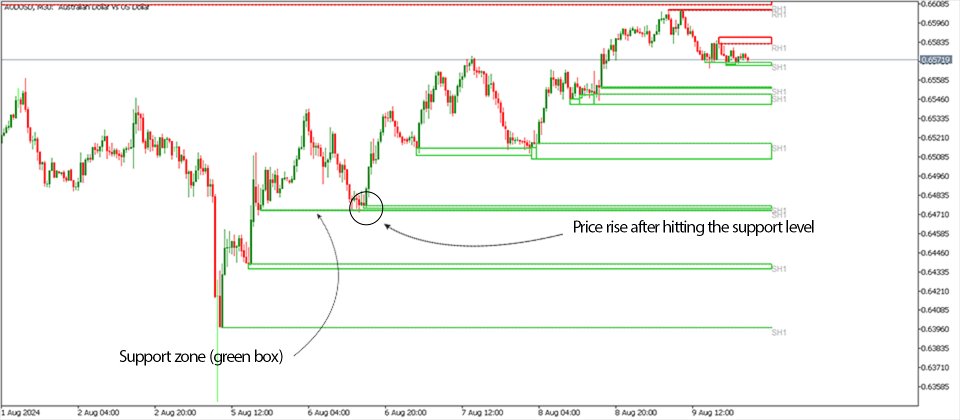
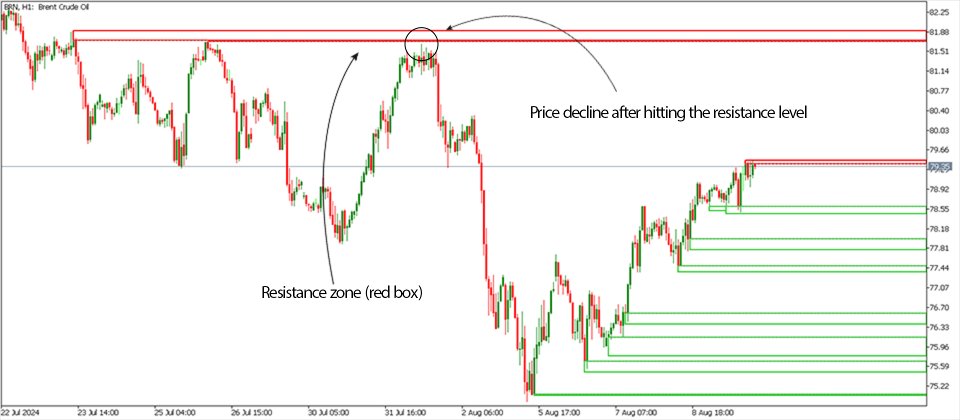
It automatically highlights potential resistance zones with red rectangles and support zones with green ones. These predefined zones offer valuable insights for determining optimal entry and exit points and placing strategic Take-Profit and Stop-Loss levels. This tool proves particularly beneficial in fast-moving and volatile markets where precise reaction levels are crucial for effective trade execution.
«Indicator Installation & User Guide»
MT4 Indicator Installation | Zone Indicator for MetaTrader 5 | ALL Products By TradingFinderLab | Best MT4 Indicator: Refined Order Block Indicator for MT4 | Best MT4 Utility: Trade Assistant Expert TF MT4 | TP & SL Tool: Risk Reward Ratio Calculator RRR MT4 | Money Management: Easy Trade Manager MT4 | Trade Copier: Free Fast Local Trade Copier MT4
Zone Indicator Table
| Category | Price Action - Support & Resistance - Key Levels |
| Platform | MetaTrader 4 |
| Skill Level | Beginner |
| Indicator Type | Reversal - Breakout - Trend Continuation |
| Timeframe | Multi-Time Frame |
| Trading Style | Suitable for All Styles |
| Trading Market | Universal: Forex, Commodities, Stocks, Crypto |
Zone Indicator Overview
This indicator adapts seamlessly to various timeframes, allowing traders to analyze short-term fluctuations or long-term trends.
Its accuracy in marking support and resistance levels makes it a reliable tool for identifying potential reversal zones. When the price touches a marked level, traders can wait for confirmation through candlestick formations or traditional reversal patterns. Conversely, if the price breaks through these zones, it often signals trend continuation, presenting a viable opportunity to enter in the breakout direction.
Buy Scenario (Support Zone Activation)
In the chart below showing the EUR/NZD pair on the H1 timeframe, a downward move on August 1st brought the price to the green support zone (SH1) around 1.8085. The market reacted strongly, bouncing upward from this level. This situation presents a buying opportunity upon confirmation of reversal patterns like pin bars or engulfing candles at that key support.
Sell Scenario (Resistance Zone Activation)
In the WTI crude oil chart below on a 1-hour timeframe, the price climbed to a red resistance zone (RH1) near $78.30 on August 1st. This resistance held firm, resulting in a downward movement. Traders observing this reaction could have waited for bearish reversal signals to initiate short positions.
Zone Indicator Settings
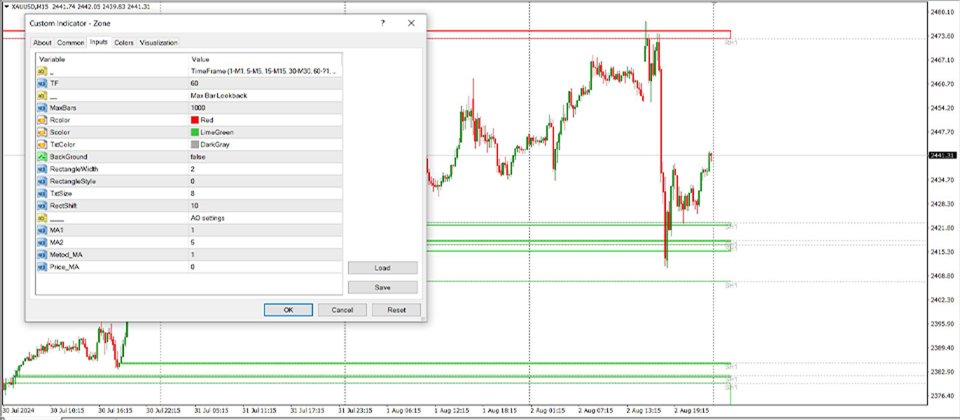
- Timeframe: Default set to 60 minutes (H1).
- Max Bar Lookback: 1000 candles used for calculation.
- Rcolor: Resistance zone color is red.
- Color: Support zone color is green.
- TxtColor: Label text is gray.
- Background: Set to "false" to keep boxes transparent.
- RectangleWidth: Width of the marked zones is 2.
- RectangleStyle: Box border style is set to 0.
- TxtSize: Font size is set to 8.
- RectShift: Horizontal shift for box placement is 10.
- AO Settings: Built-in oscillator configuration.
- MA1 / MA2: Moving Averages set to 1 and 5 respectively.
- Method_MA: Exponential Moving Average selected (EMA = 1).
- Price MA: Applied to closing price.
Summary
The Zone Indicator for MetaTrader 4 simplifies the process of recognizing key technical levels, reducing the need for manual chart analysis. It’s highly compatible with other tools such as RSI, Moving Averages, Bollinger Bands, and even news-based strategies.
For traders aiming to enhance their decision-making and increase the accuracy of their trades, this indicator is a valuable addition to their toolkit.
