EMA Cross Over
- Indicators
- Abderrahmane Benali
- Version: 1.1
- Updated: 13 May 2025
Important Reminder:
If you find this tool helpful, please support the work by leaving a comment or rating.
Avoid using it without showing support. Your feedback motivates further development!
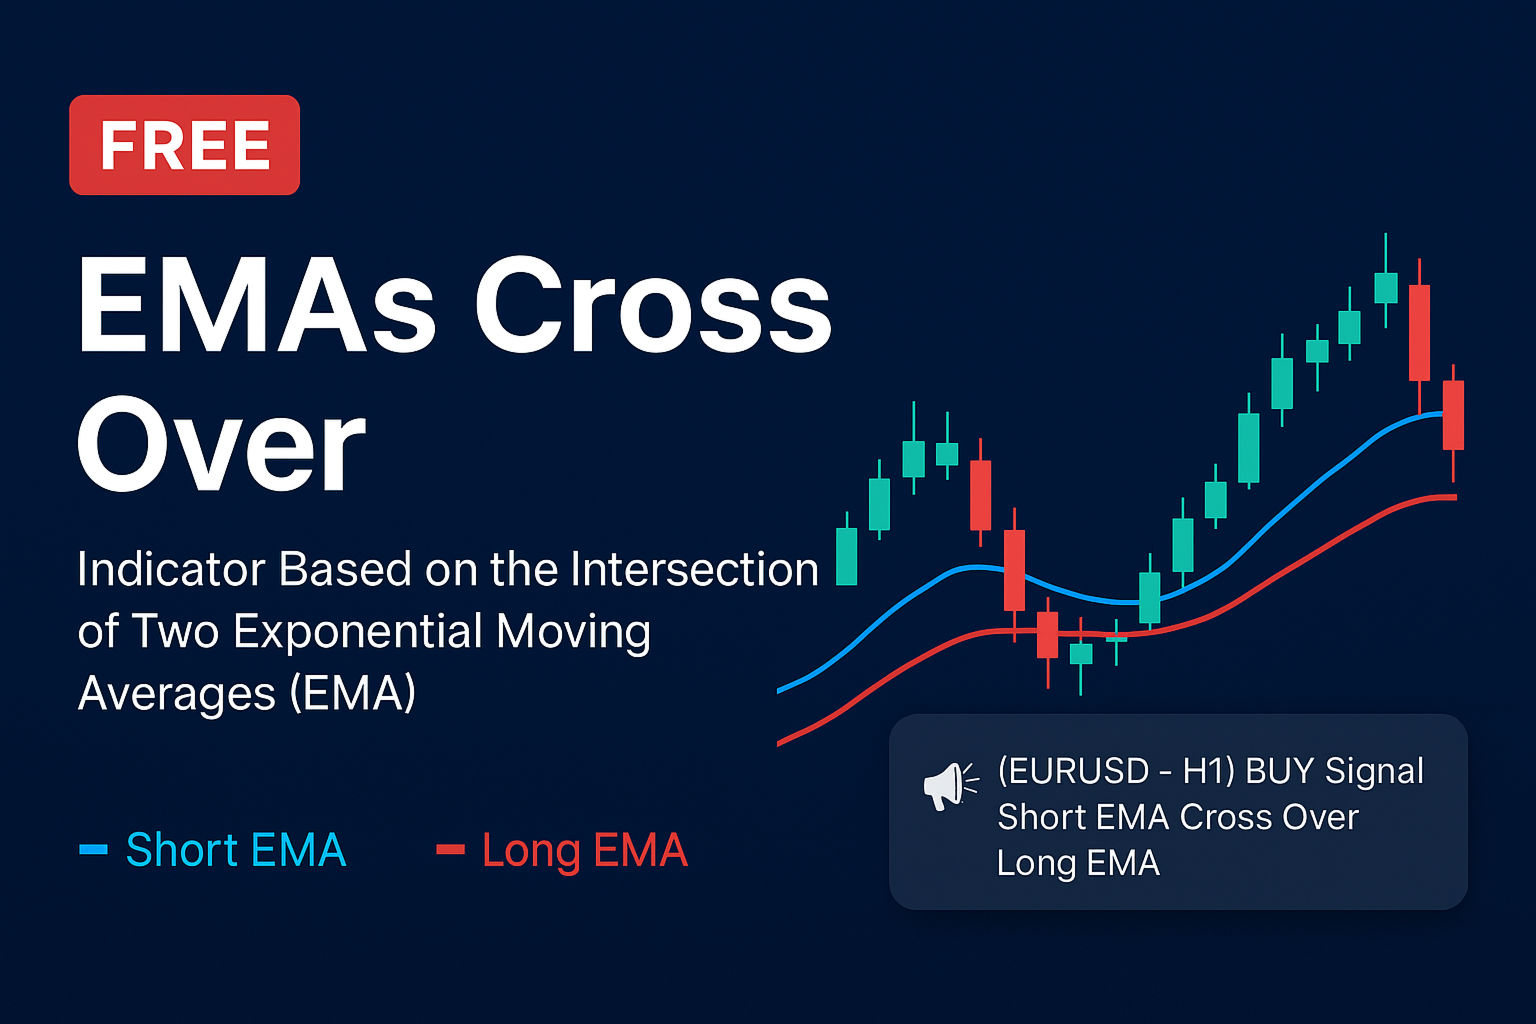
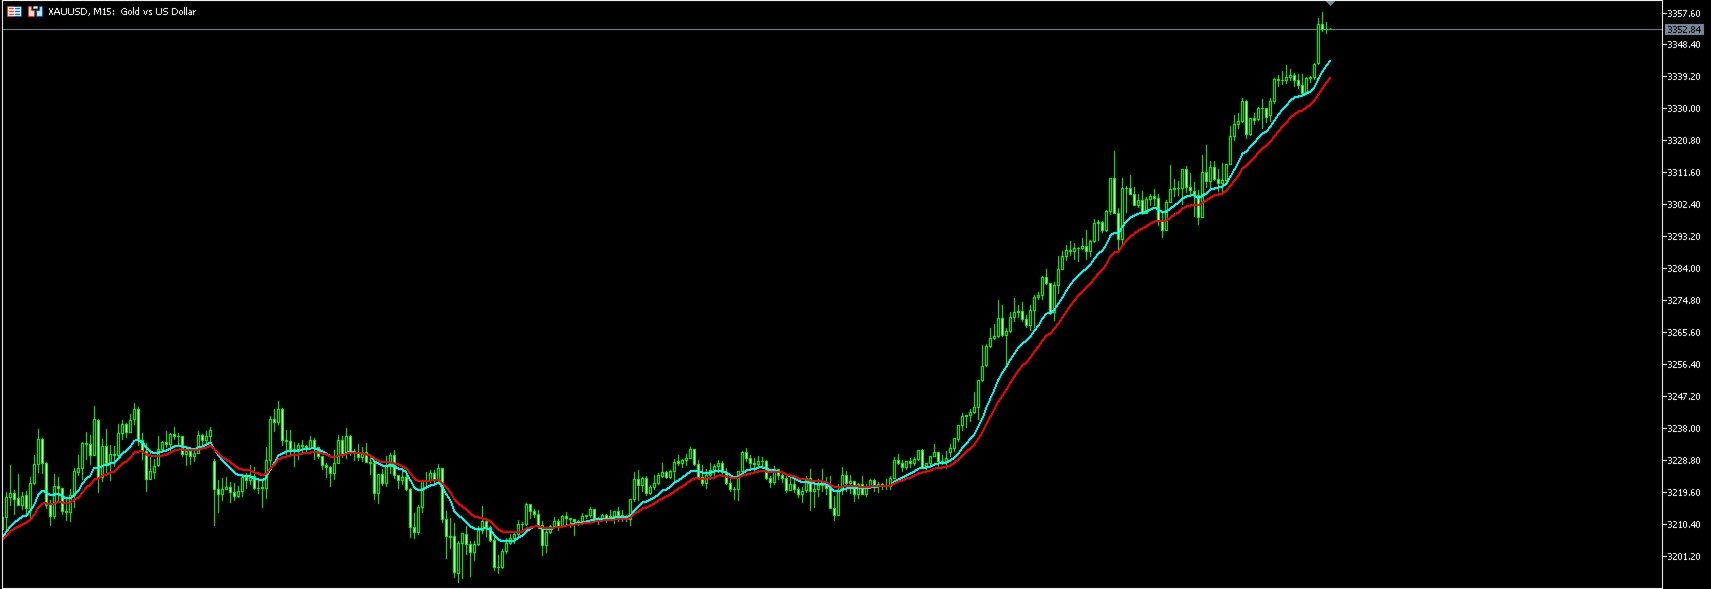
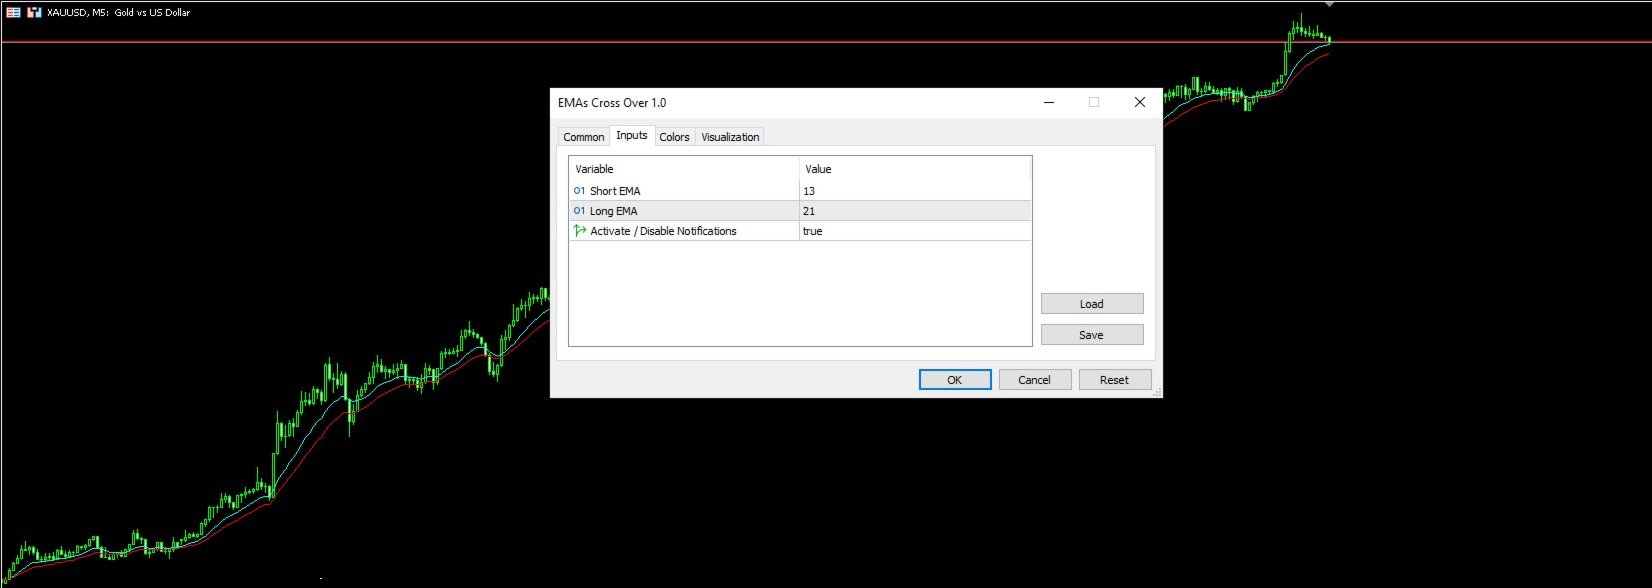
The 13- and 21-period exponential moving averages (EMA) on a 15-minute gold chart are used to identify short-term trends and potential trading signals. When the 13-period EMA crosses above the 21-period EMA, it is considered a bullish signal indicating a possible price increase. Conversely, when the 13-period EMA crosses below the 21-period EMA, it is considered a bearish signal indicating a possible price decline.
These crosses are used to determine entry and exit points. For example, when a bullish cross occurs, traders may decide to open long positions, while when a bearish cross occurs, they may open short positions. However, it should be noted that these signals are more reliable when they align with the overall market trend.
It's worth noting that using the 8-, 13-, and 21-period exponential moving averages together is a popular strategy among traders, as the alignment of these averages is sought to confirm the strength of a trend. When the 8-period exponential moving average is above the 13-period, and the latter is above the 21-period, this is considered confirmation of a strong uptrend, while the opposite is true for a downtrend.
However, caution should be exercised when trading based on these signals, especially in volatile markets or when the price is in a range. In such cases, the crossovers may lead to false signals. Therefore, it is always advisable to employ proper risk management and confirm the signals with multiple analytical tools before making trading decisions.
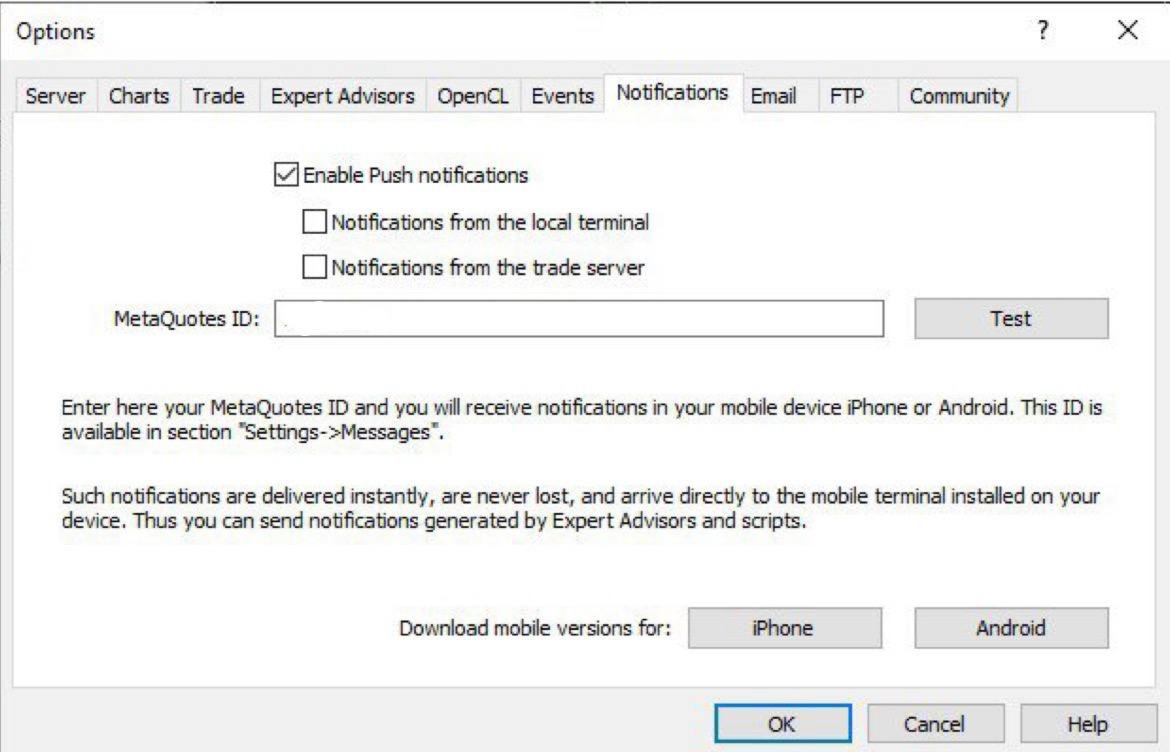
Note:
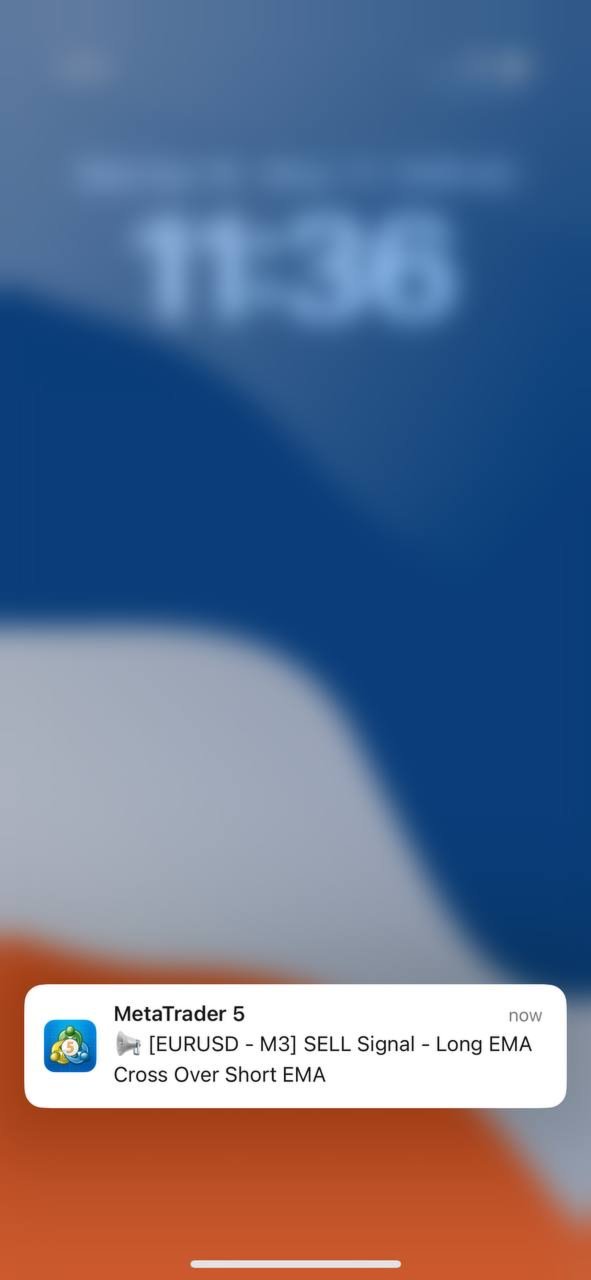
To activate notifications, please enable notifications from the platform.


Pretty good.