Candle cross Moving Average
- Indicators
- Version: 2.0
- Updated: 2 February 2025

This indicator displays a Moving Average and automatically changes its color depending on candle position relative to the MA line.
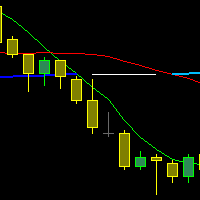
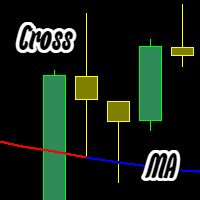
If a candle is completely above the Moving Average, the line is displayed in one color. If a candle is completely below the Moving Average, the line changes to another color. This approach helps visually identify market direction and price positioning more clearly.
The indicator works directly on the price chart and can be used for trend analysis, signal filtering, and visual market direction tracking.
How It Works
The indicator analyzes candle position relative to the Moving Average:
- if both the candle open and close prices are above the Moving Average, the line becomes blue;
- if both the candle open and close prices are below the Moving Average, the line becomes red;
- the current color remains unchanged until a new confirmed condition appears.
Color changes are based on closed candles.
Supported Moving Average Types
The indicator supports several Moving Average methods:
- SMA — Simple Moving Average;
- EMA — Exponential Moving Average;
- SMMA — Smoothed Moving Average;
- LWMA — Linear Weighted Moving Average.
Indicator Features
- automatic Moving Average color changes;
- support for multiple MA types;
- chart-based visualization;
- visual trend direction detection;
- sound alerts on color changes;
- compatible with any symbol and timeframe;
- no DLL usage or external connections.
Input Parameters
MA_Type
Type of Moving Average used in calculations.
MA_Period
Moving Average period.
EnableAlert
Enables or disables sound alerts when the line color changes.
Possible Applications
The indicator can be used for:
- identifying market trends;
- filtering trading signals;
- analyzing price position relative to the Moving Average;
- detecting directional market changes;
- integration into trading systems.
Important
The indicator does not open trades automatically and is not an Expert Advisor.
Indicator behavior depends on market conditions, selected symbol, timeframe, and input settings.
bar cross Moving cross candle cross Moving cross bar cross MA cross candle cross MA cross bar cross Moving Average cross candle cross Moving Average cross bar