Volume Bar POC

The Volume Bar POC Indicator is an innovative tool that provides precise visualization of key price levels (Point of Control, POC) based on tick volume trades. This indicator analyzes each price point within individual candles and displays the most significant levels, which can be used as strong support and resistance zones. Ideal for both intraday and long-term trading strategies.

How does the Volume Bar POC Indicator work?

The indicator uses an advanced process to calculate the POC during the formation of each candle:

  1. Creating a table when a candle opens:

    • As soon as a new candle opens, the indicator creates an internal table with the following data:
      • Price: All price levels within the range between the candle’s Low and High.
      • Volume: Number of quotes (tick volume) at each price level.
    • The table dynamically covers all price points within the candle's range.
  2. Updating the table during candle formation:

    • As the High and Low values change, new price levels are added to the table.
    • The volume at a specific price level increases every time the market (Bid/Ask quotes) passes that level.
  3. Calculating the POC (Point of Control):

    • The indicator continuously monitors which price level has the highest volume.
    • The POC is defined as the price level with the highest number of ticks or trade volume.
    • This information dynamically updates, so the indicator always displays the most active price level during candle formation.

Key features and benefits:

  • Tick volume analysis: Works with tick volume, ensuring high accuracy and compatibility across all markets supported by the MetaTrader 4 platform.
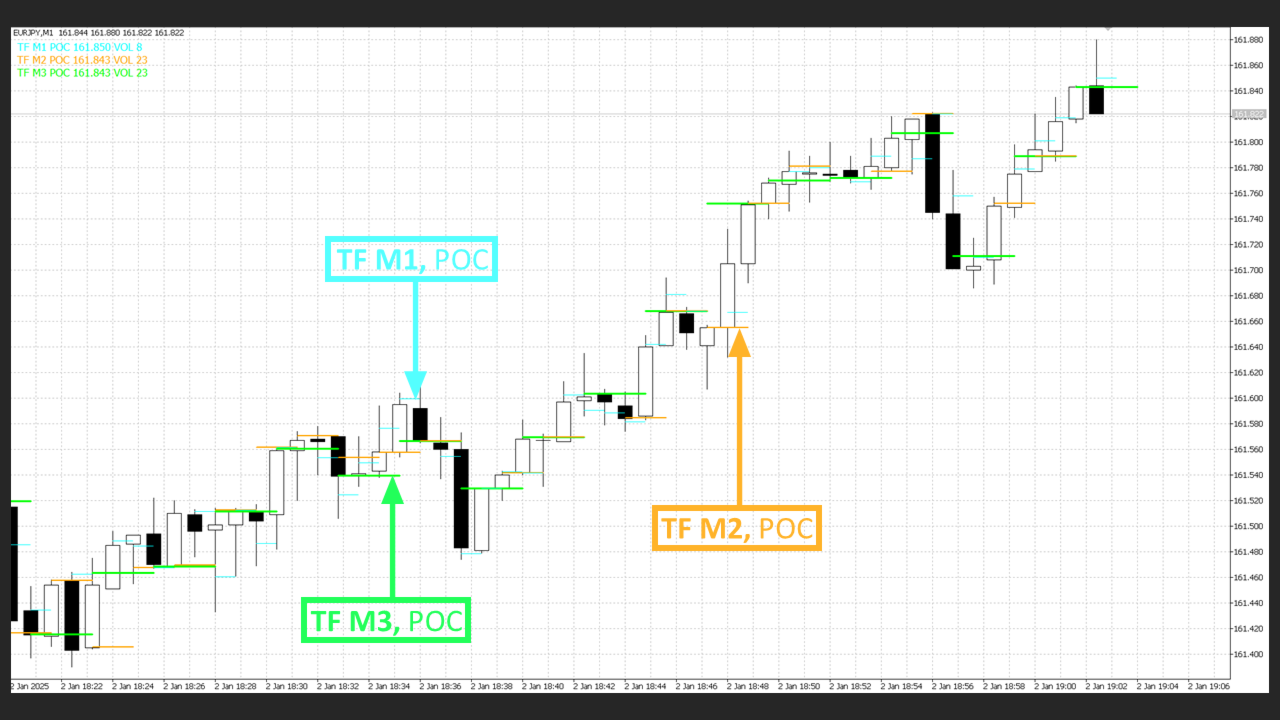
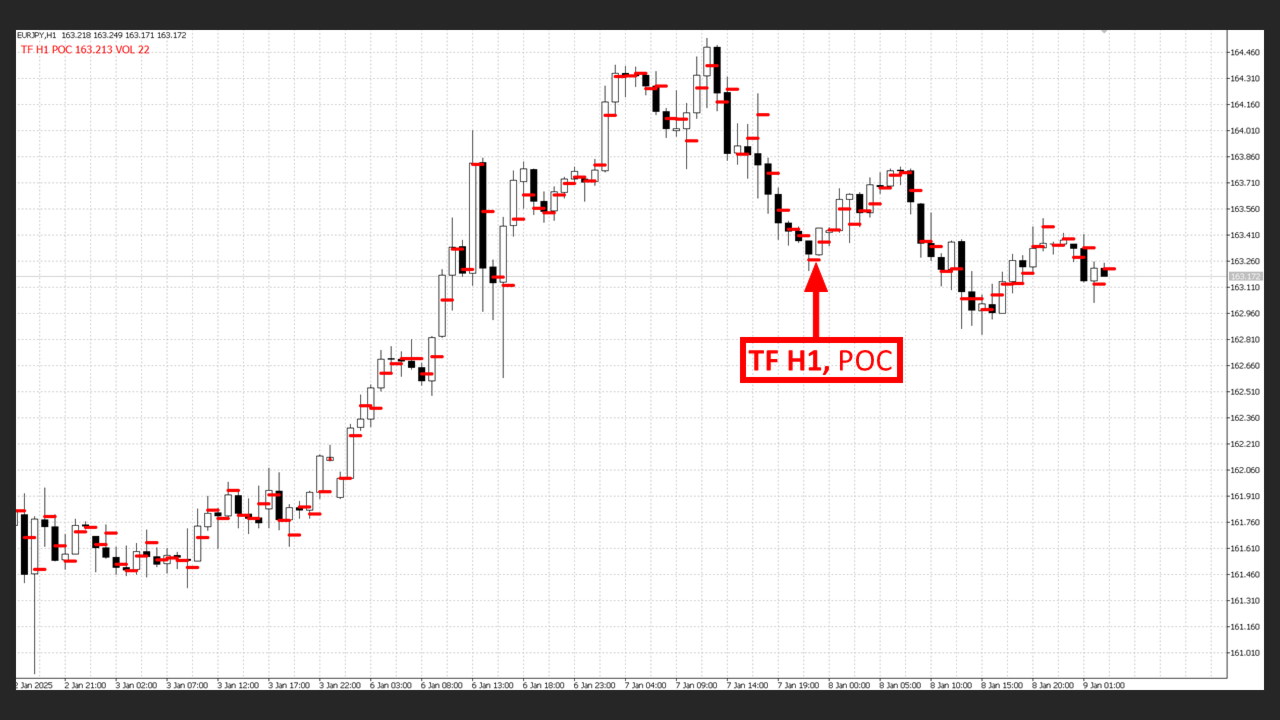
  • POC directly on candles: The indicator displays the POC for each individual candle, enabling immediate identification of key price levels with the highest trade volume.
  • Real-time data: The POC is calculated only from the moment the indicator is added to the chart. Historical data is not displayed retroactively, ensuring precise analysis of current market conditions.
  • Testable in the Strategy Tester: Fully functional in the strategy tester, enabling easy testing and optimization of trading systems.
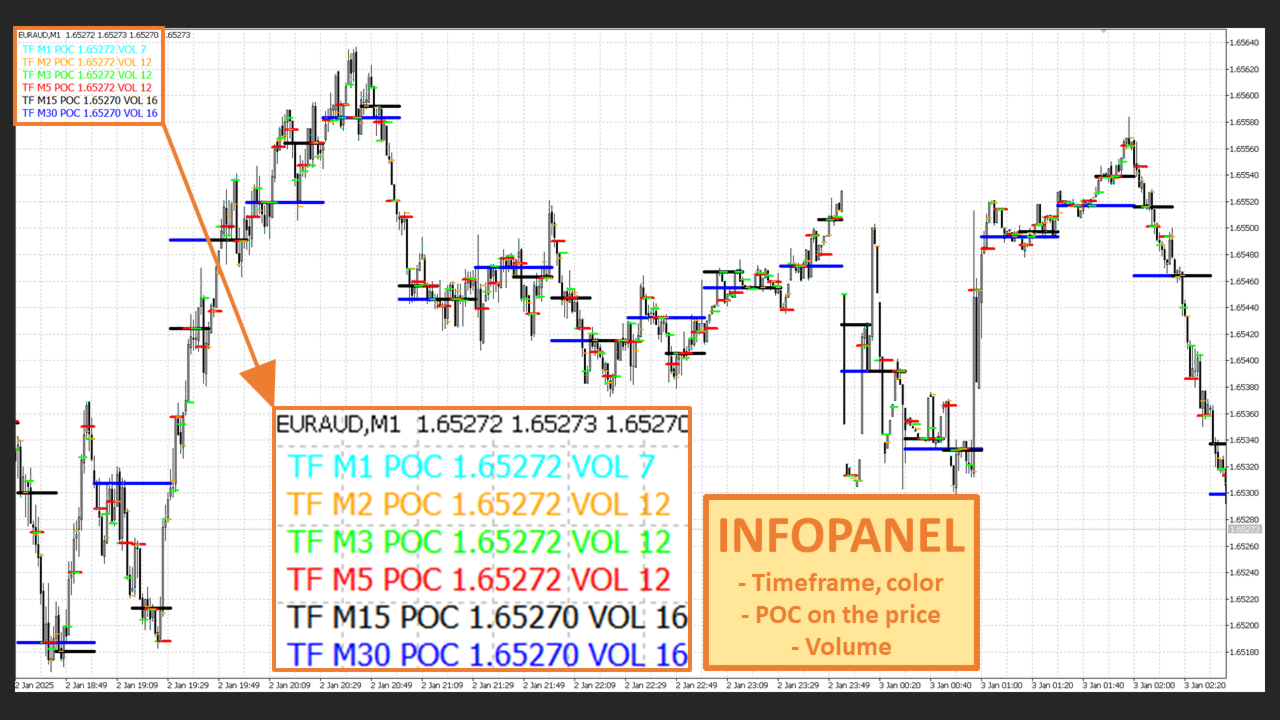
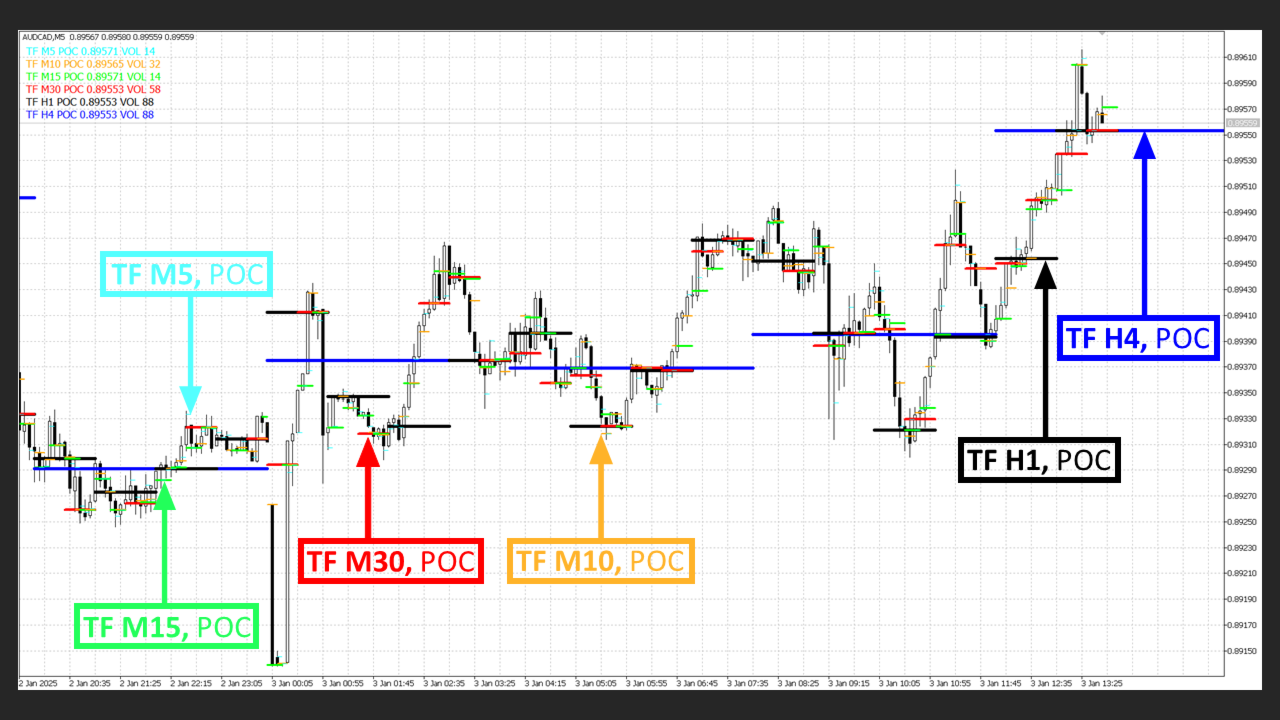
  • Multiple timeframes in one chart: Monitor the POC on up to three different timeframes simultaneously, with their price levels displayed in a clear info panel.
  • Visualization and customization: Offers extensive customization options for visual elements to match your preferences and trading style.

Why is the Volume Bar POC Indicator exceptional?

  • Support and resistance zones: Accurately identify key price levels where the largest trade volume accumulates, which is crucial for planning trade entries and exits.
  • Flexibility: The ability to monitor multiple timeframes simultaneously provides a broader market perspective, all within a single chart.
  • Optimized for all trader levels: Easy to use for beginners and professionals seeking an edge in market analysis.

Compatibility and specifications:

  • Platform: MetaTrader 4 (MT4)
  • Applicability: Suitable for currency pairs, commodities, indices, and other instruments.
  • Timeframes: Supports analysis of up to three timeframes (e.g., M5, H1, D1) simultaneously.
  • Testability: Fully testable in backtests using the MetaTrader Strategy Tester.

Who will benefit from the Volume Bar POC Indicator?

  • Intraday traders: Maximum insight into short-term volume levels for quick decision-making.
  • Swing traders: Easily identify key support and resistance zones on longer timeframes.
  • Strategic investors: Use volume analysis for precise trade planning.

Gain a competitive advantage!

With the Volume Bar POC Indicator, you gain a tool that allows you to see key price levels directly on the chart. Its intuitive use, flexibility, and accuracy help improve your trading decisions and achieve better results.

Try the Volume Bar POC Indicator today and take your trading to the next level!


Recommended products
Beat the market
Levi Kevin Midiwo
Do you want to beat the market? This indicator uses advanced mathematical formulae That include regression analysis to predict market trends. So what happens is  That when the price is above the indicator line as depicted in the screenshot The trend is rising and when the price is below the indicator line the Trend is falling. This opportunities appear multiple times each day enabling You to profit. This indicator makes the trend your friend.
This indicator is a high quality trading tool that tracks and displays the relative strengths of the 8 major currencies (EUR,GBP,USD,AUD,NZD,CHF,CAD,& JPY). The relative strength values are obtained using the slope of a moving average. All 28 major currency pairs are analyzed and the slopes of the moving averages are recorded. The base currency of each currency pair is credited with the slope of the MA, whether positive or negative, and the quoted currency is credited with the MA slope * -1. Thi
The Market Structures Pro indicator finds and displays 5 (five) patterns of the Smart Money Concepts (SMC) system on the chart, namely: Break Of Structures (BoS)       Change of character (CHoCH) Equal Highs & Lows Premium, Equilibrium and Discount zones with Fibo grid High-high, Low-low, High-low and Low-high extremes Patterns are displayed for two modes - Swing and Internal and are easily distinguished by color on the chart. Internal mode features higher contrast colors, finer lines, and smal
Snake NW
Sergei Shishaev
5 (1)
Канальный индикатор "Snake" . Отлично показывает точки входа и выхода. Не перерисовывает! Хорошо подойдет для стратегий с сетками (усреднения), стратегий с пирамидами (стратегий добора), обычной торговли по тренду, торговли на коррекции. Для любых типов инструментов:   валюты, нефть, металлы, криптовалюты. Для любых таймфреймов:   от M1 до D1 . Для любых стилей торговли:   скальпинг, интрадэй, свинг, долгосрок . Используйте в сочетании с трендовым индикатором, чтобы исключить риски входа про
Quick Lines Tool: A User-Friendly Indicator for Drawing Trend Lines and Rectangles Quick Lines Tool is a powerful and intuitive indicator for MetaTrader 4 designed for traders who need fast and effective tools for technical analysis. With this indicator, you can easily create trend lines, support/resistance levels (AP/DW), and rectangles, optimizing your chart marking process. It is ideal for both beginners and professional traders looking to enhance their analysis accuracy and speed. Main adv
Crypto_Forex Indicator "TREND Histogram" for MT4, No Repaint. - TREND Histogram indicator is much more sensitive and efficient than any standard Moving Averages cross. - Indicator can be in 2 colors: Yellow (gold) for bearish trend and Green for bullish trend (colors can be changed in settings). - TREND Histogram has built-in Mobile and PC alerts. - It is great idea to combine this indicator with any other trading methods: Price Action, VSA, other indicators. - This histogram is one of the top
Session Kill zones with panel for quick changes. Asia Killzone London Killzone New York Killzone London Close Killzone In this indicator GMT+2 timings are used that are most common among many brokers. read the image attached in the screenshots to know more about sessions adjustments Session timings can be changed according to your broker timings and day light savings. Thank you :) Always open to feedback and criticism if it helps me provide you more value. - Rahul  My other indicators you may l
UGenesys Volume MT4
Odaine Ramon Mcmillan
50% Off Today Only! Price Goes Back Up at 11 PM (EST) uGenesys Volume Indicator: Your Key to Mastering Market Volume Analysis What Traders Are Saying: "A must-have indicator...really a game-changer." – wuzzy66 "Amazing indicator...strongly recommend to beginners." – joinbehar Understanding Market Volume: Volume in the market is a critical indicator of movement and opportunity. The uGenesys Volume Indicator is specially crafted to pinpoint when the market has the most volume, allowing you to tr
Market Monitor
Rodrigo Rethka Goncalves
Market Monitor – Smart Asset Performance Dashboard for MT4 Turn your MetaTrader 4 into a professional trading intelligence center! Market Monitor is a powerful monitoring tool that displays, in real time, the most relevant performance metrics of each symbol being traded — helping you make faster, smarter, and more strategic decisions. What Does This Indicator Do? Market Monitor scans all open and historical orders, consolidates the data by symbol, and displays everything in visual pa
StatsBar
Maksim Kalachev
StatBar 1.6 Indicator showing balance, earnings for today, yesterday and the day before yesterday. The indicator also shows: - Server; - GMT; - Server time; - Shoulder; - Spread. Description of variables: extern int Magic = "-1"; // Magic for statistics -1 = all 0 = manual extern string Symboll = "-1"; // Symbol for statistics -1 = all 0 = current EURUSD = for EURUSD
FREE
Please contact me at telegram  https://t.me/smartforex7 After purchasing SmartForex Indicator then Use This Indicator...................... SMART EXIT PROFIT LINE Indicator is very Helpful with SmartForex Indicator ........................................ SMART EXIT PROFIT LINE Indicator Attach with SmartForex Indicator after then Red Line Show Exit buy Profit , Green Line show Exit Sell Profit................
FREE
Prime Master Pro: Adaptive Trading Engine with Real-Time Statistical Dashboard and Multi-Level Profit Targets. 100% Non-Repainting. Stop guessing market phases and trading blindly!   PRIME MASTER PRO   is a professional-grade, 100% non-repainting indicator equipped with a dual-core adaptive algorithm and a real-time statistical dashboard. Whether the market is trending or ranging, Prime Master Pro dynamically adapts its logic to find high-probability entry points. Designed for both quick intrad
MT4 Version : https://www.mql5.com/en/market/product/157433 MT5 Version : https://www.mql5.com/en/market/product/167286 Volume Imbalance is a lightweight Volume Profile + Delta Imbalance visualization tool designed to help you spot high-activity price zones, directional pressure, and “empty” price areas inside a configurable lookback range. Unlike classic volume profile that only shows total volume, this indicator splits each price level into: Bull Volume (Buy Pressure) – estimated from bulli
JONUX TPO Market Profile — Professional Market Structure Analysis Ever look at a chart and wonder: where does price actually want to go? Most indicators tell you what price   did .   JONUX TPO Market Profile   shows you   where   the market spent its time — and where it didn't. The difference matters more than most traders realise. Every trading session, institutions leave behind a structural map: price levels they accepted, levels they rejected, and gaps they'll almost certainly return to. JON
Scalper gun
Mikhail Nazarenko
4.5 (2)
Scalper gun   - the main weapon for trade in scalping and swing, with visualization and alert of entry points. The indicator works in both trend and non-trend market conditions. Suitable for beginners and experienced traders. SCALPER GUN surpasses popular top indicators of this site in speed, quality of visualization and accuracy of entry !!! Before buying, download the Scalper gun demo and compare it with similar indicators for scalping in the MT4 tester. Features This is a complete trading sy
The Pairs Cross indicator is a unique tool for negatively correlated trading instruments, such as EURUSD and USDCHF currency pairs. It is based on a concept called pairs trading (or spread trading). Our indicator compares the strength of two currency pairs that are inversely correlated and quickly tells you when it’s time to buy the first pair and short a second pair, and vice versa. This is a straightforward approach to trading currency pairs that works very well. How to you use the Pairs Cro
Waddah Attar Statistical Predictor This indicator show you the Statistical Forecast for any symbol. it depends on a history data . the result show on a new day and still with no change until end of the day . with this indicator you can : know the main direction . know the range of the movement . know high and low in the current day . use indicator levels in any expert you made to auto trade . Preferably used with main symbols like EURUSD, GBPUSD, AUDUSD, NZDUSD, USDJPY, USDCHF, USDCAD, Gold, S
TMA_Channel_PRO_Non_repaint   is a professional non-repainting channel indicator based on   two TMA channels (Fast + Slow) . It is designed for trend direction, volatility structure, pullback entries, and breakout / mean-reversion workflows — with stable historical values. Two TMA channels (Fast + Slow) This indicator draws   two independent TMA channels : Fast TMA   — reacts quicker to price (entry timing, short-term structure) Slow TMA   — smoother, shows the main direction and “market envelop
Online Accounts Manager MT4
Kyra Nickaline Watson-gordon
5 (1)
OneClick Online Account Manager is a powerful utility that helps you to manage all your accounts from a centralized panel. It is suitable for all single account traders and specially for multiple accounts traders. The utility help you to : Monitor status of all accounts on a private web page. Some information such as account connection status, account profit, DD, Balance, Equity, Margin Level, Number of positions and orders, Daily and Weekly profit/loss and also overall summation of all these p
Wick & Liquidity Zones Tracker – Advanced Gold & Forex Cluster Indicator “See Where Big Players Move — Trade Gold & Forex Like an Insider!” Liquidity Zones instantly reveals hidden liquidity clusters, swing reversals, and breakout points, giving you the edge most traders only dream of. Key Features  Liquidity Zone Detection: Automatically identifies unbalanced bullish & bearish candles , marking zones where price is likely to reverse or accelerate. Cluster Analysis: Groups consecutive candles
RSI with Bands
Amirhossein Ghasemi Moroodi
After 7 years, I've decided to release some of my own indicators and Expert Advisors (EAs) for free. If you find them useful, please  Show support with a 5-star rating! Your feedback motivates me to continue providing free tools. Explore my other free tools as well here . _________________________________ "RSI with Bands" Indicator – Better Trading Decisions The "RSI with Bands" Indicator combines the classic RSI with simple bands to show you clearer when to buy or sell. It's desig
FREE
The Accurate Gold indicator is a user-friendly tool that is both  intuitive and simple to use , regardless of traders' level of experience. It is designed for traders seeking precise signals on the M5 timeframe in the gold market. This indicator employs advanced mathematical algorithms to analyze price movements and volume dynamics, generating accurate buy and sell signals. The distinctive features of this indicator, including its non-repainting nature, provide traders with valuable insights in
RBCI hist
Sergey Zhukov
The RBCI hist indicator is an adaptive trend histogram, that eliminates noise using a Low-pass filter, which passes the lower frequencies and cuts off hight frequencies of the price fluctuations. The signal (depending on the strategy chosen by trader) is the intersection of the zero line by the indicator, as well as the change in the histogram color. The change in the histogram color serves as an early signal for opening positions towards the trend. The position of the indicator relative to the
This is the FXTraderariel PowerTrend . It compute a trendfollowing system based on it own algorithm. It gives you a buy or sell signal based on the trend. It based on the Supertrend, but our Version is not repainting. Furthermoore we added some Improvements and you can get an Arrow, Push or Alert when the trend changes. Depending on the settings it and trading style, it can be used for scalping or long-term trading . The indicator can be used on every time frame , but we advise to use it on H1
Fibo Panda is an indicator that can help you predict the end of daily trends. If the daily price has reached the END L4 or END H4, means the Daily volume is enough. If the daily price has reached the Highest or Lowest, means the price has reached the highest or lowest level. Price must touch the End Hi or End Low Level to complete the price movement of each timeframe. A conclusion can be made whether to buy or sell. If the price is in the High Guard and Low Guard areas it means the price is now
Market Profile 3
Hussien Abdeltwab Hussien Ryad
3 (2)
Market Profile 3 MetaTrader 4 indicator  — is a classic Market Profile implementation that can show the price density over time, outlining the most important price levels, value area, and control value of a given trading session. This indicator can be attached to timeframes between M1 and D1 and will show the Market Profile for daily, weekly, monthly, or even intraday sessions. Lower timeframes offer higher precision. Higher timeframes are recommended for better visibility. It is also possible t
FREE
Magneto Breakdown
Vladimir Blednov
5 (2)
Полная версия индикатора находится здесь . Индикатор предназначен для торговли внутри дня. Строит канал по пробою крайних уровней которого вы можете открывать ордер на покупку или продажу. Во флетовом рынке работа ведётся на отбой от этих уровней. Для фильтрации входов используется цветная гибридная скользящая средняя. Настройки по умолчанию предназначены для терминального времени GMT +3 (подходит для большинства брокеров) и для терминалов с пятизначными котировками. Индикация канала и уровней A
FREE
The indicator calculates support and resistance levels. There is a hint in the upper left corner. This hint can be removed. Hint in two languages (English and Russian). The width of support and resistance levels is shown. The number of levels touched is displayed. Works on all timeframes. Can be used as an independent trading system, and as an addition to another system. Download the demo version of the indicator right now and try it in the strategy tester!
Indicator is used for: defining price probability distributions. This allows for a detailed representation of the channel and its borders and forecast the probability of a price appearing at each segment of its fluctuations; defining the channel change moment.   Operation principles and features Indicator analyzes a quote history on lower timeframes and calculates a price probability distribution on higher ones. Forecast algorithms allow the indicator to calculate probability distributions and m
Trend Strength Heatmap (Real-Time) Smart Structure Heatmap is a multi-timeframe trend analysis indicator designed to help traders quickly identify market direction and overall trend strength based on real time. The indicator combines several technical filters into a simple heatmap dashboard, allowing traders to view trend conditions across multiple timeframes in one place. Trend direction is displayed using color signals: Green Uptrend (buy) Red Downtrend (sell) Yellow Sideway
FREE
Buyers of this product also purchase
Scalper Inside PRO
Alexey Minkov
4.74 (69)
An exclusive indicator that utilizes an innovative algorithm to swiftly and accurately determine the market trend. The indicator automatically calculates opening, closing, and profit levels, providing detailed trading statistics. With these features, you can choose the most appropriate trading instrument for the current market conditions. Additionally, you can easily integrate your own arrow indicators into Scalper Inside Pro to quickly evaluate their statistics and profitability. Scalper Inside
Gann Made Easy
Oleg Rodin
4.83 (156)
Gann Made Easy is a professional and easy to use Forex trading system which is based on the best principles of trading using the theory of W.D. Gann. The indicator provides accurate BUY and SELL signals including Stop Loss and Take Profit levels. You can trade even on the go using PUSH notifications. PLEASE CONTACT ME AFTER PURCHASE TO GET TRADING  INSTRUCTIONS AND GREAT EXTRA INDICATORS   FOR FREE! Probably you already heard about the Gann trading methods before. Usually the Gann theory is a ve
M1 Sniper
Oleg Rodin
5 (20)
M1 SNIPER is an easy to use trading indicator system. It is an arrow indicator which is designed for M1 time frame. The indicator can be used as a standalone system for scalping on M1 time frame and it can be used as a part of your existing trading system. Though this trading system was designed specifically for trading on M1, it still can be used with other time frames too. Originally I designed this method for trading XAUUSD and BTCUSD. But I find this method helpful in trading other markets a
Atomic Analyst
Issam Kassas
5 (4)
First of all Its worth emphasizing here that this Trading Indicator is   Non-Repainting , Non Redrawing and Non Lagging Indicator   Indicator, Which makes it ideal from both manual and robot trading.  User manual: settings, inputs and strategy . The Atomic Analyst  is a PA Price Action Indicator that uses Strength and Momentum of the price to find a better edge in the market. Equipped with Advanced filters which help remove noises and false signals, and Increase Trading Potential. Using Multiple
Linear Trend Predictor - A trend indicator that combines entry points and direction support lines. It works on the principle of breaking through the High/Low price channel. The indicator algorithm filters market noise, takes into account volatility and market dynamics. Indicator capabilities Using smoothing methods, it shows the market trend and entry points for opening BUY or SELL orders. Suitable for determining short-term and long-term market movements by analyzing charts on any timeframes.
The " Dynamic Scalper System " indicator is designed for the scalping method of trading within trend waves. Tested on major currency pairs and gold, compatibility with other trading instruments is possible. Provides signals for short-term opening of positions along the trend with additional price movement support. The principle of the indicator. Large arrows determine the trend direction. An algorithm for generating signals for scalping in the form of small arrows operates within trend waves.
Trend Screener
STE S.S.COMPANY
4.79 (95)
Trend Screener Indicator --Professional Trend Trading & Market Scanning System for MetaTrader Unlock the true power of trend trading with Trend Screener Indicator — a complete multi-currency, multi-timeframe trend analysis solution   powered by Fuzzy Logic,Trend Pulse Technology  and advanced market structure algorithms.   Trend Screener transforms your MetaTrader platform into a professional-grade Trend Analyzer and Market Scanner, helping you identify high-probability trend opportunities, ear
Trend Lines PRO
Roman Podpora
5 (1)
TREND LINES PRO    helps understand where the market is truly changing direction. The indicator shows real trend reversals and points where major players re-enter. You see   BOS lines   Trend changes and key levels on higher timeframes — without complex settings or unnecessary noise. Signals don't repaint and remain on the chart after the bar closes. VERSION MT 5     -     Reveals its maximum potential when paired with the   RFI LEVELS PRO  indicator What the indicator shows: Real shifts   tren
NAM Order Blocks
NAM TECH GROUP, CORP.
3.67 (3)
MT4 Multi-timeframe Order Blocks detection indicator. Features - Fully customizable on chart control panel, provides complete interaction. - Hide and show control panel wherever you want. - Detect OBs on multiple timeframes. - Select OBs quantity to display. - Different OBs user interface. - Different filters on OBs. - OB proximity alert. - ADR High and Low lines. - Notification service (Screen alerts | Push notifications). Summary Order block is a market behavior that indicates order collection
GOLD Impulse with Alert
Bernhard Schweigert
4.67 (12)
This indicator is a super combination of our 2 products  Advanced Currency IMPULSE with ALERT  and  Currency Strength Exotics . It works for all time frames and shows graphically impulse of strength or weakness for the 8 main currencies plus one Symbol! This Indicator is specialized to show currency strength acceleration for any symbols like Gold, Exotic Pairs, Commodities, Indexes or Futures. Is first of its kind, any symbol can be added to the 9th line to show  true currency strength accelerat
MTF Supply Demand Zones
Georgios Kalomoiropoulos
4.82 (22)
Next Generation Of Automated Supply And Demand Zones. New and Innovative Algorithm that Works At Any Chart. All Zones Are Being Created Dynamically According To Price Action Of The Market. AMAZING OFFER --> Activations from 5 to 20 for "MTF Supply Demand Zones" and "Automated Trendlines" If you get the MTF Supply Demand Zones you can join the " Trade Like Me " Video Series. It contains 14 Live Sessions where  i am placing trades on Forex, Stocks, Indices and Metals. You will be able to see ho
Currency Strength Exotics
Bernhard Schweigert
4.88 (33)
CURRENTLY 20% OFF ! Best Solution for any Newbie or Expert Trader! This Indicator is specialized to show currency strength for any symbols like Exotic Pairs Commodities, Indexes or Futures. Is first of its kind, any symbol can be added to the 9th line to show true currency strength of Gold, Silver, Oil, DAX, US30, MXN, TRY, CNH etc. This is a unique, high quality and affordable trading tool because we have incorporated a number of proprietary features and a new formula. Imagine how your trading
MetaForecast M4
Vahidreza Heidar Gholami
5 (2)
MetaForecast predicts and visualizes the future of any market based on the harmonics in price data. While the market is not always predictable, if there is a pattern in the price, MetaForecast can predict the future as accurately as possible. Compared to other similar products, Metaforecast can generate more accurate results by analyzing market trends. Input Parameters Past size Specifies the number of bars that MetaForecast uses to create a model for generating future predictions. The model is
Introducing the Delta Volume Profile Indicator - Unleash the Power of Institutional Precision!  Technical Indicator: Are you ready to trade like the pros? The Delta Volume Profile Indicator is no ordinary tool. It’s a high-precision, cutting-edge indicator that puts the power of institutional-grade trading in your hands. This unique indicator analyses delta volume distribution in real-time, revealing the market's hidden buy/sell imbalances that the biggest financial institutions rely on to antic
Order Block Hunter
Noha Mohamed Fathy Younes Badr
5 (10)
Order block hunter indicator is the best indicator for  hunt the order blocks that area where there has been a large concentration of limit orders waiting to be executed Order blocks are identified on a chart by observing previous price action and looking for areas where the price experienced significant movement or sudden changes in direction .This indicator does that for you by using very complicated codes and helps you to take the best areas To buy and sell because it make marks at the best a
Dynamic Forex28 Navigator
Bernhard Schweigert
4.43 (7)
Specials Discount now. The Next Generation Forex Trading Tool. Dynamic Forex28 Navigator is the evolution of our long-time, popular indicators, combining the power of three into one: Advanced Currency Strength28 Indicator (695 reviews) + Advanced Currency IMPULSE with ALERT (520 reviews) + CS28 Combo Signals (recent Bonus) Details about the indicator  https://www.mql5.com/en/blogs/post/758844 What Does The Next-Generation Strength Indicator Offer? Everything you loved about the originals, now
Advanced Supply Demand
Bernhard Schweigert
4.91 (299)
Trading Special – 40% OFF Best Solution for any Newbie or Expert Trader! This indicator is a unique, high quality and affordable trading tool because we have incorporated a number of proprietary features and a new formula. With this update, you will be able to show double timeframe zones. You will not only be able to show a higher TF but to show both, the chart TF, PLUS the higher TF: SHOWING NESTED ZONES. All Supply Demand traders will love it. :) Important Information Revealed Maximize the pot
RFI levels PRO
Roman Podpora
5 (1)
The indicator accurately shows the reversal points and price return zones where the   Major players . You see where new trends are forming and make decisions with maximum precision, maintaining control over every trade. VERSION MT5     -     Reveals its maximum potential when combined with the   TREND LINES PRO   indicator What the indicator shows: Reversal structures and reversal levels with activation at the beginning of a new trend. Display of   TAKE PROFIT   and   STOP LOSS   levels with mi
Adaptive Volatility Range [AVR] is a powerful tool for identifying key trend reversal points. AVR accurately reflects the Average True Range (ATR) of volatility, taking into account the Volume-Weighted Average Price (VWAP). The indicator adapts to any market volatility by calculating the average volatility over a specific period, ensuring a stable rate of profitable trades. You receive not just an indicator but a professional automated trading system , AVR-EA . Advantages: Automated Trading Sys
TPSpro RFI Levels
Roman Podpora
4.86 (28)
INSTRUCTIONS RUS   /   INSTRUCTIONS   ENG   -   VERSION  MT5 Main functions: Displays active zones of sellers and buyers! The indicator displays all the correct first impulse levels/zones for purchases and sales. When these levels/zones are activated, where the search for entry points begins, the levels change color and are filled with certain colors. Arrows also appear for a more intuitive perception of the situation. LOGIC AI - Display of zones (circles) for searching entry points when activa
Super Reversal Indicator with Alert Overview Super Reversal Indicator with Alert is a multi timeframe trading tool designed to identify high probability market reversal opportunities using a combination of stochastic momentum, supply and demand zones, and price rejection signals. The indicator helps traders detect potential turning points in the market with clear visual signals and real time alerts. Key Features Multi Timeframe Stochastic Analysis Uses stochastic oscillator from a higher timefra
BTMM State Engine Pro is a MetaTrader 4 indicator for traders who use the Beat The Market Maker approach: Asian session context, kill zone timing, level progression, peak formation detection, and a multi-pair scanner from a single chart. It combines cycle state logic with a built-in scanner dashboard so you do not need the same tool on many charts at once. What it does Draws the Asian session range; session times can follow broker server offset or be set in inputs. Tracks level progression (L
TrendLine PRO MT4
Evgenii Aksenov
4.83 (167)
The Trend Line PRO indicator is an independent trading strategy. It shows the trend change, the entry point to the transaction, as well as automatically calculates three levels of Take Profit and Stop Loss protection. Trend Line PRO is perfect for all Meta Trader symbols: currencies, metals, cryptocurrencies, stocks and indices. The indicator is used in trading on real accounts, which confirms the reliability of the strategy. Robots using   Trend Line PRO   and real Signals can be found here:   
LIMITED TIME SALE - 30% OFF! WAS $50 - NOW JUST $35! Profit from market structure changes as price reverses and pulls back. The market structure reversal alert indicator identifies when a trend or price move is approaching exhaustion and ready to reverse. It alerts you to changes in market structure which typically occur when a reversal or major pullback are about to happen. The indicator identifies breakouts and price momentum initially, every time a new high or low is formed near a po
Currency Strength Wizard is a very powerful indicator that provides you with all-in-one solution for successful trading. The indicator calculates the power of this or that forex pair using the data of all currencies on multiple time frames. This data is represented in a form of easy to use currency index and currency power lines which you can use to see the power of this or that currency. All you need is attach the indicator to the chart you want to trade and the indicator will show you real str
Volatility Trend System - a trading system that gives signals for entries. The volatility system gives linear and point signals in the direction of the trend, as well as signals to exit it, without redrawing and delays. The trend indicator monitors the direction of the medium-term trend, shows the direction and its change. The signal indicator is based on changes in volatility and shows market entries. The indicator is equipped with several types of alerts. Can be applied to various trading ins
FX Power MT4 NG
Daniel Stein
4.95 (21)
FX Power: Analyze Currency Strength for Smarter Trading Decisions Overview FX Power is your go-to tool for understanding the real strength of currencies and Gold in any market condition. By identifying strong currencies to buy and weak ones to sell, FX Power simplifies trading decisions and uncovers high-probability opportunities. Whether you’re looking to follow trends or anticipate reversals using extreme delta values, this tool adapts seamlessly to your trading style. Don’t just trade—trade
Trend indicator AI
Ramil Minniakhmetov
4.49 (84)
Trend Ai indicator is great tool that will enhance a trader’s market analysis by combining trend identification with actionable entry points and reversal alerts.  This indicator empowers users to navigate the complexities of the forex market with confidence and precision Beyond the primary signals, Trend Ai indicator identifies secondary entry points that arise during pullbacks or retracements, enabling traders to capitalize on price corrections within the established trend. Important Advantage
Auto Optimized Parabolic RSI: Advanced 3D Momentum Engine Most retail indicators fail because they rely on static inputs that break the moment market volatility shifts. Auto Optimized Parabolic RSI solves the problem of "indicator decay" by continuously recalculating its own mathematical edge, bringing institutional-grade quantitative adaptation directly to your MT5 terminal. The Core Advantage: Custom In-Memory 3D Optimization   Standard auto-optimizers often freeze the MT5 platform because the
Matrix Arrow Indicator MT4
Juvenille Emperor Limited
5 (3)
Matrix Arrow Indicator MT4  is a unique 10 in 1 trend following 100% non-repainting  multi-timeframe indicator that can be used on all symbols/instruments: forex, commodities, cryptocurrencies, indices, stocks.  Matrix Arrow Indicator MT4 will determine the current trend at its early stages, gathering information and data from up to 10 standard indicators, which are: Average Directional Movement Index (ADX) Commodity Channel Index (CCI) Classic Heiken Ashi candles Moving Average Moving Avera
More from author
The   Volume Bar POC Indicator   is an innovative tool that provides precise visualization of key price levels (Point of Control, POC) based on tick volume trades. This indicator analyzes each price point within individual candles and displays the most significant levels, which can be used as strong support and resistance zones. Ideal for both intraday and long-term trading strategies. How does the Volume Bar POC Indicator work? The indicator uses an advanced process to calculate the POC during
Prop Trade Assistant — Overview of a Smart Trading Account Manager Prop Trade Assistant is a tool designed for systematic traders and those who strictly follow proper money management rules. It is suitable both for users of prop firm accounts (e.g. FTMO, MFF, The Funded Trader, MyForexFunds, etc.) and for traders operating private accounts who want full control over risk and rule compliance. The tool functions as a risk management utility and monitoring dashboard, tracking drawdown, current PnL
FREE
Nash Professional
Michal Hrubes
5 (2)
Nash Professional – Advanced Automated Trading System for Forex A Comprehensive Solution for Efficient Trading Nash Professional is an advanced automated trading system designed for precise position management based on dynamic market analysis. The system is optimized for various market conditions and supports trading across 28 major and cross-currency pairs: EUR/USD, GBP/USD, USD/JPY, USD/CHF, AUD/USD, NZD/USD, USD/CAD, EUR/GBP, EUR/JPY, EUR/CHF, EUR/AUD, EUR/NZD, EUR/CAD, GBP/JPY, GBP/CHF, GB
SAR Vision MTF – Multi-timeframe Parabolic SAR Indicator for MT5 SAR Vision MTF is a multi-timeframe technical analysis tool that displays Parabolic SAR values from higher timeframes directly on the current chart. It is designed to assist traders in analyzing broader market trends without switching between multiple charts. Key Features Multi-timeframe functionality – View Parabolic SAR signals from higher timeframes (e.g., M5, M15, H1, H4) on lower timeframe charts. Customizable appearance – Mo
Forex Atlas
Michal Hrubes
Forex Atlas – Systematic Portfolio Trading System Launch Access Pricing Launch price: 699 USD (first 10 users) Founders price: 1199 USD (next 10 users) Final price: 2199 USD The price will gradually increase with the growing number of users and with the extension of the live trading history. Early adopters gain access to the system at a significantly lower price before the product reaches its full market value. System Overview Forex Atlas is designed as a systematic multi-strategy, multi-mark
Filter:
No reviews
Reply to review