Volume Bar POC

Volume Bar POC 인디케이터는 틱 거래량을 기반으로 주요 가격 수준(Point of Control, POC)을 정확하게 시각화할 수 있는 혁신적인 도구입니다. 이 인디케이터는 각 캔들 내의 모든 가격 포인트를 분석하여 가장 중요한 가격 수준을 표시하며, 강력한 지지 및 저항 영역으로 활용할 수 있습니다. 데이 트레이딩 및 장기 거래 전략에 이상적입니다.

Volume Bar POC 인디케이터는 어떻게 작동합니까?

이 인디케이터는 각 캔들이 형성되는 동안 POC를 계산하기 위해 고급 프로세스를 사용합니다:

  1. 캔들이 열릴 때 테이블 생성:

    • 새 캔들이 열리면 인디케이터는 다음 데이터를 포함하는 내부 테이블을 생성합니다:
      • 가격: 캔들의 Low와 High 사이의 모든 가격 수준.
      • 거래량: 각 가격 수준에서 발생한 틱 수(틱 거래량).
    • 테이블은 캔들 범위 내의 모든 가격 포인트를 동적으로 포함합니다.
  2. 캔들이 형성되는 동안 테이블 업데이트:

    • High와 Low 값이 변할 때마다 새로운 가격 수준이 테이블에 추가됩니다.
    • 시장(Bid/Ask 가격)이 특정 가격 수준을 통과할 때마다 해당 수준의 거래량이 증가합니다.
  3. POC(Point of Control) 계산:

    • 인디케이터는 어느 가격 수준이 가장 높은 거래량을 가지는지 지속적으로 확인합니다.
    • POC는 틱 수 또는 거래량이 가장 많은 가격 수준으로 정의됩니다.
    • 이 정보는 동적으로 업데이트되며, 캔들이 형성되는 동안 항상 가장 활발한 가격 수준을 표시합니다.

주요 특징 및 장점:

  • 틱 거래량 분석: 틱 거래량을 사용하여 높은 정확도를 보장하며, MetaTrader 4 플랫폼이 지원하는 모든 시장에서 사용 가능합니다.
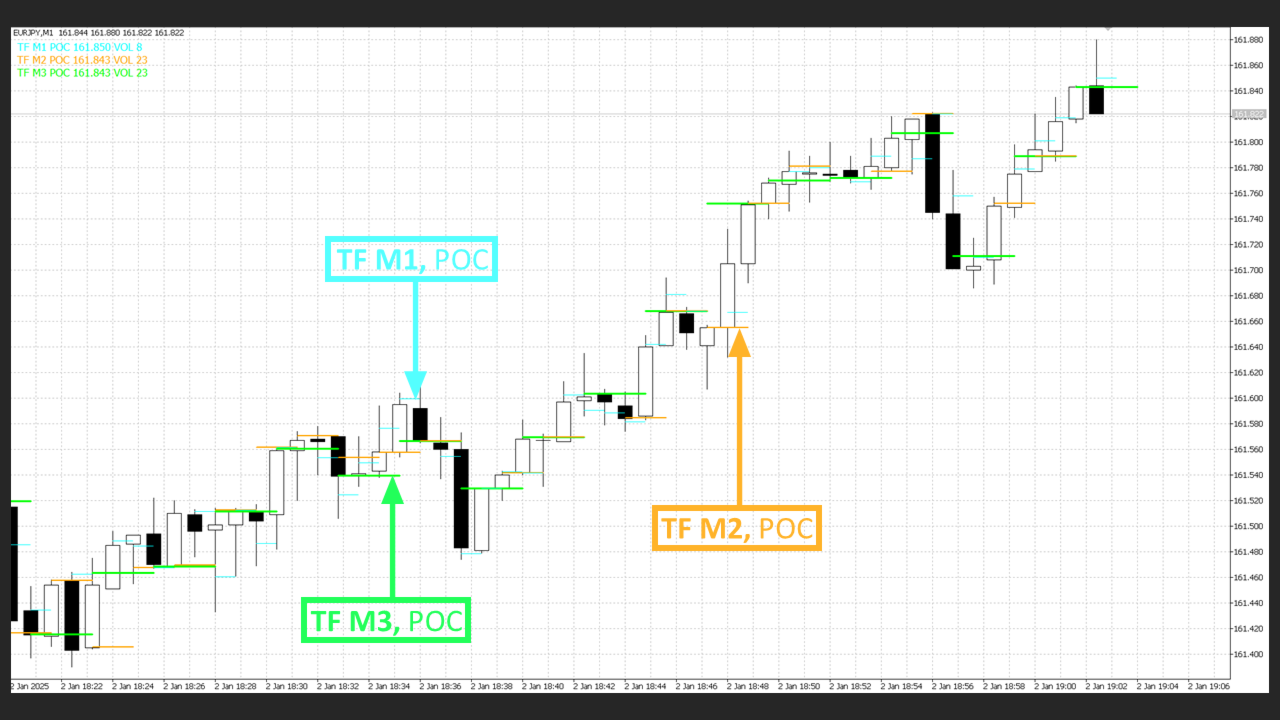
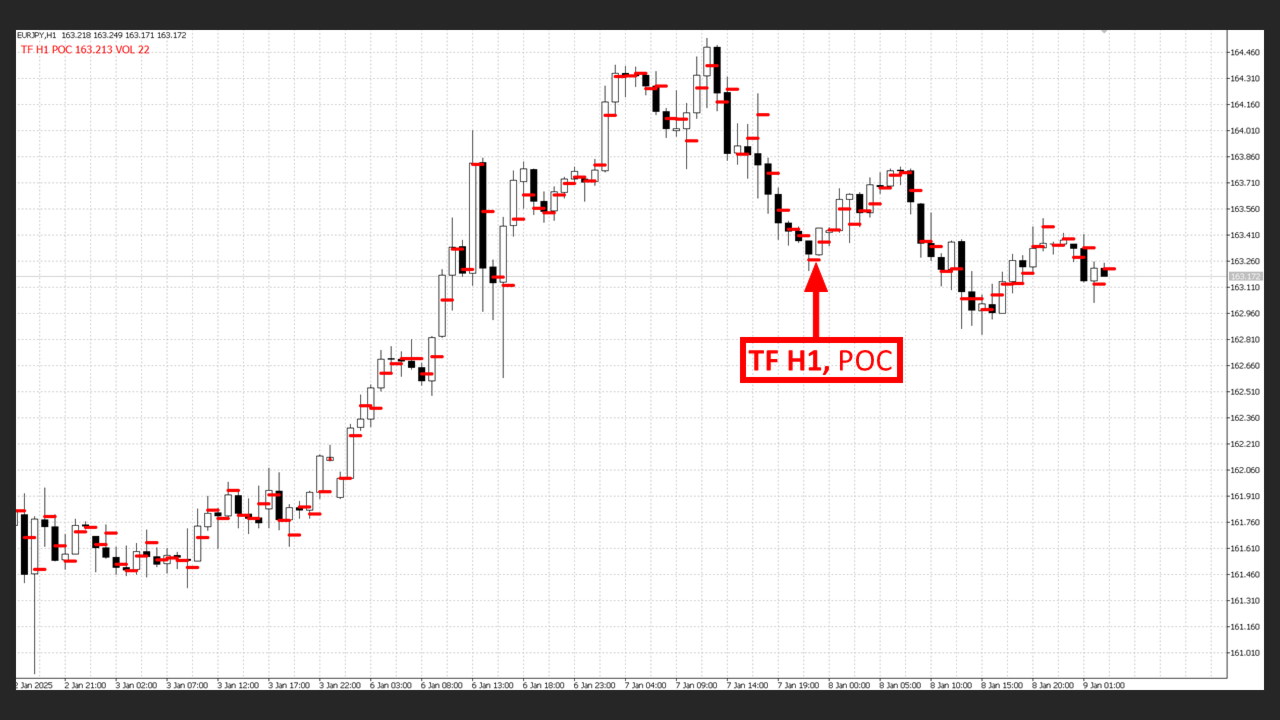
  • 캔들에 직접 POC 표시: 인디케이터는 각 개별 캔들의 POC를 표시하여, 거래량이 가장 많은 주요 가격 수준을 즉시 식별할 수 있습니다.
  • 실시간 데이터: POC는 인디케이터가 차트에 추가된 순간부터 계산됩니다. 과거 데이터는 소급적으로 표시되지 않아 현재 시장 상황의 정확한 분석이 가능합니다.
  • 전략 테스터에서 테스트 가능: 전략 테스터에서 완전한 기능을 발휘하여 거래 시스템을 쉽게 테스트하고 최적화할 수 있습니다.
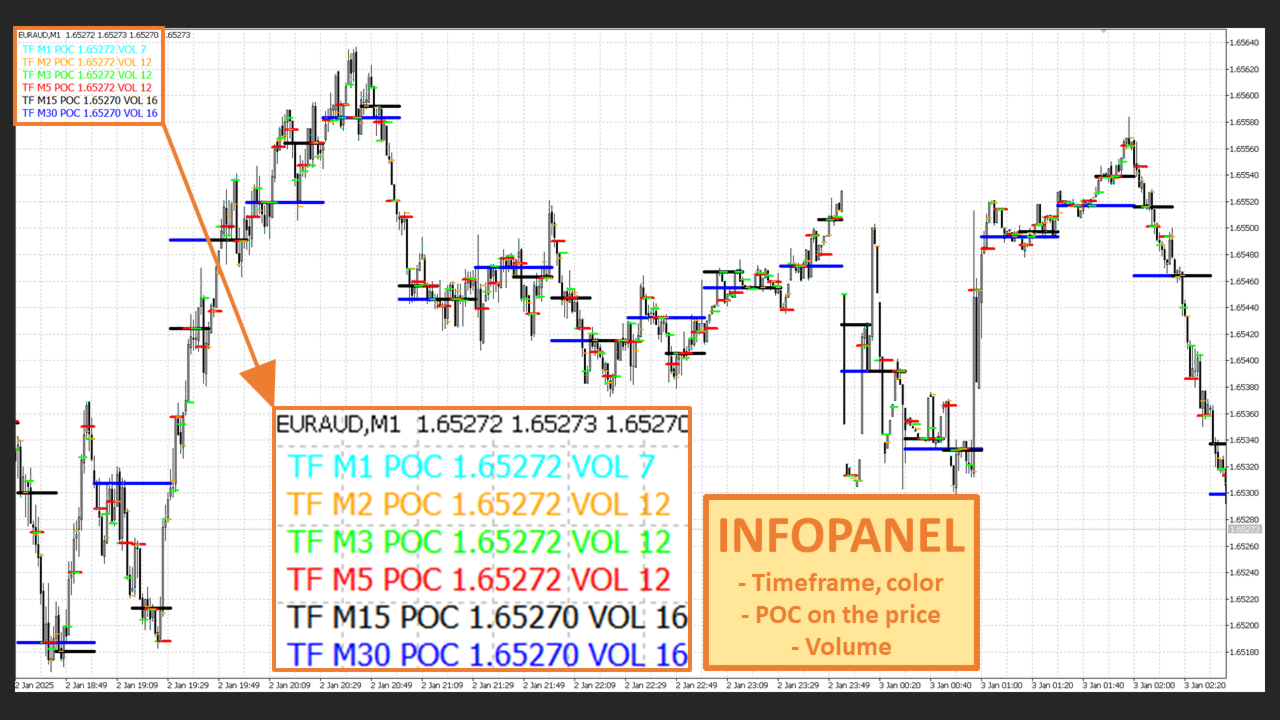
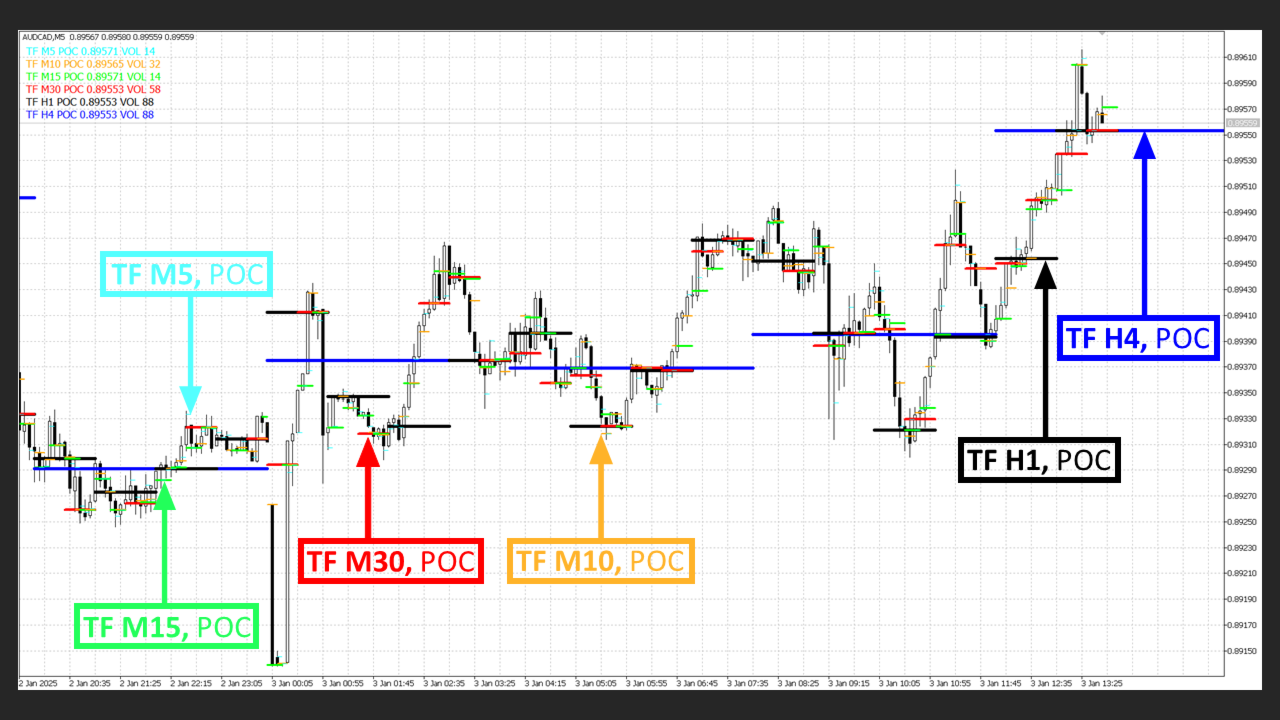
  • 하나의 차트에서 여러 시간 프레임 지원: 최대 3개의 서로 다른 시간 프레임의 POC를 동시에 모니터링하며, 정보 패널에 가격 수준을 명확히 표시합니다.
  • 시각화 및 사용자 정의: 거래 스타일과 선호도에 맞게 시각적 요소를 광범위하게 사용자 정의할 수 있는 옵션을 제공합니다.

Volume Bar POC 인디케이터가 특별한 이유:

  • 지지 및 저항 영역: 가장 많은 거래량이 축적되는 주요 가격 수준을 정확하게 식별하여 거래 진입 및 종료 계획을 세우는 데 필수적입니다.
  • 유연성: 여러 시간 프레임을 동시에 모니터링할 수 있는 기능은 단일 차트 내에서 시장에 대한 더 넓은 관점을 제공합니다.
  • 모든 수준의 트레이더를 위해 최적화: 초보자와 시장 분석에서 경쟁 우위를 찾는 전문가 모두 쉽게 사용할 수 있습니다.

호환성 및 사양:

  • 플랫폼: MetaTrader 4 (MT4)
  • 적용성: 통화 쌍, 상품, 지수 및 기타 금융 상품에 적합.
  • 시간 프레임: 최대 3개의 시간 프레임(M5, H1, D1 등)을 동시에 분석 지원.
  • 테스트 가능성: MetaTrader 전략 테스터를 사용하여 완벽하게 테스트 가능.

Volume Bar POC 인디케이터는 누구에게 적합합니까?

  • 데이 트레이더: 단기 거래량 수준에 대한 최대 정보를 제공하여 신속한 의사결정을 지원.
  • 스윙 트레이더: 더 긴 시간 프레임에서 중요한 지지 및 저항 영역을 쉽게 식별 가능.
  • 전략적 투자자: 거래 계획을 정확하게 세우기 위한 거래량 분석 활용.

경쟁 우위를 확보하세요!

Volume Bar POC 인디케이터를 사용하면 차트에서 주요 가격 수준을 직접 볼 수 있습니다. 직관적인 사용성, 유연성 및 정확성을 통해 거래 결정을 개선하고 더 나은 결과를 달성할 수 있습니다.

지금 Volume Bar POC 인디케이터를 사용해보고 거래를 한 단계 끌어올리세요!


추천 제품
Beat the market
Levi Kevin Midiwo
Do you want to beat the market? This indicator uses advanced mathematical formulae That include regression analysis to predict market trends. So what happens is  That when the price is above the indicator line as depicted in the screenshot The trend is rising and when the price is below the indicator line the Trend is falling. This opportunities appear multiple times each day enabling You to profit. This indicator makes the trend your friend.
This indicator is a high quality trading tool that tracks and displays the relative strengths of the 8 major currencies (EUR,GBP,USD,AUD,NZD,CHF,CAD,& JPY). The relative strength values are obtained using the slope of a moving average. All 28 major currency pairs are analyzed and the slopes of the moving averages are recorded. The base currency of each currency pair is credited with the slope of the MA, whether positive or negative, and the quoted currency is credited with the MA slope * -1. Thi
Market Structures Pro MT4
Andrei Novichkov
5 (1)
The Market Structures Pro indicator finds and displays 5 (five) patterns of the Smart Money Concepts (SMC) system on the chart, namely: Break Of Structures (BoS)       Change of character (CHoCH) Equal Highs & Lows Premium, Equilibrium and Discount zones with Fibo grid High-high, Low-low, High-low and Low-high extremes Patterns are displayed for two modes - Swing and Internal and are easily distinguished by color on the chart. Internal mode features higher contrast colors, finer lines, and smal
Snake NW
Sergei Shishaev
5 (1)
Канальный индикатор "Snake" . Отлично показывает точки входа и выхода. Не перерисовывает! Хорошо подойдет для стратегий с сетками (усреднения), стратегий с пирамидами (стратегий добора), обычной торговли по тренду, торговли на коррекции. Для любых типов инструментов:   валюты, нефть, металлы, криптовалюты. Для любых таймфреймов:   от M1 до D1 . Для любых стилей торговли:   скальпинг, интрадэй, свинг, долгосрок . Используйте в сочетании с трендовым индикатором, чтобы исключить риски входа про
Quick Lines Tool
Aleksandr Bacho
빠른 선 도구:추세선 및 사각형을 플로팅하기위한 편리한 표시기 빠른 라인 도구는 기술적 분석을위한 빠르고 효과적인 도구가 필요한 상인을 위해 설계된 메타 트레이더 4 에 대한 강력하고 직관적 인 지표입니다. 이 표시기를 사용하면 추세선,지지/저항 수준 및 직사각형을 쉽게 만들어 차트 레이아웃 프로세스를 최적화 할 수 있습니다. 이 표시기는 분석의 정확성과 속도를 향상시키려는 초보자 및 전문 거래자 모두에게 이상적입니다. 주요 이점 직관적 인 인터페이스:"표시"기능을 지원하는 사용자 친화적 인 버튼 패널을 통해 모든 기능을 제어 할 수 있습니다./숨기기"를 통해 방해를 최소화합니다. 구성의 유연성:사용자 정의 가능한 색상,선 스타일 및 두께는 물론 거래 스타일에 맞게 버튼 크기 및 위치를 조정할 수 있습니다. 다중 시간 프레임 지원:추세선 및 사각형은 현재 및 하위 시간대에 표시되며 모든 시간대에는 추세선 및 키 단추가 표시됩니다. 안정적인 위치:객체는
Trend Histogram md
DMITRII GRIDASOV
MT4용 Crypto_Forex 지표 "TREND 히스토그램", 리페인트 불필요 - TREND 히스토그램 지표는 표준 이동 평균 교차 분석보다 훨씬 민감하고 효율적입니다. - 지표는 두 가지 색상으로 제공됩니다. 약세 추세는 노란색(금색), 강세 추세는 녹색(색상은 설정에서 변경 가능). - TREND 히스토그램에는 모바일 및 PC 알림 기능이 내장되어 있습니다. - 이 지표를 다른 거래 방식(가격 변동, VSA, 기타 지표)과 함께 사용하면 더욱 효과적입니다. .......................................................................... 여기를 클릭하여 고품질 트레이딩 로봇과 지표를 확인하세요! MQL5 웹사이트에서만 제공되는 오리지널 제품입니다.
Session Kill zones with panel for quick changes. Asia Killzone London Killzone New York Killzone London Close Killzone In this indicator GMT+2 timings are used that are most common among many brokers. read the image attached in the screenshots to know more about sessions adjustments Session timings can be changed according to your broker timings and day light savings. Thank you :) Always open to feedback and criticism if it helps me provide you more value. - Rahul  My other indicators you may l
UGenesys Volume MT4
Odaine Ramon Mcmillan
50% Off Today Only! Price Goes Back Up at 11 PM (EST) uGenesys Volume Indicator: Your Key to Mastering Market Volume Analysis What Traders Are Saying: "A must-have indicator...really a game-changer." – wuzzy66 "Amazing indicator...strongly recommend to beginners." – joinbehar Understanding Market Volume: Volume in the market is a critical indicator of movement and opportunity. The uGenesys Volume Indicator is specially crafted to pinpoint when the market has the most volume, allowing you to tr
Market Monitor
Rodrigo Rethka Goncalves
Market Monitor – Smart Asset Performance Dashboard for MT4 Turn your MetaTrader 4 into a professional trading intelligence center! Market Monitor is a powerful monitoring tool that displays, in real time, the most relevant performance metrics of each symbol being traded — helping you make faster, smarter, and more strategic decisions. What Does This Indicator Do? Market Monitor scans all open and historical orders, consolidates the data by symbol, and displays everything in visual pa
StatsBar
Maksim Kalachev
StatBar 1.6 Indicator showing balance, earnings for today, yesterday and the day before yesterday. The indicator also shows: - Server; - GMT; - Server time; - Shoulder; - Spread. Description of variables: extern int Magic = "-1"; // Magic for statistics -1 = all 0 = manual extern string Symboll = "-1"; // Symbol for statistics -1 = all 0 = current EURUSD = for EURUSD
FREE
Please contact me at telegram  https://t.me/smartforex7 After purchasing SmartForex Indicator then Use This Indicator...................... SMART EXIT PROFIT LINE Indicator is very Helpful with SmartForex Indicator ........................................ SMART EXIT PROFIT LINE Indicator Attach with SmartForex Indicator after then Red Line Show Exit buy Profit , Green Line show Exit Sell Profit................
FREE
MT4 버전: https://www.mql5.com/en/market/product/157433 MT5 버전: https://www.mql5.com/en/market/product/167286 볼륨 불균형(Volume Imbalance)은 가벼운 볼륨 프로파일과 델타 불균형 시각화 도구로, 설정 가능한 조회 범위 내에서 거래량이 많은 가격대, 방향성 압력, 그리고 거래량이 적은 가격대를 파악하는 데 도움을 줍니다. 총 거래량만 보여주는 기존 볼륨 프로파일과 달리, 이 지표는 각 가격대를 다음과 같이 구분합니다. 매수 거래량(매수 압력) – 상승 캔들(종가 > 시가)을 기준으로 추정 매도 거래량(매도 압력) – 하락 캔들(종가 ≤ 시가)을 기준으로 추정 결과적으로 차트 오른쪽에는 TradingView 스타일의 깔끔한 프로파일이 표시되고, 델타 요약 패널에는 가격대별 불균형 비율(Δ%)이 표시되어 매수자와 매도자가 우세했던 지점을 쉽게 확인할 수 있습니다. 또한, 선택한 기간 내
Scalper gun
Mikhail Nazarenko
4.5 (2)
Scalper gun   - the main weapon for trade in scalping and swing, with visualization and alert of entry points. The indicator works in both trend and non-trend market conditions. Suitable for beginners and experienced traders. SCALPER GUN surpasses popular top indicators of this site in speed, quality of visualization and accuracy of entry !!! Before buying, download the Scalper gun demo and compare it with similar indicators for scalping in the MT4 tester. Features This is a complete trading sy
PipTick Pairs Cross MT4
Michal Jurnik
1 (2)
The Pairs Cross indicator is a unique tool for negatively correlated trading instruments, such as EURUSD and USDCHF currency pairs. It is based on a concept called pairs trading (or spread trading). Our indicator compares the strength of two currency pairs that are inversely correlated and quickly tells you when it’s time to buy the first pair and short a second pair, and vice versa. This is a straightforward approach to trading currency pairs that works very well. How to you use the Pairs Cro
Waddah Attar Statistical Predictor This indicator show you the Statistical Forecast for any symbol. it depends on a history data . the result show on a new day and still with no change until end of the day . with this indicator you can : know the main direction . know the range of the movement . know high and low in the current day . use indicator levels in any expert you made to auto trade . Preferably used with main symbols like EURUSD, GBPUSD, AUDUSD, NZDUSD, USDJPY, USDCHF, USDCAD, Gold, S
TMA_Channel_PRO_Non_repaint   is a professional non-repainting channel indicator based on   two TMA channels (Fast + Slow) . It is designed for trend direction, volatility structure, pullback entries, and breakout / mean-reversion workflows — with stable historical values. Two TMA channels (Fast + Slow) This indicator draws   two independent TMA channels : Fast TMA   — reacts quicker to price (entry timing, short-term structure) Slow TMA   — smoother, shows the main direction and “market envelop
Online Accounts Manager MT4
Kyra Nickaline Watson-gordon
5 (1)
OneClick Online Account Manager is a powerful utility that helps you to manage all your accounts from a centralized panel. It is suitable for all single account traders and specially for multiple accounts traders. The utility help you to : Monitor status of all accounts on a private web page. Some information such as account connection status, account profit, DD, Balance, Equity, Margin Level, Number of positions and orders, Daily and Weekly profit/loss and also overall summation of all these p
Wick & Liquidity Zones Tracker – Advanced Gold & Forex Cluster Indicator “See Where Big Players Move — Trade Gold & Forex Like an Insider!” Liquidity Zones instantly reveals hidden liquidity clusters, swing reversals, and breakout points, giving you the edge most traders only dream of. Key Features  Liquidity Zone Detection: Automatically identifies unbalanced bullish & bearish candles , marking zones where price is likely to reverse or accelerate. Cluster Analysis: Groups consecutive candles
RSI with Bands
Amirhossein Ghasemi Moroodi
7년의 개발 끝에 제가 개인적으로 만든 일부 지표와 전문가 어드바이저(EA)를 무료로 공개하기로 결정했습니다. 유용하다고 생각되면 5성급 평가로 지원해 주세요! 여러분의 피드백이 무료 도구를 계속 제공하는 원동력입니다. 저의 다른 무료 도구들도 여기 에서 확인해 보세요. _________________________________ "RSI 밴드" 지표 – 더 나은 거래 결정 "RSI 밴드" 지표는 클래식 RSI에 단순한 밴드를 결합하여 매수 또는 매도할 최적의 시기를 더 명확하게 보여줍니다. 시장에 진입하고 탈출하는 최적의 타이밍을 포착하는 데 도움을 주도록 설계되었습니다. 주요 혜택: 정밀한 과매수 & 과매도 분석 : 진정한 시장의 극단을 부각시켜 공통적인 가짜 신호의 함정을 피하는 밴드가 추가된 RSI를 향상시킵니다. 명확한 신호 : 가격이 너무 높거나 낮을 때 쉽게 볼 수 있어 거래 결정을 내릴 수 있습니다. 더 나은 타이밍 : 밴드는 기존
FREE
Accurate Gold 지표는 트레이더들의 경험 수준과 관계없이 직관적이고 사용하기 쉬운 사용자 친화적인 도구입니다. 이 지표는 황금 시장의 M5 시간 프레임에서 정확한 신호를 찾는 트레이더들을 위해 설계되었습니다. 이 지표는 가격 움직임과 거래량 동태를 분석하기 위해 고급 수학적 알고리즘을 사용하여 정확한 매수 및 매도 신호를 생성합니다. 이 지표의 비리페인트 특성을 포함한 독특한 기능은 트레이더들에게 잠재적인 시장 반전에 대한 가치 있는 통찰력을 제공하여 판단력 있은 의사 결정을 가능케 합니다. 차트 상의 시각적 표현과 함께 청취 가능한 경고 및 푸시 알림이 사용자 경험을 향상시켜 황금 트레이더들의 도구 상자에 정확성과 신뢰성을 찾는 데 유용한 추가 요소가 됩니다. $ XX – 한정 기간 동안 가격은 최초 5명의 지지자를 위해 $ XX 에 유지됩니다. (% 매진) $88 – 그 후에는 $88의 출시 가격으로 복원됩니다.  $88 + X ($100) – 매
RBCI hist
Sergey Zhukov
The RBCI hist indicator is an adaptive trend histogram, that eliminates noise using a Low-pass filter, which passes the lower frequencies and cuts off hight frequencies of the price fluctuations. The signal (depending on the strategy chosen by trader) is the intersection of the zero line by the indicator, as well as the change in the histogram color. The change in the histogram color serves as an early signal for opening positions towards the trend. The position of the indicator relative to the
This is the FXTraderariel PowerTrend . It compute a trendfollowing system based on it own algorithm. It gives you a buy or sell signal based on the trend. It based on the Supertrend, but our Version is not repainting. Furthermoore we added some Improvements and you can get an Arrow, Push or Alert when the trend changes. Depending on the settings it and trading style, it can be used for scalping or long-term trading . The indicator can be used on every time frame , but we advise to use it on H1
Fibo Panda is an indicator that can help you predict the end of daily trends. If the daily price has reached the END L4 or END H4, means the Daily volume is enough. If the daily price has reached the Highest or Lowest, means the price has reached the highest or lowest level. Price must touch the End Hi or End Low Level to complete the price movement of each timeframe. A conclusion can be made whether to buy or sell. If the price is in the High Guard and Low Guard areas it means the price is now
Market Profile 3
Hussien Abdeltwab Hussien Ryad
3 (2)
Market Profile 3 MetaTrader 4 indicator  — is a classic Market Profile implementation that can show the price density over time, outlining the most important price levels, value area, and control value of a given trading session. This indicator can be attached to timeframes between M1 and D1 and will show the Market Profile for daily, weekly, monthly, or even intraday sessions. Lower timeframes offer higher precision. Higher timeframes are recommended for better visibility. It is also possible t
FREE
Magneto Breakdown
Vladimir Blednov
5 (2)
Полная версия индикатора находится здесь . Индикатор предназначен для торговли внутри дня. Строит канал по пробою крайних уровней которого вы можете открывать ордер на покупку или продажу. Во флетовом рынке работа ведётся на отбой от этих уровней. Для фильтрации входов используется цветная гибридная скользящая средняя. Настройки по умолчанию предназначены для терминального времени GMT +3 (подходит для большинства брокеров) и для терминалов с пятизначными котировками. Индикация канала и уровней A
FREE
The indicator calculates support and resistance levels. There is a hint in the upper left corner. This hint can be removed. Hint in two languages (English and Russian). The width of support and resistance levels is shown. The number of levels touched is displayed. Works on all timeframes. Can be used as an independent trading system, and as an addition to another system. Download the demo version of the indicator right now and try it in the strategy tester!
Indicator is used for: defining price probability distributions. This allows for a detailed representation of the channel and its borders and forecast the probability of a price appearing at each segment of its fluctuations; defining the channel change moment.   Operation principles and features Indicator analyzes a quote history on lower timeframes and calculates a price probability distribution on higher ones. Forecast algorithms allow the indicator to calculate probability distributions and m
Market Dashboard
Christian Opperskalski
Market Dashboard Indicator gives you advanced information’s about your selected Symbols in MarketWatch Daily Price Movements (M1 – D1) RSI Values with Highlight Function for your current Timeframe & H1 & H4 Profit per Symbol and traded lots (buy & sell) EMA 5 – 100 based on selected period Swap Information (which direction is positive) FIBO Info & Tracking (highlighted FIBO Levels close to current price – based on selected period) One Click ChartOpen   Important: Get informed about new Products
Capitalrecover
Mr Nisit Noijeam
HFT  ZONE MOMENTUM RECOVERY EA_Name ค่า: HFT MTRADER ใช้สำหรับระบุชื่อของ EA เพื่อให้ง่ายต่อการจัดการหรือตรวจสอบในประวัติการเทรด (History) Lot_fix ค่า: 0.02 ใช้กำหนดขนาดของล็อตคงที่ (Fixed Lot Size) ที่ EA จะเปิดในแต่ละคำสั่งเทรด โดยไม่ขึ้นอยู่กับเงื่อนไขอื่น ๆ Lots_X ค่า: 1.5 ตัวคูณล็อต (Lot Multiplier) ซึ่งมักใช้ในการเพิ่มขนาดล็อตในลักษณะการ Martingale หรือ Hedging โดยเมื่อขาดทุนหรือเปิดคำสั่งถัดไป ระบบจะเพิ่มล็อตตามค่าที่กำหนดไว้ High_Low_end_candle ค่า: 10 จำนวนแท่งเทียนที่ใช้ในการคำนวณระ
An indicator of patterns #45 and #46 (Three Falling Peaks and Three Rising Valleys) from Encyclopedia of Chart Patterns by Thomas N. Bulkowski. Parameters: Alerts - show alert when an arrow appears   Push - send a push notification when an arrow appears (requires configuration in the terminal) PeriodBars - indicator period K - an additional parameter that influences the accuracy of pattern shape recognition. The smaller the value is, the smoother the row of peaks/valleys should be, so fewer patt
이 제품의 구매자들이 또한 구매함
Neuro Poseidon MT4
Daria Rezueva
4.93 (30)
Neuro Poseidon is a new indicator by Daria Rezueva. It combines precise trading signals with adaptive TP/SL levels - creating best possible trades as a result! Message me and get  Neuro Poseidon Assistant  as a gift to automize your trading process! What makes it stand out? 1. Proven profitability on all assets and timeframes 2. Only confirmed BUY and SELL signals present on the chart 3. Adaptive TP & SL levels generated by the software for each trade 4. Easy to understand - suitable for all
M1 Sniper
Oleg Rodin
5 (23)
M1 SNIPER 는 사용하기 쉬운 거래 지표 시스템입니다. M1 시간대에 맞춰 설계된 화살표 지표입니다. 이 지표는 M1 시간대 스캘핑을 위한 단독 시스템으로 사용할 수 있으며, 기존 거래 시스템의 일부로도 사용할 수 있습니다. 이 거래 시스템은 M1 시간대 거래용으로 특별히 설계되었지만, 다른 시간대에도 사용할 수 있습니다. 원래는 XAUUSD와 BTCUSD 거래를 위해 이 방법을 설계했지만, 다른 시장 거래에도 유용하다는 것을 알게 되었습니다. 이 지표의 신호는 추세 방향과 반대로 거래될 수 있습니다. 저는 지표의 신호를 활용하여 양방향으로 거래할 수 있도록 돕는 특별한 거래 기법을 알려드립니다. 이 방법은 특별한 동적 지지선과 저항선 가격 영역을 활용하는 것을 기반으로 합니다. 구매하시면 M1 SNIPER 화살표 지표를 바로 다운로드하실 수 있습니다. 또한, 아래 스크린샷에 표시된 Apollo Dynamic SR 지표는 M1 SNIPER 도구를 사용하는 모든 사용자에게 무료로
Gann Made Easy
Oleg Rodin
4.84 (164)
Gann Made Easy 는 mr.의 이론을 사용하여 최고의 거래 원칙을 기반으로 하는 전문적이고 사용하기 쉬운 Forex 거래 시스템입니다. W.D. 간. 이 표시기는 Stop Loss 및 Take Profit Levels를 포함하여 정확한 BUY 및 SELL 신호를 제공합니다. PUSH 알림을 사용하여 이동 중에도 거래할 수 있습니다. 구매 후 거래 방법 안내 및 유용한 추가 지표를 무료로 받으시려면 저에게 연락주세요! 아마도 Gann 거래 방법에 대해 이미 여러 번 들었을 것입니다. 일반적으로 Gann의 이론은 초보자 거래자뿐만 아니라 이미 거래 경험이 있는 사람들에게도 매우 복잡한 것입니다. Gann의 거래 방식은 이론적으로 적용하기 쉽지 않기 때문입니다. 나는 그 지식을 연마하고 Forex 지표에 최고의 원칙을 적용하기 위해 몇 년을 보냈습니다. 표시기는 적용하기가 매우 쉽습니다. 차트에 첨부하고 간단한 거래 권장 사항을 따르기만 하면 됩니다. 지표는 지속적으로 시장 분석
Dynamic Forex28 Navigator
Bernhard Schweigert
4.43 (7)
Dynamic Forex28 Navigator - 차세대 외환 거래 도구. 현재 49% 할인. Dynamic Forex28 Navigator는 오랫동안 인기 있는 지표의 진화형으로, 세 가지의 힘을 하나로 결합했습니다. 고급 통화 Strength28 지표(695개 리뷰) + 고급 통화 IMPULSE with ALERT(520개 리뷰) + CS28 콤보 신호(보너스). 지표에 대한 자세한 정보 https://www.mql5.com/en/blogs/post/758844 차세대 Strength 지표는 무엇을 제공합니까?  원래 지표에서 좋아했던 모든 것이 새로운 기능과 더 높은 정확도로 강화되었습니다. 주요 기능: 독점적인 통화 Strength 공식.  모든 시간대에 걸쳐 부드럽고 정확한 강도선. 추세와 정확한 진입을 식별하는 데 이상적입니다. 역동적인 시장 피보나치 수준(시장 피보나치).  이 지표에만 있는 고유한 기능. 가격 차트가 아닌 통화 강도에 피보나치가 적용됩니다.
Scalper Inside PRO
Alexey Minkov
4.74 (68)
Scalper Inside PRO Scalper Inside PRO is an intraday trend and scalping indicator for MetaTrader 4 that uses an exclusive algorithm to quickly detect market direction and key target levels. It automatically calculates entry, exit and multiple profit targets, and shows detailed performance statistics so you can see how different instruments and strategies performed. This helps you choose the most suitable trading instruments for the current market conditions. Additionally, you can easily integrat
Enigmera
Ivan Stefanov
5 (8)
ENIGMERA: 시장의 핵심 중요: MQL5.com의 데모는 Strategy Tester에서 실행되며 Enigmera의 기능을 완전히 반영하지 못할 수 있습니다. 설명, 스크린샷 및 비디오를 확인하여 자세한 내용을 확인하십시오. 질문이 있으면 언제든지 메시지를 보내주세요! 인디케이터의 코드는 완전히 다시 작성되었습니다. 버전 3.0은 새로운 기능을 추가하고 인디케이터가 처음 출시된 이후 누적된 버그를 수정했습니다. 소개 이 인디케이터 및 거래 시스템은 금융 시장에 대한 주목할 만한 접근 방식입니다. ENIGMERA는 프랙탈 주기를 사용하여 정확하게 지원 및 저항 수준을 계산합니다. 실제 축적 단계를 보여주고 방향과 목표를 제공합니다. 트렌드와 수정 모두에서 작동하는 시스템입니다. 작동 방식 인디케이터의 대부분의 기능은 차트 왼쪽에 있는 버튼을 통해 제어되며, 이를 통해 다양한 시장 상황에 빠르게 대응할 수 있습니다. 버튼 ON/OFF – 인디케이터 전체를 표시하거나 숨깁니다.
KT Alpha Hunter Arrows MT4
KEENBASE SOFTWARE SOLUTIONS
대부분의 화살표 지표는 신호만 보여주고, 나머지 판단은 모두 트레이더에게 맡깁니다. KT Alpha Hunter Arrows는 완성된 트레이딩 플랜을 함께 제공합니다. 각 신호 화살표가 표시될 때마다 차트에는 진입 라인, 손절선, 네 개의 익절 목표, 그리고 현재 종목과 시간대가 지금 거래할 만한 가치가 있는지 알려주는 실시간 엣지 판정이 함께 그려집니다. 포함된 Trade Manager EA는 사용자가 수동으로 진입한 이후의 실행 관리를 맡아, 시장이 흔들리고 감정이 개입되기 쉬운 순간에도 거래 원칙을 유지할 수 있도록 돕습니다. 리페인트 없음. 확정된 캔들 기준 신호만 표시. Forex, 골드, 지수, 그리고 사용자가 거래하는 모든 상품을 위해 설계되었습니다. 주요 기능 캔들이 마감된 후에만 표시되는 비리페인트 매수 및 매도 화살표. 각 신호마다 진입 라인, 구조적 손절선, 네 개의 익절 목표 제공. Edge Dashboard가 현재 차트의 매수와 매도 셋업을 별도로 평가. 판
Trend Catcher ind
Ramil Minniakhmetov
5 (2)
트렌드 캐처 인디케이터 트렌드 캐처 인디케이터는 개발자가 자체 개발한 맞춤형 적응형 트렌드 분석 지표들을 조합하여 시장 가격 움직임을 분석합니다. 단기적인 노이즈를 제거하고 근본적인 모멘텀 강도, 변동성 확대, 가격 구조 움직임에 집중하여 진정한 시장 방향을 파악합니다. 또한 이동 평균, RSI, 변동성 필터와 같은 맞춤형 지표들을 활용하여 가격을 평활화하고 트렌드를 필터링합니다. 실제 운영 모니터링 및 기타 제품은 다음 링크에서 확인하실 수 있습니다: https://www.mql5.com/en/users/mechanic/seller 텔레그램에서는 EA나 설정 파일을 판매하지 않습니다. 사기이니 주의하세요. 모든 설정 파일은 블로그에서 무료로 제공됩니다. 중요! 구매 후 즉시 연락 주시면 사용 방법 및 보너스를 드립니다!
PRO Renko System
Oleg Rodin
5 (30)
PRO Renko System 은 RENKO 차트 거래를 위해 특별히 고안된 매우 정확한 거래 시스템입니다. 이것은 다양한 거래 상품에 적용될 수있는 보편적 인 시스템입니다. 체계는 효과적으로 당신에게 정확한 반전 신호에 접근을 주는 소위 시장 소음을 중화합니다. 이 표시기는 사용하기가 매우 쉽고 신호 생성을 담당하는 매개 변수가 하나만 있습니다. 당신은 쉽게 당신의 선택의 어떤 무역 계기에 공구를 적응시킬 수 있고 renko 막대기의 크기. 나는 항상 당신이 내 소프트웨어로 수익성있게 거래 할 수 있도록 추가 지원을 제공 할 준비가되어 있습니다! 나는 당신에게 행복하고 수익성있는 거래를 기원합니다! 구매 후 저에게 연락하십시오! 내 렌코 차트 생성기를 보내드립니다. 또한 내 개인 권장 사항 및 시스템의 다른 모듈을 무료로 공유 할 것입니다!
Trend Lines PRO
Roman Podpora
5 (1)
트렌드 라인즈 프로       이 지표는 시장이 실제로 어떤 방향으로 전환되는지 파악하는 데 도움이 됩니다. 실제 추세 반전 지점과 주요 시장 참여자들이 다시 진입하는 지점을 보여줍니다. 보시다시피       BOS 라인       복잡한 설정이나 불필요한 노이즈 없이 더 높은 시간대의 추세 변화와 주요 레벨을 확인할 수 있습니다. 신호는 차트에 다시 그려지지 않고 캔들이 마감된 후에도 계속 표시됩니다. VERSION MT 5   -   RFI LEVELS PRO   표시기   와 결합할 때 최대 잠재력을 발휘합니다. 지표가 보여주는 내용: 실제 변화       추세(BOS 라인) 한 번 신호가 나타나면 그 신호는 계속 유효합니다! 이는 신호를 발생시킨 후 변경될 수 있는 리페인팅 방식의 지표와 중요한 차이점입니다. 리페인팅 방식의 지표는 잠재적으로 자금 손실로 이어질 수 있습니다. 이제 더욱 높은 확률과 정확도로 시장에 진입할 수 있습니다. 또한 화살표가 나타난 후 목표가(익절)
Genesis Matrix Pro is a professional multi-timeframe trend detection indicator designed to help traders identify high-quality market alignment with clarity and structure. It combines 12 different technical indicators into one visual alignment matrix, allowing traders to quickly see when market conditions are bullish, bearish, or neutral. A signal is generated only when the selected strategies are aligned, helping reduce noise and improve decision-making. PLEASE CONTACT ME AFTER PURCHASE TO GET
이 제품은 2026년 시장에 맞게 업데이트되었으며 최신 MT5 빌드에 최적화되었습니다. 가격 업데이트 안내: Smart Trend Trading System은 현재 $99 에 제공됩니다. 다음 30회 구매 후 가격은 $199 로 인상됩니다. 특별 혜택: Smart Trend Trading System 구매 후 저에게 개인 메시지를 보내시면 Smart Universal EA를 무료 로 받을 수 있으며, Smart Trend 신호를 자동 거래로 전환할 수 있습니다. Smart Trend Trading System은 리페인트 없음, 재그리기 없음, 지연 없음의 완전한 트레이딩 시스템으로, 더 깨끗한 신호, 더 나은 추세 방향, 그리고 더 체계적인 시장 거래 방식을 원하는 트레이더를 위해 제작되었습니다. Online course , manual and download presets . 이 시스템은 추세 감지, 반전 구간, Smart Cloud, 트레일링 스톱 로직, 지지와 저항, 캔들 색
PZ Trend Trading
PZ TRADING SLU
4.8 (5)
Capture every opportunity: your go-to indicator for profitable trend trading Trend Trading is an indicator designed to profit as much as possible from trends taking place in the market, by timing pullbacks and breakouts. It finds trading opportunities by analyzing what the price is doing during established trends. [ Installation Guide | Update Guide | Troubleshooting | FAQ | All Products ] Trade financial markets with confidence and efficiency Profit from established trends without getting whips
Step into the world of Forex trading with confidence, clarity, and precision using   Gold Indicator   a next-generation tool engineered to take your trading performance to the next level. Whether you’re a seasoned professional or just beginning your journey in the currency markets, Gold Indicator equips you with powerful insights and help you trade smarter, not harder. Built on the proven synergy of three advanced indicators, Gold Indicator focuses exclusively on medium and long-term trends eli
PZ Swing Trading
PZ TRADING SLU
5 (3)
Protect against whipsaws: revolutionize your swing trading approach Swing Trading is the first indicator designed to detect swings in the direction of the trend and possible reversal swings. It uses the baseline swing trading approach, widely described in trading literature. The indicator studies several price and time vectors to track the aggregate trend direction and detects situations in which the market is oversold or overbought and ready to correct. [ Installation Guide | Update Guide | Tro
Current event:  https://c.mql5.com/1/326/A2SR2025_NoMusic.gif A. A2SR이란 무엇입니까 ?   * 선행 기술 지표입니다(재도장 없음, 지연 없음). -- 안내 : https://www.mql5.com/en/blogs/post/734748/page4#comment_16532516 -- 및 https://www.mql5.com/en/users/yohana/blog A2SR에는 지원(수요) 및 저항(공급) 수준을 결정하는 특별한 기술이 있습니다. 우리가 인터넷에서 본 일반적인 방식과 달리 A2SR은 실제 SR 수준을 결정하는 독창적인 개념을 가지고 있습니다. 원래 기술은 인터넷에서 가져온 것이 아니며 인터넷에 게시된 적도 없습니다. A2SR은 거래 스타일에 따라 SR 수준을 자동으로 선택합니다. 시간 프레임을 변경해도 SR 레벨은 그대로 유지됩니다. 사용하는 시간 프레임에서 실제 SR을 얻지 못하기 때문입니다. A2SR은 거래를
BTMM State Engine Pro MT4
Garry James Goodchild
BTMM State Engine Pro is a MetaTrader 4 indicator for traders who use the Beat The Market Maker approach: Asian session context, kill zone timing, level progression, peak formation detection, and a multi-pair scanner from a single chart. It combines cycle state logic with a built-in scanner dashboard so you do not need the same tool on many charts at once. What it does Draws the Asian session range; session times can follow broker server offset or be set in inputs. Tracks level progression (L
Dynamic Scalper System
Vitalyi Belyh
5 (1)
" Dynamic Scalper System " 지표는 추세 파동 내에서 스캘핑 방식으로 거래하도록 설계되었습니다. 주요 통화쌍 및 금에서 테스트되었으며, 다른 거래 상품과의 호환성이 가능합니다. 추가적인 가격 변동 지원을 통해 추세에 따라 단기 포지션 진입 신호를 제공합니다. 지표의 원리 큰 화살표는 추세 방향을 결정합니다. 작은 화살표 형태의 스캘핑 신호를 생성하는 알고리즘은 추세 파동 내에서 작동합니다. 빨간색 화살표는 상승 방향을, 파란색 화살표는 하락 방향을 나타냅니다. 민감한 가격 변동선은 추세 방향으로 그려지며, 작은 화살표의 신호와 함께 작용합니다. 신호는 다음과 같이 작동합니다. 적절한 시점에 선이 나타나면 진입 신호가 형성되고, 선이 있는 동안 미결제 포지션을 유지하며, 완료되면 거래를 종료합니다. 권장되는 작업 시간대는 M1~H4입니다. 화살표는 현재 캔들에 형성되며, 다음 캔들이 이미 시작되었더라도 이전 캔들의 화살표는 다시 그려지지 않습니다. 입력 매개
Neo Wave PRO
Nikolay Raykov
5 (1)
Price & Time Market Structure Indicator A professional market structure tool that analyzes waves through both price and time — not price alone. Main Description NeoWave PRO is a professional market structure indicator for MetaTrader 4 designed for traders who want to move beyond traditional one-dimensional wave tools such as ZigZag, swing indicators, and basic high/low systems. Most wave indicators analyze only one thing: Price. But a real market wave is not only a price movement. A true wave de
MonsterDash Harmonic Indicator
Paul Geirnaerdt
4.54 (26)
MonsterDash Harmonic Indicator is a harmonic pattern dashboard. It recognizes all major patterns. MonsterDash is a dashboard that displays all detected patterns for all symbols and (almost) all timeframes in sortable and scrollable format. Users can add their own user defined patterns . MonsterDash can open and update charts with the pattern found. Settings MonsterDash's default settings are good enough most of the time. Feel free to fine tune them to your needs. The color settings are for thos
Apollo SR Master
Oleg Rodin
5 (2)
Apollo SR Master는 지지/저항 구간에서의 거래를 더욱 쉽고 안정적으로 만들어 주는 특수 기능을 갖춘 지지/저항 지표입니다. 이 지표는 지역 가격의 고점과 저점을 감지하여 시간 지연 없이 실시간으로 지지/저항 구간을 계산합니다. 새롭게 형성된 저항 구간을 확인하기 위해 지표는 해당 저항 구간을 실제 매도 또는 매수 신호로 활용할 수 있음을 나타내는 특수 신호를 표시합니다. 이 경우, 저항 구간의 강도가 높아지고, 따라서 저항 구간에서의 성공적인 거래 가능성도 높아집니다. 이것이 바로 이 지표의 핵심 아이디어입니다. SR 존은 손절매와 이익실현을 더욱 쉽게 할 수 있도록 해줍니다. 신호 방향에 따라 SR 존 위 또는 아래 공간을 손절매로 활용할 수 있습니다. 또한, 반대쪽 SR 존은 잠재적 이익실현 영역으로 활용할 수 있습니다. 또한 Apollo SR Master 지표를 사용하는 모든 사용자에게 "Apollo Price Action System" 지표를 무료로 제공합니다.
Advanced Currency Strength28 Indicator
Bernhard Schweigert
4.91 (657)
현재 40% 할인 초보자 또는 전문가 트레이더를 위한 최고의 솔루션! 이 지표는 우리가 독점 기능과 새로운 공식을 통합했기 때문에 독특하고 고품질이며 저렴한 거래 도구입니다. 단 하나의 차트로 28 Forex 쌍의 통화 강도를 읽을 수 있습니다! 새로운 추세 또는 스캘핑 기회의 정확한 트리거 포인트를 정확히 찾아낼 수 있기 때문에 거래가 어떻게 개선될지 상상해 보십시오. 사용 설명서: 여기를 클릭  https://www.mql5.com/en/blogs/post/697384 그것이 첫 번째, 원본입니다! 쓸모없는 지망생 클론을 사지 마십시오. 더 스페셜  강력한 통화 모멘텀을 보여주는 하위 창의 화살표 GAP가 거래를 안내합니다! 기본 또는 호가 통화가 과매도/과매도 영역(외부 시장 피보나치 수준)에 있을 때 개별 차트의 기본 창에 경고 표시가 나타납니다. 통화 강도가 외부 범위에서 떨어질 때 풀백/반전 경고. 교차 패턴의 특별 경고 추세를 빠르게 볼 수 있는 다중 시간
Auto Optimized Parabolic RSI: 고급 3D 모멘텀 엔진 대부분의 개인 투자자용 보조지표는 시장의 변동성이 변하는 순간 무용지물이 되는 정적인 입력값에 의존하기 때문에 실패합니다. Auto Optimized Parabolic RSI는 자체적인 수학적 우위를 지속적으로 재계산하여 "보조지표 노후화" 문제를 해결하며, 기관급 퀀트 트레이딩의 적응력을 귀하의 MT5 터미널에 직접 제공합니다. 핵심 이점: 맞춤형 인메모리 3D 최적화   표준 자동 최적화 도구들은 일반적인 보조지표 호출로 터미널에 과부하를 일으켜 MT5 플랫폼을 멈추게 하는 경우가 많습니다. 이 도구는 이러한 병목 현상을 완전히 우회합니다. 맞춤형 네이티브 RAM 기반 계산기로 구축된 내부 엔진은 차트를 로드하거나 타임프레임을 변경할 때마다 빛처럼 빠른 3D 그리드 검색을 실행합니다. RSI 기간(주기), SAR 스텝(가속도) 및 SAR 최대치(속도 제한)를 동시에 스캔하여 플랫폼 지연 없이 수만 개의
Advanced Supply Demand
Bernhard Schweigert
4.91 (300)
현재 40% 할인! 초보자나 전문 트레이더를 위한 최고의 솔루션! 이 보조지표는 우리가 다수의 독창적 기능과 새로운 공식을 통합한 독특하고 고품질이며 저렴한 거래 도구입니다. 이 업데이트를 통해 이중 시간대를 표시할 수 있습니다. 더 높은 TF를 표시할 수 있을 뿐만 아니라 차트 TF와 더 높은 TF 모두를 표시할 수 있습니다: 중첩 영역 표시. 모든 Supply Demand 트레이더들이 좋아할 것입니다. :) 중요한 정보 공개 Advanced Supply Demand의 잠재력을 극대화하려면 다음을 방문하십시오. https://www.mql5.com/ko/blogs/post/720245   진입 또는 목표의 명확한 트리거 포인트를 정확히 찾아냄으로 해서 거래가 어떻게 개선될지 상상해 보십시오. 새로운 알고리즘을 기반으로 매수자와 매도자 간의 잠재적인 불균형을 훨씬 더 쉽게 분간할 수 있습니다. 왜냐하면 가장 강한 공급영역과 가장 강한 수요 영역과 과거에 어떻게 진행 되었는지를(이전
이 인디케이터는 엘리어트 파동 이론과 두 가지 방식으로 작동합니다: 자동 작동: 이 모드에서는 인디케이터가 엘리어트 파동 이론에 따라 차트 상의 모든 5개의 모티브 웨이브를 자동으로 감지하고 예측 및 잠재적인 반전 지역을 제공합니다. 또한 중요한 개발 사항을 트레이더에게 알릴 수 있는 경보 및 푸시 메시지를 생성할 수 있는 능력을 갖추고 있습니다. 이 자동 기능은 엘리어트 파동 패턴의 식별과 분석 프로세스를 간소화합니다. 수동 작동: 이 옵션은 엘리어트 파동 이론을 수동으로 다루고 싶은 트레이더를 위해 설계되었습니다. 이를 통해 사용자는 아홉 가지 다른 등급을 사용하여 웨이브를 그릴 수 있습니다. 각 등급은 나타난 후에 차트에 그려진 라인을 조정하여 개별적으로 정의할 수 있습니다. 이 기능은 웨이브를 수동으로 그리는 프로세스를 간소화하며 더 효율적으로 만들어 줍니다. 중요한 점으로 모든 그림 데이터가 미래 참조를 위해 플랫폼 데이터 폴더에 저장된다는 것을 기억해야 합니다. 파라미터:
Introduction to Fractal Pattern Scanner Fractal Indicator refers to the technical indicator that makes use of the fractal geometry found in the financial market. Fractal Pattern Scanner is the advanced Fractal Indicator that brings the latest trading technology after the extensive research and development work in the fractal geometry in the financial market. The most important feature in Fractal Pattern Scanner is the ability to measure the turning point probability as well as the trend probabi
Bull versus Bear
Mohamed Hassan
4.5 (18)
Send us a message after your purchase to receive more information on how to get your  BONUS  for FREE  that works in great combination with Bull vs Bear ! Bull versus Bear is an easy-to-use Forex indicator that gives traders clear and accurate signals based on clear trend retests . Forget about lagging indicators or staring at charts for hours because  Bull vs Bear provides real-time entries with no lag and no repaint, so you can trade with confidence. Bull vs Bear  helps you enter trades during
Scalper Vault
Oleg Rodin
5 (37)
Scalper Vault 는 성공적인 스캘핑에 필요한 모든 것을 제공하는 전문 스캘핑 시스템입니다. 이 표시기는 외환 및 바이너리 옵션 거래자가 사용할 수 있는 완전한 거래 시스템입니다. 권장 시간 프레임은 M5입니다. 시스템은 추세 방향으로 정확한 화살표 신호를 제공합니다. 또한 상단 및 하단 신호와 Gann 시장 수준을 제공합니다.  이 시스템은 사용하기가 매우 쉽습니다. 원하는 시장 지역의 화살표만 따라가면 됩니다. 엑시트는 가격이 적정 수준에 도달하거나 시장의 고점 또는 저점 신호가 나타날 때 수행됩니다.  표시기는 PUSH 알림을 포함한 모든 유형의 경고를 제공합니다. 인디케이터 구매 후 연락주세요. 내 개인 거래 권장 사항과 훌륭한 보너스 지표를 무료로 공유합니다! 나는 당신에게 행복하고 유익한 거래를 기원합니다!
The Propfolio Master Suite is the ultimate all-in-one analytical workstation for professional traders. Combining the power of the Beat The Market Maker (BTMM) methodology, Smart Money Concepts (SND/Liquidity), and Advanced Volume Profile, this suite replaces multiple different indicators with one optimized engine. Monitor up to 14 pairs simultaneously from a single chart, instantly identify market cycles, and seamlessly map institutional footprints with the click of a button. The Command Center
Harmonic Pattern Plus MT4
Young Ho Seo
4.44 (18)
Introduction Harmonic Patterns are best used to predict potential turning point. Traditionally, Harmonic Pattern was identified manually connecting peaks and troughs points in the chart. Manual harmonic pattern detection is painfully tedious and not suitable for everyone. You are often exposed under subjective pattern identification with manual pattern detection. To avoid these limitations, Harmonic Pattern Plus was designed to automate your harmonic pattern detection process. The functionality
제작자의 제품 더 보기
Prop Trade Assistant — 스마트 트레이딩 계좌 관리자 개요 Prop Trade Assistant는 체계적인 트레이더와 엄격한 자금 관리 규칙을 준수하는 트레이더를 위한 도구입니다. FTMO, MFF, The Funded Trader, MyForexFunds 등의 프로프 펌 계좌뿐만 아니라, 리스크와 규칙 준수를 중시하는 개인 계좌 트레이더에게도 적합합니다. 이 도구는 리스크 관리 유틸리티 및 대시보드로 작동하며, 드로우다운, 현재 PnL, 수익 목표 등 주요 계좌 지표를 실시간으로 모니터링합니다. 감정으로 인한 실수를 줄이고 규율 중심의 거래 접근 방식을 강화합니다. 기능 로트 크기, SL, TP, BE 기준 손익 계산 핍, 통화, 퍼센트 단위 입력 지원 부분 청산(30 / 50 / 70%) 및 SL 자동 BE+ 이동 사전 계산된 P/L을 통한 예약 주문 관리 다중 타임프레임에서 CCI 및 RSI 모니터링 일일 수익 및 손실 제한과 자동 포지션 종료 스프레드 초과 시
FREE
Volume Bar POC 인디케이터 는 틱 거래량을 기반으로 주요 가격 수준(Point of Control, POC)을 정확하게 시각화할 수 있는 혁신적인 도구입니다. 이 인디케이터는 각 캔들 내의 모든 가격 포인트를 분석하여 가장 중요한 가격 수준을 표시하며, 강력한 지지 및 저항 영역으로 활용할 수 있습니다. 데이 트레이딩 및 장기 거래 전략에 이상적입니다. Volume Bar POC 인디케이터는 어떻게 작동합니까? 이 인디케이터는 각 캔들이 형성되는 동안 POC를 계산하기 위해 고급 프로세스를 사용합니다: 캔들이 열릴 때 테이블 생성 : 새 캔들이 열리면 인디케이터는 다음 데이터를 포함하는 내부 테이블을 생성합니다: 가격 : 캔들의 Low와 High 사이의 모든 가격 수준. 거래량 : 각 가격 수준에서 발생한 틱 수(틱 거래량). 테이블은 캔들 범위 내의 모든 가격 포인트를 동적으로 포함합니다. 캔들이 형성되는 동안 테이블 업데이트 : High와 Low 값이 변할 때마다 새로
Nash Professional
Michal Hrubes
5 (2)
Nash Professional – 고급 자동화 외환 거래 시스템 효율적인 거래를 위한 종합 솔루션 Nash Professional은 동적 시장 분석을 기반으로 정밀한 포지션 관리를 위해 설계된 고급 자동화 거래 시스템입니다. 이 시스템은 다양한 시장 조건에 최적화되어 있으며, 다음 28개의 주요 및 교차 통화 쌍 거래를 지원합니다. EUR/USD, GBP/USD, USD/JPY, USD/CHF, AUD/USD, NZD/USD, USD/CAD, EUR/GBP, EUR/JPY, EUR/CHF, EUR/AUD, EUR/NZD, EUR/CAD, GBP/JPY, GBP/CHF, GBP/AUD, GBP/NZD, GBP/CAD, AUD/JPY, AUD/CHF, AUD/NZD, AUD/CAD, NZD/JPY, NZD/CHF, NZD/CAD, CAD/JPY, CAD/CHF. Nash Professional은 리스크 관리, 정밀한 진입 전략, 자본 효율성 을 중시하는 체계적인 거래 방식을 원하는
Fully automated EURUSD reversal system focused on long-term performance and controlled risk management. The strategy uses a combination of intelligent grid, entry filtering and dynamic exposure management with the goal of achieving stable results even during periods of increased market volatility. The system actively trades both LONG and SHORT positions and thanks to its high trading activity it is not based on just a few trades per year, but on continuous market participation. Simple and clear
Commodity cross currency pairs such as NZDCAD and AUDCAD have specific market behavior different from major FX pairs such as EURUSD or GBPUSD. These pairs are strongly influenced by commodity prices, interest rates, and the economies of export-oriented countries such as Australia, New Zealand, and Canada. As a result, they often show more stable price range movements, a lower level of chaotic movements, and stronger mean reversion characteristics, which the strategy actively utilizes. Apex Commo
Apex Carry Edge is an automated carry trading strategy focused on long-term trending movements of JPY currency pairs while also profiting from positive swaps during long position holding. JPY currency pairs such as GBPJPY and USDJPY have unique long-term market behavior influenced by interest rate differentials, central bank monetary policies, and global risk sentiment. These pairs are strongly affected by carry trade capital flows and the historically low interest rates of the Japanese Yen. As
SAR Vision MTF
Michal Hrubes
SAR Vision MTF – MT5용 다중 타임프레임 Parabolic SAR 지표 SAR Vision MTF 는 상위 타임프레임의 Parabolic SAR 값을 현재 차트에 직접 표시하는 다중 타임프레임 기술 분석 도구입니다. 여러 차트를 전환하지 않고도 더 넓은 시장 추세를 분석하는 데 도움을 줍니다. 주요 기능 다중 타임프레임 기능 – 상위 타임프레임(예: M5, M15, H1, H4)의 SAR 신호를 하위 타임프레임 차트에서 확인할 수 있습니다. 사용자 지정 가능 – 점 크기, 색상 및 선택한 타임프레임을 사용자 취향에 맞게 조절할 수 있습니다. 명확한 시각적 표현 – 각 타임프레임마다 다른 색상을 사용하여 추세 신호를 구분하기 쉽습니다. 가볍고 효율적 – 다양한 차트 유형에서 원활하게 작동하도록 최적화되었습니다. 사용 사례 추세 관찰 – 상위 타임프레임의 SAR 신호를 모니터링하면 현재 차트 움직임에 대한 추가적인 시장 상황을 파악할 수 있습니다. 잠재적 반전 탐지 – 다
Forex Atlas
Michal Hrubes
Forex Atlas – 시스템 포트폴리오 트레이딩 시스템 Launch Access Pricing Launch price: 699 USD (first 10 users) Founders price: 1199 USD (next 10 users) Final price: 2199 USD 사용자 수가 증가하고 실거래 기록이 확장됨에 따라 가격은 점진적으로 인상됩니다. 초기 사용자들은 제품이 완전한 시장 가치에 도달하기 전에 훨씬 낮은 가격으로 시스템에 접근할 수 있습니다. System Overview Forex Atlas는 시스템 기반의 멀티 전략, 멀티 시장 포트폴리오로 설계되었습니다. 이 시스템은 두 가지 핵심 트레이딩 접근 방식을 결합합니다. trend trading – 중기에서 장기 추세를 포착하는 데 초점을 맞춘 전략 breakout trading – 가격 구조 돌파와 변동성 확장에 반응하는 전략 이 시스템의 목표는 단기 수익의 극대화가 아니라, 리스크를 통제하면서 장기적으로
필터:
리뷰 없음
리뷰 답변