Indicadores técnicos para MetaTrader 5 - 21

Heiken Ashi Dynamic es un indicador para MetaTrader 5 que muestra velas Heiken Ashi directamente en tu gráfico. Puedes elegir entre el modo clásico o un modo suavizado, que hace que los cambios de color sean más claros y fáciles de seguir. Los colores son simples: verde para movimientos al alza y rojo para movimientos a la baja. El modo Clásico reacciona rápido y ayuda a detectar giros con más antelación. El modo Suavizado hace que las tendencias largas se vean más limpias y continuas, ajustand
FREE

El famoso trader y analista brasileño Didi Aguiar creó hace años un estudio con el cruce de 3 Medias Móviles Simples llamado "Agulhada do Didi", luego más tarde también fue llamado Índice Didi, como un indicador separado. El período de esas SMAs son 3, 8 y 20. Tan simple como eso, este enfoque y visión traen un fácil análisis del impulso del mercado y el cambio de tendencia a los operadores que buscan información objetiva (y visual) en sus gráficos. Por supuesto, como siempre, ningún indicador p
FREE

SWIFT SNIPER COMBO - Indicador Avanzado de Señales de Trading (Sin Repintar) Presentación breve: Un sistema de entrada de precisión que fusiona un cruce MA rápido/lento con una sólida confirmación swing-pivot para ofrecer señales de alta probabilidad, niveles TP/SL claros y alertas en tiempo real - creado para operadores que desean señales limpias, sin repintado y una gestión práctica del riesgo. Qué hace (Visión general rápida) SWIFT SNIPER COMBO combina un motor de cruce de medias móviles suav
FREE
Detector de Tendencias Multi-Timeframe EMA Pro Herramienta avanzada de análisis de tendencias EMA con detección de cruces y confirmación de la fuerza de la tendencia en 5 marcos temporales. El Multi-Timeframe EMA Trend Detector Pro es un indicador completo creado para los operadores que confían en estrategias basadas en tendencias. Analiza las medias móviles exponenciales (EMA) de 50, 100 y 200 en cinco plazos clave (M15, M30, H1, H4 y diario) para identificar tendencias fiables, cambios de ten
FREE

Las líneas de resistencia de velocidad son una poderosa herramienta para determinar la tendencia y las líneas de resistencia. El indicador construye líneas utilizando gráficos extremos y fórmulas matemáticas especiales. El indicador se puede utilizar para determinar la dirección de la tendencia y los puntos de inversión.
<---------------------------->
Parámetros del indicador:
"Depth of search" - profundidad (en barras) de búsqueda de gráficos extremos "Back step of search" - distancia mínim
FREE

Wyckoff fans, enjoy!
Idealmente para ser usado con el indicador Weis Waves , pero puede ser fácilmente usado solo, el Waves Sizer pone el rango (en movimiento resultante del Precio) hecho por el Precio en sus oscilaciones de mercado. Usted puede controlar que tan precisas o sueltas serán las oscilaciones. Esta herramienta es muy útil para saber visualmente cuanto ha recorrido el Precio en su Timeframe. De esta forma puedes confrontar este nivel de esfuerzo con el Volumen resultante, etc... Indi
FREE
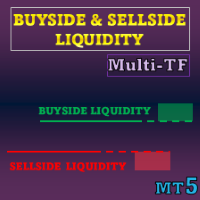
Oferta especial : TODAS LAS HERRAMIENTAS , solo $35 cada una. Las nuevas herramientas costarán $30 durante la primera semana o para las primeras 3 compras ! Canal de Trading Tools en MQL5 : únete a mi canal de MQL5 para recibir mis últimas novedades Este indicador visualiza niveles de liquidez y zonas de liquidez basados en conceptos de ICT, además de Liquidity Voids para resaltar desplazamientos de precio unidireccionales. Se centra en dónde tienden a agruparse las órd

Indicador de soporte-resistencia El indicador "Soporte Resistencia" es una herramienta versátil diseñada para ayudar a los operadores a identificar los niveles clave de soporte y resistencia basándose en un algoritmo subyacente. Estos niveles indican los puntos de precio en los que un activo ha experimentado históricamente presiones de compra (soporte) o de venta (resistencia). El indicador permite a los operadores visualizar estos niveles en sus gráficos, lo que facilita la toma de decisiones i
FREE

The TMA Centered Bands Indicator for MT5 draws bands on the chart and shows the overall price trend. It displays three bands - the lower and upper boundaries of the channel and the median. The bands are made up of moving averages, and each of them has an MA period. The name TMA comes from triangular moving averages, as the indicator draws triangular bands. The price will fluctuate between these ranges whenever the trend changes direction, thus creating entry and exit points. How to trade
FREE

Desarrollado por Charles Le Beau y presentado en los libros de Alexander Elder, el Chandelier Exit establece un stop-loss de arrastre basado en el Average True Range (ATR). El indicador está diseñado para mantener a los operadores en una tendencia y evitar una salida anticipada, siempre y cuando la tendencia se extienda. Típicamente, el Chandelier Exit estará por encima de los precios durante una tendencia bajista y por debajo de los precios durante una tendencia alcista.
Cálculo
La fórmula
FREE

Price Sessions es un indicador exclusivo de MetaTrader 5 que integra información de símbolos y sesiones de negociación en su gráfico. No enlaza con ninguna información de la cuenta ni con fuentes externas, lo que garantiza la seguridad del usuario. Características principales: 1. Información de Símbolos Símbolo actual Precio Actual Diferencial en tiempo real 2. Sesiones de negociación (Zona horaria UTC/GMT+0) Sesión de Tokio Sesión de Londres Sesión de Nueva York Si esta utilidad le resulta úti
FREE

Indicador para análisis gráfico. Marca los principales patrones de velas japonesas en el gráfico. Por el momento, el siguiente conjunto de patrones está disponible para el comerciante: - Bearish/Bullish Abandoned Baby; - Bearish Advance Block; - Bearish Deliberation; - Bearish/Bullish Belt Hold; - Bearish/Bullish Engulfing; - Bearish Shooting Star; - Bearish Evening Star; - Bearish Evening Doji Star; - Bearish/Bullish Doji Star; - Bearish/Bullish Tri-Star; - Bearish Hanging Man; -
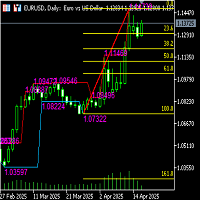
Descripción funcional del indicador automático de línea de Fibonacci (incluidas las líneas de canal alto y bajo) Nombre del indicador Línea automática de Fibonacci + auxiliar de canal alto y bajo
Introducción funcional Este indicador combina los puntos máximos y mínimos de la banda identificados automáticamente, traza automáticamente la línea de retroceso/extensión de Fibonacci y traza las líneas de canal de precios máximos y mínimos del intervalo de análisis actual para proporcionar a los ope
FREE
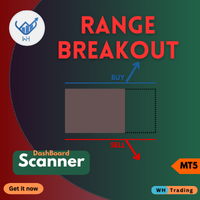
Descubra una nueva dimensión del trading con nuestro innovador indicador MQL5, Range BreakOut MT5
Esta poderosa herramienta está diseñada para identificar y capitalizar los movimientos de precios a medida que se salen de los rangos establecidos,
brindándole la precisión y confianza necesarias para prosperar en el dinámico mundo de los mercados financieros.
Versión MT4 : WH Range BreakOut MT4
Características:
Detección de rango preciso. Símbolos múltiples y marcos de tiempo múltiples (escá
Predicción Binaria: La herramienta definitiva de ayuda a la toma de decisiones para los operadores de opciones binarias Binary Prediction es un indicador meticulosamente desarrollado y adaptado específicamente para satisfacer las demandas del trading en Opciones Binarias. Está diseñado para simplificar el complejo análisis del mercado, proporcionando señales de trading claras y fiables tanto para traders novatos como experimentados que buscan mejorar su proceso de toma de decisiones. Caracter
FREE

Media móvil RAINBOW Los operadores de Forex utilizan las medias móviles por diferentes motivos. Algunos las utilizan como su principal herramienta analítica, mientras que otros simplemente las utilizan como un generador de confianza para respaldar sus decisiones de inversión. En esta sección, presentaremos algunos tipos diferentes de estrategias - ¡incorporarlas a tu estilo de trading depende de ti! Una técnica utilizada en el análisis técnico para identificar los cambios de tendencia. Se crea c
FREE

El Indicador de rango asiático de las TIC Es una potente herramienta diseñada para ayudar a los operadores a identificar estructuras clave del mercado y zonas de liquidez, basándose en la Estrategia de Trading de Rango Asiático de ICT. Marca los niveles de precio máximo y mínimo de la sesión asiática (de 19:00 a medianoche, hora de Nueva York) y proporciona información crucial sobre los movimientos del mercado en las siguientes sesiones. Este indicador mejora la precisión de las oper

PACK 2 de Fractales Cúbicos Phi con opción de extender los indicadores en FUTURO, a la derecha del gráfico Este producto contiene los indicadores del PACK 2 (ROC full / SAINT 8 / SAINT 17 / SAINT 34 / SAINT 72 ) + MODO FUTURO Phi ROC - indicador de tipo oscilador, similar a MIMAROC, que es capaz de mostrar la dirección y la fuerza del mercado, así como determinar el punto óptimo de entrada; Phi SAINT - un indicador de tipo oscilador, similar a SANTO de Phicube, que es capaz de mostrar la direcc
Bloques Rompedores Volumizados MTF Supreme Volumized Breaker Blocks MTF Supreme es un indicador multi-marco de tiempo (MTF) potente y fácil de usar que detecta y visualiza automáticamente los Bloques de Orden (OB) y los Bloques de Ruptura (BB) en su gráfico. Esta herramienta avanzada está diseñada tanto para principiantes como para operadores profesionales que desean una forma limpia, rápida y perspicaz de identificar los niveles clave del mercado con contexto de volumen. Características princi
FREE
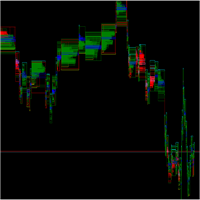
SpreadFlow es un indicador para MetaTrader que genera un gráfico basado totalmente en el comportamiento del flujo de operaciones, en lugar de limitarse a las velas de tiempo o volumen.
Organiza la información de cada tick en cuatro dimensiones principales: Spread - monitoriza la diferencia entre BID y ASK a lo largo del tiempo, mostrando momentos de compresión y ampliación del spread, asociados a mayor o menor liquidez. Operaciones al mismo precio - identifica cuándo se producen operaciones suce
FREE

RSI ALARM (Para Metatrader 5) Este indicador funciona como un RSI normal con todas sus configuraciones (Periodicidad, colores, niveles, etc), pero adicional se puede establecer alarmas en el nivel superior e inferior (Ejemplo 70 y 30), con la posibilidad de ajustar estos niveles moviendo las líneas azul y roja para establecer los niveles superior e inferior. También se puede activar y desactivar una función adicional que crea una flecha en el grafico cuando se cumpla el RSI esperado superior o
Engulfing Pattern es un indicador gratuito disponible para las plataformas MT4/MT5, su trabajo consiste en proporcionar "alertas" cuando se forma un patrón envolvente "alcista" o "bajista" en el marco temporal. Este indicador viene con opciones de alertas mencionadas en la sección de parámetros más abajo. Únase a nuestro grupo MQL5 , donde compartimos noticias y actualizaciones importantes. También puede unirse a nuestro canal privado, póngase en contacto conmigo para el enlace privado. Engulfin
FREE

Un patrón pin bar consiste en una barra de precios, normalmente una barra de precios en forma de vela, que representa una fuerte inversión y rechazo del precio. La inversión de la pin bar, como se denomina a veces, se define por una larga cola, la cola también se conoce como "sombra" o "mecha". El área entre la apertura y el cierre de la pin bar se denomina "cuerpo real", y las pin bars suelen tener cuerpos reales pequeños en comparación con sus largas colas.
La cola de la pin bar muestra el á
FREE
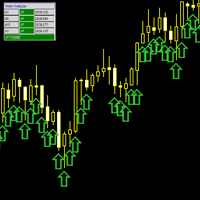
El MultiFrameTrendAnalyzer es un indicador versátil de MetaTrader 5 (MT5) diseñado para proporcionar análisis de tendencias en múltiples marcos temporales utilizando cruces de medias móviles (MA). Este indicador sincroniza las señales de tendencia a través de múltiples marcos de tiempo (M1, M5, M15, M30, H1, H4, D1, W1, MN1) y las muestra con señales visuales intuitivas, incluyendo una línea de tendencia de color, flechas de señal, y un panel personalizable. Características Análisis multitempora
FREE

Como la mayoría de las cosas que funcionan en el trading, es muy simple. Sin embargo, es una de las herramientas más potentes que tengo y que hace que las entradas de muchos sistemas sean mucho más precisas.
En su esencia, mide la volatilidad reciente frente a la media a medio plazo. ¿Cómo funciona? Los mercados tienden a ser propensos a fuertes movimientos de tendencia cuando la volatilidad relativa es baja y tienden a ser de reversión a la media cuando la volatilidad relativa es alta.
Se pue
FREE

Ritz Smart FIBOPIVOT Optimus Pro Sistema avanzado de negociación Fibonacci en múltiples marcos temporales PREDICCIÓN INTELIGENTE Y PRONÓSTICO PRECISO La revolucionaria tecnología de p ivote Fibonacci combina los puntos de pivote tradicionales con las extensiones Fibonacci avanzadas, creando una potente herramienta de predicción para operadores profesionales.
Nuestro algoritmo detecta de forma inteligente niveles de precios significativos en múltiples marcos temporales, proporcionando zonas de s
FREE

Cuando se trabaja con varios activos y se tienen varias posiciones abiertas en activos, es un poco complicado visualizar cuando ganancia o ganancia está dando cada problema activo, por eso con esto en mente desarrollamos este indicador donde facilita la visualización de operaciones en activos , donde podrás abrir varios recursos diferentes y podrás visualizar el resultado individual de cada activo y agilizar la toma de decisiones en tu negocio.
FREE
https://www.mql5.com/en/users/gedeegi/seller El indicador GEN es una herramienta multifuncional de análisis técnico para la plataforma MetaTrader 5 (MT5). Está diseñado para identificar y mostrar automáticamente niveles clave de Soporte y Resistencia (S&R ) y detectar señales de Falsa Ruptura , proporcionando señales de trading claras y visuales directamente en su gráfico. Su objetivo principal es ayudar a los operadores a identificar los posibles puntos de reversión de los precios y evitar las
FREE

Para los amantes de la tendencia, Force será un indicador muy útil. Esto se debe a que se basa en el famoso ADX, que mide la fuerza de una tendencia, pero sin sus 3 líneas confusas. Force tiene una interpretación muy simple: si el histograma está por encima del nivel cero la tendencia es alcista, de lo contrario es bajista. También se puede utilizar para encontrar divergencias, lo que es muy rentable. Gracias a Andre Sens por la idea de la versión 1.1. Si tienes alguna duda o sugerencia, por fav
FREE
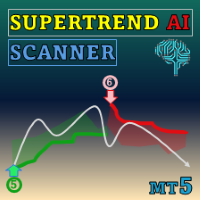
Special offer : ALL TOOLS , just $35 each! New tools will be $30 for the first week or the first 3 purchases ! Trading Tools Channel on MQL5 : Join my MQL5 channel to update the latest news from me Descubre el poder de la IA con el SuperTrend AI Clustering MT5 con escáner , una herramienta revolucionaria para MetaTrader 5 (MT5). Este indicador redefine el análisis del mercado combinando el agrupamiento K-means con el popular indicador SuperTrend, brindando a los traders una ventaja

Keltner-Enhanced mejora la precisión y legibilidad de los Canales Keltner con muchas opciones para ajustarlos y más cinco cálculos de precios más allá del predeterminado META.
El indicador Keltner-E es un indicador de bandas similar a las Bandas de Bollinger y a las Envolventes de Medias Móviles. Consisten en una envolvente superior por encima de una línea media y una envolvente inferior por debajo de la línea media.
Los principales acontecimientos a tener en cuenta al utilizar los canales d
FREE

Seguro que después de mucho buscar en internet, no has encontrado ningún indicador que te pueda ayudar en el mercado de divisas o binario en la última estrategia de probabilidades creada por el famoso trader Ronald Cutrim. La estrategia se basa en un simple recuento de velas verdes y rojas, la comprobación de un desequilibrio numérico entre ellos durante un cierto período de tiempo en un gráfico de mercado de inversión. Si este desequilibrio se confirma y es igual o superior al 16%, según el tra
FREE

Detector de picos de águila v1.50 - Sistema de señales de trading profesional Trading de máxima precisión con la tecnología avanzada de filtrado SuperTrend unirse a mi canal de Telegram para el comercio conmigo: https: //t.me/+9HHY4pBOlBBlMzc8
El Detector de Picos Eagle es un sofisticado indicador de trading de nivel profesional diseñado para traders serios que exigen precisión, fiabilidad y excelencia visual. Combinando un análisis avanzado de múltiples marcos temporales con el filtrado Su
FREE
MSX Hybrid Heiken Scalper v1.00 Aumente la precisión de sus operaciones de scalping con un indicador Heiken Ashi sin repintado de última generación El MSX Hybrid Heiken Scalper es un indicador Heiken Ashi sin repintado, científicamente diseñado y optimizado para scalping M5 a H1 en MetaTrader 5. Introduce un robusto método de suavizado de barras cerradas. Introduce un robusto método de suavizado de barras cerradas que preserva la claridad de la tendencia a la vez que filtra el ruido menor del pr
FREE
Este indicador analiza qué tan eficiente es el movimiento actual del mercado basado en la verdadera relación alto-bajo de un cierto número de barras. [ Guía de instalación | Guía de actualización | Solución de problemas | FAQ | Todos los productos ] La relación es la efectividad del movimiento del mercado. Una relación inferior a 1 significa que el mercado no va a ninguna parte Una relación superior a 1 significa que el mercado está comenzando a mostrar direccionalidad. Una relación superior a

El patrón 123 es uno de los patrones de gráficos más populares, potentes y flexibles. El patrón se compone de tres puntos de precio: un fondo, un pico o valle, y un retroceso de Fibonacci entre 38.2% y 71.8%. Un patrón se considera válido cuando el precio se rompe más allá del último pico o valle, momento en el que el indicador traza una flecha, levanta una alerta y se puede colocar el comercio. [ Guía de instalación | Guía de actualización | Solución de problemas | FAQ | Todos los productos ]
Volatility Monitor – Indicador de Detección de Picos en Tiempo Real Descripción General Volatility Monitor es un indicador MT5 ligero y profesional diseñado para rastrear movimientos bruscos de precios y alertar a los traders en tiempo real. Ya sea que opere Forex, Oro, pares JPY o Cripto, esta herramienta proporciona señales claras de volatilidad mediante detección automática basada en ATR o umbrales de pips manuales. Marcando velas directamente en el gráfico y enviando alertas progresivas, el
FREE

El indicador identifica la divergencia analizando las pendientes de las líneas que conectan los picos o valles del precio y del histograma MACD. Divergencia Alcista (Convergencia): Se produce cuando las líneas que conectan los valles del MACD y los valles correspondientes del gráfico de precios tienen pendientes opuestas y convergen. Divergencia Bajista: Se produce cuando las líneas que conectan los picos del MACD y los picos correspondientes del gráfico de precios tienen pendientes opuestas
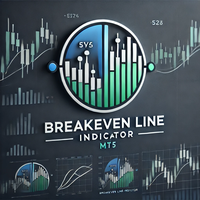
Sencillo indicador que muestra la línea de equilibrio para todas las órdenes en el par de gráficos adjunto. Este indicador también viene con información adicional, como el tamaño total del lote, la reducción flotante en la divisa de la cuenta, el número de posiciones abiertas y la diferencia con el precio actual en puntos. ¿Utiliza DCA (dollar cost average) o un enfoque de cobertura en sus operaciones? Entonces este indicador debe tener. Realmente útil, cuando usted tiene múltiples órdenes (cobe
FREE
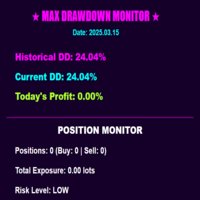
Monitor MaxDD Pro
MaxDD Monitor Pro es una herramienta completa para monitorizar el drawdown diseñada para traders profesionales. Realiza un seguimiento en tiempo real tanto del drawdown basado en el saldo como en los depósitos, ayudándote a gestionar el riesgo de manera efectiva. Sus características incluyen seguimiento del drawdown máximo histórico, análisis de drawdown por símbolo, monitoreo de posiciones y cálculo de exposición. Características principales: Monitoreo de drawdown en tiempo
FREE

Gold Master Indicator MT5 - Institutional Precision for XAUUSD Gold Master Indicator es una herramienta de análisis avanzado diseñada específicamente para la volatilidad única del mercado del Oro ( XAUUSD ). Este indicador no solo rastrea el precio, sino que identifica zonas de liquidez y puntos de inflexión institucionales donde las probabilidades de reversión son mayores. A diferencia de los indicadores estándar, Gold Master utiliza un algoritmo de suavizado de datos para eliminar el ruido del

El Stochastic Momentum Index (SMI), desarrollado por William Blau y presentado en la edición de enero de 1993 de la revista Technical Analysis of Stocks & Commodities, introduce una perspectiva única en el análisis de las operaciones. A diferencia del oscilador estocástico convencional, que evalúa el cierre actual en relación con el rango alto/bajo del período x reciente, el SMI evalúa la posición del cierre en relación con el punto medio de este rango. Esta innovación da lugar a un oscilador c
FREE

Pivot Point Super tendencia se puede utilizar para captar los puntos de inflexión de los precios y puede mostrar flechas de compra y venta. los cálculos se basan en los picos de precios . puede controlar los puntos de inflexión de los precios aumentando la entrada del periodo del punto de inflexión en el indicador el factor ATR indica a qué distancia desea que se separen las bandas las rupturas de precios también se detectan en sus primeras etapas, lo que hará que el comercio sea mucho mejor
FREE
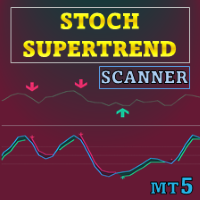
Oferta especial : ALL TOOLS , solo $35 cada uno. Nuevas herramientas costarán $30 durante la primera semana o para las primeras 3 compras ! Trading Tools Channel on MQL5 : Únete a mi canal de MQL5 para recibir mis últimas novedades Esta herramienta combina Stochastic RSI con la lógica de SuperTrend para generar señales direccionales basadas en cambios de momentum. Superpone un envolvente al estilo SuperTrend sobre el Stochastic RSI y resalta puntos de giro cuando el momentum supera

Desarrollada por Jack Hutson en los años 80, la Media Móvil Exponencial Triple (también conocida como TRIX ) es un indicador técnico de Momentum que muestra el porcentaje de cambio en una media móvil que se ha suavizado exponencialmente 3 veces. El proceso de suavizado se puso en marcha con el fin de filtrar los movimientos de precios que se consideran insignificantes para el período de análisis elegido. En Minions Labs nos resultó difícil seguir la suavidad de la línea TRIX original, por lo que
FREE

2025 Spike Killer Dashboard - Señales de trading avanzadas y análisis de mercado ¡Transforma tus operaciones con una visión inteligente del mercado! El 2025 Spike Killer Dashboard es un potente indicador MQL5 que combina la generación de señales de vanguardia con un panel de cristal intuitivo para el análisis del mercado en tiempo real. Diseñado para los operadores que exigen precisión y claridad, esta herramienta todo en uno ofrece señales procesables y métricas de mercado completas de un vi

Dual-TF Daily Bias Dashboard - Serious Day Trading Companion Opere el día con claridad.
Dual-TF Daily Bias Dashboard le ofrece una lectura nítida y de un vistazo de la tendencia direccional intradía utilizando un robusto motor de doble marco temporal (H1 + M15). También muestra una única ventana de negociación -Londres→NY para que sepa al instante cuándo entrar y cuándo salir. Se trata de una herramienta adicional para mantener la disciplina: compre cuando la tendencia sea alcista, venda cuando

Mi producto más popular y demandado está aquí https://www.mql5.com/ru/market/product/41605?source=Site+Market+Product+From+Author#.
El indicador de flecha es ideal para el comercio en una tendencia lateral, que muestra con gran precisión los momentos de sobrecompra y sobreventa de instrumentos, con filtros adicionales también se puede utilizar para el comercio de tendencia. La pantalla muestra flechas que señalan un cambio de tendencia, la dirección de la flecha muestra la dirección futura de l
FREE

El indicador predice los movimientos de precio a corto plazo más plausibles, basándose en complejos cálculos matemáticos.
Peculiaridades Valoración del movimiento de precio actual; Cálculo de la tendencia actual; Cálculo de las líneas de apoyo y resistencia más importantes; Los algoritmos están optimizados para realizar complejos cálculos matemáticos con un gasto mínimo de recursos del sistema; Auto adaptación para obtener el mejor resultado y, como consecuencia, la posibilidad de funcionar en
FREE
Canal Soporte Resistencia MT5 El indicador Support Resistance Channel MT5 traza niveles dinámicos de soporte y resistencia basados en un periodo de retroceso configurable, mostrándolos como líneas verdes y rojas respectivamente. Opcionalmente muestra flechas de color dorado cuando el precio toca estos niveles, indicando posibles cambios de tendencia (no señales explícitas de compra/venta) , junto con etiquetas personalizables "RES" y "SUP". Con parámetros ajustables como el periodo de retroceso
FREE

Piense en el Indicador Super Fractal como el Indicador Bill WIlliams con esteroides. Habilidades del Indicador: 1. 1. Ajustar la Vela alrededor del Máximo o Mínimo Fractal. 2. 2. Ajustar el período de retrospectiva y sólo trazar para un número específico de velas de la historia evitando el desorden de su mesa de operaciones. 3. 3. El indicador utiliza buffers para que pueda llamarlo y utilizarlo desde cualquier EA.
Nota : Cuanto más altas sean las velas alrededor del Fractal, más fuerte será el
FREE
Este asistente de noticias está diseñado para obtener los eventos económicos que necesitan los comerciantes de las principales fuentes editoriales, que publican noticias en tiempo real basándose en Market Watch del terminal con varios y sencillos filtros.
Los operadores de Forex utilizan indicadores macroeconómicos para tomar decisiones informadas sobre la compra y venta de divisas. Por ejemplo, si un comerciante cree que la economía estadounidense va a crecer más rápido que la economía japone
FREE

Visión general
Soporte y Resistencia (MTF) es un indicador de MetaTrader 5 que identifica automáticamente los máximos de oscilación (resistencia) y mínimos de oscilación (soporte) a través de hasta tres marcos de tiempo. Combina los niveles cercanos para reducir el desorden, adapta el ancho de la zona a la volatilidad del mercado utilizando ATR, y ofrece alertas opcionales cuando el precio rompe o vuelve a probar esos niveles. Características Detección de pivotes en múltiples marcos temporales
FREE
Desplazamiento de la Estructura del Mercado con Indicador FVG para MT5 Este indicador MT5 de la suite apexfintech.net identifica los cambios en la estructura del mercado y las brechas de valor justo (FVG) para proporcionar a los operadores oportunidades potenciales de trading. Alerta a los usuarios sobre estos eventos a través de notificaciones móviles, lo que les permite reaccionar rápidamente a las condiciones cambiantes del mercado. Principales características: Detección de cambios en la estr
FREE

¡Eleva tu análisis con el Weis Wave Box ! Si buscas precisión y claridad en tus operaciones , el Weis Wave Box es la herramienta ideal. Este indicador avanzado de ondas de volumen ofrece una visualización clara de la dinámica entre esfuerzo y resultado en el mercado, esencial para traders que utilizan lectura de flujo y volumen. Características Destacadas: Ondas de Volumen Personalizables – ajusta en ticks para alinearlo con tu estrategia.
Histórico Ajustable – analiza periodos especí

Mis otros indicadores
https://www.mql5.com/en/market/product/156702 https://www.mql5.com/en/market/product/153968 (GRATUITO) https://www.mql5.com/en/market/product/153960 (GRATIS)
️ Zonas de oferta y demanda multihorario con brechas de valor razonable (FVG) MyFXRoom Zonas de Oferta y Demanda con FVG es un indicador multi-marco de tiempo que automáticamente detecta y dibuja las zonas de Oferta y Demanda directamente en su gráfico - completo con la validación de Fair Value Gap (FVG) , el tamaño
FREE

Jackson soporte y resistencia V es un potente indicador de soporte y resistencia de avance que proporcionan la base de la señal en la acción del precio, diseño para hacer las cosas fáciles para todo el mundo para dibujar soporte y resistencia. creemos que la mayoría de las estrategias se construyen con soporte y resistencia como base. tener soporte y resistencia perfecta puede ser un cambio de juego a usted manera de comercio. Es flexible a todos los instrumentos. no se olvide de ver nuestro vid
FREE

Indicador Macd altamente configurable.
Características: Funciones de alerta altamente personalizables (en niveles, cruces, cambios de dirección vía email, push, sonido, popup) Capacidad multi timeframe Personalización del color (en niveles, cruces, cambios de dirección) Opciones de interpolación lineal y modo de histograma Funciona en el probador de estrategias en modo multi timeframe (también en fin de semana sin ticks) Niveles ajustables Parámetros:
Macd Timeframe: puede establecer los plazo
FREE

Gran toro scalper Descripción breve Domine la estructura del mercado con la precisión del popular Big bull scalper Esta herramienta identifica automáticamente los pivotes máximos y mínimos clave, trazando líneas de tendencia "angulares" únicas que definen dinámicamente el contexto del mercado. Confirma visualmente las rupturas de estructura (BOS) y los cambios de carácter (CHoCH), eliminando todas las conjeturas de su análisis.
Características principales: Detección automática de pivotes Detec
FREE
El RSI Estocástico (StochRSI) es un indicador técnico que combina las características del Índice de Fuerza Relativa (RSI) con el Oscilador Estocástico, dando como resultado una herramienta más sensible que genera un mayor número de señales de trading. Desarrollado por Tushar Chande y Stanley Kroll, el indicador fue diseñado para superar una limitación percibida del RSI tradicional: la baja frecuencia de activación de los niveles de sobrecompra y sobreventa (comúnmente 80 y 20), especialmente en
FREE

StopLevel El medidor controla el nivel de STOPLEVEL. Cuando el nivel cambia, indica con una alerta. STOPLEVEL: la compensación mínima en puntos del precio de cierre actual para colocar órdenes Stop, o el nivel mínimo permitido de Stop Loss / Take Profit en puntos. Un valor cero de STOPLEVEL significa la ausencia de una restricción en la distancia mínima para stop loss / take profit, o el hecho de que el servidor comercial utiliza mecanismos externos para el control de nivel dinámico que no s
FREE

Un simple indicador de la acción del precio para resaltar dentro y fuera de las barras (velas) con colores. Es posible elegir que tipo de barra puede ser resaltada entre: inside, ouside o ambas. Es posible elegir un primer color específico para la sombra y el borde de las barras (velas), un segundo color específico para la barra alta/alcista (vela) y un tercer color específico para la barra baja/bajista (vela).
FREE

Vwap simple con el diario, semanal y mensual
VWAP es la abreviatura de precio medio ponderado por volumen , que es una herramienta de análisis técnico que muestra la relación entre el precio de un activo y su volumen total de operaciones. Proporciona a los operadores e inversores una medida del precio medio al que se negocia una acción durante un periodo de tiempo determinado.
Cómo se utiliza Identificar los puntos de entrada y salida : los operadores pueden utilizar el VWAP para determinar c
FREE

Este indicador ha sido diseñado sobre la base del indicador Parabolic SAR. El indicador ayuda al usuario a determinar la dirección de la transacción. En esta utilidad también se ha incorporado la función de notificación acústica al aparecer una nueva señal. También está disponible de manera adicional la función de notificación por email. Su dirección de e-mail, así como los parámetros de su servidor SMTP deberán ser indicados en los ajustes del terminal MetaTrader 5 (pestaña "Correo"). Flecha az
FREE
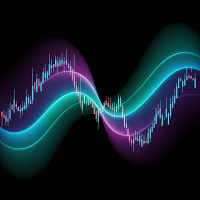
AP VWAP Bandas Pro (MT5) Precio medio ponderado por volumen con bandas ±σ para un sesgo intradía claro, zonas de reversión media y soporte/resistencia dinámicos. Funciona con criptomonedas (incluido BTC) , divisas , índices y metales . Utiliza tick-volumen cuando el volumen real no está disponible. Lo que muestra Línea VWAP (precio medio ponderado por volumen). Dos envolventes alrededor del VWAP (por defecto ±1σ y ±2σ) para resaltar el equilibrio frente a la extensión. Modos de reajuste : Día ,
FREE
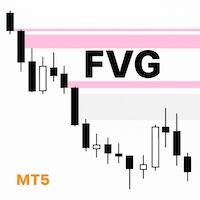
Lo que hace único al indicador UTurn FVG Soy un comerciante, y he construido un indicador FVG simple y limpio que se centra en lo que los comerciantes realmente necesitan. Ajustes flexibles de color y transparencia. La opción de extender FVGs no mitigados y parcialmente mitigados al precio actual. Eliminación automática de los FVG totalmente mitigados. Confirmación visual clara cuando ya se ha comprobado un FVG. Un aspecto limpio y profesional que ayuda a los operadores a tomar decisiones más r
FREE
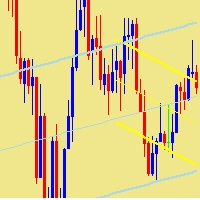
Este indicador traza dos canales de regresión lineal en el gráfico para cualquier par de divisas o instrumento financiero, admitiendo el uso de dos marcos temporales diferentes. El primer canal utiliza un periodo más corto para identificar tendencias locales. El segundo canal utiliza un periodo más largo para identificar tendencias generales. Cada canal muestra una línea de regresión principal y dos líneas que representan el rango de desviación. Los usuarios pueden ajustar el periodo de cada can
FREE

Advanced Indicator Scanner es un escáner multi-símbolo multi-marco de tiempo que funciona con cientos de indicadores personalizados disponibles a través de la web, incluyendo indicadores de mercado del sitio web mql5 y codebase.
Características de Advanced Indicator Scanner:
Escanea su indicador en 28 instrumentos personalizables y 9 marcos temporales. Monitorea hasta 2 líneas(buffers) de un indicador. Muestra el valor del indicador en los botones. Puede elegir entre 3 modos de alerta: Un solo

Indicadores Últimas actualizaciones: Actualización 23-02-2025: Esta versión incluye nuevas optimizaciones para mejorar la precisión de la señal. Actualización 01-13-2025: Ahora compatible con la próxima Web Request App, que sustituirá al bot AutoSignal_Connection. Propósito
Este indicador MT5 está diseñado para analizar velas Heiken Ashi de 3 minutos, generando señales de compra y venta basadas en cruces de medias móviles (MA). Proporciona señales visuales y alertas, por lo que es una herramie

Neo Fork v5 se desarrolló para el sistema de trading "Oracle", pero poco a poco se fue complementando con, por ejemplo, ángulos de Gann y otras opciones..... Usted puede crear objetos gráficos con color, estilo y grosor especificados, tales como: rectángulos con y sin relleno, segmentos de líneas de tendencia y una herramienta no estándar - "Neo Fork" en forma de tridente, así como existe la oportunidad de ajustar interactivamente la paleta de colores directamente desde el gráfico, ajustar la vi
FREE
El Mercado MetaTrader es una plataforma única y sin análogos en la venta de robots e indicadores técnicos para traders.
Las instrucciones de usuario MQL5.community le darán información sobre otras posibilidades que están al alcance de los traders sólo en nuestro caso: como la copia de señales comerciales, el encargo de programas para freelance, cuentas y cálculos automáticos a través del sistema de pago, el alquiler de la potencia de cálculo de la MQL5 Cloud Network.
Está perdiendo oportunidades comerciales:
- Aplicaciones de trading gratuitas
- 8 000+ señales para copiar
- Noticias económicas para analizar los mercados financieros
Registro
Entrada
Si no tiene cuenta de usuario, regístrese
Para iniciar sesión y usar el sitio web MQL5.com es necesario permitir el uso de Сookies.
Por favor, active este ajuste en su navegador, de lo contrario, no podrá iniciar sesión.