适用于MetaTrader 5的技术指标 - 21
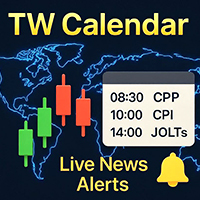
该新闻助手旨在从主要发布源获取交易者所需的经济事件,这些发布源基于终端的市场观察,通过各种简单的过滤器实时发布新闻。
外汇交易者利用宏观经济指标就买卖货币做出明智的决定。例如,如果交易者认为美国经济增长速度将超过日本经济,他们可能会买入美元并卖出日元。
本产品特点: 根据经纪商的市场观察显示项目 数值一经发布 从活动发布者的主要来源接收信息 发布事件值时发出警告 轻松过滤的可能性 显示最近的事件 在事件值发布前 X 分钟发出警报 有用的事件描述 显示事件的当前值和预测以及重要性 简单易用的图形用户界面 明暗主题 能够最小化和移动面板 简易安装 您可以使用这一基本工具结合专业的信号指标来分析趋势。 再赠送一件 产品。
根据经纪商的市场观察显示项目: 该软件根据您经纪商的市场观察终端时间显示过滤后的事件,因此 您无需 转换或计算事件的 时间间隔 ,并且可以轻松计算它们的发布时间。 发布事件的主要来源发布新闻后立即显示值: TW Calendar 使用事件发布者的 主要来源 来接收事件,因此该产品能够显示一些其他信誉良好的外汇日历提供商网站上未显示的事件。 数值一发布就报警并显示:
FREE
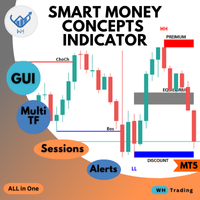
Welcome to the ultimate Smart Money Concepts indicator ,, this indicator is All-in-One package the only thing you need to empower
all the Smart Money Concepts in one place with interactive advanced gui panel with all the features and customization you need. MT4 Version : WH SMC Indicator MT4 *This Price For Limited Number of Copies.
Features: Main Section: User-Friendly Panel (GUI): Designed for traders of all experience levels, the indicator integrates seamlessly into your MT5 platform

This auxiliary indicator displays time left before closing on the current timeframe with continuous update . It also shows the last trade price and variation from a previous day close in percentage and points. This indicator is pretty handy for daytraders and scalpers who want to precisely monitor closing and opening of candles.
Indicator parameters Show in shifted end - Default: False. Display time and values on screen. If True, Displays only time to close aside last candle. Distance from the
FREE
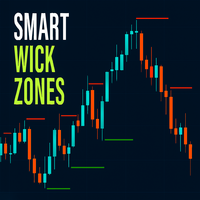
Smart Wick Zones indicator is a powerful tool designed to highlight hidden areas of price rejection and liquidity on your chart. By analyzing candle wicks (also called shadows or tails), the indicator automatically draws horizontal zones where strong buying or selling pressure has previously appeared. These wick zones often mark turning points in the market or areas where price reacts strongly, making them excellent references for support and resistance.
Instead of manually scanning candles for
FREE
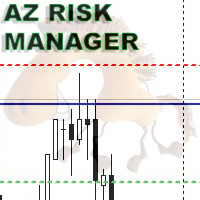
A simple indicator for calculating risk and automatically calculating the take profit line. In the settings, you enter the desired risk to profit ratio, the indicator will automatically calculate the volume for entry and show where to set the take-profit line to maintain the proportion. The risk is calculated based on your balance data. The information panel can be moved around the screen. The stop-loss line can also be moved, this will recalculate the entry volume and the take-profit position.
FREE

https://www.mql5.com/en/users/gedeegi/seller
QuantumFlux Trend combines concepts from statistical physics (temperature T & energy step alpha ) with Boltzmann-style exponential weighting to produce a trend line that is more “context-adaptive” compared to traditional moving averages. The result is then smoothed with an EMA to deliver cleaner signals that are easy to read across all timeframes. The indicator automatically colors candles and trend lines: green for bullish phases, red for bearish
FREE

With this easy to set up indicator you can display and set alerts for the following candlestick formations: Bull Breakout, Bear Breakout, Hammer, Pin, Bullish Engulfing, Bearish Engulfing. Input parameters: ShortArrowColor: The color of the Arrows, displaying a Bearish candle formation LongArrowColor: The color of the Arrows displaying a Bullish candle formation BullishEngulfing: Disabled/Enabled/EnabledwithAlert BearishEngulfing: Disabled/Enabled/EnabledwithAlert Pin: Disabled/Enabled/Enabledw
FREE

交易实用必备工具指标 波浪自动计算指标,通道趋势交易 完美的趋势-波浪自动计算通道计算 , MT4版本 完美的趋势-波浪自动计算通道计算 , MT5版本 本地跟单复制交易 Easy And Fast Copy , MT4版本 Easy And Fast Copy , MT5版本 本地跟单复制交易 模拟试用 Easy And Fast Copy , MT4 模拟账号运行 Easy And Fast Copy , MT5 模拟账号运行 "Cooperative QQ:556024 " "Cooperation wechat:556024" "Cooperative email:556024@qq.com" 强烈推荐趋势指标, 波浪的标准自动计算 和 波浪的标准自动计算MT5版本
KDJ指标又叫 随机指标 ,是一种相当新颖、实用的技术分析指标,它起先用于期货市场的分析,后被广泛用于股市的中短期趋势分析,是期货和股票市场上最常用的技术分析工具。 随机指标KDJ一般是用于股票分析的统计体系,根据统计学原理,通过一个特定的周期(常为9日、9周等)内出现过的最高价、最低价及最
FREE
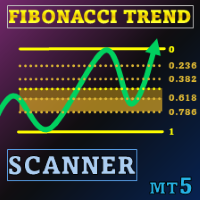
特别优惠 : ALL TOOLS ,每款仅 $35 ! New tools will be $30 for the first week or the first 3 purchases ! Trading Tools Channel on MQL5 : Join my MQL5 channel to update the latest news from me 在波动剧烈的交易环境中,一款功能强大且直观的分析工具可以帮助您迅速抓住机会。Fibonacci Trend Scanner不仅结合了传统Fibonacci指标与SuperTrend功能,而且通过货币对扫描、多周期监控以及当趋势在多头与空头之间转换时的智能提醒,进一步扩大了其应用范围。 See more MT4 version at: Fibonacci Trend MT4 Scanner See more products at: All Products 1. 结合SuperTrend技术的趋势分析 Fibonacci Trend Scanner采用 SuperTrend 算法,可快速准确

凤凰ATR波动率计(MT5)
专为MetaTrader 5设计的实时波动率监测工具。运用平均真实波动范围(ATR)技术,在图表上直观呈现当前市场波动强度。
功能定位
市场波动率直接影响止损设置、仓位管理、滑点控制及策略执行效果。忽视波动率的交易往往导致:在快速市场中承担过度风险,或在平静行情中错失良机。
凤凰ATR波动率计基于当前图表数据计算ATR值,并在图表上清晰显示数值。该指标实时更新,可自动适配交易品种与时间周期变化,帮助交易者判断市场处于平静、活跃或高波动状态。
安装说明
从MQL5市场下载后附加至任意图表,指标将立即显示且无需配置。
系统要求
MetaTrader 5 3280版或更高版本。本指标为自定义指标,采用ATR衡量波动性,兼容所有经纪商及交易品种。ATR数值随所选时间周期变化。
反馈与评价
若您认为本工具实用,敬请在MQL5平台给予五星好评。您的反馈将直接影响凤凰团队的后续更新、优化及新工具开发——我们致力于打造交易者真正重视的功能。
技术支持
通过MQL5私信提供终身支持,24小时内响应。
开发方:凤凰环球投资有限公司 2025 凤凰
FREE

A useful dashboard that shows the RSI values for multiple symbols and Time-frames. It can be easily hidden/displayed with a simple click on the X top left of the dashboard. You can input upper and lower RSI values and the colours can be set to show when above/below these values. The default values are 70 and 30. You can choose whether the dashboard is displayed on the right or left of the chart. If you want to have 2 dashboards on the same chart you must input a different name for each. The sca
FREE

Utazima Universal AI (MT5 Indicator) Price: Free
Overview Utazima Universal AI is a manual trading indicator that provides a dashboard-style view of selected market structure elements and session/time conditions. It does not place trades.
What it shows (depending on settings) - Market structure and key zones (optional) - FVG/imbalance zones (optional) - Liquidity sweep style markers (optional) - Trend-direction filtering (optional) - Session/time filters for active periods (optional) - Risk/re
FREE

Thermo MAP is a multicurrency and multitimeframe indicator that display a smart heat map based on proprietary calculations. Watch how Forex market moved and is currently moving with a single dashboard and have a consistent and good idea of what is happening!
It can be suitable for both scalping or medium/long term, just select options that better fit your trading style Symbols list are automatically sorted based on the preferred column. There is the possibility to click on: First row, timeframe
FREE

Based on the Extreme Trend Indicator on Trading View converted for MT5. Usage of the Indicator is free, but if you want the source code, you can purchase the source code by messaging me.
Extreme Trend is an indicator that identifies when a new trend is forming and creates a trading signal. This indicator can be used for many markets, forex, gold etc. If you have any inquiries or want to create an EA using this indicator, you can message me.
FREE

Accurate Gold 指标是一款用户友好的工具, 无论交易者的经验水平如何,都具有直观和简单易用的特点。它专为在黄金市场上寻找M5时间框架上精确信号的交易者而设计。该指标采用先进的数学算法来分析价格波动和成交量动态,生成准确的买入和卖出信号。该指标的独特特点,包括其不重绘的性质,为交易者提供了有关潜在市场反转的宝贵见解,从而支持明智的决策。它在图表上的视觉呈现,以及听得见的警报和推送通知,提升了用户体验,使其成为寻求交易策略精准性和可靠性的黄金交易者工具包中的有价值的补充。 $ XX – 在限定时间内,前 5 位支持者的价格为 $ XX 。 ( % 已售罄)
88 美元 —— 此后,它将恢复到 88 美元的发行价,并且仅限于金色符号。
88 美元 + X ($100) – 每购买 3 次后价格就会增加 100 美元。 在此查看 MT5信号 ,论坛讨论请点击 这里 。
建议: 时间框架:仅限M5 货币对: 仅限 XAUUSD 账户类型:ECN、Raw或Razor,具有非常低的点差 经纪商时间:任何时间 经纪商:IC Markets、P

The indicator shows the time until the candle closes, as well as the server time on the current chart.
Very easy to use, with only four settings.:
Lable Location-the location of the timer on the graph;
Display server time-to show the server time or not;
Sound alert when the candle is closed-to use a sound signal when closing the candle or not;
Color-the color of the timer digits.
Other useful free and paid products can be viewed here: https://www.mql5.com/ru/users/raprofit/seller
FREE

This indicators automatically draws the support and resistances levels (key levels) for you once you've dropped it on a chart. It reduces the hustle of drawing and redrawing these levels every time you analyse prices on a chart. With it, all you have to do is drop it on a chart, adjust the settings to your liking and let the indicator do the rest.
But wait, it gets better; the indicator is absolutely free! For more information: https://youtu.be/rTxbPOBu3nY For more free stuff visit: https:
FREE
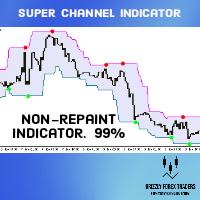
Super Signals Channel Indicator Its channel is a non-repaint indicator that reacts more with recent price movements. For this reason, the Super Signals Channel Indicator is a better match for short-term or day trading strategy. The Super Signals Channel only plots swing trading opportunities. So most of its trade signals appear during consolidation or sidelined periods of the market. Super Signals Channel Indicator for MT5 Explanation The green band below the price shows the dynamic support lev
Volumized OrderBlocks MTF - Multi-Timeframe Volumetric Order Block Indicator
OVERVIEW
Volumized OrderBlocks MTF is an advanced Multi-Timeframe Order Block indicator that automatically detects, displays, and merges Order Blocks from up to 3 different timeframes on a single chart. Built with institutional Smart Money Concepts (SMC) method
FREE

Do you find it difficult to track and manage your open positions across multiple different symbols in MetaTrader 5? Do you need a quick and comprehensive overview of your current market exposure and the performance of each symbol individually? The "Dynamic Exposure Table" indicator is your ideal tool! This indicator displays a clear and detailed table in a separate window below the chart, summarizing all your open positions and intelligently grouping them by symbol, giving you a complete view of
FREE

A clean Bollinger Bands indicator with single-color filling designed to reduce chart clutter. What is This Indicator? This is a Bollinger Bands technical indicator designed with visual simplicity in mind. Unlike standard Bollinger Bands implementations that display multiple colored lines and bands, this indicator uses a single-color filled area to represent the trading bands. This approach minimizes visual clutter while maintaining full functionality for technical analysis. How It Works The ind
FREE

头皮交易者的 VWAP
会话感知的 VWAP 线,用于快速、精确的头皮交易。 ️ 输入参数(MT4/MT5) Enable_Hourly_VWAP: 启用小时 VWAP。 Enable_Asia_VWAP: 启用亚洲会话 VWAP。 Enable_Europe_VWAP: 启用欧洲会话 VWAP。 Enable_NA_VWAP: 启用北美会话 VWAP。 Enable_Extended_VWAP: 启用扩展会话 VWAP。 Enable_Daily_VWAP: 启用每日 VWAP。 亚洲会话(GMT) Session_Asia_Start_Hour: 亚洲会话开始时间。 Session_Asia_End_Hour: 亚洲会话结束时间。 欧洲会话(GMT) Session_Europe_Start_Hour: 欧洲会话开始时间。 Session_Europe_End_Hour: 欧洲会话结束时间。 北美会话(GMT) Session_NA_Start_Hour: 北美会话开始时间。 Session_NA_End_Hour: 北美会话结束时间。 它的功能 绘制小时、会话(亚洲/欧
FREE
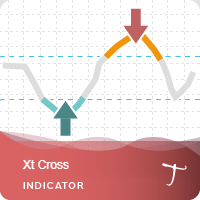
Xt Cross是著名的 TS /MT 指标的端口, 是一种具有动态超买和超卖水平的振荡器,而在标准 Stochastic Oscillator 中,这些水平是静态的并且不会改变。 这使得 Xt Cross 能够适应不断变化的市场。
当振荡器高于超买带(红线)并向下穿过信号(虚线)时,通常是一个很好的卖出信号。 同样,当震荡指标在超卖带(绿线)下方穿过信号上方时,这是一个很好的买入信号。 Xt Cross 非常适合交易货币(包括加密货币)和二元期权. Xt Cross 的优势 该指标适用于剥头皮交易和日内交易。 可以评估指标对历史的有效性。 指标不会重新绘制(重新计算),信号严格在“柱线收盘价”时生成。 它可以用作独立工具或与其他指标一起使用。 新指标信号的电子邮件和移动设备通知系统。 能够自定义指标的配色方案。
FREE

The Nadaraya-Watson Envelope is a non-parametric regression-based indicator that helps traders identify trends, support, and resistance levels with smooth adaptive bands. Unlike traditional moving averages or standard deviation-based envelopes, this indicator applies the Nadaraya-Watson kernel regression , which dynamically adjusts to price movements, reducing lag while maintaining responsiveness.
Key Features: • Adaptive Trend Detection – Smooths price action while remaining responsive to m
FREE

Trade Hunter MT5 - Buy and Sell Indicator
Unlock precise trading opportunities with Trade Hunter MT5! This powerful indicator identifies potential buy and sell signals by analyzing price movements over a customizable period. Blue arrows mark buy opportunities below key lows, while red arrows highlight sell signals above critical highs. With adjustable parameters like bar range, percentage offset, and alert settings, Trade Hunter adapts to your strategy. Optional alerts and notifications ensur
FREE

Breakout 4-in-1 Package Core Functionality The indicator serves as a "Trend Confirmation Engine." It identifies when the price breaks through a key structural level and then uses secondary oscillators to verify if the move has enough strength to continue. 1. The Breakout Engine (S&R) The foundation of the indicator is identifying Support and Resistance (S&R) . When price closes above resistance or below support, the indicator triggers an alert. Horizontal Levels: Breaks of previous highs/lows or
FREE

凤凰K线形态监测器(MT5)
专为MetaTrader 5设计的实时K线形态检测与监控工具。可跨多个交易品种自动识别经典K线形态,并通过可视化仪表盘展示全面的形态统计数据。
概述
凤凰K线形态监测器可识别并追踪十字星、锤子线、流星线、看涨吞没、看跌吞没、晨星、暮星、三白兵及三乌鸦等形态。系统支持同时扫描最多18个可配置交易品种,并为每个监控品种维护形态计数统计。
仪表盘以简洁网格格式展示形态出现情况,显示交易品种名称、总形态计数及最新检测形态。每种检测到的形态均可在图表上触发可自定义颜色的视觉箭头,区分看涨与看跌信号。形态检测基于K线收盘价运行,确保信号确认且不会重绘。
警报功能包括弹出通知、声音提醒及移动端推送通知,当监控品种出现形态时触发。系统支持按形态筛选警报,交易者可专注特定形态并忽略其他形态。所有形态定义均采用标准K线分析规则,支持自定义灵敏度阈值(如十字星检测及实体与影线比例)。
指标支持从仪表盘一键切换交易品种,实现监控工具间的快速导航。可配置热键可独立控制面板可见性、图表箭头或两者同时切换。形态统计数据在图表重启后持续保留,并在整个交易时段内累积。
安装指
FREE
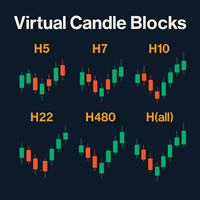
虚拟K线块(Virtual Candle Blocks)—— 视觉化无界市场 虚拟K线块 是一款为 MetaTrader 5 设计的高级指标,它能让你创建并观察任何自定义周期的 K 线,即使是那些平台本身不提供的周期。 主要特点: 自定义周期 :将基础 K 线组合成任意时长的 K 线块(例如:5 小时、14 小时、28 小时、72 小时等),从而创建全新的虚拟 K 线。这使你能够使用像 TradingView 等高级平台独有的周期。 清晰的视觉效果 :直接在图表上绘制带有实体和影线的虚拟 K 线。你可以自定义颜色、实体宽度,并选择是否显示影线,以便进行纯粹的价格行为分析。 高度可定制 :该指标包含一个简约面板,用于显示你选择的虚拟周期。它与 MT5 的所有绘图工具兼容,允许你在虚拟 K 线上标记支撑位、阻力位和趋势线。 高级分析 :将图表周期用作“缩放”功能,以检查每根虚拟 K 线的内部结构,从而提高你发现模式和趋势变化的能力。 理想用户: 价格行为交易者 :喜欢干净、无干扰图表的人。 技术分析师 :使用非标准周期来获得视觉和概念优势的人。 使用建议: 为了获得无重叠的视觉效果,我们建
FREE

加速振荡器(AC)指标,具有多时间框架支持、可定制的视觉信号和可配置的警报系统。
什么是AC? 加速振荡器(AC)是由Bill Williams开发的动量指标,用于测量当前驱动力的加速或减速。该指标计算为Awesome Oscillator (AO)与其5周期简单移动平均线(SMA)之间的差值。 AC显示市场动量是在加速还是减速。正值表示向上方向的加速,负值表示向下方向的加速。当AC穿过零线时,它表示加速方向的变化。交易者经常使用AC来确认趋势强度并识别潜在的进场或离场点。 功能: 带有箭头和垂直线的视觉信号标记 具有可配置触发器的三个独立信号缓冲区 信号检测选项:方向变化、水平交叉、峰/谷 每个信号的可配置警报功能(电子邮件、推送、声音、弹出窗口) 具有插值方法的多时间框架(MTF)功能 直方图或线条绘制模式 多种颜色模式(简单、基于方向、基于水平) 用于Expert Advisor(EA)集成的自定义指标调用(iCustom)缓冲区访问 输入参数: 基本设置: AC bar shift: 将线条绘制偏移指定的柱数。 AC timeframe: 选择MTF显示的时间框架。 MTF
FREE

This indicator calculates gann support and resistance prices with use gann pyramid formulation and draw them on the chart. And If you want, Indicator can alert you when the current price arrive these pivot levels. Alert Options: Send Mobil Message, Send E-mail, Show Message and Sound Alert Levels: S1, S2, S3, S4, S5, R1, R2, R3, R4, R5 Inputs: GannInputPrice: Input price for gann pyramid formulation. GannInputDigit: How many digit do you want to use for calculation formula. (The number and the
FREE

The indicator calculates ZigZag using the classic algorithm with three parameters: Depth, Deviation, and Backstep. Its main function is detecting and visualizing repaints — moments when the last ZigZag point shifts to a new bar.
Upon loading, the indicator performs a simulation over the specified history depth. The algorithm sequentially recalculates ZigZag for each bar, comparing the current position of the last point with the previous one. If a shift is detected, a repaint line appears on the
FREE

FTU Qs Buy Sell Arrow MT5
Qqe indicator for mt5, this draws objects as arrows which is okay for manual trading but not reliable for EA/Algo. See Qqe arrows for updated version. The indicator is for MT5 platform, can be used stand alone >> best combined with other indicators and strategies. Many arrow changes at certain times, so best to filter the signals using minimum one concept/logic Combines various indicators such as stochastic, rsi and moving average to draw an arrow for suggestion of e
FREE
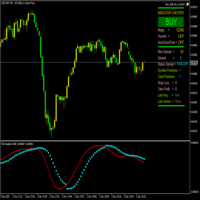
ParabolicSariTriX 是一种混合指标,它结合了趋势振荡器 TriX(三重指数移动平均线)和抛物线转向系统(Parabolic SAR)。该指标显示在独立窗口中,旨在根据趋势反转信号识别入场/出场点。它通过 SAR 点的形式提供清晰的视觉信号,这些点会随着市场趋势的变化而改变相对于 TriX 线的位置。 SAR 点的位置如下: 在 TriX 线上方 表示看跌趋势(卖出信号) 在 TriX 线下方 表示看涨趋势(买入信号) 需要注意的是,由于该指标基于 TriX 值而非实际价格计算, 因此不能用作价格仓位的追踪止损 。其主要用途是发出 TriX 振荡器的趋势反转信号,结合其他分析工具时可作为交易决策的过滤器。 该指标在趋势明显的市场中表现最佳,而在盘整行情中可能出现虚假信号。它适用于各种时间周期和金融工具,包括外汇、股票和大宗商品。建议交易者将其与价格行为分析、支撑阻力位或其他振荡器结合使用,以提高信号可靠性。
FREE

Trading can be quite tiring when you need to look at several things at the same time.
Format of candles, supports, resistances, schedules, news and indicators.
This tool aims to facilitate the analysis of the ADX indicator. It colors the candles based on the levels of the indicator and the DI lines.
The period, the limit of the indicator and the colors of the candles are customizable. You can also place a visual aid on the lower right side of the graph to view the values of ADX, DI + and DI-
FREE

如果您在金融市场交易,那么您肯定知道点差有多重要——买入价(ask)和卖出价(bid)之间的差异会严重影响您的利润。 Spread Size 是一个简单但非常实用的指标,它直接在图表上显示当前点差。不再需要手动持续监控数据——一切尽在眼前! 为什么需要它?
点差不只是一个数字。它是您真实的资金。低点差意味着开仓和平仓的成本更低。高点差,尤其是在新闻发布或流动性低的时候,可能会“吞噬”您的一部分利润,甚至将盈利交易变成亏损交易。Spread Size 帮助您及时察觉这些情况。 它是如何工作的?
该指标以文本形式在图表上显示点差。但最方便的是,它会根据情况改变颜色: 绿色——点差低,可以安心交易。
红色——点差高,最好等待或重新检查条件。
颜色和触发阈值可以根据您的需求自定义。 还有什么用处?
节省时间——不需要频繁切换窗口。
帮助避免意外情况——例如,经纪商在新闻发布前突然扩大点差。
适合所有人:剥头皮交易者、日内交易者,甚至关注成本的投资者。 点差扩大的风险示例
假设您在正常时间以10点的点差开了一个EUR/USD的仓位。一切顺利,价格朝着您的方向移动。但突然发布了重要的美元新闻—
FREE

Linear Regression Channel (MTF) Indicator The Linear Regression Channel MTF is an advanced technical indicator that uses statistical analysis to plot a linear regression channel on the price chart, with the capability to display data from a different time frame (Multi Time Frame) for enhanced trend accuracy and analysis. Key Features of the Indicator: Main Line (Linear Regression Line):
Represents the overall price trend over the selected period, allowing traders to easily observe the general s
FREE
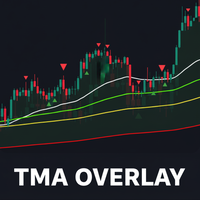
TMA Overlay Indicator for MT5 - User Guide 1. Introduction TMA Overlay is a versatile technical analysis indicator for the MetaTrader 5 platform. The indicator's goal is to provide traders with a comprehensive overview of the trend, potential entry signals, and key trading sessions, all integrated into a single chart. This is not a trading system, but a comprehensive analysis tool designed to help you make more informed decisions. 2. Core Indicator Components The indicator consists of multiple c
FREE

Eagle Spikes Detector v1.50 - Professional Trading Signal System Ultimate Precision Trading with Advanced SuperTrend Filtering Technology join my telegram channel to trade with me: https://t.me/ +9HHY4pBOlBBlMzc8
The Eagle Spikes Detector is a sophisticated, professional-grade trading indicator designed for serious traders who demand precision, reliability, and visual excellence. Combining advanced multi-timeframe analysis with cutting-edge SuperTrend filtering, this indicator identifi
FREE

The Martinware Manual Trading Helper indicator is aimed at helping people start their lives in manual trading. It can be used to display both some generic images at the right side of the graph, where custom operational remarks may be displayed or just a blank rectangle hiding the chart while backtesting. Moreover, it can periodically play a list of sounds. To show a blank rectangle, let the first image name input field empty and select the desired color. To show one or more custom images inste
FREE
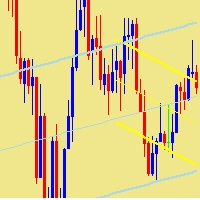
This indicator plots two linear regression channels on the chart for any currency pair or financial instrument, supporting the use of two different timeframes. The first channel uses a shorter period to identify local trends. The second channel uses a longer period to identify overall trends. Each channel displays a main regression line and two lines representing the deviation range. Users can adjust the period of each channel and select the desired timeframe. The indicator helps monitor price m
FREE

If you love this indicator, please leave a positive rating and comment, it will be a source of motivation to help me create more products <3 How to use SuperTrend? When the price crosses above the supertrend line it signals a buy signal and when the price crosses below the supertrend line it signals a sell signal. The supertrend indicator which acts as a dynamic level of support or resistance and helps traders make informed decisions about entry and exit points. When prices are above s upertre
FREE

Developed by Jack Hutson in the 80's, the Triple Exponential Moving Average (a.k.a. TRIX ) is a Momentum technical indicator that shows the percentage of change in a moving average that has been smoothed exponentially 3 times. The smoothing process was put in place in order to filter out price movements that are considered insignificant for the analysis period chosen. We at Minions Labs found hard to follow the smoothness of the original TRIX line, so we colored the TRIX line with BUY and SELL t
FREE
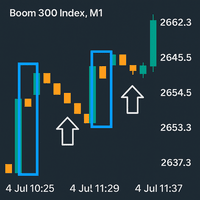
boom Spike Mitigation Zone Pro
A professional spike pattern indicator built for synthetic traders who scalp and swing Boom 500/300/1000/600/900with precision.
This indicator: Detects powerful 3-candle spike formations (Spike → Pullback → Spike) Automatically draws a clean box around the pattern Marks the entry price from the middle candle Extends a horizontal mitigation line to guide perfect sniper entries Automatically deletes & redraws the line once price touches it (mitiga
FREE

凤凰支撑阻力检测器(MT5)
专为MetaTrader 5设计的专业支撑阻力检测工具。自动从更高周期识别最强支撑阻力位,并通过可视化仪表盘呈现全面强度分析。
概述
凤凰支撑阻力检测器运用更高周期枢轴点分析(默认H4周期,可自定义)识别三大最强支撑阻力位。系统依据测试次数、震荡柱数及距当前价格距离对各价位进行排序,通过简洁的六列仪表盘展示S1、S2、S3、R1、R2、R3的详细指标。
每个价位显示五项关键指标:当前价格、强度分类(基于测试次数划分为强/中/弱)、距离分类(近/中等/远)、震荡柱数量及极性状态。极性检测系统可识别阻力位转为支撑位或支撑位转为阻力位的情形(当价格穿越价位时)。
指标在图表上绘制带自动价格标签的水平线,无限延伸至左右两侧以提供清晰视觉参考。区域宽度可自动采用ATR计算或手动设置点差值。所有水平线将随更高周期形成新枢轴点动态更新。
警报选项包含:价格临近水平线时的接近预警、极性反转通知及周期验证警报。系统支持弹出提示、声音通知和移动推送通知。可配置热键实现面板可见性、图表线或两者同时的即时切换。
安装指南
从MQL5市场下载后附加至任意图表。仪表盘
FREE

This indicator was created as an MT5 version inspired by a TMA RSI Divergence indicator found on TradingView.
This indicator detects both Regular and Hidden divergences using RSI pivot points, similar to TradingView's pivot-based divergence logic.
-------------------------------------------------- Features -------------------------------------------------- • Regular Bullish / Bearish divergence • Hidden Bullish / Bearish divergence • Pivot-based detection (Left / Right bars) • Optional RSI SM
FREE

Time Candle with Sound Alert
This indicator will be display the time left candle Features : 1. Multi Time Frames, Multi Pairs 2. Time Left 2. Position dynamic with Bid Price or Edge of Chart Screen 3. Font Size and Color 4. Display Current Spread, Maximum Spread and Minimum Spread
Note: Maximum and Minimum Spread will be reset when you change TF Tested On MT5 Version 5 Build 5200
If you want the source code, just PM me
FREE

该指标是My candle的演示版本,完整版可以在此处下载: 蜡烛图案创建器 通过完整版,您可以创建自己的蜡烛规则,并修改传统蜡烛图案以更准确地适应您的策略。 该指标包含了多个示例蜡烛规则,但这里我只展示其中几个: Pattern Rule Candle Green C > O Candle Red C < O Doji C = O Hammer (C > O and (C-O) *2 < O-L and (C-O) *0.5 > H-C) or (C < O and (O-C) *2 < C-L and (O-C) *0.5 > H-O) Hammer Green C > O and (C-O) *2 < O-L and (C-O) *0.5 > H-C Hammer Red C < O and (O-C) *2 < C-L and (O-C) *0.5 > H-O Marubozu (C > O and C-O > (H-L) * 0.7 ) or (C < O and O-C > (H-L) * 0.7 ) Marubozu Green C > O and C-O > (H-
FREE

Norion Candle Range Levels is a professional indicator designed to highlight the maximum and minimum price range of a user-defined number of candles. By selecting a specific candle count, the indicator automatically calculates and plots the highest high and lowest low of that range, providing a clear visual reference of recent market structure, consolidation zones, and potential breakout areas. This tool is especially useful for traders who operate using price action, range expansion, and liquid
FREE

MT4版本 | FAQ Owl Smart Levels Indicator 是一個完整的交易系統,包含 Bill Williams 的高級分形、構建正確的市場波浪結構的 Valable ZigZag 以及標記準確入場水平的斐波那契水平等流行的市場分析工具 進入市場和地方獲利。 策略的详细说明 指示灯使用说明 顾问-贸易猫头鹰助手助理 私人用户聊天 ->购买后写信给我,我会将您添加到私人聊天中,您可以在那里下载所有奖金 力量在於簡單!
Owl Smart Levels 交易系統非常易於使用,因此適合專業人士和剛開始研究市場並為自己選擇交易策略的人。 策略和指標中沒有隱藏的秘密公式和計算方法,所有策略指標都是公開的。 Owl Smart Levels 允許您快速查看進入交易的信號,突出顯示下訂單的水平並向您發送有關已出現信號的通知。 優點很明顯: 清楚地顯示主要和更高時間框架的趨勢方向。 指示儀器信號的出現。 標記開單、止損設置和固定利潤的水平。 沒有多餘的,只有必要的結構! ZigZag 表示全球趨勢的方向,因此也表示貿易方向。 市場反轉點的短線清楚地表明在什麼水平上構建斐波那
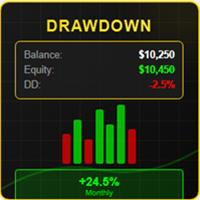
# 回撤指标 V4.0 - 掌控交易的必备工具
## 通过完整的实时绩效概览改变您的交易
在要求严苛的外汇和差价合约交易世界中,**了解您的实时绩效**不是奢侈品,而是**绝对必需**的。**回撤指标 V4.0** 不仅仅是一个简单的指标:它是您的**专业仪表板**,为您提供清晰、精确和即时的交易账户状态视图。
---
## 为什么这个指标将永远改变您的交易
### 90% 交易者面临的问题
您是否曾经遇到过以下情况之一?
**您不确切知道自己的状况** - 您的 MT5 平台显示数字,但您必须心算您的真实表现。
**您发现回撤为时已晚** - 当您意识到已经损失了 15% 的资金时,已经太晚了,无法有效应对。
**您缺乏历史可见性** - 无法快速知道本周、本月或今年是否盈利。
**您浪费时间分析交易** - 您必须打开多个窗口、进行计算,并失去对市场的关注。
**您没有概览** - 有多少持仓?我的全局盈亏是多少?我今天的表现如何?
### 解决方案:一体化专业仪表板
**回撤指标 V4.0** 通过提供一个**完整的控制面板*

Adaptive Hull MA Pro – Trend & Momentum Filter
We value your feedback and believe that your experience with the Hull Moving Average (HMA) is essential to us and other traders. Help us continue to improve and refine our product by sharing your thoughts and insights through a review!
The Hull Moving Average (HMA) Indicator – Your Key to Smoother Trends and Profitable Trades! Are you tired of lagging and choppy moving averages that hinder your ability to spot profitable trading opportunities? Loo
FREE

Solarwind No Repaint是一个技术振荡器,将费舍尔变换应用于标准化价格数据,创建基于直方图的指标来识别潜在的市场转折点。该指标将价格变动转换为高斯正态分布,使周期性模式和动量变化对交易者更加可见。 工作原理 该指标通过几个计算步骤处理价格数据: 高低分析 :计算指定周期内的最高价和最低价 价格标准化 :取每根K线高低价范围的中点,并根据周期范围进行标准化,将数值缩放到-1和+1之间 费舍尔变换应用 :应用数学费舍尔变换公式 0.5 * ln((1+x)/(1-x)) 并进行平滑处理 趋势信号处理 :基于数值变化和动量阈值生成方向性信号 主要特征 直方图显示 :在单独的指标窗口中显示为彩色柱状图 基于趋势的着色 :绿色柱表示看涨动量,红色柱表示看跌动量 无重绘设计 :仅使用已完成的K线以防止当前K线上的信号变化 自适应敏感度 :可配置的阈值系统以过滤市场噪音 信号持续性 :保持趋势方向直到发生显著的动量变化 参数 周期 (Extperiod):用于高低计算的回望周期(默认:10) 信号敏感度 :新信号所需的变化阈值(默认:0.05) 使用完成K线 :通过仅使用完成的K线防
FREE
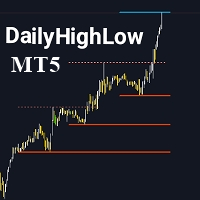
请不要忘记给指标评分,以帮助我提高其可见性。 DailyHighLow 指标是专为 MetaTrader 5 (MT5) 平台设计的强大工具,旨在帮助交易者跟踪每日的价格波动。该指标可以自动绘制趋势线,基于自定义时间段内的最高价和最低价,为需要准确市场信息的交易者提供清晰的视觉辅助。 主要特点: 趋势线个性化设置: 根据您的交易偏好,调整趋势线的颜色、样式和宽度,包括破位线和未破位线。 动态更新: 自动根据最新的市场数据调整趋势线,并使用明显的视觉标记来显示破位情况。 灵活参数设置: 选择显示趋势线的天数,设置破位后趋势线的结束时间,并为最高价和最低价自定义趋势线的外观。 清晰的视觉效果: 通过不同的颜色和线条样式轻松区分破位和未破位的趋势线,使您可以一目了然地识别市场的关键水平。 此指标非常适合希望通过清晰且可自定义的趋势线来增强技术分析的交易者,无论是分析短期趋势还是长期市场动向,DailyHighLow 指标都能为您的交易策略提供宝贵的信息支持。
FREE

Like most things that work in trading, it's really simple. However, it's one of the most powerful tools I have that makes entries of many systems much more precise.
In its essence, it measures the recent volatility against the medium-term average. How does it work? Markets tend to be prone to strong trending movements when relative volatility is low and tend to be mean-reverting when relative volatility is high.
It can be used with both mean-reversion systems (like the Golden Pickaxe) and mo
FREE

正在寻找可以帮助您轻松识别有利可图的交易机会的强大外汇交易指标? Beast Super Signal 就是您的不二之选。 这个易于使用的基于趋势的指标持续监控市场状况,寻找新的发展趋势或跳入现有趋势。当所有内部策略一致且彼此 100% 融合时,Beast Super Signal 会发出买入或卖出信号,无需额外确认。当您收到信号箭头警报时,只需买入或卖出。
购买后给我留言,让我加入我的私人 VIP 群组! (仅限购买完整产品)。
购买后给我发消息以获取最新的优化设置文件。
此处提供 MT4 版本。
在此处 获取 Beast Super Signal EA。
查看评论部分以查看最新结果!
Beast Super Signal 根据您偏好的 1:1、1:2 或 1:3 风险回报率建议入场价、止损和获利水平,让您放心交易。这个 Beast Super Signal 是 100% 不可重新绘制的,这意味着它永远不会重新计算或重新绘制,每次都能为您提供可靠的信号。 Beast Super Signal 指标适用于所有时间范围,包括货币对、指数、商品和加密货币对。 Beast S

FREE

"While our free indicators provide a solid foundation, our paid products offer advanced neural filtering and automated risk management features that help you scale your trading consistency. Upgrade your edge today by visiting our specialized catalog for professional-grade EAs and indicators." Accuracy M1 Scalper is a high-performance indicator developed specifically for traders operating on lower timeframes (M1 and M5). In the scalping environment, every second counts; therefore, this algorithm
FREE

Embrace the Power With Ultimate Trend Trader Indicator. Facing the reality of individual traders, we are far from harnessing the capabilities of AI and high-frequency trading algorithms that dominate today's markets. Without access to massive data centers or infrastructure to compete on microseconds, the battle seems skewed. Yet, the true advantage lies not in technological arms but in leveraging human intellect to outsmart the competition. The Ultimate Trend Trader Indicator embodies this appr
FREE
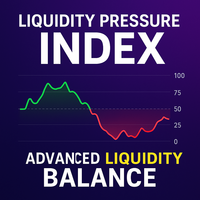
Liquidity Pressure Index (LPI) is an advanced technical indicator designed to uncover the hidden battle between buyers and sellers in the market. Unlike conventional oscillators that only rely on price movements, LPI integrates market depth (order book data), ATR-based volatility compression, and adaptive smoothing to give traders a deeper view of true liquidity dynamics.
By combining price action with volume absorption and order flow pressure, the LPI helps traders anticipate shifts in market
FREE
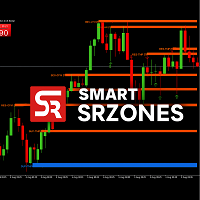
SmartSRZones is an MT5 indicator designed to automatically detect, display, and manage support and resistance zones directly on the chart.
It combines market structure recognition with candlestick pattern detection to help traders view important price levels without manual marking. The indicator is suitable for different trading approaches, including short-term and long-term analysis. Key Features Automatic Zone Detection Identifies support and resistance areas based on swing points, volume, an
FREE

Smart Market Flow Detector (SMFD) v4.0 — Professional Edition Four Algorithms. One Signal. Zero Repainting. Smart Market Flow Detector combines four analytical engines into a single indicator that identifies institutional order flow patterns across all timeframes. Every signal is generated on closed bars only — what you see in back-testing is what you get live. What It Does SMFD scores every bar on two axes: Smart Money Flow (institutional accumulation/distribution) and Dumb Money Flow (retail

这个强大的工具会自动识别趋势线,帮助您简化交易策略并做出更明智的决策。 mt4版本
关键功能 自动趋势线检测 :“基本趋势线”指标扫描了市场的潜在趋势线,并立即在图表上显示它们。这样可以节省您的宝贵时间,并确保您永远不会错过重要的趋势。 用户友好的面板 :我们的指示器配有美丽,直观的面板,可让您轻松绘制各种趋势线。该面板专为所有经验级别的交易者而设计,仅需单击几下即可添加,编辑或删除趋势线。 保存和管理您喜欢的趋势线 :跟踪对您最重要的趋势线。我们的指标使您可以保存首选的趋势线,并在您重新访问图表时始终可用。 多功能应用程序 :无论您是交易外汇,股票还是加密货币,“基本趋势线”指标适应各个市场,为您提供可靠的工具来增强交易策略。 输入 Number of Reactions :您可以确定价格对趋势线反应的次数。 Reaction Strength :一个较高的数字意味着只考虑了更强的反应。 Price Mode :趋势线可以在高/低价格上或关闭/关闭。 Max Length of Trend Line :使用此条目,您可以确定趋势线的最大长度。根据酒吧的数量。 Ext

Индикатор для синхронизации и позиционировании графиков на одном и более терминалах одновременно. Выполняет ряд часто необходимых при анализе графиков функций: 1. Синхронизация графиков локально - в пределах одного терминала при прокрутке, изменении масштаба, переключении периодов графиков, все графики делают это одновременно. 2. Синхронизация графиков глобально - тоже самое, но на двух и более терминалах, как МТ5, так и МТ4. 3. Позиционирование графика на заданном месте при переключении периодо
FREE

ATR Based Swing Trader Indicator Description The ATR Based Swing Trader Indicator is a sophisticated technical analysis tool designed for MetaTrader 5 (MT5) to assist swing traders in identifying potential buy and sell signals based on the Average True Range (ATR) and trend direction. Developed by Rahulkumar Kanani, this indicator leverages volatility and price movement to generate actionable trading signals, making it suitable for traders who aim to capture short- to medium-term price swings in
FREE

DiverX is a powerful and versatile divergence indicator developed for the MetaTrader 5 platform. It detects both Regular and Hidden Divergences based on five popular technical indicators: RSI (Relative Strength Index) , RVI (Relative Vigor Index) , Stochastic Oscillator, CCI (Commodity Channel Index) , and MACD (Moving Average Convergence Divergence) and ATR Plus (author’s proprietary indicator, product page >> ) . The indicator plots results directly on the main chart, providing visual lines
FREE

Automatic Fibonacci Retracement Line Indicator. This indicator takes the current trend and if possible draws Fibonacci retracement lines from the swing until the current price. The Fibonacci levels used are: 0%, 23.6%, 38.2%, 50%, 61.8%, 76.4%, 100%. This indicator works for all charts over all timeframes. The Fibonacci levels are also recorded in buffers for use by other trading bots. Any comments, concerns or additional feature requirements are welcome and will be addressed promptly.
FREE
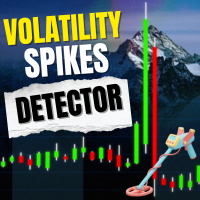
Volatility Monitor – 实时波动检测指标 概述 Volatility Monitor 是一款轻量级且专业的 MT5 指标,用于跟踪突发价格波动并实时提醒交易者。无论您交易外汇、黄金、日元货币对还是加密货币,该工具都能通过 ATR 自动检测或手动点数阈值提供清晰的市场波动信号。 它会在图表上直接标记蜡烛,并发送渐进式提醒,帮助交易者快速应对行情波动、新闻事件和突破行情。 主要功能 实时波动检测 – 即时识别市场波动。 灵活的检测模式 – ATR 自动模式或手动点数模式。 渐进式提醒 – 声音提示 (1–3 次),弹窗通知和推送提醒。 智能蜡烛标记 – 彩色圆点 (黄色/橙色/红色) 标示不同波动强度。 自动适配颜色 – 自动识别深色或浅色图表背景。 内置仪表盘 – 显示实时蜡烛范围、ATR 值、波动百分比及历史峰值。 通用支持 – 兼容外汇、黄金、日元货币对和加密货币。 输入与设置 检测模式: ATR 自动或手动点数。 历史回溯: 自定义分析蜡烛数量。 标记设置: 启用/禁用标记,选择大小和颜色模式。 提醒: 启用声音、弹窗、推送提醒。 仪表盘: 可调整位置,实时显示波
FREE

The OHLC indicator shows the current and historical values of High, Low, Open, Close and Mid for a specific time period. It can plot the current values or the values from the previous session. The indicator's range can be calculated from a daily, weekly, monthly, or user-specified session.
Levels High of the current or previous session. Low of the current or previous session. Open of current or previous session. Close of the current or previous session. Midpoint of the current or prev
FREE

Several assets in several markets have the behavior of using specific numbers as Force Numbers, where support, resistance and price thrust is created. Let this indicator draw those levels of support and resistance for you. You can also stack it to show different level of Prices! This technique is being used by Tape Readers and Order Flow traders all over the world for a long time. Give it a try. Challenge yourself to study new ways of Price Action!
SETTINGS
What Price reference to use in the c
FREE

El AO Hybrid MA Master es un sistema de análisis de momentum avanzado para MQL5 que integra el Awesome Oscillator (AO) de Bill Williams con un modelo de confirmación basado en medias móviles duales . 1. Núcleo del Indicador (Core) Utiliza el algoritmo estándar del AO para medir la fuerza del mercado mediante la diferencia entre una SMA de 5 periodos y una SMA de 34 periodos del precio medio ( $High+Low/2$ ). El histograma está codificado cromáticamente para identificar la aceleración o desaceler
FREE
MetaTrader市场是 出售自动交易和技术指标的最好地方。
您只需要以一个有吸引力的设计和良好的描述为MetaTrader平台开发应用程序。我们将为您解释如何在市场发布您的产品将它提供给数以百万计的MetaTrader用户。
您错过了交易机会:
- 免费交易应用程序
- 8,000+信号可供复制
- 探索金融市场的经济新闻
注册
登录