Conheça o Mercado MQL5 no YouTube, assista aos vídeos tutoriais
Como comprar um robô de negociação ou indicador?
Execute seu EA na
hospedagem virtual
hospedagem virtual
Teste indicadores/robôs de negociação antes de comprá-los
Quer ganhar dinheiro no Mercado?
Como apresentar um produto para o consumidor final?
Indicadores Técnicos para MetaTrader 5 - 21

Highly configurable Trader Dynamic Index (TDI) indicator.
Features: Highly customizable alert functions (at levels, crosses, direction changes via email, push, sound, popup) Multi timeframe ability (higher and lower timeframes also) Color customization (at levels, crosses, direction changes) Linear interpolation and histogram mode options Works on strategy tester in multi timeframe mode (at weekend without ticks also) Adjustable Levels Parameters:
TDI Timeframe: You can set the lower/higher ti
FREE

Overview
Supply & Demand (MTF) v1.00 is a MetaTrader 5 indicator that automatically identifies and draws key supply and demand zones from up to three timeframes on your current chart. Supply zones mark areas where selling pressure was strong; demand zones mark areas where buying pressure was strong. Features Multi-timeframe detection
Scan the current chart plus two higher timeframes for zones. Candle-strength filter
Require a configurable number of strong candles to confirm each zone. Adjust
FREE
This indicator is a technical tool based on harmonic approximations of solar and lunar cycles. It does not use exact astronomical positions. This indicator uses mathematical waves to approximate daily solar and monthly lunar cycles for trading purposes. It captures general market rhythms influenced by day/night and moon phases, but it does not track exact astronomical positions . Do your analysis and study on back test before purchase. The Advanced Astrological Indicator is a m
Multi-Timeframe EMA Trend Detector Pro Advanced EMA trend analysis tool with crossing detection and trend strength confirmation across 5 timeframes. The Multi-Timeframe EMA Trend Detector Pro is a comprehensive indicator built for traders who rely on trend-based strategies. It analyzes Exponential Moving Averages (EMAs) of 50, 100, and 200 across five key timeframes (M15, M30, H1, H4, and Daily) to identify reliable trends, trend reversals, and consolidation periods. Key Features Multi-Timefram
FREE
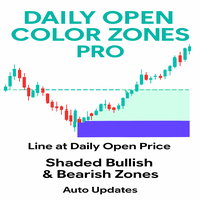
This indicator is a professional tool designed to plot the Daily Open Line and instantly shade the bullish and bearish price zones around it. Instead of leaving traders guessing, it delivers a clear visual map of market sentiment from the very first of the day. Its goal: to help you instantly identify whether the market is trading above or below the daily open — a key reference point for intraday strategies.
The indicator automatically draws a horizontal line at the daily open price and shades
FREE

The Pulse indicador que mostra o período de acumulação em tempo real. Em palavras simples: acumulação é quando o "dinheiro inteligente" coleta silenciosamente um ativo antes de lançar um movimento poderoso no mercado. No gráfico, parece que o preço está "preso" em um intervalo. Esta é a fase de acumulação-alguém está se preparando para uma grande jogada. E se você aprender a perceber esses momentos — quando o mercado parece "congelar", mas ao mesmo tempo a tensão é sentida-você pode estar no lu
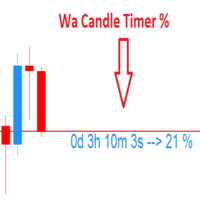
Wa Candle Timer Percentage MT5 is an indicator which shows the user how much time is remaining until the next candle will form. The percentage of the evolution of the current candle is also displayed. The user can set the percentage that the candle timer will change the color. These are the settings: 1- The percentage that the candle timer will change the color. 2- Color of Candle Timer when it's BELOW the percentage set by the user. 3- Color of Candle Timer when it's ABOVE the percentage set b
FREE

Experimente o poder do Indicador de Tendências Demark para uma análise abrangente de tendências e insights de negociação. Os indicadores Demark são conhecidos por sua eficácia na avaliação das tendências de mercado e pontos de exaustão. Nosso Indicador de Tendências Demark leva essa expertise para o próximo nível, traçando automaticamente linhas de tendência precisas em seus gráficos. Com parâmetros personalizáveis, incluindo o número de velas nos cálculos, configurações de alarme e cores de lin
FREE

Support Resistance Catcher Indicator Features and Explanation
Overview: The Support Resistance Catcher is a custom MT5 indicator designed to identify and visualize supply (resistance) and demand (support) zones based on candlestick price action. It detects zones where price has reversed after rallies or drops, using wick rejections and clustering. The indicator draws horizontal rectangles for active and historical zones, with customizable colors, labels, and alerts.
Key Features:
1. Zone Det

Rainbow Volume Profile A simple, lightweight volume profile indicator that visualizes price-range volume with color-coded POCs (Points of Control). Overview RainbowVolumeProfile04Simple.mq5 calculates and displays a price–by–volume (Volume Profile) over a user-specified number of bars. The indicator automatically detects the top 5 volume concentration levels (POCs) and draws a colorful horizontal histogram at the right side of the chart. The computation is lightweight and updates in real time. K
FREE

The indicator has been designed for use on FORTS, but it can also work on other markets, at brokers broadcasting the required data. A peculiarity of these data is that they cannot be requested from the broker's server as a section of history, but can only be obtained for the current moment. The indicator periodically requests the broker, collects to a file and displays the following history from the stored file: The weighted average price. The volume of buy pending orders. The volume of sell pen
FREE
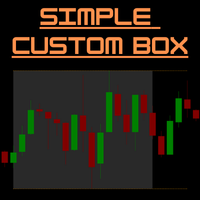
SimpleCustomBox – Indicador de Caixa de Sessão e Linhas de Máxima/Mínima para MT5 Visão geral:
SimpleCustomBox é um indicador poderoso e fácil de usar para o MetaTrader 5 que permite destacar visualmente sessões de negociação específicas no seu gráfico.
Defina intervalos de tempo personalizados, veja instantaneamente a máxima e mínima da sessão e tome decisões mais inteligentes com limites visuais claros.
Perfeito para traders intradiários, scalpers e todos que operam com padrões de preço de cu
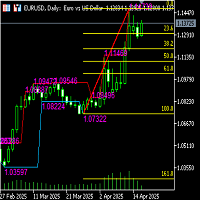
Functional description of automatic Fibonacci line indicator (including high and low channel lines) Indicator name Automatic Fibonacci retracement line + high and low channel auxiliary
Functional introduction This indicator combines the automatically identified high and low points of the band, automatically draws the Fibonacci retracement/extension line, and draws the highest and lowest price channel lines of the current analysis interval to provide traders with clearer support/resistance refe
FREE

Harmonic Pattern Suite Pro Introduction Harmonic Pattern Suite Pro is an indicator designed to identify and display harmonic structures on the chart based on X-A-B-C-D sequences. Its purpose is to present pattern formations that meet geometric and proportional criteria, providing a clear visual representation directly on the chart. The indicator automates the detection process, removing the need for manual measurement of ratios and allowing the user to review the structural configuration withou
FREE

Original supertrend indicator in Tradingview platform. Indicator type: Price Action indicator Introduction: The Supertrend Indicator - Enhancing Your Trend Analysis. If you haven't yet found a Supertrend indicator with good graphics on the MQL5 platform, this is the indicator for you. Overview: The Supertrend Indicator is a powerful tool designed to provide traders with valuable insights into the current and historical trends of financial markets. It serves as a valuable addition to any t
FREE
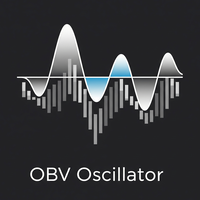
Overview The OBV Oscillator is a custom technical indicator for MetaTrader 5, designed to provide a clearer visualization of On Balance Volume (OBV) by transforming it into an oscillator. This indicator aims to assist traders in identifying trend confirmations, potential reversals, and momentum shifts by analyzing the relationship between price and volume. It features a customizable Moving Average (MA) for smoothing the OBV, a signal line for generating crossover signals, and an alert system to
FREE

O indicador é uma ferramenta analítica que incorpora 37 variações diferentes de médias móveis desenvolvidas por autores como Patrick Mulloy, Mark Jurik, Chris Satchwell, Alan Hull e outros. Ele fornece a capacidade de testes virtuais históricos. O indicador pode ser usado em vários instrumentos, incluindo ouro, criptomoedas, índices de ações, pares de moedas e outros ativos. Um backtester visual integrado permite que os usuários simulem posições de negociação virtuais, rastreiem resultados e ava
FREE

En esta versión, las alertas están funcionando y en la versión que publicó, la zona muerta de atr era solo una zona muerta sin atr, por lo que también la convirtió en una zona muerta de atr.
Indicator input parameters input int Fast_MA = 20; // Period of the fast MACD moving average input int Slow_MA = 40; // Period of the slow MACD moving average input int BBPeriod=20; // Bollinger period input double BBDeviation=2.0; // Number of Bollinger deviations input int Sensetive=
FREE

Volume Weighted Average Price (VWAP) is a trading benchmark commonly used by Big Players that gives the average price a Symbol has traded throughout the day. It is based on both Volume and price. Additionally we put in this indicator the MVWAP (Moving Volume Weighted Average Price). For those who do not know the usage and the importance od this indicator I recommend a great article about this subject at Investopedia ( https://www.investopedia.com/articles/trading/11/trading-with-vwap-mvwap.asp )
FREE

Prevê o movimento mais provável de preços no curto prazo com base em cálculos matemáticos avançados.
Características Estimativa do movimento imediato dos preços ; Calcula a tendência real do mercado; Calcula os níveis de suporte e resistência mais importantes; Algoritmos otimizados para fazer cálculos matemáticos complexos com um uso mínimo de recursos do sistema; Auto-ajustável para um melhor desempenho, por isso é capaz de funcionar corretamente em qualquer ativo (não importa o quanto seja ex
FREE

Volumized Breaker Blocks MTF Supreme Volumized Breaker Blocks MTF Supreme is a powerful and user-friendly multi-timeframe (MTF) indicator that automatically detects and visualizes Order Blocks (OB) and Breaker Blocks (BB) on your chart. This advanced tool is designed for both beginners and professional traders who want a clean, fast, and insightful way to identify key market levels with volume context. Key Features Multi-Timeframe Support : Instantly plot OB/BB zones from up to three customizab
FREE

Swing Points Indicator for MetaTrader 5
The **Swing Points Indicator** is a custom-built technical tool designed for MetaTrader 5 (MT5), primarily used for identifying crucial reversal points in price action. By plotting swing highs and swing lows, it highlights potential trend reversals, making it a valuable tool for traders relying on price action analysis. This indicator helps traders anticipate changes in market direction by visually marking significant turning points on the chart.
Main F
FREE

Se negocias nos mercados financeiros, certamente sabes o quão importante é o spread — esta diferença entre o preço de compra (ask) e o de venda (bid) pode afetar seriamente o teu lucro. Spread Size é um indicador simples, mas muito útil, que exibe o spread atual diretamente no gráfico. Já não precisas de monitorizar os dados manualmente — tudo está bem diante dos teus olhos! Para que serve?
O spread não é apenas um número. É o teu dinheiro real. Um spread baixo significa que a entrada e a sa
FREE

If you love this indicator, please leave a positive rating and comment, it will be a source of motivation to help me create more products <3 Key Takeaways Provides both trend and momentum signals in a single view. Entry and exit signals are based on the crossover of the RSI and Signal Line. Market Base Line offers insight into the overall trend direction. Volatility Bands help identify overbought and oversold market conditions.
FREE
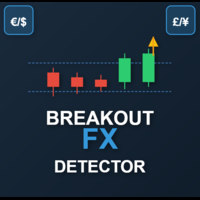
This is a powerful, session-aware breakout indicator designed for serious traders who thrive on volatility and structure. Engineered for precision, it identifies high-probability breakout zones during the London and New York trading sessions—where the market moves with intent. Key Features: Session Range Detection
Automatically detects and highlights the key price range of London and New York sessions. Breakout Confirmation
Identifies breakout candles after the session range, with clear bullis
FREE

Description (English): Trend Test by Subho – Advanced Trend & Step Channel System Trend Test by Subho is a powerful all-in-one trend trading system designed to filter noise and provide clear market direction. This indicator combines two sophisticated algorithms: the Trend Test () and the Subho Step Channel into a single chart overlay. It also features a stylish Live Dashboard that alerts you to the current trend status in real-time. Key Features: Trend Test () Logic: An advanced tr
FREE

Moving Average Convergence/Divergence — схождение/расхождение скользящих средних — технический индикатор, разработанный Джеральдом Аппелем (Gerald Appel), используемый в техническом анализе для проверки силы и направления тренда, а также определения разворотных точек. Встроенный в MetaTrader 5 индикатор MACD не соответствует задумке автора (Gerald Appel):
-линия MACD графически изображена в виде гистограммы, однако гистограммой отражается разница между линией MACD и сигнальной линией;
-сигнальн
FREE

Ignition Candle Guard é um indicador visual para MetaTrader 5 que identifica candles com movimento excessivo em relação ao ATR. O indicador destaca candles cuja amplitude (High–Low) ultrapassa um múltiplo configurável do ATR, ajudando o trader a evitar entradas tardias após movimentos esticados. Este indicador não gera sinais de compra ou venda , não repinta e não executa operações automaticamente.
Ele funciona como um filtro visual de risco , podendo ser utilizado em qualquer estratégia, ativo
FREE

Price Sessions is an exclusive MetaTrader 5 indicator that integrates symbol information and trading sessions into your chart. It does not link to any account information or external sources, ensuring user safety. Main Features: 1. Symbol Information Current Symbol Live Price Live Spread 2. Trading Sessions (Time zone UTC/GMT+0) Tokyo session London session New York session If you find this utility helpful, please rate it. If you encounter any issues or have suggestions, pleas
FREE

Volume at Price (VAP) VAP is a right-anchored Volume Profile Heatmap for MetaTrader 5 designed for clean, fast, and stable execution on any chart. It shows where trading activity clustered, not just when—so you can read balance/imbalance, spot value migration, and plan trades with precise references: VAH, VAL, and POC . What VAP shows Heatmap Profile (tick-volume):
A compact, right-anchored histogram that scales with the chart. Value Area (~70%) in Gold Non-Value in White Soft shadow gradient

This is a simple Orderblock alert indicator. it alerts you once it spots a bullish or bearish OB. what you choose to do with the alert, is left to you. Feel free to test on demo before use. (I'll be working on a combo i.e this and an EA working side by side, anticipate) Bullish OB has a light blue color and bearish has a light red color (rectangle box drawn on chart). Please trade wisely and don't forget to leave a positive review. thanks More blues to you, and Happy Trading!
FREE
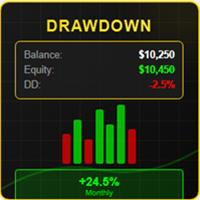
# DRAWDOWN INDICATOR V4.0 - The Essential Tool to Master Your Trading
## Transform Your Trading with a Complete Real-Time Performance Overview
In the demanding world of Forex and CFD trading, **knowing your real-time performance** isn't a luxury—it's an **absolute necessity**. The **Drawdown Indicator V4.0** is much more than a simple indicator: it's your **professional dashboard** that gives you a clear, precise, and instant view of your trading account status.
---
## Why This Indicator

MULTI INDICATOR SCANNER - PROFESSIONAL EDITION
PRODUCT DESCRIPTION
Multi Indicator Scanner is the most comprehensive technical analysis scanner on the market. It analyzes 10 different indicators simultaneously and provides you with clear BUY-SELL-NEUTRAL signals. No more checking dozens of indicators one by one!
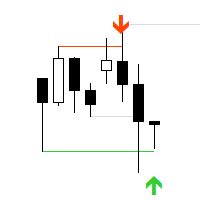
"AV Stop Hunter MT5" is an indicator for MetaTrader 5, which draws entry arrows for long and short after so-called Stop Hunt candles and has several notifications about them. Since this is a smart money concept , the periods H1 and H4 are the best. Increasing volume improves the signal, lines and arrows are then thicker. The MQL5 variant has colored stop-hunting candles. NEW: Signal Buffer: 1, 0 or -1
Definition :
Stop hunting, also known as stop running, is the practice of institutional trad

This is an advanced multi-timeframe version of the popular Hull Moving Average (HMA) Features Two lines of the Hull indicator of different timeframes on the same chart. The HMA line of the higher timeframe defines the trend, and the HMA line of the current timeframe defines the short-term price movements. A graphical panel with HMA indicator data from all timeframes at the same time . If the HMA switched its direction on any timeframe, the panel displays a question or exclamation mark with a tex

Golden Star MT5 é um indicador de tendência profissional para a plataforma MT5 desenvolvido por um grupo de traders profissionais. O algoritmo de seu trabalho é baseado no método do autor original, que permite encontrar potenciais pontos de reversão de tendência com alta probabilidade e receber sinais de entrada no mercado no início da formação de uma tendência. Este indicador é adequado para trabalhar com ouro, criptomoeda e pares de moedas no Forex. O sistema de alerta (alerta, e-mail e notifi

Wyckoff fans, enjoy!
Ideally to be used with the Weis Waves indicator, but it can be easily used alone, the Waves Sizer puts the range (in resulting Price movement) done by the Price on its market swings. You can control how accurate or loose will be the swings. This tool is very helpful for visually know how much the Price has traveled in your Timeframe. This way you can confront this level of effort with the resulting Volume, etc... Weis Waves indicator:
https://www.mql5.com/en/market/produc
FREE

Full implementation of Directional Movement System for trading, originally developed by Welles Wilder, with modifications to improve profitability, to reduce the number of unfavorable signals, and with Stop Loss lines.
No re-paint
Features
Buy/sell signals displayed on the chart Stop levels visually indicated on the chart Profit-taking points presented in the indicator window Exit points for unfavorable positions presented in the indicator window Signal confirmation through high/low swing cros

Session Killzone Indicator
Indicator that helps you to identify the killzone times of both London and NewYork sessions which usually is the most times for high volatility and taking liquidity from the market. Killzone times are configurable through indicator parameters. The indicator adjusts the range of the killzones based on the daily trading range.
FREE

O Indicador Chandelier Exit para MT5 é uma ferramenta poderosa projetada para ajudar os traders a gerenciar operações ajustando dinamicamente os níveis de stop-loss com base na volatilidade do mercado. Ele é baseado no Intervalo Médio Verdadeiro (ATR) e segue a tendência, posicionando os níveis de stop-loss acima ou abaixo do preço conforme a direção da tendência. Isso o torna uma ferramenta eficaz para estratégias de acompanhamento de tendência, negociações de rompimento e gestão de
FREE

Zonas de Suporte e Resistência Baseadas em Volume Volume-based Support and Resistance Zones é um indicador poderoso e flexível para MetaTrader 5 que ajuda os traders a identificar níveis-chave do mercado formados por picos de volume em topos e fundos fractais. Esta ferramenta desenha automaticamente as zonas de suporte e resistência onde o preço tem maior probabilidade de reagir, ajudando você a operar com mais confiança e clareza.
Principais Recursos Lógica baseada em volume : as zonas são cri
FREE

Multitimeframe Viewer HiddenEdge – HTF Realtime MiniChart A clear view of higher-timeframe structure — directly inside your main chart.
No need to switch timeframes anymore. HiddenEdge Multitimeframe Viewer shows the last candles of any higher timeframe in a compact, real-time panel — so you can see the bigger picture while staying focused on execution. Key Features Realtime update: the current higher-timeframe candle is drawn live, updating every second. Select how many candles to display:
FREE

AstroCycles: Advanced Financial Astronomy Indicator Overview AstroCycles is a sophisticated technical analysis tool developed for the MetaTrader 5 (MQL5) platform. It bridges the gap between orbital mechanics and financial market analysis by calculating precise astronomical cycles and visualizing them directly on your trading chart. Unlike standard indicators that rely on past price data, AstroMaster utilizes high-precision astronomical algorithms (Keplerian Elements and Brown’s Lunar Theory)
FREE

This indicator scans for you up to 15 trading instruments and up to 21 time frames for occurrences of the high probability reversal patterns: Double Tops/Bottoms with fake breakouts . What this indicator detects: This indicator detects a special form of Double Tops and Bottoms, so called Double Tops/Bottoms with fake breakouts . For double tops with fake breakouts the highest price of the right shoulder must be higher than the left shoulder. For double bottoms with fake breakouts the lowest pric
This indicator is the mql version of the Linear Regression Candles indicator. There are many linear regression indicators out there, most of them draw lines or channels, but this one actually draws a chart.This script includes features such as linear regression for open, high, low, and close prices, signal smoothing with simple or exponential moving averages. Find out more here: https://www.mql5.com/en/users/rashedsamir/seller I welcome your suggestion for improving the indicator
To incre
FREE

Developed by Charles Le Beau and featured in Alexander Elder's books, the Chandelier Exit sets a trailing stop-loss based on the Average True Range (ATR). The indicator is designed to keep traders in a trend and prevent an early exit as long as the trend extends. Typically, the Chandelier Exit will be above prices during a downtrend and below prices during an uptrend.
Calculation
The original Chandelier Exit formula consists of three parts: a period high or period low, the Average True Rang
FREE

Detailed blogpost: https://www.mql5.com/en/blogs/post/766378
Key Features
Adaptive Upper/Lower bands Smooth Center Line Customizable Length (sensitivity) Non-Repainting (only current ongoing bar is updated every "Refresh After Ticks" number of ticks) Multiple Price Sources - Choose from close, open, high, low, median, typical, or weighted close Components:
The Basis Line The smooth center line represents the weighted average of price. Think of this as the "true" price level when all the noise
FREE

WYSIWYG Candle for WYSIWYG ORB Smart Breakout Candles is a professional multi-method breakout detection indicator that combines ATR, Bollinger Bands, Opening Range Breakout (ORB), and Squeeze Detection to identify high-probability breakout opportunities across all financial instruments. This indicator provides real-time visual signals through colored candles and precise arrow placements, making it ideal for traders seeking reliable volatility-based entries. "Use in conjunction with the WYS
FREE
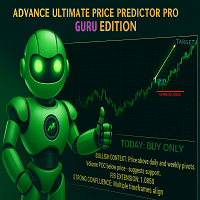
THE ADVANCE PRICE PREDICTOR - GURU EDITION Tired of Guesswork?
Meet the AI-Powered "Almighty Predictor" – Pinpoints High-Probability Targets Before the Move, With Surgical Precision
Stop chasing pips. Start attracting them. Our proprietary algorithm fuses Multi-Timeframe Analysis + Smart Money Concepts + Real-Time Confluence Scoring to give you a clear, calculated edge on every trade.
Are You Constantly Wondering…
"Is this the top, or will it keep going?"
"Where should I real
FREE

Relative Volume or RVOL is an indicator that averages the volume of X amount of days, making it easy to compare sessions volumes.
The histogram only has 3 colors:
Green - Above average volume
Yellow - Average volume
Red - Below average volume
The default setting is 20 days, which corresponds more or less to a month of trading.
In this version is possible to choose between tick and real volumes (if you are using a broker which offers future contracts)
With the data obtained from this in
FREE

MACD Support–Resistance Candle Analyzer — Professional This indicator enhances the classic MACD by combining momentum analysis with dynamic Support & Resistance detection , giving traders a clearer view of breakout strength and market structure. It transforms price action into color-coded MACD candles , highlights SnR break levels , and provides clean visual confirmation of trend continuation or reversal. Ideal for scalpers, intraday traders, and swing traders who rely on fast, structured trend
FREE

Session Box Indicator for MetaTrader 5
Description: The SessionBox indicator is designed to visually represent the trading sessions on a chart, specifically the Asian, European, and American sessions. This indicator draws customizable rectangles around each session, allowing traders to easily identify different trading periods. It also includes labels to denote each session, enhancing clarity.
Users only need to input the session start and end hours in their server time. Please note, the Asia
FREE

Free forever simple pip meter for MT5 with customizable font color. Display profit or loss in both points count and currency value. Supports 4 currency symbols ($,€,£ ,¥). For unsupported currencies, it shows a 3-character currency short form. Enhance your trading interface with clarity and precision. Easy to use and tailored for diverse Forex traders. Perfect for MT5!
FREE

The TMA Centered Bands Indicator for MT5 draws bands on the chart and shows the overall price trend. It displays three bands - the lower and upper boundaries of the channel and the median. The bands are made up of moving averages, and each of them has an MA period. The name TMA comes from triangular moving averages, as the indicator draws triangular bands. The price will fluctuate between these ranges whenever the trend changes direction, thus creating entry and exit points. How to trade
FREE
RSI Bollinger DualStrike Signals offers a clear and structured approach to identifying areas that may be favorable for potential trend reversals. By combining the RSI with Bollinger Bands, the indicator highlights moments when price shows signs of pressure or loss of momentum. The BUY/SELL signals help traders make more organized and disciplined decisions. It is a useful tool for scalping, day trading, or swing trading not to predict the market, but to improve the reading and understanding of pr
FREE

For those who love to follow Volume behavior here it is a little indicator that could be used as a replacement for the old and standard MT5 built-in volume indicator. The trick here is that this indicator paints the volume histogram based on the direction of the candle giving to the trader a quick "Heads Up" on what is happening, visually! It could be used to study and see for instance, the volume and past bars volume during (or, reaching) a peak (Tops and Bottoms). UP candles are shown in pale
FREE

Enhance your price action strategy: inside bar breakouts at your fingertips
This indicator detects inside bars of several ranges, making it very easy for price action traders to spot and act on inside bar breakouts. [ Installation Guide | Update Guide | Troubleshooting | FAQ | All Products ] Easy to use and understand Customizable color selections The indicator implements visual/mail/push/sound alerts The indicator does not repaint or backpaint An inside bar is a bar or series of bars which is/a
FREE

The official release price is $65 only for the first 10 copies, the next price is $125 Gold Scalper System is a multifunctional trading system that combines a breakout strategy for key liquidity levels with confirmation and a built-in Smart DOM Pro module for market depth analysis. The system identifies zones of limit order accumulation, tracks activity at support and resistance levels, and generates signals at the moment of their breako
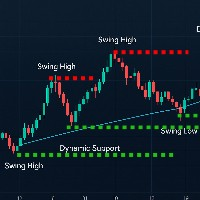
A professional swing point detection indicator that identifies key highs and lows with precision. Features include: Smart Detection : Identifies swing highs/lows based on customizable left/right bar analysis Visual Alerts : Clear arrows and labels (optional) mark swing points Dynamic Lines : Draws support/resistance lines that disappear when price touches them (toggle on/off) Real-Time Alerts : Sound and popup notifications for new swings Non-Intrusive : Preserves all manual chart drawings Perfe
FREE

Indicator Name: CM EMA Trend Bars Overview: The CM EMA Trend Bars indicator is a straightforward yet effective tool that changes the color of price bars based on their relationship to the Exponential Moving Average (EMA). This visual cue helps traders quickly identify trend direction and potential trading opportunities. Key Features: Dynamic Bar Coloring: The indicator changes the color of the bars depending on whether they are above or below the EMA, providing a clear visual representation of t
FREE
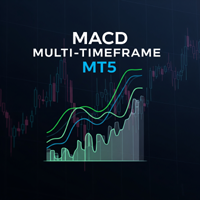
The Multi-Frame MACD Indicator is a robust MetaTrader 5 (MT5) indicator that utilizes the Moving Average Convergence Divergence (MACD) to analyze trends across multiple timeframes. This indicator synchronizes MACD-based trend signals from up to nine timeframes (M1, M5, M15, M30, H1, H4, D1, W1, MN1) and presents them with clear visual cues, including a colored MACD line, signal arrows, and a customizable dashboard. Perfect for traders seeking momentum and trend reversal insights. Features Multi-
FREE

Probability emerges to record higher prices when RVi breaks out oscillator historical resistance level. It's strongly encouraged to confirm price breakout with oscillator breakout since they have comparable effects to price breaking support and resistance levels; surely, short trades will have the same perception. As advantage, a lot of times oscillator breakout precedes price breakout as early alert to upcoming event as illustrated by last screenshot. Furthermore, divergence is confirmed in
FREE

Fibomathe Indicator: Support and Resistance Tool for MT5 The Fibomathe Indicator is a technical analysis tool designed for MetaTrader 5 (MT5) that assists traders in identifying support and resistance levels, take-profit zones, and additional price projection areas. It is suitable for traders who use structured approaches to analyze price action and manage trades. Key Features Support and Resistance Levels:
Allows users to define and adjust support and resistance levels directly on the chart.
FREE

Fazer trades pode ser um tanto cansativo quando você precisa olhar várias coisas ao mesmo tempo. Formato dos candles, suportes, resistências, horários, notícias e indicadores. Essa ferramenta tem o objetivo de facilitar a análise do indicador ADX. Ele colore os candles baseado nos níveis do indicador e das linhas DI. O período,o limite do indicador e as cores dos candles são personalizáveis. Você também poderá colocar uma ajuda visual do lado direito inferior do gráfico para visualizar os valo
FREE

OFERTA ESPECIAL DE LANÇAMENTO - Gratuito até 05/01/2026 ou para os primeiros 100 downloads (o que ocorrer primeiro) Se você está visualizando esta página, ainda está dentro do período exclusivo de lançamento. Após esse limite, o indicador será comercializado normalmente no Market MQL5. Mikko Breakout Indicator – Intelligent Breakout Detection for MetaTrader 5 Professional breakout indicator for MetaTrader 5 designed for Forex, indices and cryptocurrencies. SqueezeMAX Pro é um indicador profiss
FREE
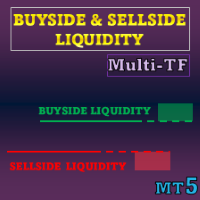
Oferta especial : TODAS AS FERRAMENTAS , apenas $35 cada! Novas ferramentas custarão $30 na primeira semana ou nas primeiras 3 compras ! Canal de Trading Tools no MQL5 : junte-se ao meu canal no MQL5 para receber as últimas novidades Este indicador visualiza níveis de liquidez e zonas de liquidez com base em conceitos ICT, além de Liquidity Voids para destacar deslocamentos de preço unidirecionais. Foca onde ordens stop ou pendentes tendem a se concentrar e como essas á

Big bull scalper Short Description Master market structure with the precision of the popular Big bull scalper This tool automatically identifies key pivot highs and lows, plotting unique "angling" trend lines that dynamically define market context. It visually confirms Breaks of Structure (BOS) and Changes of Character (CHoCH), removing all guesswork from your analysis.
Key Features: Automatic Pivot Detection Instantly spots significant swing highs and lows. Dynamic Angling Lines Visual
FREE
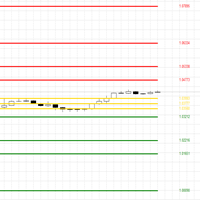
The CPR (Central Pivot Range) Indicator is a powerful technical analysis tool designed to identify key support and resistance levels on your MetaTrader 5 charts. It calculates the Central Pivot (CP) as the average of the previous day's high, low, and close prices, providing a central reference point. Calculates and plots 11 pivot levels (CP, BC, TC, S1-S4, R1-R4) Adjustable lookback period (default: 5 days) Option to show or hide price labels with customizable size and offset Fully customizable
FREE
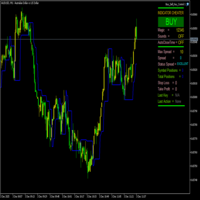
FractalBreakoutLevels Visão geral:
Este indicador traça níveis dinâmicos de preços com base na análise dos movimentos de preços. Combina dados históricos de preços para identificar níveis-chave que podem servir como referência para negociações. Como funciona:
O indicador analisa a estrutura do mercado examinando a relação entre os dados de preços atuais e históricos. Desenha uma linha contínua que se adapta às condições mutáveis do mercado, servindo como um nível dinâmico de suporte/resistênci
FREE

O Nadaraya-Watson Envelope é um indicador baseado em regressão não paramétrica que auxilia os traders a identificar tendências, níveis de suporte e resistência através de bandas suaves e adaptativas. Diferente das médias móveis tradicionais ou dos envelopes baseados em desvio padrão, este indicador aplica a regressão kernel de Nadaraya-Watson , ajustando-se dinamicamente aos movimentos do preço, reduzindo o atraso e mantendo a responsividade.
Principais características: • Detecção de t
FREE
O mercado MetaTrader é um espaço, sem precedentes, para negociar robôs e indicadores técnicos.
Leia o artigo Manual do usuário da MQL5.community para saber mais sobre os serviços exclusivos que oferecemos aos traders: cópia de sinais de negociação, aplicativos personalizados desenvolvidos por freelances, pagamentos automáticos através de sistema de pagamento e a rede em nuvem MQL5.
Você está perdendo oportunidades de negociação:
- Aplicativos de negociação gratuitos
- 8 000+ sinais para cópia
- Notícias econômicas para análise dos mercados financeiros
Registro
Login
Se você não tem uma conta, por favor registre-se
Para login e uso do site MQL5.com, você deve ativar o uso de cookies.
Ative esta opção no seu navegador, caso contrário você não poderá fazer login.