YouTubeにあるマーケットチュートリアルビデオをご覧ください
ロボットや指標を購入する
仮想ホスティングで
EAを実行
EAを実行
ロボットや指標を購入前にテストする
マーケットで収入を得る
販売のためにプロダクトをプレゼンテーションする方法
MetaTrader 5のためのテクニカル指標 - 21

El indicador técnico Trend Magic es una herramienta de análisis de tendencias que combina el Índice de Canal de Mercancía (CCI) y el Rango Verdadero Medio (ATR) para identificar la dirección de la tendencia del mercado. Aquí tienes un resumen de sus pros y contras, así como las mejores condiciones del mercado para su uso:
Pros: - Identificación clara de la tendencia: Cambia de color para indicar tendencias alcistas (azul) y bajistas (rojo), lo que facilita la visualización de la dirección del
FREE

この指標は、YouTube チャンネル「The Secret Mindset」のビデオ「A Reliable Scalping Strategy I Discovered After 1 Month of Price Action Trading」で提案された戦略に基づいています。 信号をフィルタリングするための戦略と条件の完全かつ詳細な説明は、ビデオで公開されています。 * YouTube チャンネルの作成者はこのインジケーターの開発とは関係ありません シグナルは他のインジケーターと組み合わせて、各トレーダーの判断によってフィルタリングする必要があります
インジケーター
前のバーの高値/安値範囲内にあるバーは、インサイドバーと呼ばれます。 インジケーターはオプションでこれらのバーをペイントできます 2 つの連続するインサイドバーはチャネルを作成し、多くの場合サポートレベルまたはレジスタンスレベルとしても機能します
信号
インジケーターは、2 つの異なるモードで信号矢印を表示できます。 FAST: バーが閉じるまでシグナルが再描画されるため、トレーダーはシグナル バーがすでに閉じた
FREE

SuperTrend TV-Style replicates the classic SuperTrend indicator from TradingView, now available for MetaTrader. It uses ATR-based volatility to detect trend direction and plot dynamic buy/sell zones on the chart. Green line: uptrend Red line: downtrend Arrows: buy/sell signals at trend shifts Customizable source price (HL2, HLC3, etc.) and ATR method Simple, fast, and familiar - ideal for traders switching from TradingView or looking for a clean trend-following tool.
FREE

ICT Unicorn Hunter – Multi-Timeframe Smart Setup Detector IMPORTANT: This is a Multi-Timeframe Scanner, looking for 'Unicorn' setups. A Unicorn in this definition is a liquidity sweep, market structure shift and creation of a Fair Value Gap overlapping with the last opposite-close candle before the liquidity sweep (breaker). This scanner does NOT provide visualisation of the Unicorn on the chart.
For visualisation, use the Unicorn Tracker indicator, which is designed to work with the Unicorn
FREE

The XR Gartley Pattern MT5 is an indicator which displays and alerts Gartley pattern detected on the candlestick chart. It also displays potential trade with calculated Take Profit and Stop Loss. After purchasing XR Gartley Pattern Indicator, you can immediately download this indicator from the MT4-MT5 Market and start using it because all features are set to default, is not necessary to change any parameter. In addition, we have created a private group for customers who have purchased one of
FREE

Friend of the Trend: Your Trend Tracker Master the market with Friend of the Trend , the indicator that simplifies trend analysis and helps you identify the best moments to buy, sell, or wait. With an intuitive and visually striking design, Friend of the Trend analyzes price movements and delivers signals through a colorful histogram: Green Bars : Signal an uptrend, indicating buying opportunities. Red Bars : Alert to a downtrend, suggesting potential selling points. Orange Bars : Represent cons
FREE
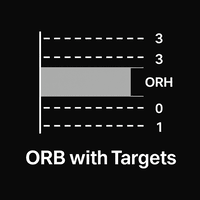
Opening Range Breakout Pro Professional ORB Session Indicator for MT5 Opening Range Breakout Pro is a highly visual, fully customizable Opening Range Breakout (ORB) indicator for MetaTrader 5, designed for intraday, session-based, and prop-firm traders . The indicator automatically plots the Opening Range High and Low , along with multiple target levels above and below the range , allowing traders to clearly visualize breakout zones, retests, and profit objectives directly on the chart. This too

If you love this indicator, please leave a positive rating and comment, it will be a source of motivation to help me create more products <3 How to use SuperTrend? When the price crosses above the supertrend line it signals a buy signal and when the price crosses below the supertrend line it signals a sell signal. The supertrend indicator which acts as a dynamic level of support or resistance and helps traders make informed decisions about entry and exit points. When prices are above s upertre
FREE

Big bull scalper Short Description Master market structure with the precision of the popular Big bull scalper This tool automatically identifies key pivot highs and lows, plotting unique "angling" trend lines that dynamically define market context. It visually confirms Breaks of Structure (BOS) and Changes of Character (CHoCH), removing all guesswork from your analysis.
Key Features: Automatic Pivot Detection Instantly spots significant swing highs and lows. Dynamic Angling Lines Visual
FREE
Free Until 1st Jan 2026
VWAR 2.2 (Volume Weighted Average Roadmap) is an advanced institutional-grade MT5 indicator that brings you the most powerful multi-timeframe VWAP (Volume Weighted Average Price) analysis—plus filtered trade signals using robust trend and momentum confirmations. Key Features: Multi-Timeframe VWAP Lines:
Plots Daily, Weekly, and Monthly VWAP levels for instant market structure insight. Dynamic Buy/Sell Signals: Big, bold colored arrows indicate confirmed buy or sell opp
FREE

The Market Momentum indicator is based on the Volume Zone Oscillator (VZO), presented by Waleed Aly Khalil in the 2009 edition of the International Federation of Technical Analysts journal, and presents a fresh view of this market valuable data that is oftenly misunderstood and neglected: VOLUME. With this new approach of "seeing" Volume data, traders can infer more properly market behavior and increase their odds in a winning trade.
"The VZO is a leading volume oscillator; its basic usefulness
FREE
FULL VERSION https://www.mql5.com/en/market/product/145203?source=Site https://www.mql5.com/en/users/gedeegi/seller
GEN TurboTrend Signals is an adaptive volatility-based trend indicator designed to help traders identify dominant trend directions, key momentum transition points, and projected profit-taking zones in a visual and intuitive manner. The indicator utilizes a temporally-weighted moving average combined with statistical dispersion via standard deviation to construct a dynamic volati
FREE

Multitimeframe Viewer HiddenEdge – HTF Realtime MiniChart A clear view of higher-timeframe structure — directly inside your main chart.
No need to switch timeframes anymore. HiddenEdge Multitimeframe Viewer shows the last candles of any higher timeframe in a compact, real-time panel — so you can see the bigger picture while staying focused on execution. Key Features Realtime update: the current higher-timeframe candle is drawn live, updating every second. Select how many candles to display:
FREE

super trend version is to help you to have real time view of market move it will help you to get a live view of current market buy signal line and arrow to help you understand batter the direction sell signal line and arrow to help you understand batter the direction trade what you see not what you think this is an simple and best trading tool for our traders of any market crypto gold
FREE

Check out my TRADE PLANNER MT5 – strongly recommended to anticipate account scenarios before risking any money. This is the moving average convergence divergence (MACD) indicator based on Heikin Ashi calculations. Here you find multi-colored histogram which corresponds to bull (green) / bear(red) trend. Dark and light colors describes weakness/strenght of price trend in time. Also you can switch calculations between normal and Heikin Ashi price type.
Note: Buffers numbers for iCustom: 0-MACD,
FREE

Product Name: SavasaLaS Tutelage | Pro Price Action Compass Stop guessing. Start trading with Confluence. SavasaLaS Tutelage is not just an indicator; it is a complete trading system designed for the serious Price Action trader. It eliminates chart noise by strictly enforcing the three pillars of institutional trading: Market Structure , Trend Direction , and Candlestick Verification . Unlike standard indicators that flood your chart with weak signals, SavasaLaS Tutelage waits for the "Perfect O
FREE

This is a simple Orderblock alert indicator. it alerts you once it spots a bullish or bearish OB. what you choose to do with the alert, is left to you. Feel free to test on demo before use. (I'll be working on a combo i.e this and an EA working side by side, anticipate) Bullish OB has a light blue color and bearish has a light red color (rectangle box drawn on chart). Please trade wisely and don't forget to leave a positive review. thanks More blues to you, and Happy Trading!
FREE

A heatmap is a graphical representation of data in two dimensions, using colors to display different factors. Heatmaps are a helpful visual aid for viewers, enabling the quick dissemination of statistical or data-driven information. The MP Heatmap indicator provides a graphical representation of the relative strengths of major currencies compared to others, organizing data from pairs into color-coded results and producing a clear overview of the entire Forex market. The MP Heatmap indicator dis
FREE
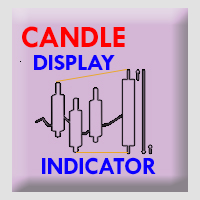
Timeframe Simulator Indicator This indicator redraws candlestick structures from a higher timeframe onto your current chart. It helps visualize higher-period price action without switching timeframes, making it easier to analyze trends and key levels while trading on lower timeframes. Main features: Customizable Candles – Adjust the appearance of higher timeframe candles (bull/bear colors, wick style, gaps, and history length). Higher Timeframe Lines – Optionally display dynamic high, low,
FREE

Overlay indicator on chart between 2 pairs
The Timeframe Overlay indicator displays the price action of timeframes on a single chart, allowing you to quickly assess different timeframes from a single chart. The advantage is to observe and follow the correlations of price movements in real time to help you find potential trades at a glance.
---- Symbol 1 ----
Symbol = EURUSD
Correlation Inverse = false
Display = true
Ratio
FREE

Product Name: HTF Candle Insight (EurUsd) - See the Big Picture Description: IMPORTANT: This version works EXCLUSIVELY on the EURUSD symbol. (It supports all broker prefixes/suffixes, e.g., pro.EURUSD, EURUSD.m, but will NOT work on Gold, Bitcoin, or other pairs). Experience the full power of "HTF Candle Insight" completely on EURUSD! Stop switching tabs constantly! This indicator allows you to visualize Higher Timeframe price action directly on your current trading chart. Whether you are a Sca
FREE

MACD Pro – MACD Indicator for MetaTrader 5 Description
MACD Pro is a Moving Average Convergence Divergence (MACD) indicator for MetaTrader 5. It follows the standard MACD calculation method and displays trend direction and momentum in a separate indicator window. Indicator Elements MACD line based on the difference between fast and slow exponential moving averages Signal line calculated as an exponential moving average of the MACD line Histogram showing the difference between the MACD and signa
FREE

Moving Average RAINBOW Forex traders use moving averages for different reasons. Some use them as their primary analytical tool, while others simply use them as a confidence builder to back up their investment decisions. In this section, we'll present a few different types of strategies - incorporating them into your trading style is up to you! A technique used in technical analysis to identify changing trends. It is created by placing a large number of moving averages onto the same chart. When a
FREE
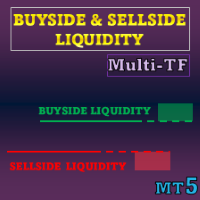
特別オファー : すべてのツール 、各 $35 。 新ツール は 最初の1週間 または 最初の3件の購入 まで $30 です! MQL5 の Trading Tools チャンネル :最新情報を受け取るには私の MQL5 チャンネルに参加してください 本インジケーターは 流動性レベル および 流動性ゾーン を ICT コンセプト に基づいて可視化し、さらに一方向の価格変動を強調する Liquidity Voids を表示します。ストップ注文や指値注文が集まりやすい箇所と、価格がそこを通過した後の推移に焦点を当てます。
MT5 版はこちら: Buyside and Sellside Liquidity MT5 Multi Timeframe MT4 版はこちら: Buyside and Sellside Liquidity MT4 Multi Timeframe その他の製品: All P roducts 主なポイント • カラー分けされたレベルとゾーンにより、双方向の流動性構造(buyside/sellside)を明確化 • レベル

Introduction The Parabolic SAR (Stop and Reverse) indicator is a technical analysis tool designed to identify potential trend reversals and provide trailing stop-loss levels. This enhanced version of the standard Parabolic SAR for MetaTrader 5 offers improved visual clarity, customizable alerts, and an optional trend confirmation filter to assist traders in their analysis. Features Enhanced Visualization: Displays Parabolic SAR dots in two distinct colors (Lime for uptrends, Red for downtrends)
FREE

Highly configurable Trader Dynamic Index (TDI) indicator.
Features: Highly customizable alert functions (at levels, crosses, direction changes via email, push, sound, popup) Multi timeframe ability (higher and lower timeframes also) Color customization (at levels, crosses, direction changes) Linear interpolation and histogram mode options Works on strategy tester in multi timeframe mode (at weekend without ticks also) Adjustable Levels Parameters:
TDI Timeframe: You can set the lower/higher ti
FREE
Range Identifier v3 User Guide 1. Overview The Range Identifier v3 is a technical analysis tool designed to automatically detect and visualize periods of market consolidation, commonly known as ranges. this MQL5 version brings the same powerful logic to the MetaTrader 5 platform. The primary function of this indicator is to draw a channel around recent highs and lows during periods of low volatility. When the price breaks out of this channel, the indicator provides an alert, helping traders iden
FREE

The TMA Centered Bands Indicator for MT5 draws bands on the chart and shows the overall price trend. It displays three bands - the lower and upper boundaries of the channel and the median. The bands are made up of moving averages, and each of them has an MA period. The name TMA comes from triangular moving averages, as the indicator draws triangular bands. The price will fluctuate between these ranges whenever the trend changes direction, thus creating entry and exit points. How to trade
FREE

この指標は、こちらからダウンロードできるMy candleの完全版のデモ版です: Candle Patterns Creator 完全版では、独自のローソク足ルールを作成したり、従来のローソク足パターンを戦略に合わせてより正確に修正することができます。 この指標にはいくつかのローソク足ルールの例が含まれていますが、ここではいくつかをご紹介します: Pattern Rule Candle Green C > O Candle Red C < O Doji C = O Hammer (C > O and (C-O) *2 < O-L and (C-O) *0.5 > H-C) or (C < O and (O-C) *2 < C-L and (O-C) *0.5 > H-O) Hammer Green C > O and (C-O) *2 < O-L and (C-O) *0.5 > H-C Hammer Red C < O and (O-C) *2 < C-L and (O-C) *0.5 > H-O Marubozu (C > O and C-O > (H-L) * 0.7 ) or
FREE

Fair Value Gap Sweep is a unique and powerful indicator that draws fair value gaps on your chart and alerts you when a gap has been swept by the price. A fair value gap is a price gap that occurs when the market opens at a different level than the previous close, creating an imbalance between buyers and sellers. A gap sweep is when the price moves back to fill the gap, indicating a change in market sentiment and a potential trading opportunity.
Fair Value Gap Sweep indicator has the following
FREE
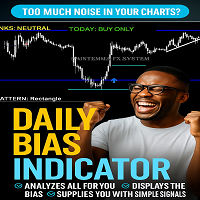
INTRODUCING the Powerful Daily Bias Indicator
The Daily Bias Indicator
Stop Guessing. Start Trading with Confidence.
Tired of staring at your charts and not knowing if today is a buy day or a sell day? The Daily Bias Indicator does the heavy lifting for you.
It scans the market using 7 powerful tools (EMA trend, RSI, MACD, ADX, Volume, Pivot Points & Price Action). It tells you in plain language:
“TODAY: BUY ONLY”
“TODAY: SELL ONLY”
Or “NO CLEAR BIAS” (so you don’t waste money
FREE
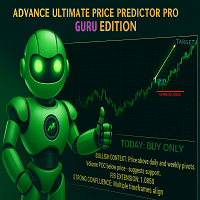
THE ADVANCE PRICE PREDICTOR - GURU EDITION Tired of Guesswork?
Meet the AI-Powered "Almighty Predictor" – Pinpoints High-Probability Targets Before the Move, With Surgical Precision
Stop chasing pips. Start attracting them. Our proprietary algorithm fuses Multi-Timeframe Analysis + Smart Money Concepts + Real-Time Confluence Scoring to give you a clear, calculated edge on every trade.
Are You Constantly Wondering…
"Is this the top, or will it keep going?"
"Where should I real
FREE
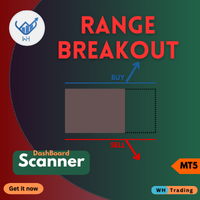
最先端のMQL5インジケーター、Range BreakOut MT5で、取引の新たな次元を解き放ちましょう。
この強力なツールは、価格が設定された範囲を突破したときに価格変動を特定し、それを活用するように設計されています。
金融市場のダイナミックな世界で成功するために必要な精度と自信を提供します。
MT4 バージョン : WH Range BreakOut MT4
特徴:
正確な範囲検出。 複数のシンボルと複数のタイムフレーム (スキャナー)。 リアルタイムのブレイクアウト信号。 カスタマイズ可能なパラメータ。 リスク管理ツール。
当社の製品を選ぶ理由:
精密トレーディング。 時間の節約。 汎用性。 継続的なアップデート。 Range BreakOut スキャナーを使用して、今すぐ取引体験を変革しましょう。
金融市場の複雑な状況を切り抜けるために当社のインジケーターを信頼している成功したトレーダーの仲間入りをしてください。
トレーディングのレベルを引き上げ、今すぐ Range BreakOut をダウンロードしましょう。

Smart Grid MT5 automatically recognizes any symbol, period and scale of the chart and marks it up accordingly. It is possible to mark up the chart by trading sessions. The grid consists of the two main line types.
Vertical lines There are two visualization methods: Standard - the lines are divided into three types, separating: Small time period. Medium time period. Large time period. Trading Session - the lines are divided into groups (a total of ten). Each group has two lines: the first is res
FREE
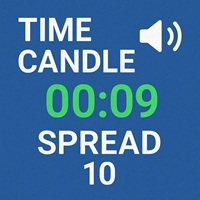
Time Candle with Sound Alert
This indicator will be display the time left candle Features : 1. Multi Time Frames, Multi Pairs 2. Time Left 2. Position dynamic with Bid Price or Edge of Chart Screen 3. Font Size and Color 4. Display Current Spread, Maximum Spread and Minimum Spread
Note: Maximum and Minimum Spread will be reset when you change TF Tested On MT5 Version 5 Build 5200
If you want the source code, just PM me
FREE

RSIアラーム(メタトレーダー5用)
このインジケーターは、すべての設定(周期、色、レベルなど)を備えた通常のRSIのように機能します。
ただし、さらに、アラームを上下のレベルに設定でき(例70および30)、青と赤の線を移動して上下のレベルを確立することにより、これらのレベルを調整することができます。
予想される上限または下限のRSIが満たされたときにチャート上に矢印を作成する追加機能をオンまたはオフにすることもできます。 RSIアラーム(メタトレーダー5用)
このインジケーターは、すべての設定(周期、色、レベルなど)を備えた通常のRSIのように機能します。
ただし、さらに、アラームを上下のレベルに設定でき(例70および30)、青と赤の線を移動して上下のレベルを確立することにより、これらのレベルを調整することができます。
予想される上限または下限のRSIが満たされたときにチャート上に矢印を作成する追加機能をオンまたはオフにすることもできます。

The Spots Indicator can be used for Entering and Exiting your trades based on the common candlestick patterns such as: engulfing, hanging man, doji etc. It is designed to publish desktop and mobile notification every time a signal is triggered. However, it is worth noting that this indicator is recommended to be used with other indicator for confirming the entries. It is best to use it with the Investment Castle Trend Lines indicator and the Supply and Demand indicator .
FREE

Previous Candle Levels MT5 shows the previous candle levels, it shows the previous candle Open High Low Close levels (OHLC Levels) in different time frame. It's designed to help the trader to analyse the market and pay attention to the previous candle levels in different time frame. We all know that the OHLC Levels in Monthly, Weekly and Daily are really strong and must of the time, the price strongly reacts at those levels. In the technical analysis, the user can use them as a support and res
FREE

"We have developed a highly accurate trading signal system applicable to all assets on the 15-minute (M15) timeframe. Calibrated against actual Gold price behavior, this system allows users to trade every candlestick effectively, regardless of market conditions—whether the market is trending, moving sideways, or reversing. The system features real-time arrows and color-coded indicators that signal immediate Buy or Sell entry points. This allows traders to use it as a reliable confirmation tool t
FREE

CandleForce Pro: The Ultimate Decision-Support Dashboard for Modern Traders Introduction: Overcoming the Chaos of Modern Markets
In today's hyper-connected financial markets, the modern trader faces a paradox of choice. We are inundated with an endless stream of data, indicators, news, and strategies, all promising to unlock the secrets of profitable trading. This constant influx often leads to "analysis paralysis"—a state of cognitive overload where conflicting signals create confusion, hesit
FREE
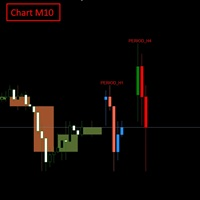
FULL PRODUCT DESCRIPTION Multi-Timeframe Candle Overlay Pro lets you view higher-timeframe candles directly on your current chart with absolute accuracy. When trading lower timeframes like M1–M15, understanding what the H1–H4 candles are forming is a major advantage: you avoid counter-trend entries, read market context faster, and trade with more confidence.
The indicator supports up to 2 higher timeframes, drawing full OHLC candles with precise positioning—no misalignment, no distortion. C
FREE

Adaptive Session Trend Pro Easy Plug-and-Play Auto-Optimized Session Trend Indicator for MT5 Adaptive Session Trend Pro is a fully automatic, session-aware trend indicator for MetaTrader 5 that intelligently adapts to the symbol, instrument type, and broker trading session — with zero manual configuration required . Simply attach the indicator to any chart and it instantly: Detects the traded instrument (XAUUSD, US30, EURUSD, Forex pairs) Detects broker server time automatically Applies the cor
FREE

ADR, AWR & AMR Indicator: Comprehensive Trading Guide Try "Average Daily Range Scalper":
https://www.mql5.com/en/market/product/154469 Core Concepts ADR (Average Daily Range) Definition : The average distance between daily high and low prices over a specified lookback period (typically 14-20 days) Purpose : Measures daily volatility expectations, identifies range-bound versus trending days, sets realistic intraday profit targets Key Insight : Markets tend to respect their average volatility - d
FREE
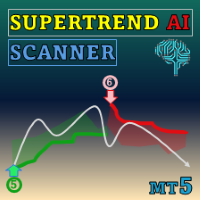
Special offer : ALL TOOLS , just $35 each! New tools will be $30 for the first week or the first 3 purchases ! Trading Tools Channel on MQL5 : Join my MQL5 channel to update the latest news from me SuperTrend AI Clustering MT5 with Scanner でAIの力を発見し、MetaTrader 5 (MT5) 用の革命的な取引ツールです。このインジケーターは、K-means クラスタリングと広く人気のある SuperTrend インジケーターを組み合わせることで市場分析を再定義し、トレーダーがトレンドとシグナルをナビゲートする際に優位性を提供します。 See more MT4 version at: SuperTrend AI Clustering MT4 with Scanner See more products at: h

This Supertrend strategy will allow you to enter a long or short from a supertrend trend change. Both ATR period and ATR multiplier are adjustable. If you check off "Change ATR Calculation Method" it will base the calculation off the S MA and give you slightly different results, which may work better depending on the asset. Be sure to enter slippage and commission into the properties to give you realistic results. If you want automatic trade with Supertrend indicator, please buy following pr
FREE

WYSIWYG Candle for WYSIWYG ORB Smart Breakout Candles is a professional multi-method breakout detection indicator that combines ATR, Bollinger Bands, Opening Range Breakout (ORB), and Squeeze Detection to identify high-probability breakout opportunities across all financial instruments. This indicator provides real-time visual signals through colored candles and precise arrow placements, making it ideal for traders seeking reliable volatility-based entries. "Use in conjunction with the WYS
FREE

123パターン は、最も人気のある強力で柔軟なチャートパターンの1つです。このパターンは、3つの価格ポイントで構成されています。ボトム、ピークまたはバレー、および38.2%〜71.8%のフィボナッチリトレースメントです。パターンは、価格が最後のピークまたは谷、インディケーターが矢印をプロットし、アラートを上昇させ、取引を行うことができる瞬間を超えたときに有効と見なされます。 [ インストールガイド | 更新ガイド | トラブルシューティング | よくある質問 | すべての製品 ]
クリアな取引シグナル カスタマイズ可能な色とサイズ パフォーマンス統計を実装します カスタマイズ可能なフィボナッチリトレースメントレベル 適切なストップロスおよび利益レベルを表示します
インジケーターを使用して、継続パターンまたは反転パターンを見つけることができます 再描画および非再描画ではありません 電子メール/音声/視覚アラートを実装します 123パターン は、継続パターンまたは反転パターンとして現れます。物事を簡単にするために、このインジケーターを使用して、検索するパターンのタイプを選択できるため

Simple Vwap with the daily, weekly and monthly
VWAP is the abbreviation for volume-weighted average price , which is a technical analysis tool that shows the ratio of an asset's price to its total trade volume. It provides traders and investors with a measure of the average price at which a stock is traded over a given period of time.
How it's used Identify entry and exit points: Traders can use VWAP to determine when to buy or sell an asset. Understand price trends : Traders can use V
FREE

HiperCube Market Profile ! Discount code for 20% off at Darwinex Zero: DWZ2328770MGM_20 A Market Profile is a graphical representation that combines price and time information in the form of a distribution . It displays price information on the vertical scale (y-axis) and volume information on the horizontal scale (x-axis). This chart type provides insights into market activity, allowing traders to visualize and evaluate fair market value in real-time.
Features: Custom Colors Custom Chart Cl
FREE

The indicator identifies divergence by analyzing the slopes of lines connecting price and MACD histogram peaks or troughs. Bullish Divergence (Convergence): Occurs when the lines connecting MACD troughs and corresponding price troughs have opposite slopes and are converging. Bearish Divergence: Occurs when the lines connecting MACD peaks and corresponding price peaks have opposite slopes and are diverging. When a divergence signal is detected, the indicator marks the chart with dots at the pric

Gold Master Indicator MT5 - Institutional Precision for XAUUSD The Gold Master Indicator is an advanced analysis tool specifically designed for the unique volatility of the Gold (XAUUSD) market. This indicator not only tracks the price but also identifies liquidity zones and institutional turning points where the probability of reversals is higher.
Unlike standard indicators, Gold Master uses a data smoothing algorithm to eliminate market noise, allowing traders to capture clean movements on t

Jackson Support and Resistance V it a powerful advance support and resistance indicator which provide signal base on price action, it Design to make things easy for everyone to draw support and resistance. we believe most strategies are built with support and resistance as a foundation .Having support and resistance perfect can be a game change to you way of trading. It flexible to all instrument .don't forget to watch our video on how to us this indicator prefect and progressive.
FREE

1. Introduction The Market Squeeze Momentum Indicator (SQZMOM_LB) is a powerful technical analysis tool designed to help traders identify periods of low market volatility (the "squeeze" phase) and predict the direction and strength of price momentum after the squeeze ends. This indicator combines the principles of Bollinger Bands and Keltner Channels to detect changes in market volatility, along with a momentum oscillator to measure buying/selling pressure. 2. Key Components of the Indicator The
FREE
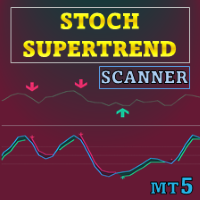
特別オファー : ALL TOOLS 、各 $35 ! 新しいツール は 最初の1週間 または 最初の3件の購入 に限り $30 となります! Trading Tools Channel on MQL5 :最新情報を受け取るために私の MQL5 チャンネルに参加してください 本ツールは Stochastic RSI と SuperTrend ロジックを組み合わせ、モメンタムの変化に基づく方向性シグナルを生成します。Stochastic RSI に SuperTrend 風のエンベロープを重ね、モメンタムが買われ過ぎ/売られ過ぎの閾値を通過する際の転換点を強調表示します。 MT5 版はこちら: Stochastic SuperTrend MT5 Scanner MT4 版はこちら: Stochastic SuperTrend MT4 Scanner その他の製品はこちら: All P roducts 概念 Stochastic RSI: 価格ではなく RSI ラインに確率計算を適用してモメンタムを測定します。 SuperTrend バンド: ユーザー定義の

Like most things that work in trading, it's really simple. However, it's one of the most powerful tools I have that makes entries of many systems much more precise.
In its essence, it measures the recent volatility against the medium-term average. How does it work? Markets tend to be prone to strong trending movements when relative volatility is low and tend to be mean-reverting when relative volatility is high.
It can be used with both mean-reversion systems (like the Golden Pickaxe) and mo
FREE

SWIFT SNIPER COMBO — Advanced Trading Signal Indicator (Non-Repainting) Short Pitch: A precision entry system that fuses a fast/slow MA crossover with robust swing-pivot confirmation to deliver high-probability signals, clear TP/SL levels, and realtime alerts — built for traders who want clean, non-repainting signals and practical risk management. What It Does (Quick Overview) SWIFT SNIPER COMBO combines a smoothed moving-average crossover engine with a swing-pivot detector. Signals are only gen
FREE

Fibomathe Indicator: Support and Resistance Tool for MT5 The Fibomathe Indicator is a technical analysis tool designed for MetaTrader 5 (MT5) that assists traders in identifying support and resistance levels, take-profit zones, and additional price projection areas. It is suitable for traders who use structured approaches to analyze price action and manage trades. Key Features Support and Resistance Levels:
Allows users to define and adjust support and resistance levels directly on the chart.
FREE
Other profitable programs https://www.mql5.com/en/users/ifyjava/seller FNCD指標は、統計的価格正規化とフィッシャー変換を組み合わせて洗練されたオシレーターを作成する高度なテクニカル分析ツールです。基盤はZスコア正規化から始まり、価格データは指定された期間内で現在の価格がその移動平均からどれだけの標準偏差離れているかを計算することによって標準化されます。この正規化プロセスは、生の価格変動を標準化された単位に変換し、楽器の価格レベルに関係なく極端な偏差をより簡単に識別できるようにします。フィッシャー変換は、これらの正規化された値をゼロ周辺で振動する有界オシレーターに変換し、極端な読み取り値は潜在的な反転ゾーンを示します。フィッシャー変換値に2つの指数移動平均が適用されます - 高速EMAと低速EMA - MACDに似ているが統計特性が強化された二重線システムを作成します。高速EMAが低速EMAを下から上に交差すると強気シグナルが生成され、高速線が低速線を上から下に交差すると弱気シグナルが発生します。統計的正規化と
FREE
Volumized OrderBlocks MTF - Multi-Timeframe Volumetric Order Block Indicator
OVERVIEW
Volumized OrderBlocks MTF is an advanced Multi-Timeframe Order Block indicator that automatically detects, displays, and merges Order Blocks from up to 3 different timeframes on a single chart. Built with institutional Smart Money Concepts (SMC) method
FREE

Weis Wave Box で分析力を高めましょう! 取引における正確さと明確さ を求めるなら、 Weis Wave Box が理想的なツールです。この 高度なボリューム波動インジケーター は、市場における努力と結果のダイナミクスを明確に可視化し、フロー読みやボリューム取引を行うトレーダーに不可欠です。 主な特徴: カスタマイズ可能なボリューム波 – ティック単位で調整し、戦略に合わせられます。
調整可能な履歴 – 特定期間の分析をより精密に行えます。
実際のボリューム vs ティック数 – 市場への実際の影響を理解します。
エナジーボックスの視覚化 – 市場が大きな努力を示し、価格変動が小さい箇所を確認できます。
️ 5種類のスイング形態 – totalVol、length、width、barDVol、lengthDVolに基づきカスタマイズ可能。 実際のメリット: ボリューム論理の視覚的明確化 買い手・売り手の力関係の把握 反転や継続の可能性を示す視覚的シグナル 関連インジケーター
Big Player Range – 機関投資家の活動ゾーン

Relative Volume or RVOL is an indicator that averages the volume of X amount of days, making it easy to compare sessions volumes.
The histogram only has 3 colors:
Green - Above average volume
Yellow - Average volume
Red - Below average volume
The default setting is 20 days, which corresponds more or less to a month of trading.
In this version is possible to choose between tick and real volumes (if you are using a broker which offers future contracts)
With the data obtained from this in
FREE

Presentation
Another indicator that makes scalping on tick charts easier, it displays an Heiken Ashi graph in Ticks.
It allows to detect entry points and trend reversals. Recommended number of ticks in a candle : 5, 13 or 21.
Parameters Ticks in candle: Number of ticks in a candle (default 5), Displays Trend arrows : displays a trend arrow based on EMA8 and EMA20 crossing, Displays MM50, Displays MM100, Max Candle (CPU): number of candles max to manage, low value will save ressources of your
FREE

The Chandelier Exit Indicator for MT5 is a powerful tool designed to help traders manage trades by dynamically adjusting stop-loss levels based on market volatility. It is based on the Average True Range (ATR) and follows the trend, placing stop-loss levels above or below price action, depending on the trend direction. This makes it an effective tool for trend-following strategies, breakout trading, and risk management .
Key Features: • Dynamic Stop-Loss Placement – Adjusts stop-
FREE

It predicts the most likely short-term price movement based on advanced mathematical calculations.
Features Estimation of immediate price movement; Calculation of the real market trend; Calculation of the most important support and resistance levels; Algorithms optimized for making complex mathematical calculations with a minimal drain of system resources; Self-adjusting for better performance, so it’s able to work properly at any symbol (no matter how exotic it is) and any timeframe; Compatibl
FREE
Quant Levels Indicator is a premium component of the Quantitative Trading Analysis Toolkit , designed to transform subjective trading into data-driven decision making. This advanced tool provides institutional-grade support and resistance analysis directly on your MT5 charts. " Please support our work by leaving a review ". As a thank-you gift , we’ll share a special template that helps you display signal trade history directly on your chart. Free indicator to visualize any MT5/MT4 signals i
FREE

Мой самый популярный и востребованный продукт здесь https://www.mql5.com/ru/market/product/41605?source=Site+Market+Product+From+Author#
Индикатор стрелочник идеален для торговли в боковике, очень точно показывает моменты перекупленности и перепроданности инструмента, с дополнительными фильтрами также можно использовать для торговли по тренду. На экран выводятся стрелки сигнализирующие о развороте тренда, направление стрелки показывает дальнейшее направление торговли, также имеется звуковое о
FREE

Unlock the full potential of your Pro Thunder V9 indicator with our revolutionary new plugin - Auto Trend Lines! Are you looking for a competitive edge in today's dynamic market? Look no further. With Auto Trend Lines, you can harness the power of precise market trend analysis to make informed trading decisions. This innovative plugin seamlessly integrates with your Pro Thunder V9 indicator, providing you with real-time trend data and pinpointing exact entry and exit points for your trades. Key
FREE
FractalBreakoutLevels 概要:
このインジケーターは、価格変動の分析に基づいて動的な価格レベルをプロットします。過去の価格データを組み合わせて、取引の参考となる重要なレベルを特定します。 動作原理:
このインジケーターは、現在および過去の価格データの関係を分析して市場構造を調べます。変化する市場条件に適応する連続的なラインを描画し、動的なサポート/レジスタンスレベルとして機能します。 レベル形成の原理: インジケーターは複数の連続したバーにわたる分析を組み合わせて使用します レベルは特定の価格関係の下で形成されます 明確なシグナルがない場合、インジケーターは以前の値を保持して連続的なラインを作成します 技術仕様: 価格チャート上で直接動作します 連続的なレベル(青いライン)をプロットします 外部設定はなく、標準的な価格データで動作します 過去の値を再描画しません 応用:
このインジケーターは次の目的で使用できます: 潜在的なサポート/レジスタンスレベルの特定 可能性のあるトレンド反転ポイントの検出 プロットされたレベルに対するストップロスレベルの設定 ブレイク
FREE

This auxiliary indicator displays time left before closing on the current timeframe with continuous update . It also shows the last trade price and variation from a previous day close in percentage and points. This indicator is pretty handy for daytraders and scalpers who want to precisely monitor closing and opening of candles.
Indicator parameters Show in shifted end - Default: False. Display time and values on screen. If True, Displays only time to close aside last candle. Distance from the
FREE

KEY FEATURES: One-Click Chart Switching (Fast Navigation) Simply click on any symbol name in the dashboard, and your chart instantly changes to that pair. Never miss a trade setup again due to slow navigation. Triple Signal Detection Monitors 3 powerful indicators simultaneously for every symbol: RSI Monitor: Detects Overbought/Oversold conditions instantly. Stochastic: Confirms momentum shifts. MA Trend: Identifies the main trend direction (Bullish/Bearish) using Moving Averages. writ Any Symb
FREE
MetaTraderマーケットはMetaTraderプラットフォームのためのアプリを購入するための便利で安全な場所を提供します。エキスパートアドバイザーとインディケータをストラテジーテスターの中でテストするためにターミナルから無料のデモバージョンをダウンロードしてください。
パフォーマンスをモニターするためにいろいろなモードでアプリをテストし、MQL5.community支払いシステムを使ってお望みのプロダクトの支払いをしてください。
取引の機会を逃しています。
- 無料取引アプリ
- 8千を超えるシグナルをコピー
- 金融ニュースで金融マーケットを探索
新規登録
ログイン