MetaTrader 5용 기술 지표 - 21
이 뉴스 도우미는 다양하고 쉬운 필터를 사용하여 터미널의 Market Watch를 기반으로 실시간 뉴스를 게시하는 주요 게시 소스에서 거래자가 필요로 하는 경제 이벤트를 가져오도록 설계되었습니다.
외환 거래자는 거시경제 지표를 사용하여 통화 구매 및 판매에 대한 정보에 근거한 결정을 내립니다. 예를 들어, 거래자가 미국 경제가 일본 경제보다 빠르게 성장할 것이라고 믿는다면 미국 달러를 매수하고 일본 엔화를 매도할 수 있습니다.
이 제품의 특징: 브로커의 시장 관찰을 기반으로 항목 표시 가치는 공개되자마자 이벤트 게시자의 주요 소스로부터 정보 수신 이벤트 값 공개 시 경고 간편한 필터링 가능성 가장 가까운 이벤트 표시 이벤트 값이 공개되기 X분 전에 알림 이벤트에 대한 유용한 설명 이벤트의 현재 가치와 예측 및 중요성을 보여줍니다. 쉽게 작업할 수 있는 그래픽 사용자 인터페이스 빛과 어둠 테마 패널 최소화 및 이동 기능 쉬운 설치 이 기본 도구를 전문 신호 지표와 함께 사용하여
FREE
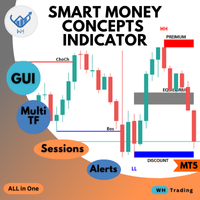
Welcome to the ultimate Smart Money Concepts indicator ,, this indicator is All-in-One package the only thing you need to empower
all the Smart Money Concepts in one place with interactive advanced gui panel with all the features and customization you need. MT4 Version : WH SMC Indicator MT4 *This Price For Limited Number of Copies.
Features: Main Section: User-Friendly Panel (GUI): Designed for traders of all experience levels, the indicator integrates seamlessly into your MT5 platform

This auxiliary indicator displays time left before closing on the current timeframe with continuous update . It also shows the last trade price and variation from a previous day close in percentage and points. This indicator is pretty handy for daytraders and scalpers who want to precisely monitor closing and opening of candles.
Indicator parameters Show in shifted end - Default: False. Display time and values on screen. If True, Displays only time to close aside last candle. Distance from the
FREE
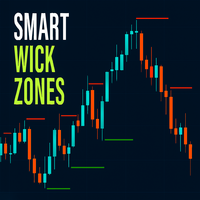
Smart Wick Zones indicator is a powerful tool designed to highlight hidden areas of price rejection and liquidity on your chart. By analyzing candle wicks (also called shadows or tails), the indicator automatically draws horizontal zones where strong buying or selling pressure has previously appeared. These wick zones often mark turning points in the market or areas where price reacts strongly, making them excellent references for support and resistance.
Instead of manually scanning candles for
FREE
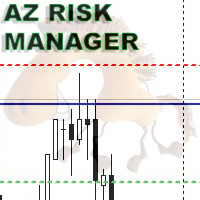
A simple indicator for calculating risk and automatically calculating the take profit line. In the settings, you enter the desired risk to profit ratio, the indicator will automatically calculate the volume for entry and show where to set the take-profit line to maintain the proportion. The risk is calculated based on your balance data. The information panel can be moved around the screen. The stop-loss line can also be moved, this will recalculate the entry volume and the take-profit position.
FREE

https://www.mql5.com/en/users/gedeegi/seller
QuantumFlux Trend combines concepts from statistical physics (temperature T & energy step alpha ) with Boltzmann-style exponential weighting to produce a trend line that is more “context-adaptive” compared to traditional moving averages. The result is then smoothed with an EMA to deliver cleaner signals that are easy to read across all timeframes. The indicator automatically colors candles and trend lines: green for bullish phases, red for bearish
FREE

With this easy to set up indicator you can display and set alerts for the following candlestick formations: Bull Breakout, Bear Breakout, Hammer, Pin, Bullish Engulfing, Bearish Engulfing. Input parameters: ShortArrowColor: The color of the Arrows, displaying a Bearish candle formation LongArrowColor: The color of the Arrows displaying a Bullish candle formation BullishEngulfing: Disabled/Enabled/EnabledwithAlert BearishEngulfing: Disabled/Enabled/EnabledwithAlert Pin: Disabled/Enabled/Enabledw
FREE

Necessary for traders: tools and indicators Waves automatically calculate indicators, channel trend trading Perfect trend-wave automatic calculation channel calculation , MT4 Perfect trend-wave automatic calculation channel calculation , MT5 Local Trading copying Easy And Fast Copy , MT4 Easy And Fast Copy , MT5 Local Trading copying For DEMO Easy And Fast Copy , MT4 DEMO Easy And Fast Copy , MT5 DEMO "Cooperative QQ:556024" "Cooperation wechat:556024" "Cooperative email:556024@qq.com" Strong
FREE
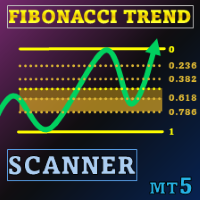
스페셜 오퍼 : ALL TOOLS , 각 $35 에 구매 가능! New tools will be $30 for the first week or the first 3 purchases ! Trading Tools Channel on MQL5 : Join my MQL5 channel to update the latest news from me 변동성이 큰 트레이딩 환경에서 강력하고 직관적인 분석 도구는 신속하게 기회를 포착하는 데 도움이 됩니다. Fibonacci Trend Scanner는 전통적인 피보나치(Fibonacci) 지표 기능과 SuperTrend를 통합할 뿐만 아니라, 통화쌍 스캔, 멀티 타임프레임 모니터링, 그리고 추세가 상승세에서 하락세로(또는 반대로) 전환될 때 인텔리전트 알림을 제공하도록 기능을 확장하였습니다. See more MT4 version at: Fibonacci Trend MT4 Scanner See more products a

피닉스 ATR 변동성 측정기 (MT5)
메타트레이더 5용 실시간 변동성 모니터링 도구입니다. 평균 진폭 범위(ATR)를 활용하여 차트에 현재 시장 변동성을 표시합니다.
목적
시장 변동성은 스탑 배치, 포지션 크기, 슬리피지, 전략 효과성에 직접적인 영향을 미칩니다. 변동성을 인지하지 못한 채 거래할 경우, 급변하는 시장에서는 과도한 위험을 감수하게 되고, 정체된 시장에서는 기회를 놓치게 됩니다.
피닉스 ATR 변동성 측정기는 현재 차트 데이터를 활용해 ATR을 계산하고 해당 값을 차트에 명확히 표시합니다. 측정기는 실시간으로 업데이트되며 심볼 및 시간대 변경에 자동으로 적응하여 트레이더가 시장이 안정적인지, 활발한지, 아니면 매우 변동성이 높은지 평가할 수 있도록 합니다.
설치 방법
MQL5 마켓에서 다운로드하여 원하는 차트에 부착하세요. 미터는 즉시 표시되며 별도의 설정이 필요하지 않습니다.
요구 사항
MetaTrader 5 빌드 3280 이상. 이 지표는 사용자 정
FREE

A useful dashboard that shows the RSI values for multiple symbols and Time-frames. It can be easily hidden/displayed with a simple click on the X top left of the dashboard. You can input upper and lower RSI values and the colours can be set to show when above/below these values. The default values are 70 and 30. You can choose whether the dashboard is displayed on the right or left of the chart. If you want to have 2 dashboards on the same chart you must input a different name for each. The sca
FREE

Utazima Universal AI (MT5 Indicator) Price: Free
Overview Utazima Universal AI is a manual trading indicator that provides a dashboard-style view of selected market structure elements and session/time conditions. It does not place trades.
What it shows (depending on settings) - Market structure and key zones (optional) - FVG/imbalance zones (optional) - Liquidity sweep style markers (optional) - Trend-direction filtering (optional) - Session/time filters for active periods (optional) - Risk/re
FREE

Thermo MAP is a multicurrency and multitimeframe indicator that display a smart heat map based on proprietary calculations. Watch how Forex market moved and is currently moving with a single dashboard and have a consistent and good idea of what is happening!
It can be suitable for both scalping or medium/long term, just select options that better fit your trading style Symbols list are automatically sorted based on the preferred column. There is the possibility to click on: First row, timeframe
FREE
Based on the Extreme Trend Indicator on Trading View converted for MT5. Usage of the Indicator is free, but if you want the source code, you can purchase the source code by messaging me.
Extreme Trend is an indicator that identifies when a new trend is forming and creates a trading signal. This indicator can be used for many markets, forex, gold etc. If you have any inquiries or want to create an EA using this indicator, you can message me.
FREE

Accurate Gold 지표는 트레이더들의 경험 수준과 관계없이 직관적이고 사용하기 쉬운 사용자 친화적인 도구입니다. 이 지표는 황금 시장의 M5 시간 프레임에서 정확한 신호를 찾는 트레이더들을 위해 설계되었습니다. 이 지표는 가격 움직임과 거래량 동태를 분석하기 위해 고급 수학적 알고리즘을 사용하여 정확한 매수 및 매도 신호를 생성합니다. 이 지표의 비리페인트 특성을 포함한 독특한 기능은 트레이더들에게 잠재적인 시장 반전에 대한 가치 있는 통찰력을 제공하여 판단력 있은 의사 결정을 가능케 합니다. 차트 상의 시각적 표현과 함께 청취 가능한 경고 및 푸시 알림이 사용자 경험을 향상시켜 황금 트레이더들의 도구 상자에 정확성과 신뢰성을 찾는 데 유용한 추가 요소가 됩니다. $ XX – 한정된 기간 동안, 가격은 처음 5명의 후원자에게 $ XX 입니다. ( % 매진)
$88 – 그 후, 출시 가격은 $88로 재개되며 골드 심볼로만 제한됩니

The indicator shows the time until the candle closes, as well as the server time on the current chart.
Very easy to use, with only four settings.:
Lable Location-the location of the timer on the graph;
Display server time-to show the server time or not;
Sound alert when the candle is closed-to use a sound signal when closing the candle or not;
Color-the color of the timer digits.
Other useful free and paid products can be viewed here: https://www.mql5.com/ru/users/raprofit/seller
FREE

This indicators automatically draws the support and resistances levels (key levels) for you once you've dropped it on a chart. It reduces the hustle of drawing and redrawing these levels every time you analyse prices on a chart. With it, all you have to do is drop it on a chart, adjust the settings to your liking and let the indicator do the rest.
But wait, it gets better; the indicator is absolutely free! For more information: https://youtu.be/rTxbPOBu3nY For more free stuff visit: https:
FREE
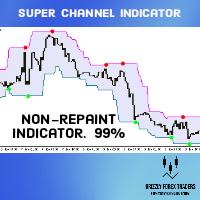
Super Signals Channel Indicator Its channel is a non-repaint indicator that reacts more with recent price movements. For this reason, the Super Signals Channel Indicator is a better match for short-term or day trading strategy. The Super Signals Channel only plots swing trading opportunities. So most of its trade signals appear during consolidation or sidelined periods of the market. Super Signals Channel Indicator for MT5 Explanation The green band below the price shows the dynamic support lev
Volumized OrderBlocks MTF - Multi-Timeframe Volumetric Order Block Indicator
OVERVIEW
Volumized OrderBlocks MTF is an advanced Multi-Timeframe Order Block indicator that automatically detects, displays, and merges Order Blocks from up to 3 different timeframes on a single chart. Built with institutional Smart Money Concepts (SMC) method
FREE

Do you find it difficult to track and manage your open positions across multiple different symbols in MetaTrader 5? Do you need a quick and comprehensive overview of your current market exposure and the performance of each symbol individually? The "Dynamic Exposure Table" indicator is your ideal tool! This indicator displays a clear and detailed table in a separate window below the chart, summarizing all your open positions and intelligently grouping them by symbol, giving you a complete view of
FREE
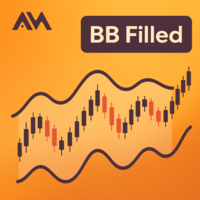
A clean Bollinger Bands indicator with single-color filling designed to reduce chart clutter. What is This Indicator? This is a Bollinger Bands technical indicator designed with visual simplicity in mind. Unlike standard Bollinger Bands implementations that display multiple colored lines and bands, this indicator uses a single-color filled area to represent the trading bands. This approach minimizes visual clutter while maintaining full functionality for technical analysis. How It Works The ind
FREE

스캘퍼를 위한 VWAP
세션 인식 VWAP 라인으로 빠르고 정확한 스캘핑을 수행합니다. ️ 입력 (MT4/MT5) Enable_Hourly_VWAP: 시간별 VWAP 활성화. Enable_Asia_VWAP: 아시아 세션 VWAP 활성화. Enable_Europe_VWAP: 유럽 세션 VWAP 활성화. Enable_NA_VWAP: 북미 세션 VWAP 활성화. Enable_Extended_VWAP: 연장 세션 VWAP 활성화. Enable_Daily_VWAP: 일일 VWAP 활성화. 아시아 세션(GMT) Session_Asia_Start_Hour: 아시아 세션 시작 시간. Session_Asia_End_Hour: 아시아 세션 종료 시간. 유럽 세션(GMT) Session_Europe_Start_Hour: 유럽 세션 시작 시간. Session_Europe_End_Hour: 유럽 세션 종료 시간. 북미 세션(GMT) Session_NA_Start_Hour: 북미 세션 시작 시간. Ses
FREE
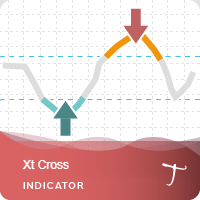
Xt Cross is a port of a famous TS /MT indicator.
When the oscillator is above the overbought band (red lines) and crosses down the signal (dotted line), it is usually a good SELL signal. Similarly, when the oscillator crosses above the signal when below the Oversold band (green lines), it is a good BUY signal.
Xt Cross Advantages The indicator is suitable for scalping and intraday trading. It is possible to evaluate the effectiveness of the indicator on history. The indicator does not
FREE

The Nadaraya-Watson Envelope is a non-parametric regression-based indicator that helps traders identify trends, support, and resistance levels with smooth adaptive bands. Unlike traditional moving averages or standard deviation-based envelopes, this indicator applies the Nadaraya-Watson kernel regression , which dynamically adjusts to price movements, reducing lag while maintaining responsiveness.
Key Features: • Adaptive Trend Detection – Smooths price action while remaining responsive to m
FREE

Trade Hunter MT5 - Buy and Sell Indicator
Unlock precise trading opportunities with Trade Hunter MT5! This powerful indicator identifies potential buy and sell signals by analyzing price movements over a customizable period. Blue arrows mark buy opportunities below key lows, while red arrows highlight sell signals above critical highs. With adjustable parameters like bar range, percentage offset, and alert settings, Trade Hunter adapts to your strategy. Optional alerts and notifications ensur
FREE

Breakout 4-in-1 Package Core Functionality The indicator serves as a "Trend Confirmation Engine." It identifies when the price breaks through a key structural level and then uses secondary oscillators to verify if the move has enough strength to continue. 1. The Breakout Engine (S&R) The foundation of the indicator is identifying Support and Resistance (S&R) . When price closes above resistance or below support, the indicator triggers an alert. Horizontal Levels: Breaks of previous highs/lows or
FREE

피닉스 캔들스틱 패턴 모니터 (MT5)
MetaTrader 5용 실시간 캔들스틱 패턴 감지 및 모니터링 도구입니다. 여러 심볼에 걸쳐 고전적인 캔들스틱 패턴을 자동으로 식별하고 시각적 대시보드를 통해 포괄적인 패턴 통계를 표시합니다.
개요
피닉스 캔들스틱 패턴 모니터는 도지, 해머, 슈팅 스타, 강세 포위, 약세 포위, 모닝 스타, 이브닝 스타, 세 개의 백병, 세 개의 흑조 패턴을 감지하고 추적합니다. 시스템은 최대 18개의 구성 가능한 심볼을 동시에 스캔하며 모니터링되는 각 상품에 대한 패턴 발생 횟수 통계를 유지합니다.
대시보드는 종목명, 총 패턴 발생 횟수, 최근 감지된 패턴을 깔끔한 그리드 형식으로 표시합니다. 감지된 각 패턴은 차트에 시각적 화살표로 표시되며, 상승/하락 신호에 대한 색상을 사용자 정의할 수 있습니다. 패턴 감지는 바 마감 시점에 실행되어 재그리기 없이 확인된 신호를 보장합니다.
모니터링 대상 종목에서 패턴이 형성될 경우 팝업 알림, 소리 알림,
FREE
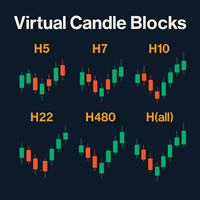
버추얼 캔들 블록(Virtual Candle Blocks) – 한계 없는 시장 시각화 버추얼 캔들 블록 은 MetaTrader 5용 고급 지표로, 플랫폼에 기본적으로 존재하지 않는 맞춤형 시간대의 캔들을 생성하고 시각화할 수 있게 해줍니다. 주요 특징: 맞춤형 시간대: 기본 캔들을 원하는 기간(예: 5시간, 14시간, 28시간, 72시간 등)의 블록으로 묶어 새로운 가상 캔들을 만듭니다. 이를 통해 TradingView와 같은 프리미엄 플랫폼에서만 제공하는 독점적인 시간대에 접근할 수 있습니다. 선명한 시각화: 차트 위에 몸통과 꼬리가 있는 가상 캔들을 직접 그립니다. 색상, 몸통 너비를 맞춤 설정하고, 순수한 가격 행동(price action) 분석을 위해 꼬리를 표시할지 선택할 수 있습니다. 완전 맞춤화 가능: 이 지표에는 선택된 가상 시간대를 보여주는 미니멀리즘 패널이 포함되어 있습니다. 모든 MT5 드로잉 도구와 호환되므로, 가상 캔들 위에 지지선, 저항선, 추세선을 표시할
FREE

멀티 타임프레임 지원, 사용자 정의 가능한 비주얼 신호 및 구성 가능한 알림 시스템을 갖춘 Accelerator Oscillator (AC) 지표.
AC란? Accelerator Oscillator (AC)는 Bill Williams가 개발한 모멘텀 지표로, 현재 구동력의 가속 또는 감속을 측정합니다. 이 지표는 Awesome Oscillator (AO)와 그것의 5 기간 단순 이동 평균 (SMA) 간의 차이로 계산됩니다. AC는 시장 모멘텀이 가속하고 있는지 감속하고 있는지를 보여줍니다. 양수 값은 상승 방향으로의 가속을 나타내고, 음수 값은 하락 방향으로의 가속을 나타냅니다. AC가 제로 라인을 교차할 때, 가속 방향의 변화를 신호합니다. 트레이더들은 추세 강도를 확인하고 잠재적 진입 또는 퇴출 지점을 식별하기 위해 AC를 자주 사용합니다. 기능: 화살표 및 수직선이 있는 비주얼 신호 마커 구성 가능한 트리거가 있는 3개의 독립적인 신호 버퍼 신호 감지 옵션: 방향 변경, 레
FREE

This indicator calculates gann support and resistance prices with use gann pyramid formulation and draw them on the chart. And If you want, Indicator can alert you when the current price arrive these pivot levels. Alert Options: Send Mobil Message, Send E-mail, Show Message and Sound Alert Levels: S1, S2, S3, S4, S5, R1, R2, R3, R4, R5 Inputs: GannInputPrice: Input price for gann pyramid formulation. GannInputDigit: How many digit do you want to use for calculation formula. (The number and the
FREE

The indicator calculates ZigZag using the classic algorithm with three parameters: Depth, Deviation, and Backstep. Its main function is detecting and visualizing repaints — moments when the last ZigZag point shifts to a new bar.
Upon loading, the indicator performs a simulation over the specified history depth. The algorithm sequentially recalculates ZigZag for each bar, comparing the current position of the last point with the previous one. If a shift is detected, a repaint line appears on the
FREE

FTU Qs Buy Sell Arrow MT5
Qqe indicator for mt5, this draws objects as arrows which is okay for manual trading but not reliable for EA/Algo. See Qqe arrows for updated version. The indicator is for MT5 platform, can be used stand alone >> best combined with other indicators and strategies. Many arrow changes at certain times, so best to filter the signals using minimum one concept/logic Combines various indicators such as stochastic, rsi and moving average to draw an arrow for suggestion of e
FREE
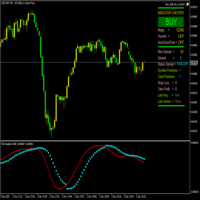
ParabolicSariTriX 는 트렌드 오실레이터 TriX(삼중 지수 이동 평균)와 패러볼릭 반전 시스템(Parabolic SAR)을 결합한 하이브리드 지표입니다. 이 지표는 별도의 창에 표시되며 트렌드 반전 신호를 기반으로 진입 및 퇴출 지점을 식별하도록 설계되었습니다. SAR 점 형태로 명확한 시각적 신호를 제공하며, 시장 트렌드가 변함에 따라 TriX 선을 기준으로 위치가 변경됩니다. SAR 점은 다음과 같이 배치됩니다: 하락 트렌드 시 : TriX 선 위쪽 (매도 신호) 상승 트렌드 시 : TriX 선 아래쪽 (매수 신호) 이 지표는 실제 가격이 아닌 TriX 값을 기반으로 계산되므로 가격 포지션의 트레일링 스탑으로 사용할 수 없음 에 유의해야 합니다. 주요 목적은 TriX 오실레이터의 트렌드 반전을 신호하는 것으로, 다른 분석 도구와 결합할 경우 거래 결정을 위한 필터로 작용할 수 있습니다. 이 지표는 트렌드가 명확한 시장에서 가장 효과적으로 작동하며,
FREE

Trading can be quite tiring when you need to look at several things at the same time.
Format of candles, supports, resistances, schedules, news and indicators.
This tool aims to facilitate the analysis of the ADX indicator. It colors the candles based on the levels of the indicator and the DI lines.
The period, the limit of the indicator and the colors of the candles are customizable. You can also place a visual aid on the lower right side of the graph to view the values of ADX, DI + and DI-
FREE
If you trade on financial markets, you’ve probably realized how important the spread is—the difference between the buy (ask) and sell (bid) price can seriously impact your profit. Spread Size is a simple yet highly useful indicator that displays the current spread right on the chart. No more constantly monitoring data manually—everything is right in front of your eyes! Why is it needed?
The spread isn’t just a number. It’s your real money. A low spread means entering and exiting a trade will
FREE
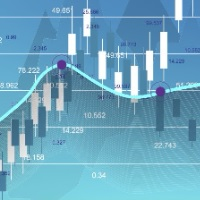
Linear Regression Channel (MTF) Indicator The Linear Regression Channel MTF is an advanced technical indicator that uses statistical analysis to plot a linear regression channel on the price chart, with the capability to display data from a different time frame (Multi Time Frame) for enhanced trend accuracy and analysis. Key Features of the Indicator: Main Line (Linear Regression Line):
Represents the overall price trend over the selected period, allowing traders to easily observe the general s
FREE
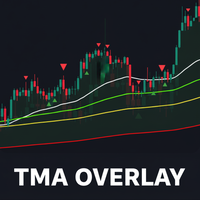
TMA Overlay Indicator for MT5 - User Guide 1. Introduction TMA Overlay is a versatile technical analysis indicator for the MetaTrader 5 platform. The indicator's goal is to provide traders with a comprehensive overview of the trend, potential entry signals, and key trading sessions, all integrated into a single chart. This is not a trading system, but a comprehensive analysis tool designed to help you make more informed decisions. 2. Core Indicator Components The indicator consists of multiple c
FREE

Eagle Spikes Detector v1.50 - Professional Trading Signal System Ultimate Precision Trading with Advanced SuperTrend Filtering Technology join my telegram channel to trade with me: https://t.me/ +9HHY4pBOlBBlMzc8
The Eagle Spikes Detector is a sophisticated, professional-grade trading indicator designed for serious traders who demand precision, reliability, and visual excellence. Combining advanced multi-timeframe analysis with cutting-edge SuperTrend filtering, this indicator identifi
FREE

The Martinware Manual Trading Helper indicator is aimed at helping people start their lives in manual trading. It can be used to display both some generic images at the right side of the graph, where custom operational remarks may be displayed or just a blank rectangle hiding the chart while backtesting. Moreover, it can periodically play a list of sounds. To show a blank rectangle, let the first image name input field empty and select the desired color. To show one or more custom images inste
FREE
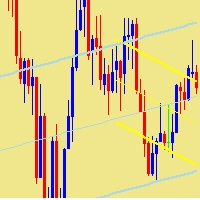
This indicator plots two linear regression channels on the chart for any currency pair or financial instrument, supporting the use of two different timeframes. The first channel uses a shorter period to identify local trends. The second channel uses a longer period to identify overall trends. Each channel displays a main regression line and two lines representing the deviation range. Users can adjust the period of each channel and select the desired timeframe. The indicator helps monitor price m
FREE

If you love this indicator, please leave a positive rating and comment, it will be a source of motivation to help me create more products <3 How to use SuperTrend? When the price crosses above the supertrend line it signals a buy signal and when the price crosses below the supertrend line it signals a sell signal. The supertrend indicator which acts as a dynamic level of support or resistance and helps traders make informed decisions about entry and exit points. When prices are above s upertre
FREE

Developed by Jack Hutson in the 80's, the Triple Exponential Moving Average (a.k.a. TRIX ) is a Momentum technical indicator that shows the percentage of change in a moving average that has been smoothed exponentially 3 times. The smoothing process was put in place in order to filter out price movements that are considered insignificant for the analysis period chosen. We at Minions Labs found hard to follow the smoothness of the original TRIX line, so we colored the TRIX line with BUY and SELL t
FREE
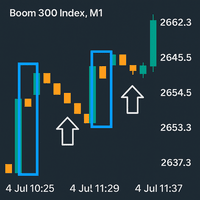
boom Spike Mitigation Zone Pro
A professional spike pattern indicator built for synthetic traders who scalp and swing Boom 500/300/1000/600/900with precision.
This indicator: Detects powerful 3-candle spike formations (Spike → Pullback → Spike) Automatically draws a clean box around the pattern Marks the entry price from the middle candle Extends a horizontal mitigation line to guide perfect sniper entries Automatically deletes & redraws the line once price touches it (mitiga
FREE

피닉스 지지선 및 저항선 탐지기 (MT5)
메타트레이더 5용 전문 지지선 및 저항선 탐지 도구입니다. 상위 시간대에서 가장 강력한 지지선 및 저항선을 자동으로 탐지하고 시각적 대시보드를 통해 포괄적인 강도 분석을 표시합니다.
개요
피닉스 지지선 및 저항선 탐지기는 상위 시간대 피벗 분석(기본 H4, 사용자 정의 가능)을 통해 가장 강력한 세 가지 지지선 및 저항선을 식별합니다. 시스템은 테스트 횟수, 통합 바, 현재 가격과의 근접성에 따라 레벨을 순위화한 후, S1, S2, S3, R1, R2, R3을 보여주는 깔끔한 6열 대시보드를 통해 상세한 지표를 표시합니다.
각 레벨은 다섯 가지 핵심 지표를 표시합니다: 현재 가격, 강도 분류(테스트 횟수 기준 강함/중간/약함), 거리 분류(가까움/보통/멀음), 통합 바 수, 극성 상태. 극성 감지 시스템은 가격이 레벨을 통과할 때 저항 레벨이 지지 레벨로 전환되거나 그 반대의 경우를 식별합니다.
지표는 차트에 자동 가격 라벨이 표시
FREE

This indicator was created as an MT5 version inspired by a TMA RSI Divergence indicator found on TradingView.
This indicator detects both Regular and Hidden divergences using RSI pivot points, similar to TradingView's pivot-based divergence logic.
-------------------------------------------------- Features -------------------------------------------------- • Regular Bullish / Bearish divergence • Hidden Bullish / Bearish divergence • Pivot-based detection (Left / Right bars) • Optional RSI SM
FREE
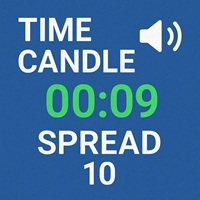
Time Candle with Sound Alert
This indicator will be display the time left candle Features : 1. Multi Time Frames, Multi Pairs 2. Time Left 2. Position dynamic with Bid Price or Edge of Chart Screen 3. Font Size and Color 4. Display Current Spread, Maximum Spread and Minimum Spread
Note: Maximum and Minimum Spread will be reset when you change TF Tested On MT5 Version 5 Build 5200
If you want the source code, just PM me
FREE

이 지표는 My Candle Complete의 데모 버전으로, 여기에서 다운로드할 수 있습니다: Candle Patterns Creator 전체 버전을 사용하면 자신만의 캔들 규칙을 생성하고 전통적인 캔들 패턴을 전략에 맞게 수정하여 더 정확하게 조정할 수 있습니다. 이 지표에는 여러 가지 캔들 규칙 예제가 포함되어 있지만, 여기에서는 일부만을 소개합니다: Pattern Rule Candle Green C > O Candle Red C < O Doji C = O Hammer (C > O and (C-O) *2 < O-L and (C-O) *0.5 > H-C) or (C < O and (O-C) *2 < C-L and (O-C) *0.5 > H-O) Hammer Green C > O and (C-O) *2 < O-L and (C-O) *0.5 > H-C Hammer Red C < O and (O-C) *2 < C-L and (O-C) *0.5 > H-O Marubozu (C > O
FREE

Norion Candle Range Levels is a professional indicator designed to highlight the maximum and minimum price range of a user-defined number of candles. By selecting a specific candle count, the indicator automatically calculates and plots the highest high and lowest low of that range, providing a clear visual reference of recent market structure, consolidation zones, and potential breakout areas. This tool is especially useful for traders who operate using price action, range expansion, and liquid
FREE

MT4 버전 | FAQ Owl Smart Levels Indicator 는 Bill Williams 의 고급 프랙탈, 시장의 올바른 파동 구조를 구축하는 Valable ZigZag, 정확한 진입 수준을 표시하는 피보나치 수준과 같은 인기 있는 시장 분석 도구를 포함하는 하나의 지표 내에서 완전한 거래 시스템입니다. 시장과 이익을 취하는 장소로. 전략에 대한 자세한 설명 표시기 작업에 대한 지침 고문-거래 올빼미 도우미의 조수 개인 사용자 채팅 ->구입 후 나에게 쓰기,나는 개인 채팅에 당신을 추가하고 거기에 모든 보너스를 다운로드 할 수 있습니다 힘은 단순함에 있습니다!
Owl Smart Levels 거래 시스템은 사용하기 매우 쉽기 때문에 전문가와 이제 막 시장을 연구하고 스스로 거래 전략을 선택하기 시작한 사람들 모두에게 적합합니다. 전략 및 지표에는 눈에 보이지 않는 비밀 공식 및 계산 방법이 없으며 모든 전략 지표는 공개되어 있습니다. Owl Smart Levels를 사
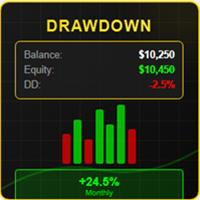
# DRAWDOWN INDICATOR V4.0 - The Essential Tool to Master Your Trading
## Transform Your Trading with a Complete Real-Time Performance Overview
In the demanding world of Forex and CFD trading, **knowing your real-time performance** isn't a luxury—it's an **absolute necessity**. The **Drawdown Indicator V4.0** is much more than a simple indicator: it's your **professional dashboard** that gives you a clear, precise, and instant view of your trading account status.
---
## Why This Indicator

Adaptive Hull MA Pro – Trend & Momentum Filter
We value your feedback and believe that your experience with the Hull Moving Average (HMA) is essential to us and other traders. Help us continue to improve and refine our product by sharing your thoughts and insights through a review!
The Hull Moving Average (HMA) Indicator – Your Key to Smoother Trends and Profitable Trades! Are you tired of lagging and choppy moving averages that hinder your ability to spot profitable trading opportunities? Loo
FREE

Solarwind No Repaint는 정규화된 가격 데이터에 피셔 변환을 적용하는 기술적 오실레이터로, 잠재적인 시장 전환점을 식별하는 히스토그램 기반 지표를 생성합니다. 이 지표는 가격 움직임을 가우시안 정규 분포로 변환하여 주기적 패턴과 모멘텀 변화를 트레이더에게 더 명확하게 보여줍니다. 작동 원리 이 지표는 여러 계산 단계를 통해 가격 데이터를 처리합니다: 고가-저가 분석 : 지정된 기간 동안의 최고가와 최저가를 계산 가격 정규화 : 각 봉의 고가-저가 범위의 중점을 구하고 기간 범위에 대해 정규화하여 -1과 +1 사이의 값으로 스케일링 피셔 변환 적용 : 수학적 피셔 변환 공식 0.5 * ln((1+x)/(1-x)) 를 스무딩과 함께 적용 추세 신호 처리 : 값 변화와 모멘텀 임계값을 기반으로 방향성 신호 생성 주요 특징 히스토그램 표시 : 별도의 지표 창에서 컬러 바로 렌더링 추세 기반 색상 : 강세 모멘텀은 녹색 바, 약세 모멘텀은 빨간색 바 노 리페인트 설계 : 현재
FREE
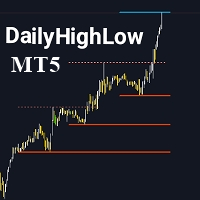
지표를 평가하여 가시성 향상에 도움을 주시기 바랍니다. DailyHighLow 지표는 MetaTrader 5 (MT5) 플랫폼을 위해 개발되었으며, 트레이더가 일일 가격 움직임을 모니터링하는 데 도움을 줍니다. 이 지표는 특정 기간의 최고 및 최저 가격을 기반으로 자동으로 추세선을 그려주어 시장에 대한 시각적 통찰을 제공합니다. 주요 특징: 맞춤형 추세선: 추세선의 색상, 스타일 및 두께를 원하는 대로 조정할 수 있습니다. 비파괴 추세선과 파괴된 추세선을 모두 구성할 수 있습니다. 동적 업데이트: 최신 시장 데이터를 기반으로 추세선이 자동으로 업데이트되며, 파손 시각적 표시기를 제공합니다. 유연한 파라미터: 표시할 일수, 파손 후 선의 종료 시간 및 최고 및 최저 가격의 추세선 외관을 조정할 수 있습니다. 명확한 시각 효과: 파손된 추세선과 비파손된 추세선을 색상과 스타일로 구분하여 중요한 시장 수준을 신속하게 식별할 수 있습니다. DailyHighLow 지표는 거래
FREE

Like most things that work in trading, it's really simple. However, it's one of the most powerful tools I have that makes entries of many systems much more precise.
In its essence, it measures the recent volatility against the medium-term average. How does it work? Markets tend to be prone to strong trending movements when relative volatility is low and tend to be mean-reverting when relative volatility is high.
It can be used with both mean-reversion systems (like the Golden Pickaxe) and mo
FREE

수익성 있는 거래 기회를 쉽게 식별하는 데 도움이 되는 강력한 외환 거래 지표를 찾고 계십니까? Beast Super Signal보다 더 이상 보지 마십시오. 사용하기 쉬운 이 추세 기반 지표는 시장 상황을 지속적으로 모니터링하여 새로운 개발 추세를 찾거나 기존 추세에 뛰어들 수 있습니다. Beast Super Signal은 모든 내부 전략이 정렬되고 서로 100% 합류할 때 매수 또는 매도 신호를 제공하므로 추가 확인이 필요하지 않습니다. 신호 화살표 알림을 받으면 구매 또는 판매하기만 하면 됩니다.
구매 후 비공개 VIP 그룹에 추가되도록 저에게 메시지를 보내주세요! (전체 제품 구매만 해당).
최신 최적화된 세트 파일을 구입한 후 저에게 메시지를 보내주세요.
MT4 버전은 여기에서 사용할 수 있습니다.
여기에서 Beast Super Signal EA를 받으세요.
최신 결과를 보려면 댓글 섹션을 확인하세요!
Beast Super Signal은 1:1, 1:2

In many strategies, it's quite common to use a scaled ATR to help define a stop-loss, and it's not uncommon to use it for take-profit targets as well. While it's possible to use the built-in ATR indicator and manually calculate the offset value, it's not particularly intuitive or efficient, and has the potential for miscalculations.
Features Configurable ATR offset Upper and Lower Band. configurable ATR scaling factor alternate(non-chart) ATR timeframe explicitly defined input types to improv
FREE

"While our free indicators provide a solid foundation, our paid products offer advanced neural filtering and automated risk management features that help you scale your trading consistency. Upgrade your edge today by visiting our specialized catalog for professional-grade EAs and indicators." Accuracy M1 Scalper is a high-performance indicator developed specifically for traders operating on lower timeframes (M1 and M5). In the scalping environment, every second counts; therefore, this algorithm
FREE

Embrace the Power With Ultimate Trend Trader Indicator. Facing the reality of individual traders, we are far from harnessing the capabilities of AI and high-frequency trading algorithms that dominate today's markets. Without access to massive data centers or infrastructure to compete on microseconds, the battle seems skewed. Yet, the true advantage lies not in technological arms but in leveraging human intellect to outsmart the competition. The Ultimate Trend Trader Indicator embodies this appr
FREE
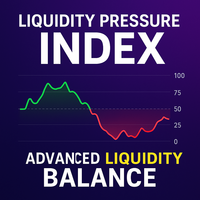
Liquidity Pressure Index (LPI) is an advanced technical indicator designed to uncover the hidden battle between buyers and sellers in the market. Unlike conventional oscillators that only rely on price movements, LPI integrates market depth (order book data), ATR-based volatility compression, and adaptive smoothing to give traders a deeper view of true liquidity dynamics.
By combining price action with volume absorption and order flow pressure, the LPI helps traders anticipate shifts in market
FREE
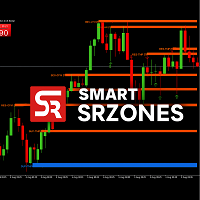
SmartSRZones is an MT5 indicator designed to automatically detect, display, and manage support and resistance zones directly on the chart.
It combines market structure recognition with candlestick pattern detection to help traders view important price levels without manual marking. The indicator is suitable for different trading approaches, including short-term and long-term analysis. Key Features Automatic Zone Detection Identifies support and resistance areas based on swing points, volume, an
FREE

Smart Market Flow Detector (SMFD) v4.0 — Professional Edition Four Algorithms. One Signal. Zero Repainting. Smart Market Flow Detector combines four analytical engines into a single indicator that identifies institutional order flow patterns across all timeframes. Every signal is generated on closed bars only — what you see in back-testing is what you get live. What It Does SMFD scores every bar on two axes: Smart Money Flow (institutional accumulation/distribution) and Dumb Money Flow (retail

이 강력한 도구는 자동으로 추세 라인을 식별하여 거래 전략을 간소화하고보다 정보에 근거한 결정을 내릴 수 있도록 도와줍니다. MT4 버전
주요 기능 자동 추세 라인 감지 : "기본 추세선"표시기는 잠재적 인 추세 라인에 대한 시장을 스캔하고 차트에 즉시 표시합니다.이것은 귀중한 시간을 절약하고 중요한 트렌드를 놓치지 않도록합니다. 사용자 친화적 인 패널 : 우리의 지표에는 다양한 트렌드 라인을 쉽게 그릴 수있는 아름답고 직관적 인 패널이 제공됩니다.이 패널은 모든 경험 수준의 거래자를 위해 설계되어 몇 번의 클릭만으로 추세선을 추가, 편집 또는 제거 할 수 있습니다. 좋아하는 트렌드 라인을 저장하고 관리하십시오. : 가장 중요한 트렌드 라인을 추적하십시오.우리의 지표는 선호하는 추세선을 저장하여 차트를 다시 방문 할 때마다 항상 사용할 수 있도록합니다. 다목적 응용 프로그램 : 당신이 외환, 주식 또는 암호 화폐 거래에 관계없이 "기본 추세선"지표는 다양한 시장에 적

Индикатор для синхронизации и позиционировании графиков на одном и более терминалах одновременно. Выполняет ряд часто необходимых при анализе графиков функций: 1. Синхронизация графиков локально - в пределах одного терминала при прокрутке, изменении масштаба, переключении периодов графиков, все графики делают это одновременно. 2. Синхронизация графиков глобально - тоже самое, но на двух и более терминалах, как МТ5, так и МТ4. 3. Позиционирование графика на заданном месте при переключении периодо
FREE

ATR Based Swing Trader Indicator Description The ATR Based Swing Trader Indicator is a sophisticated technical analysis tool designed for MetaTrader 5 (MT5) to assist swing traders in identifying potential buy and sell signals based on the Average True Range (ATR) and trend direction. Developed by Rahulkumar Kanani, this indicator leverages volatility and price movement to generate actionable trading signals, making it suitable for traders who aim to capture short- to medium-term price swings in
FREE

DiverX is a powerful and versatile divergence indicator developed for the MetaTrader 5 platform. It detects both Regular and Hidden Divergences based on five popular technical indicators: RSI (Relative Strength Index) , RVI (Relative Vigor Index) , Stochastic Oscillator, CCI (Commodity Channel Index) , and MACD (Moving Average Convergence Divergence) and ATR Plus (author’s proprietary indicator, product page >> ) . The indicator plots results directly on the main chart, providing visual lines
FREE

Automatic Fibonacci Retracement Line Indicator. This indicator takes the current trend and if possible draws Fibonacci retracement lines from the swing until the current price. The Fibonacci levels used are: 0%, 23.6%, 38.2%, 50%, 61.8%, 76.4%, 100%. This indicator works for all charts over all timeframes. The Fibonacci levels are also recorded in buffers for use by other trading bots. Any comments, concerns or additional feature requirements are welcome and will be addressed promptly.
FREE
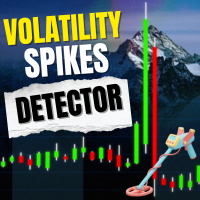
Volatility Monitor – 실시간 변동성 감지 인디케이터 개요 Volatility Monitor는 가볍고 전문적인 MT5 인디케이터로 갑작스러운 가격 변동을 추적하고 실시간으로 트레이더에게 알림을 제공합니다. Forex, 금, JPY 페어, 암호화폐 등에서 ATR 자동 모드 또는 수동 pip 설정을 통해 명확한 신호를 제공합니다. 주요 기능 실시간 변동성 감지. ATR 기반 자동 모드 / 수동 pip 모드. 점진적 알림 (1~3회 비프음, 팝업, 푸시 알림). 컬러 마커 (노랑, 주황, 빨강). 배경 자동 색상 조정. 대시보드 표시: 캔들 범위, ATR, 변동성 %, 역사적 최대치. 모든 심볼 지원. 설정 모드: 자동 ATR / 수동. 계산: 과거 캔들 개수. 마커: 켜기/끄기, 크기, 색상. 알림: 소리, 팝업, 푸시. 대시보드: 위치 조정 가능. 사용 방법 원하는 차트에 인디케이터 적용. ATR 자동 모드 또는 수동 모드 선택. 색상 마커와 알림 확인. 대시보드에서 변
FREE

The OHLC indicator shows the current and historical values of High, Low, Open, Close and Mid for a specific time period. It can plot the current values or the values from the previous session. The indicator's range can be calculated from a daily, weekly, monthly, or user-specified session.
Levels High of the current or previous session. Low of the current or previous session. Open of current or previous session. Close of the current or previous session. Midpoint of the current or prev
FREE

Several assets in several markets have the behavior of using specific numbers as Force Numbers, where support, resistance and price thrust is created. Let this indicator draw those levels of support and resistance for you. You can also stack it to show different level of Prices! This technique is being used by Tape Readers and Order Flow traders all over the world for a long time. Give it a try. Challenge yourself to study new ways of Price Action!
SETTINGS
What Price reference to use in the c
FREE

El AO Hybrid MA Master es un sistema de análisis de momentum avanzado para MQL5 que integra el Awesome Oscillator (AO) de Bill Williams con un modelo de confirmación basado en medias móviles duales . 1. Núcleo del Indicador (Core) Utiliza el algoritmo estándar del AO para medir la fuerza del mercado mediante la diferencia entre una SMA de 5 periodos y una SMA de 34 periodos del precio medio ( $High+Low/2$ ). El histograma está codificado cromáticamente para identificar la aceleración o desaceler
FREE
MetaTrader 마켓은 거래 로봇과 기술 지표들의 독특한 스토어입니다.
MQL5.community 사용자 메모를 읽어보셔서 트레이더들에게 제공하는 고유한 서비스(거래 시그널 복사, 프리랜서가 개발한 맞춤형 애플리케이션, 결제 시스템 및 MQL5 클라우드 네트워크를 통한 자동 결제)에 대해 자세히 알아보십시오.
트레이딩 기회를 놓치고 있어요:
- 무료 트레이딩 앱
- 복사용 8,000 이상의 시그널
- 금융 시장 개척을 위한 경제 뉴스
등록
로그인
계정이 없으시면, 가입하십시오
MQL5.com 웹사이트에 로그인을 하기 위해 쿠키를 허용하십시오.
브라우저에서 필요한 설정을 활성화하시지 않으면, 로그인할 수 없습니다.