Economic Markers
- Indicators
- Flavio Javier Jarabeck
- Version: 1.3
- Updated: 6 June 2020
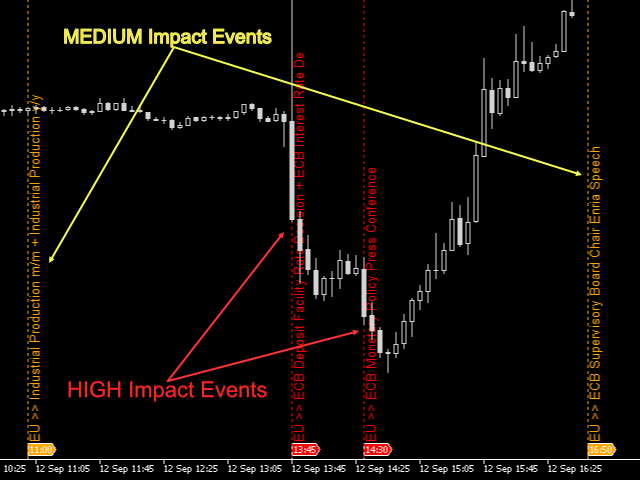
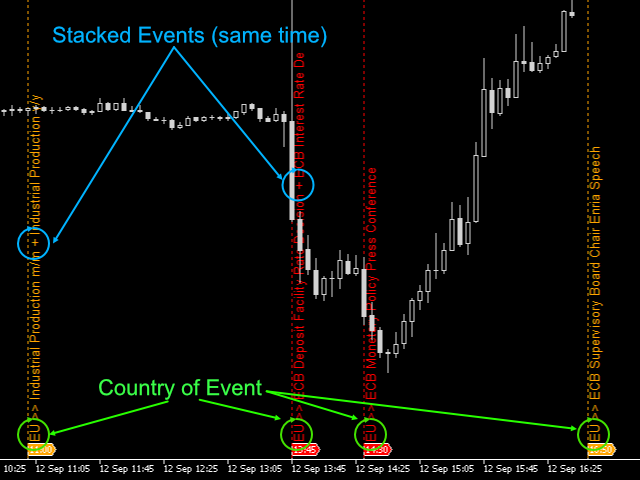
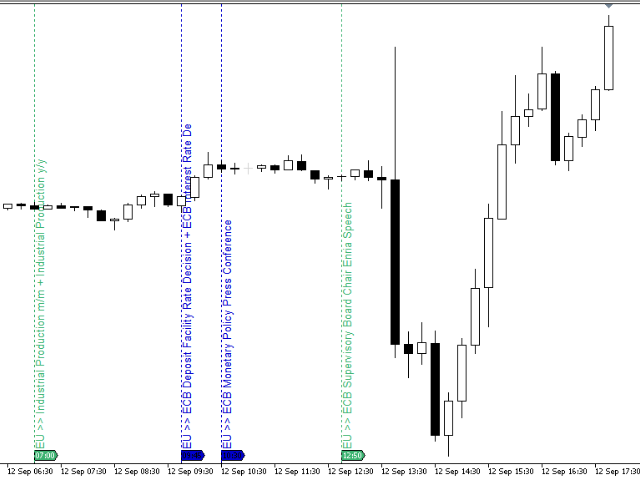
Easily get all relevant economic events of the current day right into your chart, as markers. Filter what kind of markers do you want: by country (selected individually) and by Importance (High relevance, Medium, Low or any combination of these). Configure the visual cues to your liking.
If there is more than one event set to the very same time, their Names will be stacked and you will see the messages merged with the plus (+) sign on the marker. Obviously that long or too much events on the same time will be automatically trimmed due to MT's limitation of this kind of text over the charts...
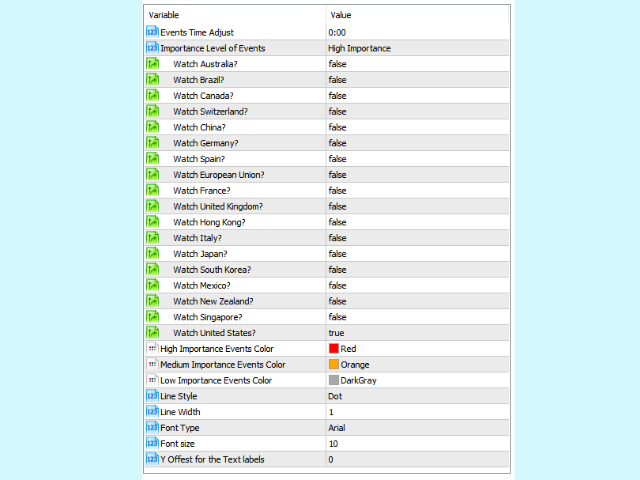
SETTINGS
- Time Adjust - Add or subtract time to adjust and match the Events to your timezone/server time. Due to the limitations and mess that is to use MT5 clients all over the world to operate all markets worldwide, this adjustment is open to the user, avoiding mistakes in automatically trying to calculate the proper Event time for your platform. Just use the MQL5's Economic Calendar page to match the events there to your terminal: www.mql5.com/en/economic-calendar
- Selectable Countries: United States, European Union, Japan, United Kingdom, Canada, Australia, Switzerland, China, New Zealand, Germany, France, Italy, Spain, Brazil, South Korea, Hong Kong, Singapore and Mexico.
- Selectable Importance Levels: Low Impact, Medium Impact, High Impact, Low+Medium, Medium+High, Low+Medium+High.
- Individual Colors for Markers (Low, Medium and High impact)
- Line Styles
- Line Width
- Font Type and Font Size for Event Names.
- Y-axis offset for custom-padding the Event Names.
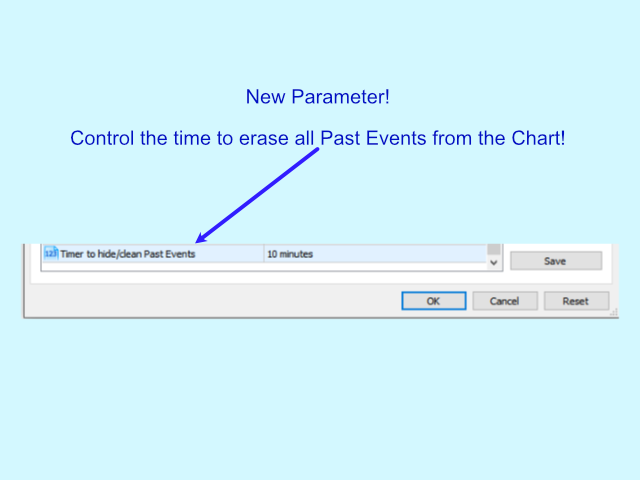
- Timer to clean/erase all past events from chart.
If you need a more powerful version check the Economic Markers PRO...
Important Notes:
- Due to the nature of the data feeding process this indicator DOES NOT WORK with the Strategy Tester.
- When starting the platform on a new day and the market is still closed, unless the Experts tab (log) says that there is an error loading the Calendar Events, all of them were correctly loaded and plotted on the chart. They will only be shown to you when the new day really starts plotting new bars.
- In order to see the news coming upfront in your chart you need to enable the Chart Shift feature - space created intentionally at the right of your chart. And you can use the little "handle" to control the ammount of space needed.
If you like this indicator, all I am asking is a little Review (not a Comment, but a REVIEW!)...
This will mean A LOT to me... And this way I can continue to give away Cool Stuff for Free...
With No Strings Attached! Ever!
Live Long and Prosper!
;)


Super tool. thank you