适用于MetaTrader 5的技术指标 - 17

趋势, 回调, 趋势指标, 波动率, atr, 移动平均线, ema, 动量, 振荡器, 订单流, 德尔塔, 趋势交易, 剥头皮, 日内交易
功能说明
使用移动平均线识别主要趋势。
基于波动率绘制动态回调区域。
显示价格方向性流动(买方或卖方力量)。
帮助读取市场环境,提高交易精度。
我在实盘中是这样使用这个指标的:
当价格运行在红色虚线下方(卖出区)时,市场处于明显的下跌趋势,卖方力量较强。优先寻找在卖出区附近或卖出区内的做空机会。
当价格运行在绿色虚线上方(买入区)时,说明市场处于强势上涨趋势。寻找做多机会,最好在买入区附近或买入区内进场。
趋势的改变通常发生在价格突破某个区域时。但仅仅突破是不够的,突破必须足够有力。通常情况下,一根5分钟级别的K线强势突破并远离该区域,可能预示着趋势的改变。另一种信号是价格开始在卖出区之上运行,这表明趋势可能转为上涨;或者价格运行在买入区之下,表明趋势可能转为下跌。
非常重要的一点是:如果价格只是小幅突破区域却没有延续走势,这可能是假突破,价格往往会回到原来的区域趋势中。如果是买入区,这通常是回调后继续上涨;如果是卖出区,则

RSI ABCD形态查找器:技术策略 1. 指标工作原理 结合 经典RSI 与自动检测 ABCD谐波形态 。 主要组件 标准RSI (可调周期) 高低点标记 (箭头) ABCD形态 (绿/红线) 超买(70)和超卖(30)过滤器 2. MT5设置 period = 14 ; // RSI周期 size = 4 ; // 最大形态尺寸 OverBought = 70 ; // 超买水平 OverSold = 30 ; // 超卖水平 Filter = USE_FILTER_ YES ; // 确认过滤器 3. 交易策略 3.1. 买入信号(看涨ABCD) 条件: RSI形成: 低点( A ) → 高点( B ) → 更高低点( C ) D 高于超卖区(30)但低于 C 确认:绿色连线A-B-C-D 目标: TP1: B-C的61.8% TP2: B-C的100% 止损: 低于 D 3.2. 卖出信号(看跌ABCD) 条件: RSI形成: 高点( A ) → 低点( B ) → 更低高点( C ) D 低于超买区(70)但高于 C 确认:红色连线A-B-C-D 目标: TP1: B-C的6
FREE

指标简介: 该指标来自网络,相对RSI或CCI更加稳定; 该指标绘制趋势线和高低价格区域,它可以用来分析市场趋势并根据趋势设计新的交易系统; 该趋势指标适用于 M1 及以上时间范围; 指标的简单实用方法:如果指标下跌出现橙黄色区域,则可以选择开多或平仓空头,若指标上涨到蓝色区域,则可以选择开空或平仓多头,当出现上或下箭头信号时候可以开启消息提醒功能,前两个参数框“UpMessages/DownMessages”用于修改邮件消息提醒文字; 需要特别说明的是:任何指标都不是万能的,指标是否有用取决于对指标的使用,而不是试图寻找到一个完美无暇的指标,然后凭借这种指标一劳永逸,那是不可能的。 我的其他指标和 EA 可以在这里找到 : https://www.mql5.com/zh/users/hzx/seller
FREE

Description of the Harmonic Patterns + Fib Indicator
The Harmonic Patterns + Fib indicator is a technical analysis tool designed for MetaTrader 5 (MT5). It automatically detects and visualizes harmonic price patterns on financial charts, leveraging Fibonacci ratios to identify potential reversal points in markets such as forex, stocks, cryptocurrencies, and commodities. The indicator scans for classic harmonic formations like Butterfly, Bat, Crab, Shark, Gartley, and ABCD, drawing them with lin
FREE

Aggression Volume Indicator is the kind of indicator that is rarely found in the MQL5 community because it is not based on the standard Volume data provided by the Metatrader 5 platform. It requires the scrutiny of all traffic Ticks requested on the platform... That said, Aggression Volume indicator requests all Tick Data from your Broker and processes it to build a very special version of a Volume Indicator, where Buyers and Sellers aggressions are plotted in a form of Histogram. Additionally,
FREE

Big Figure Levels – Key Psychological Price Zones for MT5 Big Figure Levels is a professional trading tool designed for MetaTrader 5 that automatically identifies and draws major psychological price levels, including quarter and half levels. These levels are known to act as powerful support and resistance zones due to their influence on both institutional and retail trader behavior. This indicator is perfect for any trading style—whether you're a scalper, day trader, or swing trader—and is compa
FREE

受到2016年(05月份)ICT私人辅导课程在YouTube上的启发,我们的创新工具赋予交易者精准驾驭市场的能力。通过标记60、40和20天的周期,它有助于识别重要的市场变动,借鉴了ICT传授的智慧。 这个指标真正与众不同的地方在于它的前瞻能力,这一特点基于对历史数据的深入分析,提供宝贵的未来市场行为洞察。这种前瞻性方法赋予交易者做出明智决策所需的远见,为他们在当今充满活力的交易环境中提供了独特的优势。 此外,我们的指标提供了定制选项,允许交易者根据自己的特定偏好和交易策略进行调整。凭借这种高度的适应性,交易者可以自信地预测市场趋势,利用ICT的教导保持领先地位,并抓住有利可图的机会。 体验我们的指标的前瞻性和定制化能力,开始一段旅程,提升您的交易技能,实现您的财务目标
FREE

The outside bar indicator shows a range of inside bars and the breakout up and down from the range. The breakout is always displayed at the start of a new range and is extended until another breakout. The calculation always takes place at the start of a new candle. So it is displayed accordingly in all time frames. In inside bar ( insidebar ) trading you can see the top and bottom of a range.
In outside bar ( outsidebar ) trading, the breakout from a range and thus the trend following.
The col
FREE

This indicator is designed to help traders to help them Synchronize objects across all charts that have the same pair/currency.
Applicable objects: -Rectangle
-Trendlines
-Trendlines by Angle
-Horizontal Lines
-Vertical Lines
-Arrow Lines
-Channels
- Text boxes
Known Issues : - Visualization is not copied to the other charts. - If indicator is only placed in one chart, other charts with the same pair/currency will have difficulty deleting the objects if there is no "Sync Objects In Charts" in
FREE

Ichimoku Kinko Hyo is a purpose-built trend trading charting system that has been successfully used in nearly every tradable market. It is unique in many ways, but its primary strength is its use of multiple data points to give the trader a deeper, more comprehensive view into price action. This deeper view, and the fact that Ichimoku is a very visual system, enables the trader to quickly discern and filter "at a glance" the low-probability trading setups from those of higher probability. This i
FREE

The Entry IQ Indicator is a technical analysis tool designed to assist traders in identifying potential entry points for long and short positions. It utilizes dynamic price boxes, equilibrium zones, and trend detection algorithms to analyze market trends and price movements. The indicator adapts to different broker price digit formats, provides customizable arrow signals, and plots real-time trendlines to refine signal accuracy. By assessing price action over a specific lookback period, Entry I
FREE

HMA Color – Master Smoothed A clean, high-precision visual Hull Moving Average indicator with fully smoothed trend color display. Designed for professional scalpers and algorithmic traders who want a simple, fast, powerful trend view without noise. This indicator is built with a double smoothing system , making the Hull curve extremely soft and responsive.
When the trend is bullish, the HMA line automatically switches to Green and shows upward candles.
When the trend is bearish, the HMA line swi
FREE

This indicator is a simple tool to spot a possible trend.
When the ribbon below the price bars, It will turn to Green color and the trend is seen to be bullish When the ribbon above the price bars, it will turn to Red color and the trend is seen to be bearish. It can be used a either Entry Signal Exit Signal or trailing stop, so it is very versatile. By default color : Green is UP trend and Red is Down trend and this work perfect with Bar4Colors.ex5
FREE

艾略特振荡器 - 一个通过移动平均线收敛模式检测趋势反转的动量分析工具。该指标显示蓝色直方图表示看涨动量,红色直方图表示看跌条件,同时自动绘制连接重要峰值和谷值的趋势线。 警报系统 :在两种模式之间选择 - 当前K线警报(alertsOnCurrent = true)在形成中的K线上立即触发但可能重绘,而确认K线警报(alertsOnCurrent = false)等待K线完成,提供可靠的无重绘信号。对于一致的交易决策,确认警报消除了来自初步信号的虚假入场。 关键特征 :内置峰值检测与指数平滑减少市场噪音并识别有意义的动量变化。该振荡器在横盘市场条件下作为 退出警告 系统表现出色,帮助交易者避免长期整合期。 最佳实践 :使用确认警报模式避免实时警报中出现的信号变化,确保您的交易策略依赖于稳定、完整的K线数据,而不是波动的初步读数。
FREE

ChannelRSI5 具有超买和超卖区域动态水平的相对强弱指数 (RSI) 指标。
动态水平随指标和价格的当前变化而变化和调整,代表一种通道。
指标设置 period_RSI - 计算 RSI 指数的平均周期。 Applied_RSI - 应用价格。它可以是任何价格常数:PRICE_CLOSE - 收盘价,PRICE_OPEN - 开盘价,PRICE_HIGH - 期间的最高价,PRICE_LOW - 期间的最低价,PRICE_MEDIAN - 中间价(高 + 低) / 2, PRICE_TYPICAL - 典型价格(最高价 + 最低价 + 收盘价)/ 3, PRICE_WEIGHTED - 加权平均价,(最高价 + 最低价 + 收盘价 + 收盘价)/ 4。
period_channel - 超买超卖区域动态通道的计算周期。
FREE

This indicator calculates gann support and resistance prices with use gann pyramid formulation and draw them on the chart. And If you want, Indicator can alert you when the current price arrive these pivot levels. Alert Options: Send Mobil Message, Send E-mail, Show Message and Sound Alert Levels: S1, S2, S3, S4, S5, R1, R2, R3, R4, R5 Inputs: GannInputPrice: Input price for gann pyramid formulation. GannInputDigit: How many digit do you want to use for calculation formula. (The number and the
FREE

使用此指标获取市场内发展趋势的警报。
使用此指标,您将能够获得有关市场发展趋势的警报。 该指标可用于识别趋势中的入口或出口。 该指标结合了来自更高时间框架的信息,以及当前时间框架的价格变动,以输出买入或卖出信号。 该指标可以识别趋势变化,或主导趋势的延续。
注意:趋势跟踪的赢率很低,但趋势的回报可能是平均损失的3到5倍。 简单的设置 拖放到任何图表,在任何时间框架. 启用警报(可选) 你就完了! 视觉和音频警报 警报直接发送到您的手机 弹出警报发送到您的终端 多用途 股票、外汇、期权、期货 灵活 适用于任何时间范围
注意:趋势跟踪的赢率很低,但趋势的回报可能是平均损失的3到5倍。 注意:趋势跟踪的赢率很低,但趋势的回报可能是平均损失的3到5倍。
FREE

The Spots Indicator can be used for Entering and Exiting your trades based on the common candlestick patterns such as: engulfing, hanging man, doji etc. It is designed to publish desktop and mobile notification every time a signal is triggered. However, it is worth noting that this indicator is recommended to be used with other indicator for confirming the entries. It is best to use it with the Investment Castle Trend Lines indicator and the Supply and Demand indicator .
FREE

The indicator automatically identifies the 1-2-3 pattern on the chart. The indicator is able to monitor the formation of pattern in real time. It informs the trader when the pattern is completely formed (when the price breaks the line in point 2) and displays the completed patterns in history. The patterns are never redrawn. The indicator can identify patterns on any instruments (currency pairs, stock market, gold, etc.) without the need to adjust to each instrument. Simple and clear visualizati

The indicator analyzes the chart and identifies Doji candlesticks. Shows their appearance and signals the appearance of such a candle (if allowed in the parameters). Also, this indicator shows the strength of the reversal in the form of bars of different colors (the more green, the more likely the rise, the more red - the fall in price). The direction of the signal depends on the direction of the previous candles, as the Doji signals a reversal or correction. In the indicator settings, you can
FREE

Pivot Point Supertrend (corresponds to Pivot Point Super Trend indicator from Trading View) Pivot Point Period: Pivot point defined as highest high and highest low... input 2 = defining highest high and highest low with 2 bars on each side which are lower (for highest high) and are higher (for lowest low calculation) ATR Length : the ATR calculation is based on 10 periods ATR Factor: ATR multiplied by 3
FREE

考拉趋势线升级到1.2版
上一次升级改进:添加了新参数,允许用户将趋势线连接到第二或第三或第X最高或最低点。
我的请求 :
**尊敬的客户,请在Koala趋势线上发布您的评论,让我通过您的反馈进行改进。
为什么科拉趋势线是免费指示器?
我相信免费指标必须是合格的工具。
关于其他免费产品呢?
所有带有绿色考拉徽标的产品都是我的免费产品
https://www.mql5.com/zh-CN/users/ashkan.nikrou/seller#products
考拉趋势线介绍:
我做了这个指标来帮助交易者更好地找到趋势,该指标可以显示当前趋势线。
如您所知,趋势线必须在2个最高点或最低点之间绘制。
因此,主要逻辑是找到最高和最低点。
指标查找历史上所有最高和最低点,并用红色和蓝色点显示它们。
这些最高和最低点是根据深度值计算的。深度值可调,用户可以更改。
深度是什么意思?
当深度为10时,表示每个最高蜡烛必须在其周围的10支蜡烛之间最高,必须在前5个蜡烛与下一个5个蜡烛之间为最高蜡烛。
当深度为10时,表示每个最低蜡烛必须在其周围的10支蜡烛之间最低,必
FREE

Please check the " What's new " tab regularly for a complete and up-to-date list of all improvements + parameters. FREE indicator for my trading utility Take a Break . This indicator allows you to manage multiple other EAs with just one Take a Break EA instance. Simply specify the corresponding Chart Group in the indicator(s) and Take a Break EA settings and you are good to go.
Setup examples (Indicator + EA)
As a prerequisite, add the URL https://trading.custom-solutions.it to the list of al
FREE

The fact that round number levels have a significant influence on the market cannot be denied and should not be overlooked. These psychological levels are used by both retail Forex traders and major banks that deal in Forex. Very simple and effective indicator and most importantly free. ////////////////////////////////////////////////////////////////////////////////////////////////////////////////////////////////////////////////////////////// The program does not work in the strategy tester.
FREE
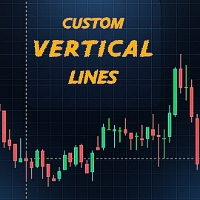
该指标会在您设定的时间自动绘制垂直线,并可选择性地在这些时刻的开盘价处添加水平线。它帮助交易者标记关键事件,例如市场开盘时间、策略时间或自定义的日内水平。 Features: 每天最多绘制 两条可自定义的垂直线 。 可选择从指定时间的开盘价绘制 水平线 。 完全可自定义 颜色、样式和线条宽度 。 轻量、快速,不会拖慢图表。 适用于任何 交易品种和周期 。 如果只需要 一条线 ,将第二个时间留空即可。 如果不想要任何线条,请将两个时间都留空。 How to Use: 将指标加载到任意图表。 在输入参数中设置所需时间(如 07:00, 14:30)。 调整线条的样式、颜色和宽度。 可选:选择哪个时间生成水平线。 如果需要更少甚至不需要线条,请留空输入。 该工具非常适合需要 清晰视觉标记 的交易者,用于标注交易时段、策略或日常操作。
FREE

About:
The Nadaraya-Watson Envelope is a sophisticated yet practical technical indicator that helps traders identify overbought and oversold conditions using advanced kernel regression methods. This is the MT5 only Version.
For MT4 Version go here: https://www.mql5.com/en/market/product/158640/
Key Features ATR-Based Bands: Three upper and three lower bands provide graduated overbought/oversold zones Logarithmic Scale Calculation Center Line - bullish (teal) or bearish (red)
What is the Nad
FREE

我们的 Basic Support and Resistance 指示器是提高技术分析所需的解决方案。该指标允许您在图表/ MT4版本
功能
斐波那契水平的集成: 可以选择显示斐波那契水平以及支持和阻力水平,我们的指标使您对市场行为和可能的逆转区域有更深入的了解。
性能优化: 只能在每个栏的打开时更新扩展线,我们的指标可确保最佳性能,而无需牺牲支持和阻力级别的准确性。
输入 主设置 Timeframe: 通过此输入,您可以选择在图表上显示较高时间范围的支撑线和阻力线。 Support/Resistance Strength [Number of Bars]: 使用此输入,您可以确定支撑和电阻的强度。数量越高,支持/阻力越强。 Price mode: 此参数允许您选择哪种价格将用于计算支持和电阻水平。它可以是收盘价,最高价格,最低价格等。取决于您的策略和偏好,您可以选择最适合您需求的价格。 显示设置 Display Fibonacci levels: 此参数确定是否将显示斐波那契水平以及图表上的支持和电阻级别。斐波那契水平是技术分析中使用的关键水平,并使用斐
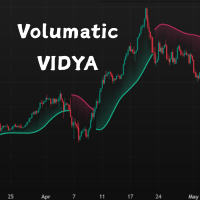
This is a custom VIDYA-based trend-following indicator for MetaTrader 5 (MT5), enhanced with ATR-band logic to adapt to market volatility. It provides dynamic trend zones and intelligent direction switching to support better trading decisions.
Unlike traditional moving averages, this indicator uses a momentum-adjusted VIDYA (Variable Index Dynamic Average) and combines it with ATR-based bands to detect trend shifts with greater precision. Features
Volatility-Adaptive Trend Logic – Uses ATR ban
FREE

FREE

Daily Support and Resistance Levels 是一款专业指标,基于经典枢轴点方法自动计算并显示日内交易关键价格水平。 主要功能: 自动计算枢轴点(PP) 三个阻力位(R1, R2, R3) 三个支撑位(S1, S2, S3) 显示前一天高点/低点 实时信息面板 市场趋势方向(多头/空头)提示 显示与最近价格水平的距离 完全自定义颜色与样式 每日自动更新 支持所有周期 计算方法:基于昨日最高价、最低价、收盘价的经典枢轴点算法。 交易用途: 支撑/阻力反弹交易 突破策略 区间震荡交易 市场方向判断 盈利目标设置 使用方法: 将指标加载到图表 自动生成水平线 价格 > PP = 多头倾向 价格 < PP = 空头倾向 S1-S3 = 支撑区域 R1-R3 = 阻力区域 自定义设置: 枢轴点/支撑/阻力颜色 线条宽度与样式 显示/隐藏价格标签 显示/隐藏信息面板 面板位置与字体大小 显示/隐藏前日高低点 优点: 专业界面 无重绘 资源占用低 支持所有经纪商 适合剥头皮与日内交易 免费用于展示我的MQL5能力 如果喜欢,请留下评价。
FREE
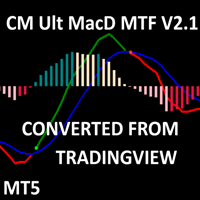
CM MACD Custom Indicator - Multiple Time Frame (V2.1) This advanced MT5 indicator, adapted from ChrisMoody’s TradingView script, delivers a powerful Multi-Timeframe MACD with customizable visuals and alerts. Plotting MACD lines, signal line, and a color-coded histogram, it highlights trend direction and momentum with distinct colors for growing/falling histograms above/below zero. Cross signals are marked with arrows, and users can enable alerts, email, or mobile notifications for buy/sell oppo
FREE

這是最終的RVI指標。 添加警報箭頭 他可以確定潛在的阻力水平 額外的2個過濾器,以提高讀數 另外平滑以顯示良好的效果 它被配置為從m1到m30的短時間範圍 也不會很糟糕 我建議使用此指示器和屏幕截圖macd中的其他過濾器 這是最終的RVI指標。 添加警報箭頭 他可以確定潛在的阻力水平 額外的2個過濾器,以提高讀數 另外平滑以顯示良好的效果 它被配置為從m1到m30的短時間範圍 也不會很糟糕 我建議使用此指示器和屏幕截圖macd中的其他過濾器 這是最終的RVI指標。 添加警報箭頭 他可以確定潛在的阻力水平 額外的2個過濾器,以提高讀數 另外平滑以顯示良好的效果 它被配置為從m1到m30的短時間範圍 也不會很糟糕 我建議使用此指示器和屏幕截圖macd中的其他過濾器
FREE

Linear Regression Channel (MTF) Indicator The Linear Regression Channel MTF is an advanced technical indicator that uses statistical analysis to plot a linear regression channel on the price chart, with the capability to display data from a different time frame (Multi Time Frame) for enhanced trend accuracy and analysis. Key Features of the Indicator: Main Line (Linear Regression Line):
Represents the overall price trend over the selected period, allowing traders to easily observe the general s
FREE

FREE

INFOPad是一个信息面板,用于在MetaTrader 5终端中创建所选货币对的信息。 该指标有5个功能: 显示所选符号的主要和主要信息:询问BID,点差,止损水平,掉期,刻度值,佣金价格; 显示SL目标和TP目标的未来目标(已建立的止损和获利点数,美元金额); 它显示了期间收到的利润:今天,周,月,年,所选货币的总利润; 它显示当前的未平仓头寸,其手数(交易量),头寸数量,头寸头寸的利润,美元,百分比; 显示有关未结交易的图表的其他信息。它显示了止损和获利水平以及这些止损水平的目标; 在符号上打开事务,关闭事务,修改事务时,将信息写入日志文件; 在开始交易,完成交易,修改交易时播放声音文件; 打开交易,关闭交易,修改交易时,向手机发送信息性消息(PUSH通知)。 INFOPAD for Metatrader 4 一键式交易面板: VirtualTradePad 亲爱的朋友和我们的顾问用户,在 评论 部分添加您的评分 。 我们的外汇软件的所有更新都是 免费的 ! 主要特征 货币对的名称,符号上存在未平仓头寸,其类型和手数。 English / Русский / 中国 /
FREE

1. Overview The Scalping PullBack Signal indicator is a powerful technical analysis tool designed to help traders identify scalping opportunities based on potential pullback and reversal signals. This tool is particularly useful on lower timeframes (below 15 minutes) but can also be applied on higher timeframes for longer-term trades. This indicator integrates several key analytical components, providing a comprehensive view of trends and potential entry/exit points, helping you make quick and e
FREE
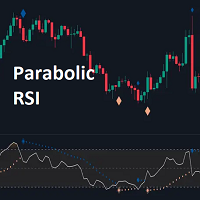
The Parabolic RSI indicator applies the Parabolic SAR directly to the Relative Strength Index (RSI) . This combination helps traders identify trend shifts and potential reversal points within the RSI framework. The indicator provides both regular and strong signals based on whether the Parabolic SAR crosses above or below key RSI thresholds.
KEY FEATURES
Parabolic SAR Applied to RSI – Tracks momentum shifts within the RSI indicator.
Dynamic SAR Dots – Plots SAR levels
** All Symbols x All Timeframes scan just by pressing scanner button ** ***Contact me to send you instruction and add you in "RSI scanner group" for sharing or seeing experiences with other users. Introduction RSI divergence is a main technique used to determine trend reversing when it’s time to sell or buy because prices are likely to drop or pick in the charts. The RSI Divergence indicator can help you locate the top and bottom of the market. This indicator finds Regular divergence for pullba

SummarySignalLine is an intelligent multi-indicator for MetaTrader 5 that combines signals from five classical technical indicators into a single smoothed signal line. The indicator visualizes overall market sentiment in a simple, intuitive format with color coding. Key Features Composite Analysis — combines MA, RSI, Bollinger Bands, Stochastic, and ATR Smoothed Signal — reduces market noise with configurable smoothing Visual Clarity — color gradient from green (bullish) to red (bearish)
FREE
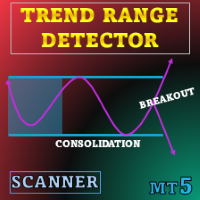
特别优惠 : ALL TOOLS ,每个仅 $35 ! 此工具在接下来的 3 天内免费 ,不要错过! 新工具 将以 $30 的价格出售 首周 或 前 3 次购买 ! Trading Tools Channel on MQL5 :加入我的 MQL5 频道,获取最新动态 Trend Range Detector 为偏好结构化、数据驱动的价格整理视图的用户而设计。它使用明确的波动率规则显示价格停顿及突破起点,避免主观解读图表。 MT4 版本请见: Trend Range Detector MT4 Scanner 更多产品: All P roducts 概述 Trend Range Detector Scanner 是一款技术指标,通过根据波动率和近期价格动作绘制箱体来标识价格压缩阶段。当收盘价保持在指定区间内时绘制箱体;一旦突破区间即更新。 结合波动区间与加权中心线,该指标减少噪音并勾勒相对稳定区域。适用于监测吸筹、派发、突破评估和均值回归。 同一框架适合区间交易、整理阶段分析以及观测常在趋势前出现的波动收缩。 工作原理 区间生成引擎 距离过滤 – 最近收

Schaff Trend Cycle (STC) "CON ALERTAS"
El Indicador Schaff Trend Cycle (STC) es una herramienta técnica utilizada en el trading e inversión para identificar tendencias y generar señales de compra o venta. ¿Qué es el Schaff Trend Cycle? El STC fue desarrollado por Doug Schaff para mejorar las medias móviles incorporando análisis de ciclos. Su objetivo es identificar tendencias y cambios de tendencia midiendo la fuerza y velocidad de los cambios de precio. Es un oscilador que mide la velocidad
FREE

Zenith Session Flux is a professional-grade technical indicator for MetaTrader 5 designed to identify and visualize institutional trading windows known as ICT Killzones. The indicator automates the process of time-alignment by synchronizing your broker's server time with New York local time, ensuring that session boxes and price pivots appear at the precise institutional moments regardless of your broker's timezone. Indicator Features: Automatic Timezone Sync: Automatically calculates the offset
FREE

Capital Vault System is a professional technical analysis suite for MetaTrader 5 engineered to identify market structure and adaptively filter market volatility. Unlike static indicators, this system integrates three mathematical models— Maximum Entropy Spectral Analysis (MESA) , Fractal Dimension , and Harmonic Geometry —to distinguish between directional trends and non-linear consolidation ranges. It includes an embedded Risk Management Dashboard designed to assist traders in real-time positio

Candle Time Countdown is a professional MT5 indicator developed to displays in real-time the countdown showing the remaining time until candle close across multiple timeframes simultaneously. The indicator features intelligent color-coded visual feedback where each timeframe's text dynamically changes to bright lime green for bullish candles and red for bearish candles, with each timeframe updating independently based on its own candle direction.
Key Features Multi-Timeframe Support: M1, M5, M1
FREE

If you love this indicator, please leave a positive rating and comment, it will be a source of motivation to help me create more products <3 How to use QQE? Determine trend when RSI MA above 50 indicate a bullish market, while RSI MA below 50 indicate a bearish market and can server as a trend filter. Identify short-term up/down momentum, when the RSI MA crosses up Smoothed signals bullish momentum, and when the RSI MA crosses down Smoothed signals bearish momentum. It is also possible to
FREE

Candle Close Timer Matrix – MT5 Candle Countdown Indicator Candle Close Timer Matrix is a lightweight and powerful MetaTrader 5 (MT5) candle countdown indicator that shows exactly how many minutes and seconds are left before the current candle closes on any symbol and any timeframe. Live Signals & Products Whether you are a scalper , intraday trader or swing trader , knowing the exact candle close time helps you: Time your entries on candle close Avoid impulsive mid-candle decisions Sync your tr
FREE

This tool was developed to help traders on candle by candle and replay training. In the indicator settings, the user can set the training start datetime. The indicator will autommatically hide all candles after this datetime. So the user can make studies before starting the training. Starting the training, the user can simulate your trades quickly and easily!
This is a product developed by Renato Fiche Junior and available to all MetaTrader 5 users!
Input Parameters
Training Start - training
FREE

I think you all know Donchian Channels. so I am not going to write about it.
With this indicator I tried to create Donchian Trend Ribbon by using Donchian Channels.
How it works ?
- it calculates main trend direction by using the length that is user-defined. so you can change it as you wish
- then it calculates trend direction for each 9 lower lengths. if you set the length = 20 then the lengths are 19, 18,...11
- and it checks if the trend directions that came from lower lengths is same
FREE

RoundNumbers indicator is a simple and powerful psychological price levels. Trader usually use these levels as a Support and Resistance (SnR). Indicator Input: Levels - Numbers of levels drawn on chart. Default 30 levels. BoxSize - Box size drawn on each levels, indicate buffers around levels. Default value 1pips (10point) above and below each levels. ZoneSize - Distance between each levels, default value 10pips (100point). Style & Colours - User inputs customization. For MT4 version, p
FREE

M & W Pattern Pro is an advanced scanner for M and W patters , it uses extra filters to ensure scanned patterns are profitable.
The indicator can be used with all symbols and time frames.
The indicator is a non repaint indicator with accurate statistics calculations.
To use , simply scan the most profitable pair using the statistics dashboard accuracy , then enter trades on signal arrow and exit at the TP and SL levels.
STATISTICS : Accuracy 1 : This is the percentage of the times price hits TP

AI Trend Targets – Precision Entries, Targets & Risk in One Overlay AI Trend Targets is a premium smart overlay that turns raw price action into clear, rule-based trade plans: entry, dynamic guard (SL) and three projected targets (TP1–TP3).
It is designed for XAUUSD, major FX pairs and index CFDs, and works on intraday as well as higher timeframes. What it does Behind the scenes, AI Trend Targets combines: A volatility-adaptive “AI Baseline” to define trend direction Context-aware rejection logi
FREE

趋势,趋势指标,动量,振荡器,直方图,趋势强度,市场流动,趋势确认,看涨,看跌,技术分析
Trend Flow Oscillator
Trend Flow Oscillator 是一款市场流动性与动量指标,旨在帮助交易者以清晰、简洁和直观的方式识别价格走势的强度和方向。
在 5 分钟图表(M5) 上效果尤为突出,因为流动变化更加频繁。
功能 识别买卖力量的变化与延续 显示价格动能的加速与减速 帮助确认顺势入场 以独立直方图形式显示市场流动 作为方向性动量振荡器使用 适合人群 主观交易者 剥头皮和日内交易者(尤其是 M5) 寻求流动确认而非自动信号的交易者 趋势与回调交易者 喜欢简洁、直观指标的用户 ️ 使用方法 建议在 M5 图表上使用 观察直方图: 蓝色柱(Flow Up)→ 买盘增强 红色柱(Flow Down)→ 卖盘增强 柱体越大,动能越强 用于: 确认趋势方向的入场 避免逆势交易 验证突破和趋势延续 可结合: 价格行为 支撑与阻力 市场结构 提示:不要单独使用。本指标用于确认,而非独立信号。
不具备的功能
FREE

The XR Gartley Pattern MT5 is an indicator which displays and alerts Gartley pattern detected on the candlestick chart. It also displays potential trade with calculated Take Profit and Stop Loss. After purchasing XR Gartley Pattern Indicator, you can immediately download this indicator from the MT4-MT5 Market and start using it because all features are set to default, is not necessary to change any parameter. In addition, we have created a private group for customers who have purchased one of
FREE

(谷歌翻译) 标准 Heikin Ashi 蜡烛图的开放值相当于 指数 总价 的移动平均线(EMA) , EMA 的 alpha 值是固定的 0.5(相当于 EMA 周期 3.0)。 在这个动态版本中,周期可以更改为您希望使用的任何值,这也允许您 近似多时间框架分析,或使用低值或高值作为一种追踪止损。 的穿越 Heikin Ashi 开盘价的实际 收盘价 也可以用作价格变化的信号 趋势方向。
此外,除了标准 EMA 之外,此版本还可以选择使用 几乎零滞后的 EMA 相反,它可以更快地检测趋势方向的变化,尤其是在使用较长时间的 平均。
将指标附加到图表时,您还可以选择自动将图表切换到 折线图模式 并可选择在 折线图 中隐藏真实的 收盘价 ,但是, 没有它,您将无法看到实际 收盘价 和实际价格之间的交叉信号 Heikin Ashi 开放价值观。 (谷歌翻譯) 標準 Heikin Ashi 蠟燭圖的開放值相當於 指數 總價 的移動平均線(EMA) , EMA 的 alpha 值是固定的 0.5(相當於 EMA 週期 3.0)。 在這個動態版本中,週期可以更改為您希望使用的任何值,這也允許您
FREE

Adaptive Moving Average (AMA) is a trend indicator using moving average and market noise filter. Indicator feature are blue and red points, showing the power of trend. Recommendations for trading: Auxiliary Indicator Detecting trend Detecting power of trend Detecting potential reversal points Main indicator Shows entry points for swing trading Serves as dynamic support and resistance Recommendations for use: Any instrument Any timeframe Input parameters: Period - AMA period Fast Period - fast MA
FREE

Global Trading Sessions is a technical indicator for MetaTrader 5 designed to identify and mark the opening times of the four major financial sessions: Tokyo, London, New York, and Sydney . The indicator addresses the common challenge of varying broker server times by utilizing a GMT-based calculation logic . By synchronizing with Global Mean Time (GMT), the indicator ensures that session boundaries are accurately placed regardless of the brokerage platform’s local time zone. This makes it an es
FREE

Gann Hilo — Precision and Clarity in Trend YouTube Channel: @BotPulseTrading
GannHilo is a technical indicator designed to identify precisely and visually trend changes in the market. Combining price structure with Gann theory, this system draws dynamic lines that act as smart guides of direction and support . Its minimalist design and optimized algorithm allow for a clean and effective reading, showing exactly when momentum shifts direction without noise or unnecessary delays. Ideal for both
FREE

GANN TRIANGLE PRO v4.0 - OPTIMIZATION ANALYSIS REPORT CURRENT VERSION ASSESSMENT (v3.8) Strengths Feature Evaluation Swing Point Detection Clear logic using Left/Right bars Fibonacci/Gann Ratios Properly applied 61.8%, 100%, 161.8% Dashboard Real-time updates with visual indicators Code Structure Clean, maintainable architecture Critical Limitations Issue Impact Win Rate Effect No Trend Filter Signals against major trend -20% to -30% Missing Volume Confirmation False breakouts not filt
FREE

该指标分析分形的价格结构并确定市场动态中可能的反转点。 分形可用作支撑位和阻力位
优点:
适用于所有仪器和时间序列, 不重绘其结果, 指示元素的可定制颜色, 与任何趋势策略完美搭配, 调整分形的强度。
MT4 版本指示器 -> 这里 / AW 分形 EA MT5 -> 这里
战略:
分形是蜡烛的组合,形成楔形的几何图形,中心有一个峰。也就是说,当平均价格处于峰值并且峰值之前的后续价格和前一个价格位于峰值蜡烛的下方或上方时。这些标记可以用作支撑位和阻力位。 AW 灵活分形是一种指标,它不是立即指示信号,而是由于分形的结构而有延迟。 要检测变量“分形每侧的蜡烛数”中的信号,您可以调整分形中心点每侧的柱数。 默认设置使用值“2” - 这意味着当相对于中心(上部)分形每侧都有 2 个较低的条时,将设置信号。其中,每侧最接近分形的一个将是中间的一个,下一个将是该组中最低的一个。当形态中的所有柱均闭合时,指标将绘制分形。 交易者可以调整分形的类型: 当使用“全分形”类型时,将会有更多信号,因为到达的信号的分形图不必是精确的。 当使用“强分形”类型时,接收到的信号会
FREE

基本主题构建器:简化您的图表自定义 通过 基本主题构建器 指标,彻底改变您的交易体验。这款多功能工具旨在简化您在MetaTrader 5 平台上自定义图表外观的过程。该指标提供了一个用户友好的面板,您可以轻松切换不同的主题和配色方案,提升交易环境的视觉吸引力和功能性。 Free MT4 version 基本主题构建器 指标是那些希望轻松个性化MetaTrader 5图表的交易者的终极工具。通过其简单的面板界面和各种主题预设,您可以迅速调整图表的外观,以匹配您的交易风格或心情。无论您偏爱经典外观还是现代美学,基本主题构建器提供了一系列选项,以增强您的视觉体验并提高专注度。立即优化您的交易设置,体验这款实用且易于使用的指标。
主要特点: 轻松管理主题: 使用便捷的面板界面,单击即可快速更改图表主题。 预定义预设: 从几种预配置的主题和配色方案中进行选择,包括经典、深色、浅色等,以适应您的交易偏好。 可自定义选项: 调整颜色和样式,按您的喜好定制图表外观。 用户友好界面: 享受简单直观的设计,无需复杂设置或配置。 提升交易专注度: 通过视觉吸引力强且无干扰的图表环境,改善您的交易体验。
FREE
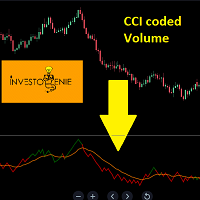
The Indicator is based on Commodity Channel Index (CCI) coded on Volume. The concept is to try and analyze the movement of Volume and Price in a certain direction
Concept:
If the Price of the indicator moves below the threshold price, it turns RED indicating the direction downwards is getting strong.
If the Price of the indicator moves above the threshold price, it turns GREEN indicating the direction upwards is getting strong.
The moving average acts as a great filter to decide entry/exit poi
FREE

RSI with moving average is great to see when the price is overbought and oversold instead of RSI only.
INPU T PARAME TERS : RSI:
Period - RSI period.
Price - RSI applied price.
Color scheme - RSI color scheme (4 available). MOVING AVERAGE:
Period - MA period.
Type - MA type.
Apply - MA applica tion.
Shift - MA shif t (correc tion). PRICE LINE:
Show - specify if line with price, only line or nothing.
Style - line style. OTHER:
Overbought level - specify the level .
Overbought descriptio
FREE
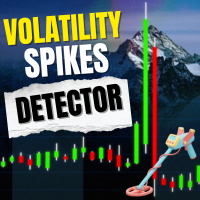
Volatility Monitor – 实时波动检测指标 概述 Volatility Monitor 是一款轻量级且专业的 MT5 指标,用于跟踪突发价格波动并实时提醒交易者。无论您交易外汇、黄金、日元货币对还是加密货币,该工具都能通过 ATR 自动检测或手动点数阈值提供清晰的市场波动信号。 它会在图表上直接标记蜡烛,并发送渐进式提醒,帮助交易者快速应对行情波动、新闻事件和突破行情。 主要功能 实时波动检测 – 即时识别市场波动。 灵活的检测模式 – ATR 自动模式或手动点数模式。 渐进式提醒 – 声音提示 (1–3 次),弹窗通知和推送提醒。 智能蜡烛标记 – 彩色圆点 (黄色/橙色/红色) 标示不同波动强度。 自动适配颜色 – 自动识别深色或浅色图表背景。 内置仪表盘 – 显示实时蜡烛范围、ATR 值、波动百分比及历史峰值。 通用支持 – 兼容外汇、黄金、日元货币对和加密货币。 输入与设置 检测模式: ATR 自动或手动点数。 历史回溯: 自定义分析蜡烛数量。 标记设置: 启用/禁用标记,选择大小和颜色模式。 提醒: 启用声音、弹窗、推送提醒。 仪表盘: 可调整位置,实时显示波
FREE
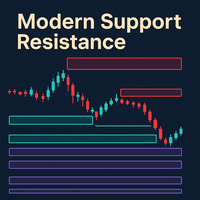
Dynamic S/R indicator that creates zones from fast/slow fractals, merges them if they overlap, classifies them (Possible, Untested, Verified, Turncoat, Weak), highlights the one closest to current price, and sends alerts when price enters the area. It supports testing mode, visual themes, zone extension/merge, global variables for EA integration, optional display of broken zones, and an adaptive ATR-based fuzz filter (with automatic fallback).
My indicators for free. I only ask that leave your
FREE

朋友们好,这是MT5终端的更新版本。 这是我在第一个指标基础上开发的新产品,是为黄金优化的精简版本,没有多余的设置。 该指标支持发送通知。 使用建议: 交易品种 - XAUUSD (主要品种,已为其优化) 交易品种 - XAUEUR (次要品种,未为其优化,但结果令我满意) 图表周期 - H4。 将指标加载到图表上即可,无需任何操作。 买入信号 - 蓝色箭头。 卖出信号 - 红色箭头。 可作为寻找入场点的主要来源。 止损: 黄色点 - 建议遵循它们。 使用场景: 预测下一根K线的方向和收盘价。因此,当收到信号时,平仓时间应以您收到信号的那根K线的收盘为准。 止盈: 止盈是酌情设置的,但总比没有好。如果您不知道在哪里设置止盈或平仓,请参考最后一根已收盘K线的最高/最低点。 简洁明了,没有多余的东西。 可用指标设置: SL - 基于ATR指标的建议止损,我推荐参考它,因为它表现良好。 TP - 基于ATR指标的建议止盈。 TextFontSize - 图表上显示文本的字体大小。 Font_style - 图表上显示文本的字体样式。 btext

XAUUSD Heat Map Scalping Indicator Perfect for 1M, 3M, 5M, 15M Scalping on Gold (XAUUSD) Take your scalping to the next level with this exclusive Heat Map indicator , designed and optimized specifically for XAUUSD . This tool is a powerful visual assistant that helps you instantly identify market strength, pressure zones, and potential entry points in real time. Key Features: Optimized for Fast Scalping : Works best on 1-minute, 3-minute, 5-minute, and 15-minute timeframes Specializ
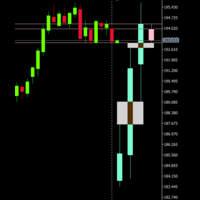
If you like this product, please give it a 5 star rating as a token of appreciation. This indicator projects Higher-Timeframe (HTF) candles onto the current chart and optionally shows their OHLC lines and Fair Value Gaps (FVGs) using ICT 3-candle logic.
Projects multiple higher timeframe candles.
Accurately preserves HTF OHLC on any lower timeframe.
Allows spacing adjustment between projected candles.
Optionally displays OHLC horizontal reference lines.
Automatically detects and draws HTF Fair
FREE

【ZhiBiDW Trend】是一款简单、直观、有效的趋势和震荡的指标。它适合用在15分钟以上并且4小时以下的图表周期,适合所有市场品种。 Buy signal:出现蓝色向上箭头;箭头出现后会附带止损和止盈的预设价格。 Sell signal:出现红色向下箭头;箭头出现后会附带止损和止盈的预设价格。 参数设置说明: 【Send_Alert】:这是警报开关,设置成true,如果出现箭头就会自动警报提示;设置成false,则不会警报提示。 【Send_Email】:这是发送邮件的开关,设置成true,如果出现箭头就会发送邮件到你在MT4设置好的邮箱里面;设置成false,则不会发邮件。 【Send_Notification】:这是发送即时消息的开关,设置成true,如果出现箭头就会发送消息到你的移动设备;设置成false,则不会发消息。 更多好用的指标网址: https://www.mql5.com/en/users/zhengqiuyang/seller
FREE
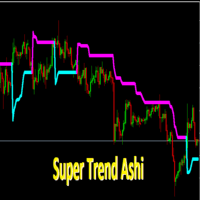
SuperTrendAshi Description SuperTrendAshi is an advanced and optimized version of the SuperTrend indicator that incorporates Heikin Ashi calculation to provide smoother and more reliable signals. This unique combination results in an indicator that reduces false signals and identifies trends with greater precision. Key Features Combines the strength of SuperTrend with Heikin Ashi smoothing More stable signals with less noise Intuitive color system (Aqua for uptrend, Magenta for downtrend) Custo
FREE

Finally a Metatrader version of the very popular (and expensive) Market Cipher B indicator, or the Vumanchu Cipher B + Divergences very popular on Tradingview platform.
This tool is very heavy on calculations, total are 31 plots using 97 buffers from several indicators. On my mid end computer, timeframes below M15 start getting a bit laggy, so it would require a powerful computer to run it properly at very low timeframes. It's still usable here, but somewhat sluggish response in Metatrader (lik
FREE
MetaTrader市场是一个简单方便的网站,在这里开发者可以出售自己的交易应用程序。
我们将帮助您发布您的产品,并向您解释如何为市场准备您的产品描述。市场上所有的应用程序都是加密保护并且只能在买家的电脑上运行。非法拷贝是不可能的。
您错过了交易机会:
- 免费交易应用程序
- 8,000+信号可供复制
- 探索金融市场的经济新闻
注册
登录