Conheça o Mercado MQL5 no YouTube, assista aos vídeos tutoriais
Como comprar um robô de negociação ou indicador?
Execute seu EA na
hospedagem virtual
hospedagem virtual
Teste indicadores/robôs de negociação antes de comprá-los
Quer ganhar dinheiro no Mercado?
Como apresentar um produto para o consumidor final?
Indicadores Técnicos para MetaTrader 5 - 17

Receba alertas quando uma tendência está surgindo. Este indicador sinaliza quando o preço faz um grande movimento na direção da tendência dominante. Esses sinais podem servir como pontos de entrada, ou pontos para adicionar a uma posição existente em uma tendência.
Nota: a tendência a seguir tem uma baixa taxa de vitória (menos de 50%), mas o retorno da negociação vencedora média é normalmente de 3 a 5 vezes maior do que a negociação perdedora média.
Configuração Simples Arraste e solte em q
FREE

Easily get all relevant economic events of the current day right into your chart, as markers. Filter what kind of markers do you want: by country (selected individually) and by Importance (High relevance, Medium, Low or any combination of these). Configure the visual cues to your liking. If there is more than one event set to the very same time, their Names will be stacked and you will see the messages merged with the plus (+) sign on the marker. Obviously that long or too much events on the sam
FREE

If you love this indicator, please leave a positive rating and comment, it will be a source of motivation to help me create more products <3 How to use QQE? Determine trend when RSI MA above 50 indicate a bullish market, while RSI MA below 50 indicate a bearish market and can server as a trend filter. Identify short-term up/down momentum, when the RSI MA crosses up Smoothed signals bullish momentum, and when the RSI MA crosses down Smoothed signals bearish momentum. It is also possible to
FREE
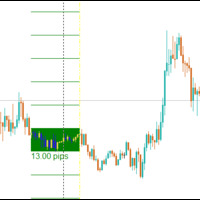
The Central Bank Dealers Range (CBDR) is a key ICT concept, used to project potential highs and lows for the day based on market conditions during a specific time window. The CBDR is utilized to forecast price movements in both bullish and bearish market conditions. By identifying this range, traders can better anticipate the price levels that may form as the day progresses.
CBDR and Standard Deviation A key feature of the CBDR is its application of standard deviation , a statistical measure u
FREE

This indicator was created based on posts from forex factory thread titled There is no Magic Moving Average - You need only one - by @andose2 a.k.a Andrei Florin. If you want to know about how to use this trading strategy please go and read https://www.forexfactory.com/thread/691864-there-is-no-magic-moving-average-you.
Note: Below are extracts some of the posts .
Estabilish a trend, based on Market Cycles, then go only long in the Markup Phase and only short in the Decline phase , st
FREE
The Smart FVG Statistics Indicator is a powerful MetaTrader 5 tool designed to automatically identify, track, and analyze Fair Value Gaps (FVGs) on your charts. Love it? Hate it? Let me know in a review! Feature requests and ideas for new tools are highly appreciated. :)
Try "The AUDCAD Trader":
https://www.mql5.com/en/market/product/151841
Key Features Advanced Fair Value Gap Detection Automatic Identification : Automatically scans for both bullish and bearish FVGs across specified histo
FREE

Este indicador desenha uma linha na máxima e mínima de um número X de dias. É possível ter um alerta (no software e app) para quando o preço romper a máxima ou mínima do dia atual. Configurações: Days - dias passados para calcular (1 = somente dia atual)
Alert when reach levels - ativa o alerta para níveis específicos ou ambos.
Push notification - habilita os alertas para o aplicativo móvel do MT5.
Aparência
High - cor do nível superior.
Low - cor do nível inferior.
Size actual day - espessura
FREE
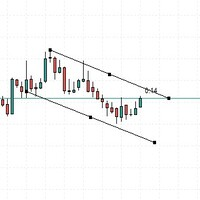
Esse indicador serve para dar alertas sonoros quando o preço passa pela linha ou retangulo colocados manualmente. Uma ferramenta muit util, que permite nao ficar muito tempo vendo os graficos no computador.
Note que o alerta emitido sempre vai ser refente ao candle atual, voce pode usar multiplas linhas no grafico passado para analisar.
Esse indicador sempre vai receber melhores atualizações.
FREE

Volume Gives Depth To Price Action! Volume Critical can accurately locate the cheapest areas to place trades. Enter reversals as early as possible to get the best Risk Reward setups!
Features Aggressive algorithm that anticipates reversals Volume Classifications Gray Histograms - Normal Volume, average market activity Orange Histogram - Trending Volume, increased market activity Pink Histograms - Overbought Volume, we can wait for further confirmation to sell Blue Histograms - Oversold Conditio

Tendência do ouro - este é um bom indicador técnico de acções. O algoritmo do indicador analisa o movimento do preço de um ativo e reflecte a volatilidade e as potenciais zonas de entrada.
Os melhores sinais do indicador:
- Para VENDER = histograma vermelho + ponteiro SHORT vermelho + seta de sinal amarelo na mesma direção + seta vermelha de direção da tendência . - Para COMPRAR = histograma azul + ponteiro LONGO azul + seta de sinal aqua na mesma direção + seta azul de direção da tendência

Adaptive Moving Average (AMA) is a trend indicator using moving average and market noise filter. Indicator feature are blue and red points, showing the power of trend. Recommendations for trading: Auxiliary Indicator Detecting trend Detecting power of trend Detecting potential reversal points Main indicator Shows entry points for swing trading Serves as dynamic support and resistance Recommendations for use: Any instrument Any timeframe Input parameters: Period - AMA period Fast Period - fast MA
FREE
super trend version is to help you to have real time view of market move it will help you to get a live view of current market buy signal line and arrow to help you understand batter the direction sell signal line and arrow to help you understand batter the direction trade what you see not what you think this is an simple and best trading tool for our traders of any market crypto gold
FREE

1. Introduction Smart Volume S/R Pro is a powerful technical analysis tool designed for the MetaTrader 5 platform. Unlike traditional Support & Resistance (S/R) indicators that rely on price peaks and troughs, this indicator automatically identifies critical S/R zones based on a core factor: Trading Volume . Core Principle: Price levels that witnessed exceptionally high trading volume in the past will often become significant psychological zones, where the price is likely to react strongly (eith
FREE
Trend Catalyst Pro Indicador Profissional Multi-Tendência com Confirmação 7 vezes, Alertas Inteligentes, Visão Geral de Notícias e Painel Integrado para MetaTrader 5. O Trend Catalyst Pro combina os sinais de sete indicadores de mercado comprovados em uma única pontuação clara. Em vez de analisar cada indicador individualmente, você obtém um resultado visível na vela do gráfico: Setas e texto como "6/7 LONG" ou "7/7 SHORT" Velas codificadas por cores com base na força do sinal Um painel mostran
FREE
Timeframe Simulator Indicator This indicator redraws candlestick structures from a higher timeframe onto your current chart. It helps visualize higher-period price action without switching timeframes, making it easier to analyze trends and key levels while trading on lower timeframes. Main features: Customizable Candles – Adjust the appearance of higher timeframe candles (bull/bear colors, wick style, gaps, and history length). Higher Timeframe Lines – Optionally display dynamic high, low,
FREE

Este indicador colocar Fibonacci nas pernas do indicador zigzag
Parâmetros:
ZigZag Show Depth Deviation Backstep Fibonacci Show Invertido (trabalhar com o fibonacci invertido) niveis (separe as porcentagens com ",") cor estilo largura da linha usar raio o parâmetro níveis (levels) pode ser modificador com qualquer valor de porcentagem, e os valores podem ser separados por virgula Se você se interessar por esse indicador deixe um comentário para eu continuar melhorando ele
FREE
VWAP (Volume Weighted Average Price) indicator with ±1σ and ±2σ bands calculated from real traded volume. The start and end times of the session are fully configurable, as well as the standard deviation levels and the number of bands displayed. It shows the day’s volume-weighted average price and helps traders identify value areas, price extremes, and intraday trading opportunities with precision.
FREE

RSI com média móvel é ótima para ver quando o preço está sobrecomprado ou sobrevendido em vez de apenas o RSI. PARÂME TROS DE EN TRADA : RSI:
Period - período do RSI.
Price - aplicação do preço do RSI.
Color scheme - esquema de cores do RSI (4 disponíveis). MOVING AVERAGE:
Period - período da média.
Type - tipo da média .
Apply - aplicação da média .
Shift - correção horizon tal da . PRICE LINE:
Show - de termina se será linha com preço, somen te linha ou nada.
Style - es tilo d
FREE

[ZhiBiDW Trend] é um indicador simples, intuitivo e eficaz de tendências e choques. É adequado para períodos de gráfico de mais de 15 minutos e menos de 4 horas, adequado para todas as variedades do mercado.
Sinal de compra: aparece uma seta azul para cima, a seta aparecerá com um preço predefinido para Stop Loss e Take Profit.
Sell signal: Uma seta vermelha para baixo aparece, a seta aparecerá com um preço pré-definido para Stop Loss e Take Profit.
Descrição da configuração de parâmetros:
[
FREE

Stochastic RSI makes a stochastic calculation on the RSI indicator. The Relative Strength Index (RSI) is a well known momentum oscillator that measures the speed and change of price movements, developed by J. Welles Wilder.
Features Find overbought and oversold situations. Sound alert when overbought/oversold level is reached. Get email and/or push notification alerts when a signal is detected. The indicator is non-repainting. Returns buffer values for %K and %D to be used as part of an EA. (se
FREE
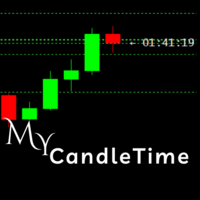
My CandleTime
This indicator displays the remaining time until the current candle closes directly on the chart.
It is designed to help traders keep track of candle formation without constantly checking the platform’s status bar. Main Features Shows countdown timer for the active candle. Works on any symbol and timeframe. Lightweight, does not overload the terminal. Adjustable font size and name. How to Use
Simply attach the indicator to a chart.
You can customize font size, color, and font to
FREE
The Moving Average Ribbon is a technical indicator that overlays a series of moving averages (MAs) on a price chart to visualize trend direction, strength, and potential reversals or reentries. It supports both Exponential Moving Averages (EMA) and Simple Moving Averages (SMA), configurable via user input.
Key Features:
Ribbon Composition: Displays 18 moving averages with periods ranging from 5 to 90 in increments of 5 (e.g., MA5, MA10, ..., MA90), plus an internal MA100 for reference. The MA5
FREE

Norion Candle Range Levels é um indicador profissional desenvolvido para destacar a máxima e a mínima de um intervalo de candles definido pelo usuário. Ao selecionar a quantidade de candles desejada, o indicador calcula automaticamente o maior topo e o menor fundo desse período, exibindo no gráfico uma referência clara da estrutura recente do mercado, zonas de consolidação e possíveis áreas de rompimento. Essa ferramenta é especialmente útil para traders que utilizam estratégias baseadas em pric
FREE

Contador de Candle para MetaTrader 5 O indicador Candle Number exibe uma numeração sobre cada vela do gráfico, iniciando a partir da vela mais recente. Essa funcionalidade auxilia na contagem visual das velas, podendo ser útil em estratégias baseadas em tempo, estrutura ou identificação de padrões.
Funcionalidades: Numera cada vela a partir da vela atual Permite personalização de cor, direção do texto (horizontal ou vertical) e deslocamento da posição Opção de exibir apenas um número limitado
FREE
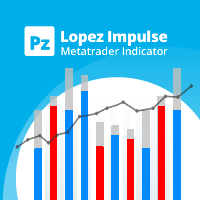
Este indicador avalia a volatilidade e a direcionalidade dos preços simultaneamente, que encontra os seguintes eventos. [ Guia de instalação | Guia de atualização | Solução de problemas | FAQ | Todos os produtos ] Movimentos de preços decisivos e repentinos Grandes martelos / padrões de estrelas cadentes Fortes crises apoiadas pela maioria dos participantes do mercado Situações de mercado indecisas, mas voláteis É um indicador extremamente fácil de usar ... O histograma azul representa o impuls
FREE

Saudações, amigos, esta é a versão atualizada para o terminal MT5. Este é o meu novo produto baseado no meu primeiro indicador, uma versão aprimorada sem configurações desnecessárias, otimizada para o Ouro. O indicador suporta o envio de notificações. Recomendações de uso: Instrumento - XAUUSD (principal, otimizado para ele) Instrumento - XAUEUR (secundário, não foi otimizado para ele, mas gosto dos resultados) Timeframe - H4. Instale o indicador no gráfico e esqueça-o, não mexa. Sinal de

Este indicador é uma versão demo do My candle completo que pode ser baixado aqui: Candle Patterns Creator
com a versão completa você pode criar suas próprias regras de candle além de pode modificar um padrão de candle tradicional para ficar mais assertivo de acordo com sua estratégia
No indicador tem varias regras de candles de exemplo, mas aqui vou demostrar apenas algumas:
Pattern Rule Candle Green C > O Candle Red C < O Doji C = O Hammer (C > O and (C-O) *2 < O-L and (C-O) *0.5 > H-C) or (
FREE
FXClock – Professional Clock Indicator for Traders Important Reminder:
If you find this tool helpful, please support the work by leaving a comment or rating.
Your feedback motivates further development!
The FXClock indicator is a practical and simple tool that displays time directly on your trading platform, allowing you to track multiple key pieces of information at the same time. It is specially designed to help traders synchronize their trading with market hours and global sessions. Key F
FREE

Paranormal Insightment Use with : Ritz MA Ribbon Dynamics (check on my product) Ritz Paranormal Insightment is a precision-engineered analytical indicator that blends momentum intelligence and trend confirmation into a single visual system.
It merges the DeMarker oscillator with a dynamic Moving Average filter , detecting price exhaustion and directional shifts with remarkable clarity. The indicator translates subtle market imbalances into actionable visual and auditory signals, helping trad
FREE

Structure Blocks: a structured way to analyze market structure
This indicator is for you if you are a price action or smart money concept trader. It identifies market trends' ultimate highs and lows and intermediaries' swing lows and highs. It adjusts based on candles' body where most of the volume is, disregarding wicks. Need help or have questions? I am Lio , don't hesitate to reach out! I am always available to respond, help, and improve. How it works:
Each block consists of a move with
FREE

Potencie suas capacidades de detecção de tendências com o Consecutive Candle Indicator MT5, uma ferramenta dinâmica projetada para identificar sequências de velas altistas ou baixistas, oferecendo alertas oportunos para confirmações de tendência e possíveis reversões nos mercados de forex, ações, criptomoedas e commodities. Aclamado em comunidades de trading como Forex Factory e Reddit’s r/Forex, além de elogiado em discussões no Investopedia e TradingView por sua capacidade de simplificar a aná
FREE
Weis Waves é um indicador técnico desenvolvido por David Weis, inspirado nos princípios de Richard Wyckoff.
Diferente do volume tradicional, que é exibido barra a barra, o Weis Waves acumula o volume em “ondas” de alta ou de baixa, reiniciando a contagem sempre que ocorre uma mudança na direção do preço. Esse método permite que o trader visualize de forma clara a força real do movimento do mercado, já que cada onda reflete a intensidade do volume que sustenta a sequência de candles. Principai
FREE

Meta Cipher A: Indicador de Sobreposição de Precisão para Ação do Preço Meta Cipher A traz o popular conceito do Market Cipher A para o MetaTrader 5 como um indicador de sobreposição de alta precisão. Projetado para exibir sinais preventivos diretamente no gráfico de preços, ele combina uma faixa de 8 EMAs , análise WaveTrend e oito tipos distintos de sinais para ajudar você a identificar entradas, saídas e zonas de alto risco antes que elas se formem completamente. Embora o Meta Cipher A seja p

Overlay indicator on chart between 2 pairs
The Timeframe Overlay indicator displays the price action of timeframes on a single chart, allowing you to quickly assess different timeframes from a single chart. The advantage is to observe and follow the correlations of price movements in real time to help you find potential trades at a glance.
---- Symbol 1 ----
Symbol = EURUSD
Correlation Inverse = false
Display = true
Ratio
FREE

Overview: The US Dollar Index (DXY) is a key financial indicator that measures the strength of the US Dollar against a basket of six major world currencies. This index is crucial for traders and investors as it provides a comprehensive view of the overall market sentiment towards the US Dollar and its relative performance. All Products | Contact Composition: The DXY's composition is as follows: Euro (EUR): 57.6% Japanese Yen (JPY): 13.6% British Pound (GBP): 11.9% Canadian Dollar (CAD): 9.1%
FREE

The indicator draws supply and demand zones. The zone timeframe can be set independently of the chart timeframe. For instance, it is possible to set M5 zones on an H4 chart. The importance of zones can be adjusted using the zone strength parameter. Demand zones are displayed if at least one candle in the range of the zone is entirely above the zone. Similarly, supply zones are displayed if at least one candle within the zone is entirely below the zone.

# Indicador Daily High - Danilo Monteiro - MT5
## Descrição O Daily High/Low Labels é um indicador personalizado para MetaTrader 5 que exibe automaticamente as máximas e mínimas diárias no gráfico, facilitando a identificação rápida dos níveis importantes de preço. O indicador marca os preços com etiquetas e linhas horizontais, permitindo uma visualização clara dos níveis críticos do dia atual e anterior.
## Principais Características
### 1. Marcação Automática - Exibe automaticamente as máxi
FREE
Overview
Supply & Demand (MTF) v1.00 is a MetaTrader 5 indicator that automatically identifies and draws key supply and demand zones from up to three timeframes on your current chart. Supply zones mark areas where selling pressure was strong; demand zones mark areas where buying pressure was strong. Features Multi-timeframe detection
Scan the current chart plus two higher timeframes for zones. Candle-strength filter
Require a configurable number of strong candles to confirm each zone. Adjust
FREE
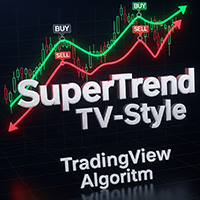
SuperTrend TV-Style replicates the classic SuperTrend indicator from TradingView, now available for MetaTrader. It uses ATR-based volatility to detect trend direction and plot dynamic buy/sell zones on the chart. Green line: uptrend Red line: downtrend Arrows: buy/sell signals at trend shifts Customizable source price (HL2, HLC3, etc.) and ATR method Simple, fast, and familiar - ideal for traders switching from TradingView or looking for a clean trend-following tool.
FREE

Advanced Market Analysis Tool : Dive into market depth with the MT5 Volume Profile Indicator. Seamless MT5 Integration : Perfectly compatible with the MT5 platform. Enhances Pro Thunder v9 : Integrates smoothly with Pro Thunder v9 for deeper market insights. Detailed Volume Analysis : Explore market dynamics through in-depth volume data. ️ Simple Installation : Easy-to-follow setup steps for quick integration with MT5. Efficient Single Chart Application : Best used on a single c
FREE

Please check the " What's new " tab regularly for a complete and up-to-date list of all improvements + parameters. FREE indicator for my trading utility Take a Break . This indicator allows you to manage multiple other EAs with just one Take a Break EA instance. Simply specify the corresponding Chart Group in the indicator(s) and Take a Break EA settings and you are good to go.
Setup examples (Indicator + EA)
As a prerequisite, add the URL https://trading.custom-solutions.it to the list of al
FREE
The AX Forex Indicator MT5 is a sophisticated trading tool designed to provide traders with a comprehensive analysis of multiple currency pairs. This powerful indicator simplifies the complex nature of the forex market, making it accessible for both novice and experienced traders. AX Forex Indicator uses advanced algorithms to detect trends, patterns and is an essential tool for traders aiming to enhance their forex trading performance. With its robust features, ease of use, and reliabl
Hi Traders, The Volume Spike Alert Indicator is a lightweight, non-lagging tool designed to help traders identify unusual volume activity in real time . This indicator calculates the average tick volume over a user-defined number of previous bars and compares it with the current candle’s volume . When the current volume exceeds the average by a specified percentage, the indicator triggers alerts, allowing traders to quickly spot potential breakouts, institutional activity, or strong market inter
FREE

SAR Colored Indicator with Alarm – Enhance Your Trading Strategy Are you tired of constantly monitoring charts for trend reversals? Introducing the SAR Colored Indicator with Alarm – a powerful, user-friendly tool designed to transform the classic Parabolic SAR (Stop and Reverse) into a dynamic, visually intuitive, and alert-driven system. Perfect for traders of all levels, this indicator is now available in the MQL Market and ready to elevate your trading experience. What is the SAR Colored I
FREE

No Wick Candles is a powerful price action indicator that identifies candles with no upper or lower wick (also known as Marubozu candles ) and automatically draws horizontal compensation lines from their open price with a "Compensation" label . These wickless candles represent strong momentum and are often used by professional traders as key support/resistance zones . The indicator helps you visualize potential reversal or continuation zones instantly. Key Features Detects Bullish (no lower wick
FREE

Hunt markets with Hunttern ZigZag . Easy to use with one parameter
You can use it for the following: -Classic patterns -Heads and shoulders -Harmonic patterns -Elliott Wave -Support and resistance -Supply and Demand
Single parameter: -Period (1-120)
Features: -Candle time -Single parameter -Light mode template
This is version 1 of Hunttern ZigZag. We are very happy to receive feedback from you.
FREE
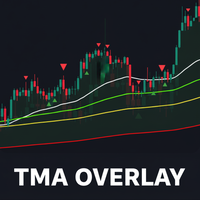
TMA Overlay Indicator for MT5 - User Guide 1. Introduction TMA Overlay is a versatile technical analysis indicator for the MetaTrader 5 platform. The indicator's goal is to provide traders with a comprehensive overview of the trend, potential entry signals, and key trading sessions, all integrated into a single chart. This is not a trading system, but a comprehensive analysis tool designed to help you make more informed decisions. 2. Core Indicator Components The indicator consists of multiple c
FREE

Product Name: HTF Candle Insight (EurUsd) - See the Big Picture Description: IMPORTANT: This version works EXCLUSIVELY on the EURUSD symbol. (It supports all broker prefixes/suffixes, e.g., pro.EURUSD, EURUSD.m, but will NOT work on Gold, Bitcoin, or other pairs). Experience the full power of "HTF Candle Insight" completely on EURUSD! Stop switching tabs constantly! This indicator allows you to visualize Higher Timeframe price action directly on your current trading chart. Whether you are a Sca
FREE

Automatic Fibonacci Retracement Line Indicator. This indicator takes the current trend and if possible draws Fibonacci retracement lines from the swing until the current price. The Fibonacci levels used are: 0%, 23.6%, 38.2%, 50%, 61.8%, 76.4%, 100%. This indicator works for all charts over all timeframes. The Fibonacci levels are also recorded in buffers for use by other trading bots. Any comments, concerns or additional feature requirements are welcome and will be addressed promptly.
FREE
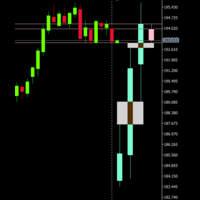
If you like this product, please give it a 5 star rating as a token of appreciation. This indicator projects Higher-Timeframe (HTF) candles onto the current chart and optionally shows their OHLC lines and Fair Value Gaps (FVGs) using ICT 3-candle logic.
Projects multiple higher timeframe candles.
Accurately preserves HTF OHLC on any lower timeframe.
Allows spacing adjustment between projected candles.
Optionally displays OHLC horizontal reference lines.
Automatically detects and draws HTF Fair
FREE

Smart Super Trend Indicator (Free) Turn volatility into opportunity — Catch trends early and trade smarter The Supertrend Indicator is one of the most trusted tools in technical analysis, designed to help traders quickly identify the prevailing market trend and spot potential entry and exit points with precision. Built on price action and volatility, this trend-following indicator adapts dynamically to market conditions, making it a powerful companion for both beginners and experienced traders.
FREE

RSI ABCD Pattern Finder: Estratégia Técnica 1. Como o Indicador Funciona Combina o RSI clássico com detecção automática de padrões harmônicos ABCD . Componentes Principais RSI Padrão (período ajustável) Marcações de Topos e Fundos (setas) Padrões ABCD (linhas verdes/vermelhas) Filtros de Overbought (70) e Oversold (30) 2. Configuração no MT5 period = 14 ; // Período do RSI size = 4 ; // Tamanho máximo do padrão OverBought = 70 ; // Nível de sobrecompra OverSold = 30 ; // Nível de sobrevenda Filt
FREE

O Setup Tabajara foi criado por , trader brasileiro conhecido como "O OGRO de Wall Street" .
A ideia deste setup é indicar ao trader a tendência atual dos preços e o tipo de operação deve-se buscar no gráfico.
Ele faz isto através da relação de posicionamento do fechamento dos candles e o sentido da média aritmética de 20 períodos pintando os candles de 4 possíveis cores:
Verde -> Preço subindo em Tendência de alta (Buscar pontos de entrada de COMPRA)
Preto -> Preço c
FREE
Se negocias nos mercados financeiros, certamente sabes o quão importante é o spread — esta diferença entre o preço de compra (ask) e o de venda (bid) pode afetar seriamente o teu lucro. Spread Size é um indicador simples, mas muito útil, que exibe o spread atual diretamente no gráfico. Já não precisas de monitorizar os dados manualmente — tudo está bem diante dos teus olhos! Para que serve?
O spread não é apenas um número. É o teu dinheiro real. Um spread baixo significa que a entrada e a sa
FREE

KT Candlestick Patterns identifica e marca em tempo real os 24 padrões de velas japonesas mais confiáveis. Desde o século XVIII, os traders japoneses utilizam esses padrões para prever a direção do preço. É verdade que nem todos os padrões de velas são igualmente confiáveis. No entanto, quando combinados com técnicas como Suporte e Resistência, oferecem uma leitura precisa da situação atual do mercado.
Este indicador inclui muitos dos padrões discutidos no livro de Steve Nison - "Japanese Cand
Special offer : ALL TOOLS , just $35 each! New tools will be $30 for the first week or the first 3 purchases ! Trading Tools Channel on MQL5 : Join my MQL5 channel to update the latest news from me O indicador Liquidity Pools é uma ferramenta avançada que identifica e marca zonas potenciais de liquidez no gráfico ao analisar áreas altas e baixas com frequentes toques de pavio, juntamente com o número de revisitações e o volume negociado em cada zona. Esta ferramenta oferece aos tra

Fibo Trend Smart MAXIMUS Ritz Fibo Trend Smart MAXIMUS 1 is an advanced trading indicator that integrates various technical analysis tools into one comprehensive display. This indicator is designed to help traders identify trading opportunities with high accuracy, utilizing a combination of Fibonacci, ZigZag, and price action confirmation. Key Features Smart Fibonacci Retracement 11 Customizable Fibonacci Levels (0%, 23.6%, 38.2%, 50%, 61.8%, 100%, 123.6%, 138.2%, 150%, 161.8%, 200%) Different
FREE
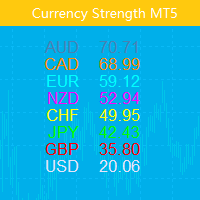
Este indicador mostra a força relativa de 8 moedas principais: USD, EUR, GBP, AUD, NZD, CAD, CHF e JPY. O valor da força é normalizado no intervalo 0-100: Um valor superior a 60 significa forte. Uma leitura abaixo de 40 indica fraqueza.
Ingressos Only Show Current Pair - se verdadeiro, apenas o par de gráficos atual será exibido; caso contrário, todas as 8 curvas serão exibidas. Bars To Show – Número de barras para exibir a curva de força. Ma Periods To Smooth Curves : perí

Sessions are very important in trading and often good area where to look for setup. In SMC, ICT we will look for Asian session to serve as liquidity
This indicator displays: High & Low of the Asia session Midnight New York time opening line
Congifuration Line Style, color Label position, size, color Start of the level (Start of the day, Start of the session, Highest or Lowest point in the session)
Any questions or comments, send me a direct message here https://www.mql5.com/en/users/mvonline
FREE

Big Figure Levels – Key Psychological Price Zones for MT5 Big Figure Levels is a professional trading tool designed for MetaTrader 5 that automatically identifies and draws major psychological price levels, including quarter and half levels. These levels are known to act as powerful support and resistance zones due to their influence on both institutional and retail trader behavior. This indicator is perfect for any trading style—whether you're a scalper, day trader, or swing trader—and is compa
FREE
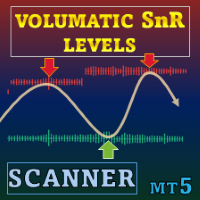
Oferta especial : ALL TOOLS , apenas $35 cada! Novas ferramentas custarão $30 na primeira semana ou nas primeiras 3 compras ! Trading Tools Channel on MQL5 : Junte‑se ao meu canal no MQL5 para receber as novidades Volumatic Support/Resistance Levels Scanner é um indicador de suporte e resistência que adiciona contexto de volume à estrutura de preços. Ao mostrar como a atividade de negociação se agrupa em torno dos pivôs recentes, ajuda os usuários a ver onde o interesse de compra o
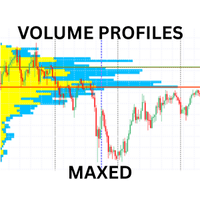
Advanced Volume Profile Indicator for MT5
Transform your trading with professional-grade volume analysis. This comprehensive volume profile indicator delivers institutional-quality market insights with multiple profile types, advanced alert system, and customizable display options.**
Key Features
**Multiple Profile Types** - **Visible Range Profile** : Analyzes volume within the current chart window - **Fixed Range Profile** : Custom date range analysis with visual markers - **Sessio

Indicador MACD de múltiplas moedas e vários prazos. O painel pode exibir o MACD tradicional (verdadeiro) e o MACD integrado ao MetaTrader.
No painel você pode ver o estado atual do indicador — a direção do movimento das linhas MACD, sua interseção e uma janela pop-up com o gráfico do indicador. Nos parâmetros você pode especificar quaisquer pares de símbolos e prazos desejados. O scanner também pode enviar notificações sobre linhas que se cruzam e sobre linhas que cruzam o nível Zero. Ao clica

Uma ferramenta projetada para oferecer uma visão clara e objetiva do cenário de mercado em tempo real .
Seu painel Multi-Timeframe dinâmico permite acompanhar simultaneamente diferentes períodos gráficos, ajudando o trader a tomar decisões de forma antecipada e estratégica . Descrição da Ferramenta O Brute Force Trend é um indicador avançado, desenvolvido a partir de transformações matemáticas precisas , que proporciona: Análise de Tendência Multi-Timeframe em tempo real Histograma Adaptativo ,
FREE

SuperTrend Alert with Email Notification – Your Smart Market Sentinel! Overview: SuperTrend Alert with Email Notification is a lightweight and powerful tool that helps traders stay ahead of trend changes in real-time . Built on the widely trusted SuperTrend indicator , this tool monitors price action and instantly notifies you via email when a new BUY or SELL signal is triggered – no more missed opportunities! ️ Key Features: SuperTrend-Based Signals Uses SuperTrend algorithm (ATR-base
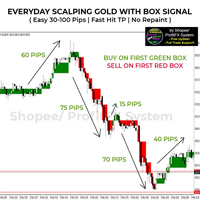
Always getting MARGIN CALLS again and again? Still haven’t found an indicator or technique that DELIVERS CONSISTENT DAILY PROFIT ? Tired of depositing funds and desperately wishing you could FINALLY WITHDRAWING ?
Don’t worry. I’m a REAL FULL TIME TRADER and I’ll share with you the very indicator I'VE BEEN USING MYSELF to successfully become a full-time trader.
STOP WASTING time with indicators that aren’t created by real traders and have no proven track record!
Start
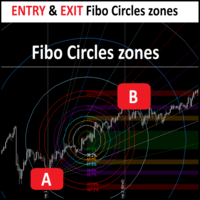
FiboCircles Zones — The Ultimate Price-Time Fibonacci Suite for MT5 Professional Geometry | Context-Aware Momentum | Cross-Timeframe Precision Elevate Your Analysis to Institutional Standards FiboCircles Zones is more than just a drawing tool; it is a high-precision Professional Analytical Framework for MetaTrader 5. It bridges the gap between classic technical analysis and advanced market geometry, allowing traders to identify "Price-Time Confluence" —those rare moments where geomet
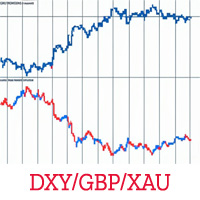
Overview Unlock a fresh perspective on your charts with the KS Invert Chart Pro Indicator – a powerful, zero-lag tool designed exclusively for MetaTrader 5. This innovative indicator inverts bars or candles mathematically (by multiplying price data by -1), revealing hidden patterns, contrarian opportunities, and inverse correlations that traditional views might miss. Perfect for advanced traders employing correlation strategies, multi-timeframe analysis, or hedge monitoring. Whether you're spott
FREE

BEHOLD!!!
One of the best Breakout Indicator of all time is here. Multi Breakout Pattern looks at the preceding candles and timeframes to help you recognize the breakouts in real time.
The In-built function of supply and demand can help you evaluate your take profits and Stop losses
SEE THE SCREENSHOTS TO WITNESS SOME OF THE BEST BREAKOUTS
INPUTS
MaxBarsback: The max bars to look back
Slow length 1: Period lookback
Slow length 2: Period lookback
Slow length 3: Period lookback
Slow
FREE

AllTF Trend Bias Indicator is a professional tool to visualize market bias, designed mainly for 1-minute charts. The colors are not trading signals by themselves, but a visual compass to guide your decision-making: HiddenEdge release model
All HiddenEdge tools follow the same structured release plan.
Each indicator is released initially for free to collect feedback.
After reaching a stable user base, it moves to a fixed paid tier.
Some utilities remain permanently free as part of the Hidde
FREE
O Mercado MetaTrader é a única loja onde você pode baixar um robô demonstração de negociação gratuitamente para testes e otimização usando dados históricos.
Leia a visão geral e opiniões de outros clientes sobre os aplicativos, faça o download para o seu terminal e teste um robô de negociação antes de comprá-lo. Apenas no Mercado MetaTrader você pode testar um aplicativo de forma absolutamente gratuita.
Você está perdendo oportunidades de negociação:
- Aplicativos de negociação gratuitos
- 8 000+ sinais para cópia
- Notícias econômicas para análise dos mercados financeiros
Registro
Login
Se você não tem uma conta, por favor registre-se
Para login e uso do site MQL5.com, você deve ativar o uso de cookies.
Ative esta opção no seu navegador, caso contrário você não poderá fazer login.