适用于MetaTrader 4的付费技术指标 - 9
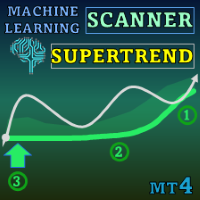
Special offer : ALL TOOLS , just $35 each! New tools will be $30 for the first week or the first 3 purchases ! Trading Tools Channel on MQL5 : Join my MQL5 channel to update the latest news from me 利用先进的机器学习技术,体验 Machine Learning Adaptive SuperTrend 的强大功能,这是一款创新的指标,能够无缝适应市场变化。通过将k-means聚类与SuperTrend方法结合,该指标能够精准识别趋势并评估波动性,为交易者在动态市场中提供宝贵的优势。 查看更多MT5版本: Machine Learning Adaptive SuperTrend MT5 查看更多产品: 所有产品 精准的机器学习与自适应SuperTrend 此指标基于实时市场数据进行调整,将波动性分为高、中、低三个等级。利用k-means聚类,它将ATR(平均真实范
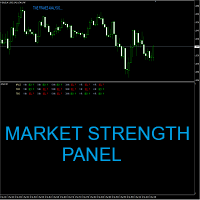
阿波罗市场强度面板是一个多时间框架指标,对外汇和二元期权交易者有帮助。该面板代表了从 M1 到 H4 的几个时间范围内的市场状况。该指标提供有关三个重要市场方面的信息。它们是趋势、力量和冲动。如果所有这 3 个组件都对齐,则该指标将根据市场方向为您提供买入或卖出信号。该指标在您的图表上绘制信号。您可以选择它应该生成信号的时间范围。当所有时间框架都对齐时,它也可以给你一个信号。该指标为您进行市场分析。你准备好应用信号了。该面板可以用作独立系统或作为您现有交易系统的一部分。 无论您喜欢在什么时间范围内交易,该指标都会对您有所帮助。即使您是黄牛或长期交易者,您也可以使用此工具。顺便说一句,即使您使用 D1 图表,您仍然可以使用此工具。我可以教您如何在您想要交易的任何时间范围内使用该工具。 购买后请联系我以获得我的个人交易建议和一个很棒的奖金指标!
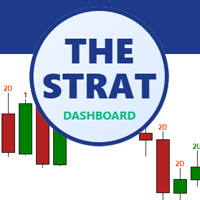
The Strat Dashboard – Rob Smith 策略专用多符号模式扫描仪
以实时多符号 Strat 分析,提升您的交易表现
The Strat Dashboard 是一款强大、专业级别的指标,专为使用 Rob Smith 著名 “Strat” 交易方法的交易者设计。它可同时监控无限符号、跨多个时间框架,瞬间识别高概率设置,再也不会错过任何可操作的模式。 MT5 Version :- https://www.mql5.com/en/market/product/153384/
什么是 “The Strat”?
The Strat 是由 Rob Smith 开发的一种革命性价格行为交易策略,专注于识别特定的蜡烛图模式及其跨时间框架的关系。该方法根据蜡烛与之前蜡烛的互动,将每根蜡烛分类为编号类别,创造出一种通用语言,用于解读价格行为,可应用于任何市场、任何时间框架、任何时刻。 The Strat 蜡烛分类系统: 1 Bar (Inside Bar):当前蜡烛的高点低于前一蜡烛的高点 且 低点高于前一蜡烛的低点 — 表示盘整 2 Bar (Directional

布林带指标的多货币和多时间框架修改。 在仪表板上,您可以看到布林带的突破和触及。 在参数中,您可以指定任何所需的货币和时间范围。 当价格触及布林线、当前波动率发生变化(扩大或下跌)以及价格触及所有布林线时,该指标还可以发送通知。 通过单击带有句点的单元格,将打开该符号和句点。 这是 MTF 扫描仪。
默认情况下,从图表中隐藏仪表板的键是“D”.
参数 Bollinger Bands Settings Averaging period — 计算指标的平均周期。 Standard deviations — 与主线的标准差数。 Bands shift — 指标相对于价格图表的移动。 Applied price — 用于计算的价格。 Show BB on the current chart — 在当前图表上显示 BB
仪表板 Clear the chart at startup — 启动时清除图表。 Set of Pairs — 符号集 — Market Watch — 来自 MT 的“市场观察”的货币对。 — Specified manually — 在参数“Pairs”中手动指定对

比特币预测器是一个基于箭头的指标,旨在预测价格反转。 此工具可与 BTC 和其他加密货币一起使用。它也可以与货币一起使用。但是您需要首先检查哪些配对最有效。一些配对和时间框架可以工作得非常好。您可以自由测试并自己查看。 该指标非常易于使用。所有你需要的是按照箭头。该指标可以作为独立系统工作,也可以作为您已经在使用的任何系统的一部分。购买后我将与您分享我的交易建议和奖金指标! 指示信号可以很容易地调整。您可以使指标算法适应任何时间范围,以及加密货币以外的其他货币对。 信号不要重绘!无论您目前拥有何种级别的交易经验,该交易指标都会对您有所帮助。 购买后请联系我!我将与您分享我的交易建议和奖金! 感谢您对我的指标的关注和兴趣!

该指标可搜索脉冲蜡烛并将其显示在图表上。 它包括一个阴影过滤器。它还能找到布林线的突破水平。 在设置中可以启用多货币仪表盘。 警报可选择当前图表或整个列表。 Blog-Link - Retest and Fake Breakout with UPD1
交易模式: 趋势回测。 假突破。 其他。
EURUSD, GBPUSD, XAUUSD, ... M15、M30、H1。
输入参数。
基本参数。 Bars Count - 指标运行的历史条数。 Coeff Period - 计算周期。 Min HL Coeff - 在该系数之上搜索蜡烛图。默认值为 2.0,但如果要在更高时间框架上获得更多信号,可以设置为 1.5。 Shadow Filter – 数值越大,烛台上阴影的大小就越大。最好设置为 50 或更低。
烛台的可视化。 Color Bar – 启用/禁用蜡烛填充。 Width Color Bar (-1 auto) – 填充厚度。默认为-1 自动,此时填充厚度与蜡烛图厚度一致。 Show Arrows On Chart – 在大蜡烛图上方显示数值。它们表示蜡烛比平均值大多

SMC 时段指标 是一种精确工具,专为依赖 ICT 概念、流动性搜寻 和 基于时段的策略 的 智能货币交易者 而设计。它使用机构级交易者使用的最成熟和最流行的概念,无缝地绘制出关键的基于时段的交易区域。这种一体化时段指标将最有效和高概率的区间策略叠加到您的图表上,包括: ICT 亚洲区间、伦敦突破、纽约区间、ICT 伦敦开盘杀戮区、ICT 纽约开盘杀戮区、开盘区间突破 (ORB) (涵盖 伦敦、纽约、东京 )和强大的 午夜开盘区间 。它还突出显示 主要的外汇交易时段, 包括 悉尼、东京、伦敦 和 纽约 。每个区间都使用 TimeBox 方法以最高精度绘制, 有助于识别关键的 FVG(公允价值差距)、区间扫描、时段高点/低点 和潜在的 做市商操纵区域 。该指标专为严肃的 SMC 交易者设计,高度可定制,以与任何经纪商的服务器时间保持一致,从而能够在任何图表或时间范围内精确执行。
ICT 亚洲区间策略: ICT 亚洲区间 策略是智能货币和 ICT 框架下的基础策略。它识别 格林威治标准时间 23:00 至 04:00 之间的累积和盘整区域,这些区域通常会设置流动性陷阱,并使交

多货币和多时间范围指标 Inside Bar (IB)。 在参数中,您可以指定任何所需的货币和时间范围。 该面板显示最后找到的内部柱线(和母柱线)形态、当前价格位置以及母线和内部柱线水平的突破。 您可以设置单元格中的条形和文本的大小和颜色。 当水平被突破时,该指标还可以发送通知。 通过单击带有句点的单元格,将打开指定的交易品种和句点。 这是 MTF 扫描仪。
默认情况下,从图表中隐藏仪表板的键是“D”.
参数 How long pattern will be valid after first breakout (bars) — 信号将在单元格中显示多少柱 IB body must be inside of the MB body - IB 主体必须位于 MB 主体内部。 IB body and wicks must be inside the MB body - IB 主体和灯芯必须位于 MB 主体内。 If MB is IB, choose the next MB — 如果找到的母柱是前一个信号的内柱,则将显示前一个信号。 MB body must be large tha

The Grand Signal indicator is a unique tool that not only provides an understanding of market behavior but also precisely identifies trend entry points after intraday correction limits, with accuracy down to a five-minute candlestick! It includes individual settings for each currency pair. After purchasing, be sure to message me directly for instructions! Telegram: @Lapinsania or here in the Market! I
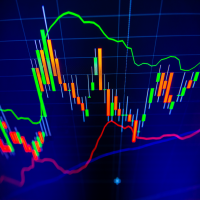
The indicator calculates reversal points based on the past trend and forms a channel (outer) on this basis. This elapsed time span from which the reversal points are determined can be specified in the settings.
An inner channel is also drawn in white. The trend continues in this channel, if there is a sideways trend. Here the upper / lower line form the possible turning point.
The indicator is suitable for all trading areas, whether forex, crypto, metals, indices or futures. All areas traded

DBD AND RBR CANDLESTICK PATTERN: This indicator based on the concept of two candlestick patterns. DROP BASE DROP (DBD) is a buy candlestick pattern and RALLY BASE RALLY (RBR) is a sell candlestick signal pattern. The arrows indicate potential signal setup for long trade and short trade. This indicator includes pop-up alert, push to phone and send to email alert which can be enabled and disabled. The color and size for DBD and RBR can be changed.

This indicator analyzes the ranges in the selected LookBack Bars and shows the relative strength of the price movement with the Level percentage you set. The blue line indicates that the current price movement is strong, and the yellow line indicates that we are in a flat price movement. The blue line does not determine whether the price action is up or down, it just shows relative strength. Therefore, as seen in the picture, direction can be determined with a simple zigzag indicator on the main

Use with disciplined risk management. Fibonacci entry system based on the golden zone 38.2 - 61.8 where the entry is confirmed at 23.6 with indications of Take Profit 3:1. Automatically plotted Fibonacci contains retracement and expansion Fibonacci in a single indicator. Up to 77% win rate with this system. FTMO challenge pass with 0.50% risk and 1.50% R:R.
Dear Traders, check out my new multi level market liquidity indicator : https://www.mql5.com/en/market/product/73098
Many of you have been trading very good with this indicator, thanks for the support and positive feedbacks ! For more information about market liquidity, a manual on how to use this indicator please send me a message. A lot of information can be found on the net. (search liquidity trading/ inner circle trader)
https://www.youtube.com/watch?v=yUpDZCbNBRI
https://www.youtube.com/

Introducing a powerful, precision-engineered indicator that seamlessly combines Pivot Points, Moving Averages, and Multi-Timeframe Analysis to deliver high-probability Buy and Sell signals in real-time. This tool is your strategic edge, designed to identify trend reversals, market momentum, and optimal trade entries, no matter your preferred trading style.
Our algorithm goes beyond standard indicators—by analyzing multiple timeframes simultaneously, it spots true market turning points while fi
This Indicator only places quality trades when the market is really in your favor with a clear break and retest. Patience is key with this price action strategy!
If you want more alert signals per day, you increase the number next to the parameter called: Support & Resistance Sensitivity. After many months of hard work and dedication, we are extremely proud to present you our Break and Retest price action indicator created from scratch. One of the most complex indicators that we made with over
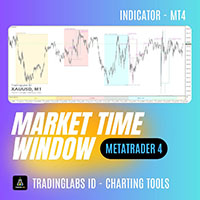
ICT Market Time Cycle – Complete Session & Time Window ICT Market Time Cycle is a professional trading indicator designed to help traders follow the ICT (Inner Circle Trader) methodology with ease.
It automatically displays the main market sessions (Asia, London, and New York), along with Killzones, Silver Bullet windows, and Macro times directly on your chart. With this tool, you no longer need to calculate session times manually – everything is plotted automatically in a clean and professional

This all-in-one indicator displays real-time market structure (internal & swing BOS / CHoCH), order blocks, premium & discount zones, equal highs & lows, and much more...allowing traders to automatically mark up their charts with widely used price action methodologies. Following the release of our Fair Value Gap script, we received numerous requests from our community to release more features in the same category. //------------------------------------// Version 1.x has missing functions + PDAr

Chart Patterns Detect 15 patterns (Ascending Triangle, Descending Triangle, Rising Wedge, Falling Wedge, Bullish Flag, Bearish Flag, Bullish Rectangle, Bearish Rectangle Symmetrical triangle, Head and Shoulders, Inverted Head and Shoulders, Triple top, Triple Bottom, Double Top, Double Bottom) Use historical data to calculate the probability of each pattern to succeed (possibility to filter notification according to the chance of success) gives graphic indication about the invalidation level and

Dark Oscillator is an Indicator for intraday trading. This Indicator is based on Counter Trend strategy, trying to intercept changes in direction, in advance compared trend following indicators. We can enter in good price with this Indicator, in order to follow the inversion of the trend on the current instrument. It is advised to use low spread ECN brokers. This Indicator does Not repaint and N ot lag . Recommended timeframes are M5, M15 and H1. Recommended working pairs: All. I nst
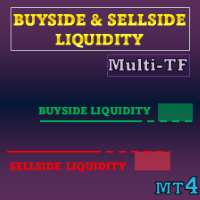
特别优惠 : 全部工具 ,每个仅 $35 ! 新工具 在 第一周 或 前3笔购买 期间定价为 $30 ! MQL5 交易工具频道 :加入我的 MQL5 频道以获取我的最新消息 本指标可视化 流动性水平 与 流动性区域 (基于 ICT 概念 , 并提供 Liquidity Voids 以突出单方向价格位移)。它关注止损或挂单易于聚集的位置,以及当价格穿越这些区域后其变化情况。
查看更多 MT5 版本: Buyside and Sellside Liquidity MT5 Multi Timeframe 查看更多 MT4 版本: Buyside and Sellside Liquidity MT4 Multi Timeframe 更多产品: All P roducts 要点 • 以配色区分的水平与区域,阐明双向流动性结构(buyside/sellside) • 当价格穿越水平后立即形成区域,并在价格保持于受控带内时扩展 • 以多层薄片显示 Liquidity Voids,便于跟踪其随时间的回补 • 提供“仅近期”或“全历史”两种显示

** All Symbols x All Time frames scan just by pressing scanner button ** *** Contact me to send you instruction and add you in "Harmonic Scanner group" for sharing or seeing experiences with other users. Introduction Harmonic Patterns are best used to predict turning point. Harmonic Patterns give you high win rate and high opportunities for trade in during one day. This indicator detects the best and successful patterns base on Harmonic Trading books . The Harmonic Patterns Scanner Scans All ch

Special offer : ALL TOOLS , just $35 each! New tools will be $30 for the first week or the first 3 purchases ! Trading Tools Channel on MQL5 : Join my MQL5 channel to update the latest news from me SMC 是一种交易方法,帮助交易者识别流动性区域、机构订单位置以及关键市场转折点。通过利用 SMC 原则,交易者可以更有效地驾驭市场,找到最佳的进场和出场点。 SMC System 指标将这些概念自动化,使您能够快速标记图表上的关键价格行为元素,例如: 实时市场结构 (内部结构与摆动结构的 BOS / CHoCH) 订单区块 (多头与空头) 溢价区与折扣区 等高与等低 公平价值缺口 (FVG) 检测 多个时间框架中的关键高点与低点 MT5 版本在此查看: SMC System MT5 查看更多产品: 所有 产品 主要功能 SMC System 为 SMC
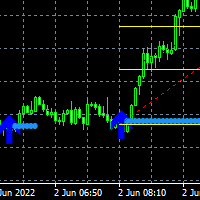
Here is the Double Arrow ArrZZx2 indicator that works best on 5 minutes time frame with Alerts. Good for pairs like NAS100, US30, GER30 and XAUUSD Your buy entry or Sell entry is on the second arrow of the Arr zzz You can confirm your second arrow with Fibonacci retracement levels the 50% level and the 61.8% which is the golden zone The double is good on strong trending markets look for the breakout on the second arrow Look at the screenshots for examples.

EMA Cloud System is a Trading System Invented by Ripster where areas are shaded between two desired EMAs. The concept that the EMA cloud area serves as support or resistance for Intraday & Swing Trading. Can be utilized effectively on 10 Min for day trading and 1Hr/Daily for Swings. Ripster utilizes various combinations of 5-12 EMA clouds 34-50 EMA clouds among others. 8-9, 20-21 EMA clouds can be used as well. Adjust what works for you. Ideally 5-12 or 5-13 EMA cloud acts as sold fluid Trendlin
The VIX Fix is a volatility indicator developed by renowned trader Larry Williams. It's designed to measure volatility in assets that don't have options or futures, such as individual stocks and forex markets. Essentially, it acts as a synthetic VIX (Volatility Index) for any asset , providing a gauge of market uncertainty. This modified version of William's indicator helps you to find market bottoms and market tops. It comes with 2 styles: Stochastic and histogram style. Please see screenshot

The Trend Magic Alarm shows the direction of a trend and indicates when it changes with a sound, popup window, push or email notice. Blue dots in the chart indicate an uptrend, red dots indicate a downtrend. Levels of former highs + lows give orientation in a chart. Trend Magic Alarm can draw these levels as lines in the chart, see inputs.
Input Parameters Counter : number of bars used for calculation PowerSet : shows how near to the bars the trigger dots are placed DotSize : size of the shown
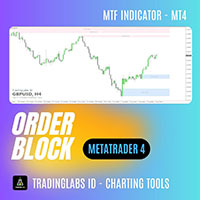
Order Block + Fair Value Gap (FVG) Indicator Multi-Timeframe Order Block + FVG Tool In the ICT (Inner Circle Trader) concept, Order Blocks (OB) + Fair Value Gaps (FVG) are among the most critical areas used by professional traders to read market structure, identify supply & demand zones, and spot high-probability entry points. The Order Block + FVG Indicator automatically detects and displays both Order Block zones and Fair Value Gaps directly on your MT4 charts. With multi-timeframe support, yo

"The Squeeze indicator attempts to identify periods of consolidation in a market. In general the market is either in a period of quiet consolidation or vertical price discovery. By identifying these calm periods, we have a better opportunity of getting into trades with the potential for larger moves. Once a market enters into a "squeeze," we watch the overall market momentum to help forecast the market direction and await a release of market energy." The StdATR Squeeze Channel combines standard

Forex Meter Oscillator is an indicator that can give a whole view of forex market from a single chart, measuring currency strenghts among 28 forex pairs (majors and minors). The "oscillator" word is very meaningful: it normalizes currency strenghts in order to provide values in a predefined range (from -1 to 1).
What are normalization's advantages? It's so simple, values will always be in a pre-defined range that reflect exactly the current value compared to the last N values. In this way you w
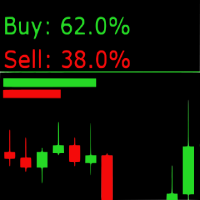
Sentiment Market Indicator: Real-Time Market Sentiment Display The Sentiment Market Indicator is a real-time MQL4 tool that displays current buy/sell sentiment directly on your MetaTrader 4 chart. Designed to support your technical analysis, it provides a visual representation of market positioning to help inform your decision-making process. Key Features Live Sentiment Display
View real-time percentage breakdowns of buy vs. sell sentiment. Customizable Alerts
Set specific thresholds for buy o

This indicator identifies No Demand –No Supply candles to your chart and plots volume bars colored according to the signal. It can be applied to all timeframes or to a specific one only. It can also be used as regular volume indicator but with exceptional future of WEIGHTED VOLUME. Furthermore is has an alert notification, sound and email when a signals occurs. The indicator does not repaint but the alert will come on two candles back due to the definition of No Demand No Supply. The VSA (Volum

This multicurrency strategy simultaneously determines the strength of the trends, entry points and the take profit levels for each trade. The indicator can determine entry points on any trading period from M1 to D1. For the convenience of users, the indicator renders the entry point (in the form of an arrow), recommended take profit levels (TP1, TP2, TP3) and the recommended stop loss level (SL1, SL2). The options for using the strategy are described below. Full description of the indicator Cosm

High Low Cloud Trend指标是一种基于通道的技术分析工具,通过自适应价格边界识别趋势方向和均值回归机会。该系统通过计算指定回溯期内的最高高点和最低低点来运作,创建定义整体价格区间的外部通道边界。次级内部通道使用较短周期(主回溯期的四分之一)来捕捉更广泛区间内更即时的价格波动。该指标的核心逻辑通过将收盘价与参考值进行比较来确定趋势方向,该参考值根据价格触及这些极值的位置在最高点和最低点之间翻转 - 当价格触及最低低点时,参考值切换到最高高点,反之亦然。这创建了一个二元趋势状态,指标以填充直方图或线条的形式显示下通道(上升趋势)或上通道(下降趋势)。均值回归检测机制识别特定的交叉模式,即价格在触及外部边界后向内部通道回移,生成指向潜在反转入场点的箭头信号。双时间框架通道方法结合基于翻转的趋势逻辑,使该指标在区间震荡市场中特别有效,同时仍能捕捉趋势性走势,并为趋势变化和均值回归设置提供可自定义的警报。
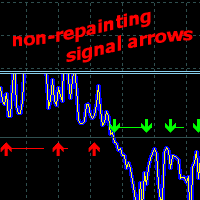
Price Direction Oscillator - 款用于监测短期和中期市场走势的指标。它适用于任何市场和时间框架。
它包含一条趋势线、- 个市场波动率震荡指标和一个潜在的交易信号生成器。
指标用途
它根据市场波动率判断趋势,并提供开立买入或卖出订单的信号。 信号箭头无需重新绘制历史数据,颜色保持不变,并会在K线图收盘时显示。 根据信号,预测的价格走势将以线条形式绘制。 在M1-M5时间框架下,该指标适用于剥头皮交易,在其他时间框架下,则适用于中期交易。 该指标始终位于价格图表底部,不会造成价格图表过载。 提供多种警报类型。
它可以作为独立指标使用,也可以作为辅助工具,减少技术分析中的不确定性。输入参数允许交易者自定义指标,根据时间框架和各种交易工具调整趋势周期和市场噪音平滑。 For M1 and M5 timeframes, increase the "Noise Smoothing" parameter.
For XAUUSD and other highly volatile instruments, multiply the "Noise Smoothing" v

Sniper Entries AI is a powerful, intelligent indicator designed for traders seeking precise entry points at potential market reversals. Leveraging advanced AI algorithms, this tool analyzes price patterns across multiple timeframes, allowing traders to stay informed of trend shifts, no matter the scale of their trades. Key Features of Sniper Entries AI: High-Precision Reversal Signals : The indicator scans market movements to identify precise reversal points and continuation, giving you a compe

The EasyTrend is a seemingly simple but quite powerful trend indicator. Everyone has probably come across indicators or Expert Advisors that contain numerous input parameters that are difficult to understand. Here you will not see dozens of input parameters, the purpose of which is only clear to the developer. Instead, an artificial neural network handles the configuration of the parameters.
Input Parameters The indicator is as simple as possible, so there are only 2 input parameters: Alert - i
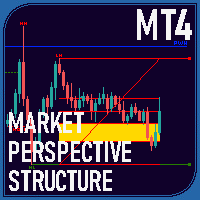
Overview The Market Perspective Structure Indicator is a comprehensive MetaTrader indicator designed to provide traders with a detailed analysis of market structure across multiple timeframes. It identifies and visualizes key price action elements, including swing highs and lows, Break of Structure (BOS), Change of Character (CHOCH), internal structures, equal highs/lows, premium/discount levels, previous levels from higher timeframes, and trading session zones. With extensive customization opt

SMARTMASS INDICATOR This indicator is different from all known volume indicators. It has a significant distinction; it is an algorithm that relates price movement to volume, attempting to find proportionality and efficient movement while filtering out noise and other movements that are more random and do not follow a trend or reversal. Ultimately, it reveals the true strength of the movement, indicating whether it has genuine support from bulls or bears or if it's merely a high-volume movement
沉浸在适应性与精确性相结合的交易环境中。Dynamic Grid Pro v1.7 提供一套旨在优化您市场交易方法的工具。 该系统的开发旨在为网格交易策略的执行提供一个灵活的框架。其核心功能在于能够根据不断变化的市场条件动态调整网格参数。 Dynamic Grid Pro v1.7 的特点: 动态网格: 系统根据波动性和价格变动自动调整网格水平,旨在优化订单执行。 订单管理: 允许精确控制网格内订单的下单和管理,提供多种配置选项。 多种入场策略: 集成不同的订单入场方法,为实施您的策略提供灵活性。 可自定义设置: 提供广泛的可调参数,以使系统适应您的偏好和交易风格。 信息面板: 显示有关网格和仓位的相关数据,方便监控和决策。 MetaTrader 集成: 旨在 MetaTrader 平台内无缝运行,充分利用其功能和工具。 Dynamic Grid Pro v1.7 致力于成为您交易旅程中的盟友,提供有条不紊且适应性强地实施和管理网格策略所需的资源。探索其功能,了解它如何融入您的工作流程。

This indicator presents an alternative approach to identify Market Structure. The logic used is derived from learning material created by DaveTeaches (on X) Upgrade v1.10: add option to put protected high/low value to buffer (figure 11, 12)
When quantifying Market Structure, it is common to use fractal highs and lows to identify "significant" swing pivots. When price closes through these pivots, we may identify a Market Structure Shift (MSS) for reversals or a Break of Structure (BOS) for co

Descption: The Volume Profile displays detailed informations of historical trading activities at certain price levels (Market Profile). So you can locate the areas with the best prices in the market and get an advantage about other market participants.
Features: Customizable Volume Profile / Market Profile Shows the "fair" Value Area with 70% of all Volume
Shows critical low volume zones
Shows VPOC, VAL and VAH Points Works on all timeframes Also available for MT5 ( https://www.mql5.com/en/mark

AIS 正确平均线指标允许您设置市场趋势运动的开始。该指标的另一个重要品质是趋势结束的明确信号。指标不会重新绘制或重新计算。
显示值 h_AE - AE 通道的上限
l_AE - AE通道的下限
h_EC - 当前柱的高预测值
l_EC - 当前柱的低预测值
使用指标时的信号 主要信号是通道AE和EC的交点。
当 l_EC 线高于 h_AE 线时,可能会开始上升趋势。
在 h_EC 线低于 l_AE 线之后,可以预期下降趋势的开始。
在这种情况下,应注意 h_AE 和 l_AE 线之间的通道宽度。它们之间的差异越大,趋势就越强。您还应该注意 AE 通道实现的局部高点/低点。这时,价格变化的趋势变得最强。
可定制的指标参数 设置指标包括根据时间范围选择 LRH 参数。此参数的有效值范围为 1 到 350。
此参数越小,指标越敏感,错误信号的增加可能。另一方面,此参数不应设置得太高,因为指标会变得不那么敏感并会跳过信号。

Balance Levels 是一款易于使用的交易指标,它提供清晰的买卖信号以及动态价格水平,帮助交易者更有信心地规划进出场。 该工具非常灵活——既可以作为 独立的交易策略 使用,也可以集成到任何现有的交易系统中。它适用于 所有时间周期和所有市场 :外汇、黄金、指数、加密货币或股票。 Balance Levels 适合各种交易风格——从 剥头皮 、 日内交易 到 波段交易 甚至长期投资。凭借其直观的信号和“平衡区”,该指标能使图表更加清晰,去除不必要的“噪音”。 购买后,您将获得 使用指南和额外材料 ,以帮助您充分发挥该工具的价值,并成功融入您的交易风格。 无论您是新手还是有经验的交易者,Balance Levels 都是一款实用且低成本的解决方案,可以改善您在市场中的决策过程。 请先下载免费试用版并在您的图表上进行测试,然后再决定是否购买——看看它如何适应您的交易风格和策略。
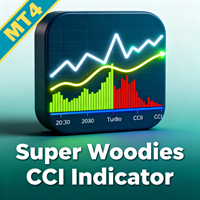
提升您的交易优势,使用 Super Woodies CCI Indicator MT4,这是一个先进的动量振荡器,受肯·伍德著名的 Woodies CCI 系统启发,该系统在 2000 年代初因其双 CCI 方法用于发现循环模式和高概率设置而在日内交易者中流行。广泛受到外汇、股票和商品交易者的青睐,这个指标利用 Commodity Channel Index (CCI) 来检测超买/超卖状况、趋势延续和反转,社区论坛如 Forex Factory 和 TradingView 强调其在减少虚假信号方面的有效性——通常通过清晰的视觉提示如 Zero Line Rejects 和 Trend Line Breaks 将胜率提高 15-25% 在基于动量的策略中。其持久吸引力在于简化复杂的市场动态,在波动会话中启用精确入口,同时最小化情绪交易,使其理想用于剥头皮者、波段交易者和寻求强劲趋势强度确认的自动化系统。 Super Woodies CCI Indicator MT4 显示白色 CCI 线(默认周期 100,典型价格)用于核心动量,黄色 Turbo CCI (TCCI) 线作为平滑 LW

Exit Area Ultimate 是一种技术指标,旨在通过在图表上指示每日 平均真实范围 (ATR) 和 平均每日汇率 (ADR) 水平来增强交易决策。通过了解这些水平,交易者可以轻松评估资产全天的平均变动。这个多功能指标为日内交易者提供多种用途,帮助下单、识别日内趋势、设置追踪止损水平以及建立每日获利水平。 该指标的主要特征之一是它依赖于 ATR 和 ADR 指标,这些指标提供了对市场波动和价格范围的宝贵见解。交易者可以使用此信息来确定适当的获利和止损水平,从而优化他们的风险管理策略。该指标还根据指示的水平计算剩余点数,从而可以快速评估潜在的利润或损失。 Exit Area Ultimate 与每个符号兼容,使交易者能够将其应用于广泛的资产。此外,每个指标级别都可以根据个人偏好和交易策略激活或停用。交易者可以根据他们的具体要求灵活地定制指标水平。 为确保及时通知,该指标提供手机、电子邮件和弹出式警报,让交易者随时了解重要的市场动态。这些警报可以快速配置和定制,以满足个人喜好。 在参数方面,Exit Area Ultimate 提供了 ATR 和 ADR 的各种设置。交易者可以调整

使用 Cm Ultimate Ma Mtf MT4 提升您的交易决策,这是一个多功能移动平均指标,提供广泛定制用于多时间框架分析. 受 TradingView 热门工具启发并为 MT5 优化, 它支持各种 MA 类型包括 SMA, EMA, WMA, HullMA, VWMA, RMA, TEMA, 和 Tilson T3, 自 2010 年代以来因其从不同时间框架绘制双 MA 的能力而受欢迎. 非重绘且用户友好, 它突出价格交叉和 MA 交叉, 理想用于波动市场如外汇和加密的趋势检测. 交易者青睐 Cm Ultimate Ma Mtf 因为其双 MA 功能, 允许从更高时间框架绘制第二 MA (例如, H1 图表上的每日) 用于交叉检测和基于方向的颜色变化. Highlight bars 信号价格交叉主要或次要 MA, 帮助发现潜在入/出场. 优势包括平滑信号的灵活 MA 类型, 交叉或颜色变化的警报, 以及通过缓冲区的 EA 集成, 改善剥头皮, 波段或持仓交易中的胜率. 跨资产通用, 其通知确保及时行动, 在无需持续图表观察的情况下提升盈利能力. MQL 产品安装指南

提升您的交易精度,使用 WaveTrend Oscillator Indicator MT4,这是一个基于动量的工具,改编自 LazyBear 于 2014 年在 TradingView 上标志性的脚本,以其在发现市场反转和动量转变方面的准确性而闻名。十多年来在交易社区广受赞誉,这个振荡器结合了类似于 RSI 和 MACD 的元素来检测超买/超卖状况,使其成为外汇、加密货币、股票和商品交易者的必备工具。其受欢迎程度源于可靠的交叉信号,这些信号在波动市场中过滤噪音,帮助用户利用趋势反转和强度,同时最小化假突破——适合寻求高概率入场的剥头皮、日内交易和摇摆策略。 WaveTrend Oscillator Indicator MT4 通过动态线(主振荡器的绿色)可视化动量,该线与信号线(红色虚线)互动,超买带(红色 60/53)和超卖带(绿色 -60/-53),辅以用于发现背离的直方图和清晰的买卖箭头提示。绿色箭头在振荡器低于超卖水平上方交叉信号时信号潜在买入,而红色箭头在超买区上方向下交叉时指示卖出。好处包括早期反转检测以锁定利润、动量评估以确认趋势,以及可自定义警报以无需屏幕时间快速行动

The tool is used to calculate the size of the position that can be opened with the previously assumed risk. The risk can be defined as: percentage value of the account (%), nominal value, expressed in the account currency. The size of position is determined by the distance of the planned SL (red line).
Input Parameters Lost_in_Money - if true, the value of the acceptable loss is determined by the parameter "Acceptable_loss", else acceptable loss is determined by the parameter "Acceptable_Risk_P

一目均衡多货币扫描仪表板 MT4 是一款功能强大的交易工具,旨在使用一目均衡表(Ichimoku Kinko Hyo)监控多个货币对和时间框架。它以网格格式组织信号,符号按基础货币和时间框架分组,范围从 M1 到 MN1。交易者可以启用或禁用特定时间框架以适应他们的策略。 该工具根据以下策略显示信号: Kijun Cross Strategy: 价格与均线(Kijun-sen)交叉时生成信号。
Kumo Breakout Strategy: 基于价格突破云(Kumo)的信号。
Chikou Span Confirmation Strategy: 使用迟行线(Chikou Span)确认信号。
Tenkan-Kijun Cross Strategy: 基于转换线(Tenkan-sen)和均线(Kijun-sen)交叉的短期信号。
Kumo Twist Strategy: 识别云(Kumo)的扭转以预测反转。 MT5版本可在此处找到: Ichimoku Cloud Multicurrency Scanner MT5 详细文档请点击此处: 文档 主要功能: 一目均衡集成:仪表板包含可定制的一
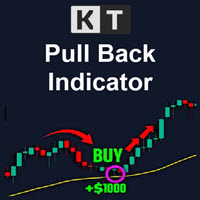
KT Pull Back Arrows 指标通过 RSI(相对强弱指数)在超买和超卖区域内识别合适的回调入场区域,并显示回调箭头。该指标利用 RSI 阈值,有效地识别出适合开启回调交易的有利时机。 趋势交易被认为是外汇市场中最具盈利性的策略之一,它相当于顺势而为,借助市场动能乘风破浪。然而,时机至关重要。若入场过晚,可能就像从悬崖跳下,不仅风险巨大,还极可能触发止损。 这正是趋势回调交易发挥作用的地方。但预测回调的深度从不是一件容易的事。即便借助斐波那契回撤工具,准确找出入场点依旧如大海捞针。现在,有了这个指标,一切将向着有利方向发展。
功能亮点
可自定义 RSI 数值,以适应不同交易品种和时间周期的回调识别。 可用于多头和空头交易。 通过分析回调幅度与整体市场趋势的关系来判断趋势方向。 适用于交易平台提供的任何品种,包括外汇、黄金、白银、指数、期货、股票等。
使用技巧 可与其他技术指标结合使用以提高准确性,例如结合支撑阻力位可更好确认趋势方向。 在高波动市场中,可调整 RSI 设置或尝试不同输入值来优化交易效果。 为最大化收益并降低风险,请确保每笔交易都具有良好的盈亏比,合理

KT MACD Alerts 是 MetaTrader 中标准 MACD 指标的个性化实现。它在以下两个重要事件发生时提供提醒并绘制垂直线,以帮助交易者更轻松地识别交易信号: 当 MACD 指标向上穿越零轴线时。 当 MACD 指标向下穿越零轴线时。
功能亮点 内置多周期扫描器,可在所有时间周期中显示 MACD 的方向变化,帮助交易者实现多周期共振分析。 非常适合关注 MACD 穿越零线交易信号的趋势跟随型交易者。 除了提供声音、图表、邮件等提醒方式外,还会在图表上绘制清晰的垂直线,方便快速定位交叉点。 本指标采用轻量级代码编写,占用资源少,运行流畅不卡顿。 全面支持 MetaTrader 的所有默认提醒系统,适用于不同交易场景。
MACD 的由来与发展 MACD,全称为移动平均收敛背离指标(Moving Average Convergence Divergence),是一种经典的技术分析工具,广泛用于分析股票、外汇和加密货币等市场。由 Gerald Appel 在1970年提出,MACD 能有效识别趋势的变化、强度与持续时间,是交易者不可或缺的趋势型指标之一。
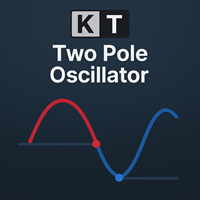
KT Two Pole Oscillator 是一款帮助交易者通过高级平滑算法识别精准市场信号的指标。它结合了基于偏差的计算和独特的双极滤波方法,生成清晰的视觉信号,让交易者更容易理解并及时采取行动。 得益于其自适应特性,双极滤波器在不同的市场环境中都能保持稳定,无论是趋势行情还是震荡行情,都是一个实用的工具。
功能亮点
双极滤波: 平滑震荡器信号,去除市场噪音,清晰显示市场动量和趋势方向。 超买/超卖识别: 当市场达到极端水平时能清晰标识,提示可能的反转或回调。 范围从 1 到 -1: 明确定义的震荡区间,有助于减少尤其在接近零线时出现的虚假信号。 高度可定制: 可以调整震荡器周期、颜色风格及其他参数,灵活适配个人交易风格。 全面提醒功能: 通过 MetaTrader 警报和推送通知实时提醒您信号,即使不在电脑前也不错过交易机会。
如何解读信号 当震荡器线从下向上穿越信号线时,会出现蓝色圆点,表示买入信号;当震荡器线从上向下穿越信号线时,会出现红色圆点,表示卖出信号。这些视觉标记便于快速识别可操作的交易机会。
专业建议
靠近 +1 和 -1 极端值处的信号通常更为可靠,因为它们
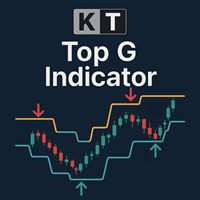
KT Top G 是一款基于价格行为的指标,它结合了智能通道分析来识别潜在的市场顶部和底部。当检测到可能的反转时,它会在图表上绘制醒目清晰的箭头,提前向您发出市场可能转向的信号。 大箭头: 通过识别价格衰竭和动量变化,标记出高概率的市场顶部和底部。 小箭头: 表示较低概率的转折点,这些位置通常在真正反转之前就会被突破。
功能特点 广泛兼容性: 可用于所有外汇货币对,也适用于指数、股票和ETF等其他交易品种。 多时间周期优化: 在M1和M5表现出色,适合剥头皮交易;在H1、H4和D1也能很好地支持波段交易。 内置中线通道: 除了箭头,指标还显示动态价格通道和中线,帮助您理解市场当前的区间与趋势方向。 不重绘: 一旦箭头出现在图表上,它就不会消失或改变,确保每个信号的可靠性。 适应波动行情: 可调节的长度和平滑因子,让您更好应对不可预测或快速波动的市场环境。 独立提醒: 大箭头与小箭头分别设有提醒,您可根据自身的风险偏好做出反应。 支持所有MT提醒: 提供弹窗、声音、邮件、推送等多种即时通知方式,确保不错过任何交易机会。
总结 许多交易者在将 Top G 添加到交易系统后,胜率明显提高

止损与追加保证金等级 – 您的风险管理助手 使用本指标,您可以在图表上实时查看止损(Stop Out)、追加保证金(Margin Call)、可用保证金(Free Margin)以及您自定义的关键风险等级。对于使用高杠杆或全仓策略的交易者而言,每一个点位的变化都可能带来巨大影响,因此,具备明确风险警示功能的工具是必不可少的。本指标专为提升风险意识与决策效率而设计。 完全可自定义 – 每条线的颜色、样式、粗细及可见性均可单独设置,灵活易用。 配置灵活 – 支持自定义预警阈值与刷新间隔,适应多种交易风格。 智能响应 – 若您同时持有多个品种的仓位,系统会根据当前风险敞口自动调整显示的关键等级。 提前预警、主动防控风险,让交易决策更加专业和可靠,避免因盲目操作导致亏损。

其中一个数字序列称为“森林火灾序列”。它被公认为最美丽的新序列之一。它的主要特点是该序列避免了线性趋势,即使是最短的趋势。正是这一属性构成了该指标的基础。 在分析金融时间序列时,该指标试图拒绝所有可能的趋势选项。只有当他失败时,他才会认识到趋势的存在并给出适当的信号。这种方法可以让人们正确地确定新趋势开始的时刻。然而,误报也是可能的。为了减少它们的数量,该指标添加了一个额外的过滤器。当新柱打开时会生成信号。在任何情况下都不会发生重绘。 指标参数: Applied Price - 应用价格常数; Period Main - 指标的主要周期,其有效值在 5 - 60 之间; Period Additional - 附加周期,此参数的有效值为 5 - 40; Signal Filter - 附加信号滤波器,有效值 0 - 99; Alerts - 启用后,指示器会在出现新信号时提醒您; Send Mail - 允许指标向电子邮件发送消息; Push - 允许您发送 Push 消息。

FVG 区域指标是一种强大的工具 ,旨在识别市场中的公允价值缺口 (FVG),突出公允价值和市场价格之间的价格不平衡。这种对缺口的精确识别使交易者能够发现潜在的市场进入点和退出点,从而大大增强他们做出明智交易决策的能力。
FVG 区域指标具有直观且用户友好的界面,可自动扫描图表中的公允价值缺口,并在价格图表上实时标记这些区域。这使交易者能够快速轻松地识别可能预示即将到来的价格调整或趋势延续的潜在价格不平衡。
主要功能包括: 实时缺口检测 :自动识别并标记出现的 FVG。 以点为单位显示缺口大小 :该指标以点为单位显示每个已识别缺口的大小,帮助交易者了解缺口的重要性。 与当前价格的点差 :即时计算并显示当前价格与已识别的公允价值缺口之间的点差。 清晰的可视化: 视觉上不同的 FVG 区域采用颜色编码以便快速参考,帮助交易者专注于关键市场领域。
无论您是经验丰富的交易者还是技术分析新手,FVG 区域指标都能提供对市场价格不平衡的重要见解,帮助您准确而自信地完善交易策略。
参数 缺口参数 缺口填补检测百分比 - 设置将缺口视为已填补的百分比 以点为单位显示缺口 - 启用或禁用以点为
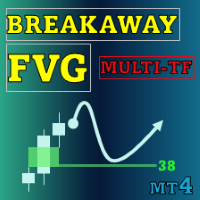
Special offer : ALL TOOLS , just $35 each! New tools will be $30 for the first week or the first 3 purchases ! Trading Tools Channel on MQL5 : Join my MQL5 channel to update the latest news from me Breakaway Fair Value Gaps (FVG) 工具是一种尖端的解决方案,旨在帮助交易者识别价格从平衡中突破的区域,并提供有关修正概率的深入见解。该工具不仅突出关键信号,还包括高级功能以提高决策的准确性。 查看 MT5 版本: Breakaway Fair Value Gaps MT5 查看更多产品: 所有 产品 Breakaway FVG 的关键特点 1. 什么是 Breakaway Fair Value Gap? 定义:
Breakaway FVG 是在价格突破近期历史新 高 或新 低 点时形成的区域。这些区域表明市场的强劲动量,因为买家或卖

Boom and Crash Spike Detector 指标是根据主要用于检测价格中的 Boom 和 Crash 的高级策略进行编码的。 植入了复杂的算法来检测价格中高概率的繁荣和崩溃。 它会在潜在的繁荣或崩溃阶段发出警报: 繁荣阶段:当价格上涨过快时。 崩溃阶段:当价格下跌过快时。
限时优惠:该指标仅适用于 30美元和终身。
主要特征
向手机发送推送通知 在计算机或笔记本电脑上弹出并发出警报 显示非重绘箭头(向上箭头表示潜在繁荣,向下箭头表示潜在崩溃) 与所有对一起工作。
推荐
时间范围:H1 和 H4 推荐货币对:处于趋势阶段的货币对。
接触
如果您有任何问题或需要帮助,请通过私信联系我。
作者
SAYADI ACHREF,金融科技软件工程师和 Finansya 创始人。

Volume Delta is a very powerful indicator that reads the supply on the Market. It calculates the Delta from movement of the price and the difference of BUY and SELL Tick volumes. Its special structure allows you to get all timeframe values available on the MT4 platform. A good observation of this instrument can suggest great entry points and possible reversal. We are confident that this tool will help you to improve your trading timing. See also for MT5: https://www.mql5.com/en/market/product/5

Lot Size Calculator – 仓位计算工具
该指标根据所选的风险百分比和止损距离计算手数。它适用于外汇、贵金属、指数、商品和加密货币交易。
主要功能 基于账户余额 / 可用净值和风险百分比的仓位计算 支持市价单和挂单模式 图表上可视化显示进场、止损和止盈线 风险回报比显示 根据止损距离自动调整手数 图表显示盈亏数值 使用方法 将指标加载到图表中 在输入设置中选择风险百分比 选择风险计算方式(基于账户余额或可用净值) 选择市价单或挂单模式 调整进场、止损和止盈线 使用计算出的手数在交易平台下单 参数说明 风险百分比:0.1% 至 100% 计算方法:基于账户余额 / 可用净值的风险百分比 显示内容:进场、止损和目标线及盈亏数值 该工具为交易者提供了清晰直观的风险管理方法,使仓位控制更加科学合理,适合不同经验水平的用户使用。

XAU Scalper MT4 MT5 版本 一个用于观察黄金货币对 短期价格走势 的分析工具。 XAU Scalper 指标根据 K 线稳定性、RSI 和短期动量提供 买入和卖出信号 。它旨在帮助交易者在 XAU 货币对的短暂市场波动期间确定 潜在的入场点 。 特点 K 线稳定性指数 ( Candle Stability Index ): 衡量 K 线实体与影线的比例,以评估价格行为的可靠性。 RSI 指数 ( RSI Index ): 跟踪相对强弱,指示潜在的超买或超卖情况。 K 线增量长度 ( Candle Delta Length ): 定义分析的近期 K 线数量,以检测方向变化。 信号过滤 ( Signal Filtering ): 可选择避免重复警报,以便进行集中的图表分析。 警报 ( Alerts ): 通过弹出窗口、声音、电子邮件和移动警报发送买入和卖出通知。 使用指南 将指标附加到 XAU 货币对并选择所需的时间周期(推荐 m1–m15 )。 根据市场 波动性 调整 K 线稳定性和 RSI 参数。 观察指标信号,并将其与总体趋势分析或支撑/阻力位相结合。 使用适合快节

变色K线通道指标 这个指标包括两个部分 部分I : 变色K线标 通过变色K线来指示当前市场状况。如果是青色,则是多头市场,如果是红色则是空头市场。 如果颜色正在交替变化中,最好等它变完后,即等K线收盘。 部分II: 通道指标 通道包括内外两层,内层定义为安全区域,外层用了平仓。 交易策略: 如果是颜色是青色,即多头,等价格位于内层通道时开多,价格触及外层轨道则平仓。 如果颜色是红色,即空头,等价格位于内层通道是开空,价格触及外层轨道则平仓。 提示:当且仅当价格位于内层通道时才入场,这点非常重要。
在EA中调用该指标的参考代码 : https://www.mql5.com/en/blogs/post/730475 参数解释 ShowColorCandle --- true 则画变色K线 BullColor ---Aqua.默认是青色,你也可以选择多头颜色 BearColor --- Tomato.默认是红色,你也可以选择空头颜色 AlertColorChange --- true.当颜色完成变换后会有弹窗报警 EmailColorChange --- true.当颜色完成变换后会发

仪表盘的意图是提供配置资产的日、周、月范围的快速概览。在 "单一资产模式 "下,仪表板会在图表中直接显示可能的反转点,从而使统计数据可以直接交易。如果超过了配置的阈值,仪表盘可以发送屏幕警报,通知(到手机MT4)或电子邮件。
使用这些信息的方式有多种。一种方法是,已经完成近100%日均运动的资产显示出逆转的趋势。另一种方法是观察资产,它的波动率与平均水平相比非常低。现在的挑战是如何从这个低波动性中交易突破。
这只是两种可能的策略,对于这些策略,仪表盘可以成为一个重要的辅助工具。发现各种可能性!
关于控件的完整描述,请观看我的博客文章( https://www.mql5.com/en/blogs/post/732999 )。
注意:这个指标不能在策略测试器中使用。所以这里来自市场的演示版本不能使用。请使用该指标的免费版本进行测试: https://www.mql5.com/de/market/product/33913
这是ADR-Dashboard的MT4版本。如果你想在MT5上使用,请到 https://www.mql5.com/en/market/product/527

引入 Awesome Oscillator Alert ,这是一个强大的技术指标,可为交易者提供有关市场动态和交易机会的宝贵见解。凭借其全面的功能和用户友好的界面,该指标是希望在市场上获得优势的交易者的必备工具。
Awesome Oscillator Alert 的突出特点之一是它与所有货币对和时间框架的兼容性。无论您是交易主要货币对还是外来货币,该指标都可以无缝集成到您的交易策略中。此外,用户友好的界面允许轻松自定义参数,确保您可以定制指标以满足您的个人交易偏好。
实时警报是成功交易的一个重要方面,而 Awesome Oscillator Alert 可以精确地提供它们。您将通过弹出窗口、声音和移动警报接收即时通知,让您随时了解重要的进入和退出信号。这种实时反馈使您能够及时做出交易决策并利用市场机会。
该指标提供两种可靠的交易策略:飞碟策略和零线交叉策略。飞碟策略识别直方图列中的模式,根据特定条件提供清晰的买入和卖出信号。另一方面,零线交叉策略着重于震荡指标与零线之间的相互作用,指导交易者何时进场或出场。
借助 Awesome Oscillator Alert,您可以依赖

The Simple ICT Concepts Indicator is a powerful tool designed to help traders apply the principles of the Inner Circle Trader (ICT) methodology. This indicator focuses on identifying key zones such as liquidity levels, support and resistance, and market structure, making it an invaluable asset for price action and smart money concept traders. Key Features Market Structure : Market structure labels are constructed from price breaking a prior swing point. This allows a user to determine t

The Silent Edge of Smart Money
"It's not about how much you do, but how much love you put into what you do that counts." – Mother Teresa
They say the real money in trading is made in the shadows—where inefficiencies hide and only the most perceptive capitalize. That’s exactly where the Arbitrage Thief Index (ATI) thrives. For years, this tool has been my personal advantage , silently identifying low-risk, high-reward trades before the crowd even notices. It’s the kind of edge top fund managers

It would be good to always be aware of the "struggle" between buyers and sellers. Then it would be much easier to determine the best direction to go in order not to lose out. This indicator offers an original solution to this problem: the supply and demand values are compared with the High and Low prices for the selected period, thus trying to determine the market movement towards the stronger side without ignoring the strength of the opposite side. All this is displayed in a separate window usi

机构流动性压缩指标 该指标通过布林带宽度、成交量和平均点差的标准化测量,实时检测流动性收紧情况,以识别价格突破前的压缩阶段。 显示方式:
专业独立窗口,包含“Compression Score”柱状图与“Threshold”阈值线。 主要特点 早期检测: 在价格波动前识别压缩区域。 多因素测量: 结合布林带宽度、成交量与平均点差的标准化数据。 实时更新: 每个行情跳动(tick)即时刷新。 清晰显示: “Compression”柱状图与虚线“Threshold”参考线。 兼容性: 适用于 MT4 与 MT5 平台。 使用方法 将指标添加至目标品种图表。 根据波动性与交易时段调整阈值与权重。 解读: 当分数较高时,表示出现流动性压缩,需关注潜在突破。 参数说明 BB_Period / BB_Dev: 计算布林带宽度。 Norm_Period: 近期波动性标准化周期。 Vol_Period: 成交量标准化周期(按 tick 计)。 Spr_Period: 平均点差标准化周期(MT5 使用历史数据,MT4 使用即时代理)。 Weight_Width / Weight_Volume / We

此多振荡器、多时间框架和多品种指标可识别价格与振荡器/指标之间何时出现背离。它识别常规/经典(趋势逆转)和隐藏(趋势延续)背离。它具有移动平均线、RSI/布林线、ADX、pin bar 和吞没过滤器选项,可以仅过滤掉最强的设置。结合您自己的规则和技术,该指标将允许您创建(或增强)您自己的强大系统。 特征
可以检测以下振荡器/指标的背离:MACD(信号线或主线(直方图))、随机指标、OsMA、RSI、CCI、RVI、Awesome (AO)、OBV、ADX、ATR、MFI、动量和综合指数。只能选择一个振荡器。 可以同时监控您的市场报价窗口中可见的所有交易品种。将该指标仅应用于一张图表,并立即监控整个市场。 可以监控从 M1 到 MN 的每个时间范围,并在发现背离时向您发送实时警报。支持所有 Metatrader 原生警报类型。 该指示器包括一个交互式面板。请参阅 博客 解释。 该指标可以将信号写入一个文件,EA 可以使用该文件进行自动交易。比如 这个产品 。
输入参数
请在此处 找到输入参数的说明和解释。 重要的
请注意,由于具有多时间框架功能,该指标不会在已安装指标的图表上绘制
MetaTrader市场是独有的自动交易和技术指标商店。
阅读MQL5.community用户备忘更多地了解我们提供给交易者的独特的服务:复制交易信号,自由职业者开发的自定义应用程序,通过支付系统完成的自动付款和MQL5云网络。
您错过了交易机会:
- 免费交易应用程序
- 8,000+信号可供复制
- 探索金融市场的经济新闻
注册
登录