Conheça o Mercado MQL5 no YouTube, assista aos vídeos tutoriais
Como comprar um robô de negociação ou indicador?
Execute seu EA na
hospedagem virtual
hospedagem virtual
Teste indicadores/robôs de negociação antes de comprá-los
Quer ganhar dinheiro no Mercado?
Como apresentar um produto para o consumidor final?
Pagamento de Indicadores Técnicos para MetaTrader 4 - 9

The Price Action Finder indicator is an indicator of entry points, which is designed to search and display patterns of the Price Action system on a price chart. The indicator is equipped with a system of trend filters, as well as a system of alerts and push notifications. Manual (Be sure to read before purchasing) | Version for MT5 Advantages
1. Patterns: Pin bar, Outside bar, Inside bar, PPR, Power bar, Hanging man, Inverted hammer 2. Pattern filtering system. Removes countertrend patterns fro
Stochastic Alert Manager Introduction: The Stochastic Alert Manager is a customizable indicator used to send alerts when trading signals occur. It also gives the user an overall idea of the tendency in all timeframes through a panel, to keep an eye on the global market behaviour. It is based on the stochastic crossovers strategy. The Stochastic Alert Manager is not meant to open trades for now. - Simple - Configurable - Respond quickly - Monitor the global behaviour How is it working? - It
This indicator was specially developed to support the powerful day trading strategy described in the book "The Price in Time". The NTZ BOX indicator automatically creates: The Day separators The No Trading Zone divided with the Green Box, the Peach Box and the Turqoise Box Extensions of the long and short Take Profit levels The Yellow Box to display the range of the Asian session The Money Manager for a perfect Position Sizing calculated on your risk percentage Using the NTZ BOX indicator will e
How To Determine If The Market is Strong Or Weak?
Strength Meter uses an Adaptive Algorithm That Detect Price Action Strength In 4 Important Levels! This powerful filter gives you the ability to determine setups with the best probability.
Features Universal compatibility to different trading systems Advance analysis categorized in 4 levels Level 1 (Weak) - Indicates us to WAIT. This will help avoid false moves Weak Bullish - Early signs bullish pressure Weak Bearish - Early signs bearish pre

Um conjunto de indicadores que reconhecem pontos de viragem. Deteta topos e fundos de combinações de velas após subtraí-los a dois MAs. Aplicável para sistemas de negociação ao utilizar entradas antecipadas. Pode ser utilizado ao longo da tendência para scalping e negociação intradiária e para detetar reversões de tendência nas fases iniciais.
Possibilidades
Os parâmetros fornecem definições flexíveis para quaisquer prazos e instrumentos de negociação. Existem vários tipos de alertas para

Quando você compra o Easy Trend Pro, você receberá GRATUITAMENTE o Advanced SR junto com uma estratégia de negociação que combina o EasyTrendPro e o AdvancedSR . Após efetuar o pagamento, por favor, envie-me uma mensagem separada para receber o seu presente. Suporte do Canal: Clique aqui Loja: Clique aqui
"As tendências são suas amigas" é uma frase que provavelmente você já ouviu antes. É um ditado clássico que o acompanha enquanto opera no mercado. Quando você segue a tendência atual, au

O indicador "MultiSymbol & TF Chart Integrated" é projetado para fornecer uma visão abrangente do mercado rapidamente, permitindo que você monitore até 60 pares de moedas em seus intervalos de tempo preferidos em um único gráfico (modo múltiplo) ou veja o par que você está negociando em todos os TFs (modo simples). Principais Vantagens: Monitoramento Completo: Permite monitoramento em tempo real de todos os pares desejados em um único gráfico de relance.
Economia de Tempo: Evita a necessidade d

Description :
VWAP (Volume-Weighted Average Price) is the ratio of the value traded to total volume traded over a particular time horizon. It is a measure of the average price at which pair is traded over the trading horizon. Read More.
All Symbols and All Timeframes are supported.
Indicator Inputs :
VWAP Mode : Mode of VWAP Calculation. Options can be selected : Single,Session,Daily,Weekly,Monthly
Volumes : Real Volumes,Tick Volumes
Price Type : Used price for ca

Gann Time Clusters Indicator This indicator is based on W. D. Gann's Square of 9 method for the time axis. It uses past market reversal points and applies the mathematical formula for Gann's Square of 9 and then makes projections into the future. A date/time where future projections line up is called a 'time cluster'. These time clusters are drawn as vertical lines on the right side of the chart where the market has not advanced to yet. A time cluster will result in a market reversal point (ex.

️️ Attention: There is a new update at 22-08-2024. What's new in this update? -* New strategy integration. -* The trade is with the price trend only. -* The success rate of trades has increased by a very large percentage. No more losses with this indicator, test it for years ago and see if there is losses in one day results. but before testing it please see the explaining video down here. FxBears Powers is working on all forex pairs, metals, commodities, futures, indices, energies,

Tendência do ouro - este é um bom indicador técnico de acções. O algoritmo do indicador analisa o movimento do preço de um ativo e reflecte a volatilidade e as potenciais zonas de entrada.
Os melhores sinais do indicador:
- Para VENDER = histograma vermelho + ponteiro SHORT vermelho + seta de sinal amarelo na mesma direção. - Para COMPRAR = histograma azul + ponteiro LONGO azul + seta de sinal aqua na mesma direção.
Vantagens do indicador:
1. O indicador produz sinais com elevada

Optimize as suas decisões de negociação com o nosso indicador de força e sentimento do mercado e não negoceie mais contra a tendência!
Meticulosamente concebido para comerciantes sérios que valorizam informações precisas e oportunas, o nosso indicador fornece uma visão panorâmica dos 28 pares principais de uma forma muito simples. Esta ferramenta é capaz de classificar os pares de moedas com base em termos de popularidade, força da tendência de alta ou de baixa e percentagem de compradores e

Gartley Hunter Multi - An indicator for searching for harmonic patterns simultaneously on dozens of trading instruments and on all classic timeframes: (m1, m5, m15, m30, H1, H4, D1, Wk, Mn). Manual (Be sure to read before purchasing) | Version for MT5 Advantages 1. Patterns: Gartley, Butterfly, Shark, Crab. Bat, Alternate Bat, Deep Crab, Cypher
2. Simultaneous search for patterns on dozens of trading instruments and on all classic timeframes
3. Search for patterns of all possible sizes. Fr

The ICT Immediate Rebalance Toolkit is a comprehensive suite of tools crafted to aid traders in pinpointing crucial trading zones and patterns within the market.
The ICT Immediate Rebalance, although frequently overlooked, emerges as one of ICT's most influential concepts, particularly when considered within a specific context. The toolkit integrates commonly used price action tools to be utilized in conjunction with the Immediate Rebalance patterns, enriching the capacity to discern con
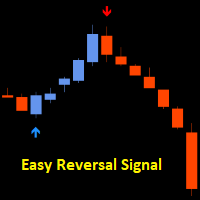
Easy Reversal Signal Indicator spots tops and bottom for catching new trends before they happen It shows entry signals with arrows Blue arrow = Buy entry Red Arrow = Sell entry Recommended timeframes are M1 and M5 but you can also use higher timeframes as well Best time to trade is London and New York session. I do not recommend trading the Asian session because due to the low volatility there can be more false signals. ENTRY RULES: The signals are non lagging and non repainting but you

Contact us to receive a comprehensive user guide after purchasing. William Delbert Gann, commonly known as W.D. Gann, was an exceptional market analyst renowned for his unique trading style in the early 20th century. His trading techniques were based on a blend of mathematics, geometry, astrology, and ancient mathematics. Gann believed that stock market movements followed specific patterns and cycles, rather than being random. His methodologies, celebrated for their accuracy and relevance, con

Indicador para determinar o plano e a tendência. Se o preço estiver abaixo de qualquer um dos dois histogramas e duas linhas (vermelha e azul), esta é uma zona de venda. Ao adquirir esta versão do indicador, versão MT4 para uma conta real e uma demo - como um presente (para receber, escreva-me uma mensagem privada)! Se o preço estiver acima de qualquer um dos dois histogramas e duas linhas (vermelha e azul), esta é uma zona de compra. Versão MT4: https://www.mql5.com/en/market/product/3793

ACTUALMENTE 20% DE DESCONTO !
A melhor solução para qualquer novato ou comerciante especializado!
Este Indicador é uma ferramenta de negociação acessível porque incorporámos uma série de características proprietárias juntamente com uma nova fórmula.
O Indicador Avançado de Volume de Moeda Acumulado é especializado para os principais 28 pares de Forex e funciona em todos os períodos de tempo. É uma nova fórmula que num único gráfico extrai todo o volume de moeda (C-Volume) de AUD, CAD, CHF

Pipfinite creates unique, high quality and affordable trading tools. Our tools may or may not work for you, so we strongly suggest to try the Demo Version for MT4 first. Please test the indicator prior to purchasing to determine if it works for you. We want your good reviews, so hurry up and test it for free...we hope you will find it useful.
Combo Energy Beam with Swing Control Strategy: Confirm swing pullback signals Watch Video: (Click Here) Energy Beam with Trend Laser Strategy: Confirm Tr

The Pioneer Of Trend Detection! A Powerful Indicator That Avoids Whipsaws And Uncertain Market Noise. Functions mainly as a filter to help you trade in the direction of the trend. It works in any pair or timeframe.
Features Advanced trend detection software using complex algorithms that can be used as the supporting tool or system. Unique trend detection that avoids whipsaws and uncertain market noise Analyzes statistics of maximum profits and calculates possible targets for the next signal Fl

Pipfinite creates unique, high quality and affordable trading tools. Our tools may or may not work for you, so we strongly suggest to try the Demo Version for MT4 first. Please test the indicator prior to purchasing to determine if it works for you. We want your good reviews, so hurry up and test it for free...we hope you will find it useful.
Combo Razor Scalper with Trend Laser Strategy: Scalp in the direction of the trend Watch Video: (Click Here)
Features Scalping indicator using a confir

O MT4 ilimitado é um indicador universal que se adequa a todos os comerciantes iniciantes e experientes.
funciona em todos os pares de moedas, criptomoedas, ações em bruto
MT4 ilimitado - já configurado e não requer configuração adicional
E agora a principal coisa
Por que o MT4 ilimitado?
1 falta completa de redesenho
2 dois anos de testes pelos melhores especialistas em negociação
3 a precisão dos sinais corretos excede 80%
4 teve bom desempenho nas negociações durante os comun

Scalping Monster Ultra Shock - ready-made system for trading on the scalping strategy. This indicator is a whole analytical center with analysis algorithms close to neural networks. The indicator automatically analyzes the market, examines the behavioral characteristics of the price, the impulses of market trends, the balance of trading, and based on the collected data, the indicator predicts points of reversal and further price movement.
How to trade using Scalping Monster Ultra Shock: wh
This is an Elliot Waves Indicator Arrow for Major Swing's On default settings i have tested this on all Major 28 pairs and i have had great results Check out the comments section for more pictures and details. AFTER PURCHASE PLEASE WRITE A COMMENT SO I CAN SEND YOU Your Free GIFT
(Includes NON REPAINT VERSION OF SIGNAL)
you have a few options of placement and a few different options for colors. this is a very simple and effective signal.

Swing Trading é o primeiro indicador projetado para detectar oscilações na direção da tendência e possíveis oscilações de reversão. Ele usa a abordagem de negociação de linha de base, amplamente descrita na literatura de negociação. O indicador estuda vários vetores de preço e tempo para rastrear a direção da tendência agregada e detecta situações nas quais o mercado está sobrevendido ou sobrecomprado em excesso e pronto para corrigir. [ Guia de instalação | Guia de atualização | Solução de prob
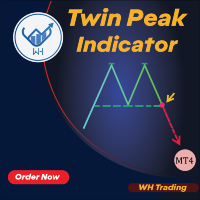
Bem-vindo ao Twin Peak Indicator MT4 --(Double Top/Bottom)-- O Double Top and Bottom Indicator é uma ferramenta de análise técnica projetada para identificar possíveis padrões de reversão no mercado.
Ele identifica áreas onde o preço fez dois picos ou depressões consecutivos de altura quase igual, seguido por um movimento de preço na direção oposta.
Esse padrão indica que o mercado está perdendo força e pode estar pronto para uma reversão de tendência.
Características:
Anotações autom
Este indicador detecta Breakout usando a estratégia de detecção de barras de parâmetros de entrada. Você pode usar a função WaitForBarClosed para confirmar sinais (verdadeiro), mas às vezes é ativado um pouco depois de falso. O indicador abre em uma janela separada. Adequado para todos os prazos e pares. A linha azul mostra a direção da tendência.
Anexe o indicador a qualquer gráfico Selecione as entradas desejadas na guia entradas da caixa de diálogo do indicador que aparece. Selecione OK pa

Candle Power Signals é um indicador de tendência que utiliza uma estratégia de busca de potenciais sinais voláteis para tomar decisões de negociação.
Ao analisar o mercado, o indicador identifica zonas de aumento e diminuição da volatilidade dentro do movimento de tendência direcional.
Os principais parâmetros de geração de sinal já foram configurados, as demais configurações e períodos estão indexados em 2 parâmetros para configuração manual:
1. "Candle calculation method" - 2 modos de ger

Scalping Points Pro is an indicator that shows possible price reversal points on the chart and does not redraw its signals. Also, the indicator sends signals to the trader via Email and Push. The accuracy of the signals of this indicator is approximately 92-94% on the M5 timeframe and more than 95% on the H1 timeframe. Thus, this indicator allows the trader to accurately open trades and predict further price movement.
The indicator does not redraw its signals. The indicator works on timefram

We mark the fair value gap (FVG) and wait for the price to reach that zone, but sometimes it reverses before getting there. This can happen because we didn't notice the Balanced Price Range (BPR). My tools will enhance your analysis by displaying everything on the chart, helping you identify potential price reversal areas so you can make informed decisions about when to enter the market. MT5 - https://www.mql5.com/en/market/product/119228/ So, what is BPR or Balanced Price Range? A Balanced Pr

The indicator displays volume clusters or volume profiles to choose from.
Input variables
StepPoint - cluster step in points, if the value is zero, the step is assigned automatically. AssociatedTimeframe - binding the indicator to the specified timeframe of the chart, if the value is equal to Current, the indicator works on all timeframes. ClustersVolume - volume in clusters: All - all volume. Active - active volume (which produced the price movement). ClustersAsDelta - difference betw

Dashboard for Ma Speedometer: https://www.mql5.com/en/market/product/116784
Non standard attitude to the standard moving average indicator. The essence of the indicator is to determine the strength and speed of the price direction by determining the tilt angle of the moving average. A point is taken on the fifteenth MA candle and a point on the last closed MA candle, a straight line is drawn between them, it is movable and on a hemisphere shows an angle of inclination from 90 degrees to -90.
Indicatorul Delphinus Bine ați venit în magazinul meu!
Experimentați indicatorul Delphinus!
Funcționează pe toate intervalele de timp și toate perechile, cu diferențe de rigoare.
Îl consider unul dintre cei mai buni indicatori pe care i-am creat.
Aș sugera să-l folosești în special pe intervalele de timp D1, H4, H1, M30, unde funcționează foarte bine.
Tranzacționez cu acest indicator în special pe H4.
Mult succes în tranzacționare!

This indicator displays the wave structure of the market in the form several wave levels nested in each other. For each of these levels an automatic preliminary (draft) marking of waves in Elliott's style (123..., ABC... etc.) is created. This markup is completely automatic and absolutely univocal. The indicator is especially useful for beginner wave analysts, because among all the possible versions for wave marking, it allows you to immediately take the most adequate version as a ba

The Forex indicator TrendNavigator is a technical indicator. TrendNavigator is a tool that allows traders employing this strategy to better understand what is happening in the market and predict in which direction the price will continue to move. The indicator's values are calculated based on price movements of the currency pair or any other financial asset. Within the scope of technical analysis, the TrendNavigator indicator is used by traders to forecast future price values or the overall

The Color Trend FX indicator shows on the chart the accurate market entry points, accurate exit points, maximum possible profit of a deal (for those who take profit according to their own system for exiting deals), points for trailing the open positions, as well as detailed statistics. Statistics allows to choose the most profitable trading instruments, and also to determine the potential profits. The indicator does not redraw its signals! The indicator is simple to set up and manage, and is sui

The NASDAQ 100 Power Indicator serves with TREND and trend reversals indication using automated arrows that indicates buy or sell at that price and has built-in signal provider across all time frames with alerts and provides also the automated support and resistance that can draw technical analysis patterns like double bottom, double top, head and shoulders etc. using closing and open prices, in assistance for if a trader did not see the pattern sooner for their technical analysis. The indicator

EasyTrend Pro is the powerful trend indicator provided with all necessary for trade and it is very easy to use. Everyone has probably come across indicators or Expert Advisors that contain numerous input parameters that are difficult to understand. But here, input parameters are simple and it is no need to configure anything — neural network will do all for you.
Difference from a classic version
The real-time multi time frame panel is added, so you can check a trend for other timeframes witho

Documentation for connecting Metatrader 4 with Python with a simple drag and drop EA.
A full end-to-end solution ,fully tested ,fast and efficient!
The Pytrader ecosystem consists of a python script and a MT4 EA. ( MT5 version )
Further for the licensing an indicator is used.
The communication between the python script and the EA is based on sockets.
EA is the Server and the python script the Client .
It is always query(function / python script) and output(data / server).
The

The Pairs Spread indicator has been developed for the popular strategy known as pairs trading, spread trading, or statistical arbitrage. This indicator measures the distance (spread) between prices of two directly (positively) correlated instruments and shows the result as a curve with standard deviations. So, traders can quickly identify when the instruments are too far apart and use this information for trade opportunities.
How to use the Pairs Spread indicator Best results are attained wh

What is a Point of Interest? Traders who follow Smart Money Concepts may call this a Liquidity Point, or where areas of liquidity have been built up by retail traders for for Big Banks to target to create large price movements in the market. As we all know, retail traders that use outdated and unreliable methods of trading like using trendlines, support and resistance, RSI, MACD, and many others to place trades and put their stop losses at keys points in the market. The "Big Banks" know these me
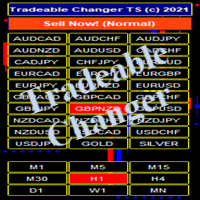
Tradeable Changer Indie
Trade-able Changer Indie is an indicator that serves several purposes. The idea behind this operating indicator is to have a minimal set of indicator
or experts on the chart in order to avoid clumsy chart window and at the same time have a great time trading profitably.
This is a combination of Symbol/Time-frame Changer and a Trading system based on Trends following.
It has a small board to display trade signals for the trader.
Due to the nature of these com

Contact me after payment to send you the user manual PDF file. Introduction Introducing the Wolfe Pattern Indicator, a powerful tool designed to help traders identify and capitalize on the elusive Wolfe Pattern in financial markets. This innovative indicator uses advanced algorithms to scan for the Wolfe Pattern in all symbols and time frames, providing traders with a unique edge in the market. How to trade with the Wolfe Pattern The Wolf Pattern is a rare and lucrative trading opportunity that

Royal Wave is a Trend-Power oscillator which has been programmed to locate and signal low-risk entry and exit zones. Its core algorithm statistically analyzes the market and generates trading signals for overbought, oversold and low volatile areas. By using a well-designed alerting system, this indicator makes it easier to make proper decisions regarding where to enter and where to exit trades. Features Trend-Power Algorithm Low risk Entry Zones and Exit Zones Predictions for Overbought and Over

Renegade The indicator generates arrows (red and blue by default). The indicator is installed in the usual way on any trading symbol with any time interval. It is an auxiliary tool that is used for technical analysis of the price movement chart in the Forex market. Novice traders have difficulties both with finding an indicator and with its application. Their reason is the lack of technical awareness of ordinary users and the lack of basic knowledge about good trading programs.
In Forex trans

Level Breakout Indicator é um produto de análise técnica que funciona a partir dos limites superior e inferior, que pode determinar a direção da tendência. Funciona na vela 0 sem redesenhar ou atrasos.
Em seu trabalho utiliza um sistema de diversos indicadores, cujos parâmetros já foram configurados e combinados em um único parâmetro - “ Scale ”, que realiza a gradação dos períodos.
O indicador é fácil de usar, não requer nenhum cálculo, usando um único parâmetro você precisa selecionar a grad

Sacrament mt4- This is an indicator that includes the best basic forex indicators, without redrawing. Based on this data, a signal for sale or purchase is formed. It does not disappear anywhere after the signal, which gives us the opportunity to see the results on the history.
It can be used on any currency pair, crypto metals, stocks
It is best used on an hourly chart, but other periods are also acceptable.
The best results for the period H1,H4,daily
If customers have any questions, I w

This scanner shows the trend values of the well known indicator SuperTrend for up to 30 instruments and 8 time frames. You can get alerts via MT4, Email and Push-Notification as soon as the direction of the trend changes.
Important Information How you can maximize the potential of the scanner, please read here: www.mql5.com/en/blogs/post/718074
You have many possibilities to use the scanner. Here are two examples: With this scanner you can trade a top-down approach easily. If two higher time

The introduction of the MIDAS Trading Tools indicator represents the culmination of my trading expertise and innovative application. By incorporating new concepts and collaborating with fellow traders like Robert Young (US), we have enriched and enhanced this indicator. In the sections below, you'll find detailed descriptions of the variables comprising this indicator. MIDAS which is an acronym for Market Interpretation/Data Analysis System is the innovative work of the late technical analyst P
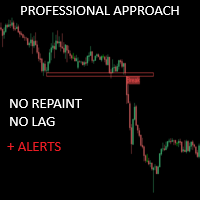
O indicador Critical Zones foi criado especialmente para os operadores manuais que procuram entradas mais exactas no mercado. Este indicador utiliza algoritmos avançados para detetar áreas de interesse, calculando o suporte e a resistência mais relevantes no gráfico, bem como os seus rompimentos e retestes. Este indicador pode ser configurado para enviar alertas e notificações quando são detectadas oportunidades de compra/venda potencialmente lucrativas, permitindo que os operadores se mantenha
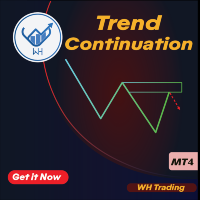
Você está cansado de perder as tendências lucrativas do mercado? Você gostaria de ter uma ferramenta confiável que pudesse identificar continuações de tendências com precisão e precisão?
Não procure mais! Nosso indicador de continuação de tendência está aqui para fortalecer sua estratégia de negociação e ajudá-lo a ficar à frente do jogo.
O Trend Continuation Indicator é uma ferramenta poderosa, criada especificamente para ajudar os traders a identificar e confirmar padrões de continuação

Contact me after payment to send you the User-Manual PDF File.
Triangle Pattern
Sometimes the price cannot make higher highs or lower lows and it moves in a converging price range and waves are shorter than before until the movement creates a geometric shape of a symmetrical triangle, which indicates It is maybe the end of the trend. The triangle pattern is a well-known in forex and the trading plan and strategy of many traders is based on it.
The Triangle Pattern Scanner Indicator It is

VR Sync Charts é uma utilidade para sincronizar o layout entre as janelas. Com ajuda de VR Sync Charts Vossos níveis de tendência, níveis horizontais, e marcação Fibonachi serão sincronizados com todos os gráficos. Esta utilidade permite sincronizar todos os objectos padrão gráficos no terminal MetaTrader, todas vossas tendências, linhas de Gunn e outros objectos serão copiados com precisão para os gráficos adjacentes. Você não precisa mais copiar manualmente suas linhas reguladas e marcações. A
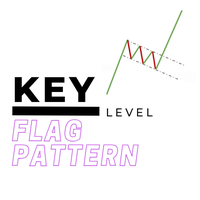
The Key level flag pattern is one of it's kind when it comes to flag patterns on the Metatrader platform. It is perfect for entering pullbacks in a trend, retests on certain structure or price action, or when you are just looking for a confirmation entry on a zone or odrerblock. It's works on all markets, whether it's forex, crypto currency, stocks or futures. In it's algorithm it incorporates an: 1. Impulsive move (leg/pole) = this is the high momentum move which creates the leg/pole of the pat
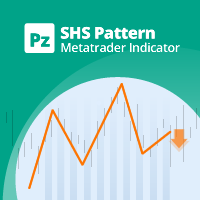
Um padrão de cabeça e ombros é uma formação de gráfico que se assemelha a uma linha de base com três picos, os dois externos têm altura próxima e o meio é o mais alto. Ele prevê uma reversão de tendência de alta para baixa e acredita-se ser um dos padrões de reversão de tendência mais confiáveis. É um dos vários padrões principais que sinaliza, com diferentes graus de precisão, que uma tendência está chegando ao fim. [ Guia de instalação | Guia de atualização | Solução de problemas | FAQ | Todo
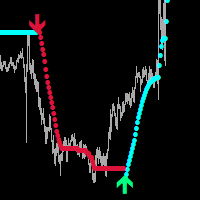
Global Parabolic MT4
Indicator for scalping on M1-M5.
A very good indicator for your trading system, it can be used as a standalone
trading system, I recommend using it together with - System Trend Pro
The indicator does not repaint and does not change its data.
Settings:
Change the FILTER parameter for accurate market entries.
Any questions? Need help?, I am always happy to help, write me in private messages or
In telegram

[ MT5 Version ] Only the next 10 units at current price! Final price: $299 How to trade using Order Blocks: Click here Discover the future of trading with Order Block Indicator , meticulously crafted for traders who demand unparalleled accuracy and customization. Whether you're scalping or swing trading, this tool is your gateway to mastering Order Blocks and Supply and Demand Zones—critical areas where price reversals often occur. Why Choose Order Block Indicator? Transform Your Trading Stra
O Indicador Market Steps foi projetado e construído baseado nas correlações de Preço/Tempo de Gann, e otimizado por regras específicas de Price Action do Mercado Forex. Ele usa o conceito de fluxo de ordens de mercado para prever as zonas de preços potenciais que terão um alto volume de ordens.
Os níveis apresentados pelo Indicador podem ser usados para negociação, e/ou também para filtro de sinais de outras estratégias ou indicadores. Todo Trader precisa desta poderosa ferramenta para ter ao

O indicador mostra um sinal no gráfico quando a segunda vela está dentro da primeira vela, ou seja, não ultrapassou os seus limites. Este padrão de vela é chamado de Barra Interna. Este padrão não é tão popular como o Pin Bar ou o Engulfing, mas é por vezes utilizado por alguns operadores. Existe a possibilidade de filtrar por tendência (2 médias móveis) e por inversão (RSI e Bandas de Bollinger). O painel multi-moeda está disponível. Com a sua ajuda, pode alternar facilmente entre gráficos.
Introducing Sterling Blaster V1.0: Specifically engineered for the unique nature of GBPUSD, delivering a remarkable around 99% success rate and an excellent way to achieve prop firm challenges. USE 5MIN TIMEFRAME Sterling Blaster Features: Optimal for GBPUSD : Tailored to deliver outstanding performance on GBPUSD. Exceptional Success Rate : Achieves a remarkable around 99% success rate based on extensive backtesting. Thoroughly Backtested : Verified through years of historical data. Risk Managem

Display your Local Time on your charts
Display your local time instead of (or along with) MT4 server time.
Display crosshair which highlights current candle time.
Automatically adjusts based on chart zoom (zooming in or out).
Displays on every timeframe (M1 – Month), and auto-adjusts as chart timeframe is changed.
Handles special ½ hour time zones , such as India.
Renders fast (no lag) as you scroll charts.
Customize the font family, font size, background color, and crossh

What Is Market Imbalance? Market Imbalance, also known as "IPA" or Improper Price Action, is when price moves so quick in one direction with no orders on the other side of the market to mitigate the price movement. We all know Big Banks, or "Smart Money", can move the market by placing huge orders which in turn can move price significantly. They can do this because Big Banks are the top 10 Forex traders in the world . But unfortunately, the Big Banks cannot leave these orders in drawdown and mus

O sistema de comércio técnico de setas de reversão do BB foi desenvolvido para prever pontos reversos para tomar decisões de varejo.
A situação atual do mercado é analisada pelo indicador e estruturada para vários critérios: a expectativa de momentos de reversão, possíveis pontos de virada, sinais de compra e venda.
O indicador não contém informações em excesso, possui uma interface visual compreensível, permitindo que os comerciantes tomem decisões razoáveis.
Todas as setas parecem fechar

Indicador cíclico para negociação e previsão da direção do mercado. Mostra o comportamento cíclico do preço sob a forma de um oscilador.
Emite sinais para a abertura de negociações quando se verifica uma recuperação dos limites superior e inferior do oscilador. Sob a forma de histograma, mostra a força suavizada da tendência.
Complementará qualquer estratégia de trading, desde o scalping ao intradiário. O indicador não é redesenhado. Adequado para utilização em todos os símbolos/instrumen

Indicador do canal de preço e gerador de breakpoint dentro dele. Dá uma ideia da posição do preço em relação ao período de uso.
Ele contém linhas de salto de tendência suavizadas construídas ao longo das bordas do canal e pontos de salto que determinam os momentos de entrada e saída.
Funciona em vários instrumentos de negociação e prazos.
Como trabalhar com o indicador
Siga a linha de quebra de canal, a linha azul é entrada para cima, a linha rosa é entrada para baixo.
Os pontos de entra
O indicador "indicador de mercado neutro Mt4" com setas mostra pontos de reversão de preços. As linhas mostram a direção da tendência ou correção. Se você olhar atentamente para o gráfico, poderá notar facilmente que a precisão das setas é bastante alta. O indicador mostra sinais bem em todos os prazos e pares de moedas. Quando este indicador foi criado em conjunto com o ChatGPT. Ao longo do trabalho de escrita deste indicador, recorremos ao chat para criar código e trabalhar algoritmos. O trab

Um indicador que exibe o padrão de castiçal envolvente. Nas configurações, você pode especificar o tipo de engolfamento (corpo, sombra e combinação). É possível filtrar por tendência (2 médias móveis) e por reversão (Bandas RSI e Bollinger). Este é um padrão de ação de preço muito popular. Um painel multi-moeda está disponível. Com ele, você pode alternar facilmente entre os gráficos.
Padrões De Negociação: Reteste por tendência. Falso breakout. Bloco De Pedidos. Restante.
EURUSD, GBPUSD, X

Currency Strength Meter is the easiest way to identify strong and weak currencies. This indicator shows the relative strength of 8 major currencies + Gold: AUD, CAD, CHF, EUR, GBP, JPY, NZD, USD, XAU. Gold symbol can be changed to other symbols like XAG, XAU etc.
By default the strength value is normalised to the range from 0 to 100 for RSI algorithm: The value above 60 means strong currency; The value below 40 means weak currency;
This indicator needs the data of all 28 major currency pair
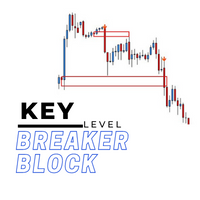
The key level breaker block indicator automatically draws breaker blocks for you on the chart. Breaker blocks are, in short, failed order blocks, but create strong support and resistance zones when price comes back to re-test them.
Advantages
The key level breaker block DOES NOT RE-PAINT, giving you confidence when a signal appears and also helps when looking back. The key level breaker block includes an on/off button on the chart to easily keep the charts clean after analysis by just o

DESCRIPTION
The Indicator Target5X Plus provides a robust framework for identifying opportune moments to enter trades, with the potential to achieve significant returns ranging from 2x to 5x. Employing sophisticated analysis, Target5X Plus meticulously delineates buy and sell zones, empowering traders to capitalize on lucrative market opportunities with precision.
TRADING with Indicator Target5X Plus
Utilizing Target5X Plus is intuitive and streamlined. The indicator signals a buy zone wh
O mercado MetaTrader é um espaço, sem precedentes, para negociar robôs e indicadores técnicos.
Leia o artigo Manual do usuário da MQL5.community para saber mais sobre os serviços exclusivos que oferecemos aos traders: cópia de sinais de negociação, aplicativos personalizados desenvolvidos por freelances, pagamentos automáticos através de sistema de pagamento e a rede em nuvem MQL5.
Você está perdendo oportunidades de negociação:
- Aplicativos de negociação gratuitos
- 8 000+ sinais para cópia
- Notícias econômicas para análise dos mercados financeiros
Registro
Login
Se você não tem uma conta, por favor registre-se
Para login e uso do site MQL5.com, você deve ativar o uso de cookies.
Ative esta opção no seu navegador, caso contrário você não poderá fazer login.