Conheça o Mercado MQL5 no YouTube, assista aos vídeos tutoriais
Como comprar um robô de negociação ou indicador?
Execute seu EA na
hospedagem virtual
hospedagem virtual
Teste indicadores/robôs de negociação antes de comprá-los
Quer ganhar dinheiro no Mercado?
Como apresentar um produto para o consumidor final?
Indicadores Técnicos para MetaTrader 4 - 29

About Waddah Multimeter (free):
This product is based on the WAExplosion Indicator. It helps identify explosive market trends and potential trading opportunities. Check out the detailed product post here for scanner and multimeter both: https://www.mql5.com/en/blogs/post/758020
Please note that scanner is paid and multimeter is free.
Features: Waddah Trend Direction Trend Strength (above/below explosion line or deadzone) Trend Explosion Alert Alignment alerts Multi-timeframe Custom currency Mu
FREE
This Dashboard is free to download but is dependent on you owning the Flag Trend Pro MT4 indicator. Down load the indicator: Flag Trend Pro
The Dashboard will show you on a single chart all the timeframes (M1 to Monthly) with their own status for the indicator: Gold Pro MT4
all time frame and all symbol: smart algorithm detects the trend, filters out market noise and gives entry signals!!!
How to understand the status: symbol - Fill All the Pair what you want. M1, M5, M15,M3
FREE

Introduction and Description
The indicator displays an arrow whenever a " Bearish Engulfing " is detected. The latter usually indicates the beginning of a downward trend. A bearish engulfing pattern is a technical chart pattern that signals lower prices to come. The pattern consists of an up candlestick followed by a large down candlestick that eclipses or "engulfs" the smaller up candle. The pattern can be important because it shows sellers have overtaken the buyers and are pushing the price mo
FREE
Highly configurable Osma indicator.
Features: Highly customizable alert functions (at levels, crosses, direction changes via email, push, sound, popup) Multi timeframe ability Color customization (at levels, crosses, direction changes) Linear interpolation and histogram mode options Works on strategy tester in multi timeframe mode (at weekend without ticks also) Adjustable Levels Parameters:
Osma Timeframe: You can set the lower/higher timeframes for Osma. Osma Bar Shift: Y ou can set th
FREE

Th3Eng Panda trend is a powerful indicator that works perfectly for scalping trades as well as swing trades. Th3Eng Panda trend is not just an indicator, but a very good trend filter. You can setup it on H4/H1 to Find the main trend and start scalping on M5/m15/m30 Time Frames. Works with all pairs and all Time Frames.
Inputs:
Section #1 History : Maximum number or bars to draw the last signals. (Default 5000) Draw Candles : Draw red candle when sell signal and green when buy signal. (true
FREE

The indicator displays the size of the spread for the current instrument on the chart. Very flexible in settings. It is possible to set the maximum value of the spread, upon exceeding which, the color of the spread label will change, and a signal will sound (if enabled in the settings). The indicator will be very convenient for people who trade on the news. You will never enter a trade with a large spread, as the indicator will notify you of this both visually and soundly. Input parameters: Aler
FREE

AIS MT4 INDICATOR 5 ALL INCLLUSIVE SET
!!!!!!!!!!!!!!!!!!!!!!!!!!!!!!!!!!!!!!!!!!!!!!!!!!!!!!!!!!!
!
! ATTENTION ! LIMITATION OF FREE OFFER PERIOD IS IMPLICIT !
!
! CONFIRMATION 2024-08-20 20:00 !
!
!!!!!!!!!!!!!!!!!!!!!!!!!!!!!!!!!!!!!!!!!!!!!!!!!!!!!!!!!!!
GUIDE
CHAPTER 1 IMPORTANT INFORMATION <1> THIS INDICATOR IS ONE OF THE SERIES OF NEW AIS INDICATORS AIS MT4 INDICATOR 1 =ADVANCED CLASSIC= AIS MT4 INDICATOR 2 =MULTIFRAMES= AIS MT4 INDICATOR 3 =LINES= AIS M
FREE

Highly configurable Balance of Power (BOP) indicator.
Features: Highly customizable alert functions (at levels, crosses, direction changes via email, push, sound, popup) Multi timeframe ability Color customization (at levels, crosses, direction changes) Linear interpolation and histogram mode options Works on strategy tester in multi timeframe mode (at weekend without ticks also) Adjustable Levels Parameters:
BOP Timeframe: You can set the lower/higher timeframes for Balance of Power . BOP
FREE

Graphic Shapes -using history, it projects four types of graphical shapes at the moment, allowing you to determine the main ranges of price movement in the future, as well as gives an understanding of the main market reversals, while giving entry points by priority!The panel contains three types of figure sizes expressed by timeframes. They allow you to conduct a complete market analysis without using additional tools! The indicator is a powerful tool for forecasting price movements in the forex
FREE

Smart Trend Line Alert, Linha Profissional de Alerta para Linha de Tendência, Suporte e Resistência
Características: Modos Auto e Clique para converter qualquer linha traçada em linha de alerta (linha de Tendência ou linha Horizontal); Separando linhas de diferentes timeframes, escondendo as linhas traçadas nos timeframes menores em relação aos timeframes maiores para evitar que muitas linhas no gráfico causem confusão a partir de diferentes intervalos de tempo; Interruptor automático de timefr
FREE
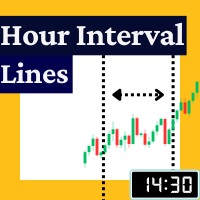
The Rayol Code Hour Interval Lines indicator was designed to assist your trading experience. It draws the range of hours chosen by the user directly on the chart, so that it enables traders to visualize price movements during their preferred trading hours, providing traders a more comprehensive view of price movements and market dynamics. This indicator allows the user to choose not only the Broker's time, but also the Local time. This way, the user no longer needs to calculate local time in re
FREE
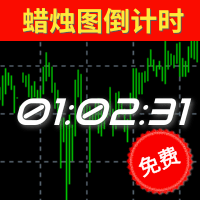
倒计时指标功能介绍 类别
解释
备注
预计结束倒计时 计算当前周期蜡烛图的结束时间(可应用于所有周期),其考虑了蜡烛图可能会因为日常休市而提前结束的情况; 如果该蜡烛图包含多个休市和开市的情况下,以最后的休市或者蜡烛图收盘时间为准。 值得特别注意的是:本指标并没有将平台额外公布的节假日休市、修改休市或者开市时间等因素纳入考虑范围,它仅仅是基于MT4所公开的交易时间做计算,无法100%确保本品种的收盘或者开盘时间无误 ,故使用者需提前明确该品种交易时间情况。
预计开盘倒计时 仅限于状态为"休市中"的提示,根据MT4上公开显示开市时间进行预估大约还有多久时间开盘; 和预计结束倒计时类似,并没有将额外公布的时间纳入考量。由于W1和MN1周期中包含多次的开盘和收盘,所以该两周期无休市提示。
【状态】 颜色 状态 备注 绿色 正常 一切正常 黄色 服务器无报价 服务器实际上传送到MT4并非是毫无中断的,可能是1分钟之内出现多次,甚至是连续较长的时间无报价,取决于您所处的网络延迟、服务器的情况等等。
本品种已有X秒无报价 MT4上并不是所有的品种的报价都是最新的,有可能某个品种长期无
FREE

FusionAlert StochRSI Master is an indicator available for MT4/MT5 platforms, it is a combination of RSI & Stochastic indicator which provide "alerts" when the market is inside "overbought and oversold" regions combined for both indicators, results in more precise and accurate signals to be used as a wonderful tool, in the form of "buy or sell" signals. This indicator comes with many customization options mentioned in the parameter section below, user can customise these parameters as needful. Jo
FREE

RiskMaster Pro Lotsize Protector
O indicador oferece a forma mais simples de gerenciar o risco. Sem configurações complicadas, fornece exatamente as informações necessárias para a execução da ordem. Nenhuma configuração complicada, selecione o tipo de ordem desejada Market/Pending Orders, insira o risco desejado em porcentagem do capital disponível e a relação risco-recompensa (Risk-Reward-Ratio RRR). Market Orders: • Arraste a linha de Stop Loss (SL) com o mouse para a posição desejada. • O
FREE

The Channel Builder (CB) or Ivanov Bands indicator is a broad generalization of the Bollinger Bands indicator. First, in CB, the mean line <X> is calculated using various averaging algorithms. Secondly, the mean deviations calculated by Kolmogorov averaging are plotted on both sides of the middle line <X>. The middle line <X>, besides the standard SMA, EMA, SMMA and LWMA averaging algorithms, can be Median = (Max + Min) / 2 sliding median (which is the default). In
FREE

This is the author's trading system.
Designed for intraday trading. Signals are not rewritten. Suitable for any instrument and timeframe. You can enable alerts. Easy to use. See screenshots. Simple settings! Everything has already been done for you! The basis is the analysis of the current trend. The indicator is looking for a way out of accumulation. If you have been looking for a good trading system for a long time, then it is in front of you! Subscribe to my telegram channel, where we discus
FREE
XAU Scalper MT4 Versão MT5 Uma ferramenta analítica para observar movimentos de preços de curto prazo em pares de ouro. O Indicador XAU Scalper fornece sinais de compra e venda baseados na estabilidade da vela, RSI e momento de curto prazo. Ele é projetado para ajudar os traders a identificar potenciais pontos de entrada durante breves movimentos de mercado em pares XAU. Recursos Índice de Estabilidade da Vela ( Candle Stability Index ): Mede a proporção entre o corpo da vela e os pavios para av
FREE

The indicator is specially designed for the trading utility Trade Shell (included Trade Shell SMC ) to get it working on visual strategy tester.
Backtest your trading ideas and indicators. Run Trade Shell on visual tester and then put this indicator on the chart. After that you will be able to control all functions of the Trade Shell as well as with live using! It does not work live! Use it with visual tester only. It does not require to set any setting on input parameters.
Have a good luck
FREE

The Red Dragons Support and Resistance Levels indicator automatically determines support and resistance levels using the proprietary algorithm based on historical and current data, so the levels are dynamic, which allows you to adjust trading targets based on the current price movement. For this reason, we use this indicator in our advisors, for example, Red Dragons, which you can purchase here:
https://www.mql5.com/en/market/product/128713?source=Site +Market+MT4+New+Rating006
The panel also
FREE
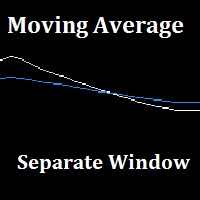
"Separate Moving Average" is a custom indicator made from the combination of 2 moving averages in a different window (the indicator window) for the goal of removing the clutter from the price chart, the indicator also has arrows to show the moving average cross either long or short. All the moving average parameters are customizable from the indicator input window.
FREE
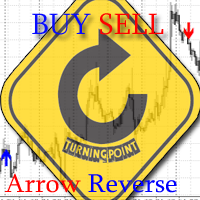
The indicator shows the market reversals as arrows. The reversal signals are based on observation of the market behavior. It is based on the principles of searching for extremums, volumes and Price Action. The indicator provides signals on the following principles: Search for the end of the ascending/descending trend Search for the reversal pattern based on Price Action Confirmation of the reversal by the contract volume. The indicator also features an alert triggered when the arrow appears. The

Highly configurable Fisher Transform indicator.
Features: Highly customizable alert functions (at levels, crosses, direction changes via email, push, sound, popup) Multi timeframe ability Color customization (at levels, crosses, direction changes) Linear interpolation and histogram mode options Works on strategy tester in multi timeframe mode (at weekend without ticks also) Adjustable Levels Parameters:
Fisher Transform Timeframe: You can set the lower/higher timeframes for Stochastic. Fisher
FREE

4H Open Line Indicator - Settings Overview This custom indicator is used to draw and visualize the opening price , midline , and high/low ranges of 4-hour candles on smaller timeframes. It's particularly useful for intraday traders who want to see higher-timeframe levels. Indicator Inputs and Descriptions Parameter Value Description OpenLineColor White Color of the line indicating the open price of the 4H candle. OpenLineWidth 1 Width of the open price line. OpenLineStyle Solid Line style
FREE

This semaphore indicator is based in the standard RSI, which is applied over the Envelopes indicator that shows an envelope or envelope fluctuation borders. This is a version of RSI vs Envelopes drawn in the symbol window . A sell signal emerges when the upper envelope/border is broken by the RSI indicator from top to bottom. A buy signal emerges when the lower envelope/border is broken by the RSI indicator from bottom upwards. The indicator can draw arrows on the indicator, draw vertical lines
FREE

Smart Fibo Zones are powerful, auto-generated Fibonacci Retracements that are anchored to key market structure shifts . These zones serve as critical Supply and Demand levels, guiding you to identify potential price reactions and confirm market direction. Fibonacci calculations, widely used by professional traders, can be complex when it comes to identifying highs and lows. However, Smart Fibo Zones simplify this process by automatically highlighting order blocks and key zones, complete with St

Features: Find these engulfing patterns: Simple Engulf Stick Sandwich Engulf Three Line Strike Rising Three Morning Star Doji Scanner is useful to make your strategy better. Don't always go by Win/Loss percentage. Because this tool is not based on past results. Basic Settings: For All Patterns You can set: First:Last Candle Ratio This will make sure that the earlier opposite candle is at least this given ratio in height as compared to the engulfing candle. This is not checked for Three Line Stri
FREE

Unleash Your Trading Potential with the Apex Trend Detector! Are you tired of missing out on profitable trades? Do you struggle to find reliable entry and exit points in the volatile forex market? It's time to upgrade your trading arsenal with the Apex Trend Detector – the intelligent MT4 indicator designed to cut through market noise and pinpoint high-probability trading opportunities! The Apex Trend Detector isn't just another indicator; it's a sophisticated signal system that expertly fuses t
FREE

IntradayMagic прогнозирует характер ATR и тиковых объёмов на 1 сутки вперёд. Индикатор не перерисовывается и не отстаёт. Используя Intraday Magic вы можете значительно повысить качество торговли и избежать излишних рисков. По его показаниям можно детектировать кризисные состояния рынка и моменты разворота тренда, уточнять моменты и направления входов. Это бесплатная ознакомительная версия ограничена символами (парами) включающими GBP. Никаких иных ограничений нет. Для других пар вы можете исполь
FREE

This indicator does not process the price chart data and does not provide trading signals. Instead, it is an application to compute and display the frequency response of many conventional indicators. Moving averages like the SMA, LWMA and EMA, and oscillators like the MACD, CCI, Awsome Osc, all have the form of digital filters. Electronic engineers use a special method to characterise the performance of these filters by studying their frequency response. Two important quantities of the freque
FREE
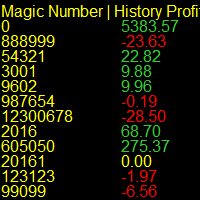
Running multiple EA's on your account and confused by who's winning and who's loosing? Try this indicator that report's in real time on the Magic Numbers in your account by reading the History_trades along with the Open_trades. Note: Manual trades are grouped under Magic Number "0". For a better visual report, run it on a symbol that you don't execute trades on, switch the history bars to "Line Charts" and set it's color to Black.
FREE

FIBO ALERT https://www.mql5.com/en/market/product/34921
This indicator draws a fibonacci retracement (high and low) of a candle. It alerts and notifies the user whenever price touches or crosses the fibonacci levels. INPUTS ON Alert: set to true will alert pop up whenever price crosses levels at chart time frame. ON Push: set to true will send push notification to phone whenever price crosses levels at chart time frame. ===== FIBO (High & Low) ===== Time Frame: indicator draws fibonacci leve
FREE

This indicator is designed for scalping in the Forex market and trading binary options. A signal appears at the opening of a new candle. Usage Recommendations: For Binary Options: It is recommended to open trades when a signal appears on the first candle. A buy signal appears when the blue X replaces the red one, while a sell signal occurs when the red X replaces the blue one, as shown in the screenshots. For the Forex Market: Enter a trade when a signal appears as described above. It is advisa
FREE

!!! Em [CodeBase] publiquei o código do indicador Mql4. Baixe o código gratuitamente !!! (Você deve adaptar o código ao atualizar o terminal).
Este indicador é uma ferramenta do trader. Mostra o movimento da estocástica em todos os períodos e símbolos: М1, М5, М15, М30, Н1, Н4 a cada minuto (a escala de tempo do atual até -240 minutos, ou seja, as últimas 4 horas).
Step_Stoch supera a desvantagem dos indicadores estocásticos - lagging. Por exemplo, um aumento após uma queda em H1 (ou M30) depo
FREE

Информационная панель, которая выставляет уровни покупки продажи и цели для профита на текущий день. Уровни рисуются согласно движению валюты за вчерашний день. Панель вмещает в себя информацию о валютной паре, тенденции на рынке, время до закрытия бара, управление капиталом, рекомендуемый лот, профит в пунктах, а также уровни для покупки и продажи инструмента. Для заключения сделок использовать только отложенные ордера на пробой. Входные параметры Lots - установить текущий лот Risk - риск в про
FREE

The Magic SMMA indicator is of great help in determining trend direction. It can be an excellent addition to your existing strategy or the basis of a new one. We humans can make better decisions when we see better visually. So we designed it to show a different color for rising and falling trends. Everyone can customize this in the way that suits them best. By setting the Trend Period, we can optimize it for longer or shorter trends for our strategy. It is great for all time frames.
IF YOU NEE
FREE

Hello. Another free indicator from Sepehr! ;) You can determine the trend with this tool. Using crosses of two Moving averages, you can say that the trend is going to be bullish or bearish; A fast-moving average and a slow one. When the fast-moving crosses up the slow-moving, it's going to be an uptrend and when it crosses down the slow-moving, it means that you are going to have a downtrend. That's easy ;) Hope to enjoy it Sepehr(Faran)
FREE

Este indicador irá ajudá-lo a traçar as linhas do horizonte ( Marcelo Ferreira ) do Grafico semanal. Você poderá mudar trabalhar por exemplo em M5 ou M15. As linhas semanais permanecerão lá. Analisar as tendências em gráficos semanais antes de fazer uma entrada no mercado Forex é essencial para identificar a direção predominante do mercado a longo prazo. Esse tipo de análise ajuda a evitar decisões impulsivas baseadas em flutuações de curto prazo e fornece uma visão mais clara sobre o movimento
FREE

SRP (Strong Retracement/Reversal Points) is a powerful and unique support and resistance indicator. It displays the closest important levels which we expect the price retracement/reversal! If all level are broken from one side, it recalculates and draws new support and resistance levels, so the levels might be valid for several days depending on the market!
Key Features You can use it in all time-frames smaller than daily! Displays closest significant support and resistance levels Update the le
FREE

Having to check constantly if your Stochastic has reached a specific level can be tedious and draining at times, especially if you have to monitor different asset classes at a time. The Alert Stochastics indicator will assist in this task, ensuring that you get the most with little effort. When the Stochastic values get to a specified level, the alerts will go off, on the chart, on the MT4 phone app or via email (You can receive text messages to your phone if you activate texts on your Gmail acc
FREE

ATR Moving Average draws a moving average of the standard Average True Range( ATR ) in the same window.
Settings Name Description ATR period
Set Price per iod for ATR calculation
ATR level Set ATR value for thresholding( only whole number, ignore leading zeros e.g. 0.00089 = 89 ) MA Period Set moving Average Period MA Method Set moving average method( Simple, Exponential, Smoothed and Linear Weighted ) MA Shift
Set moving average shift
Enable Alerts ? Generate Alert when ATR Crosses
FREE

Introducing the Super Pivot and Fibo Indicator: Your Ultimate Trading Companion Are you ready to take your trading to the next level? The Super Pivot and Fibo Indicator is here to revolutionize your trading strategy. This powerful tool combines key elements such as pivot points, Fibonacci retracement and extension levels, high-low values, and Camarilla points to provide you with a comprehensive and accurate analysis of the market. Key Features: Pivot Points: Our indicator calculates daily, weekl
FREE
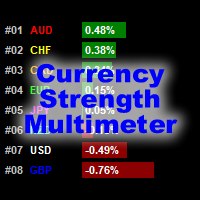
O indicador Multímetro de intensidade da moeda mostra a força, a direção e a classificação de cada uma das seguintes moedas: AUD CAD CHF EUR GBP JPY NZD USD Além disso, também mostra a força, a direção e a classificação de cada um dos seguintes pares de moedas: AUDCAD AUDCHF AUDJPY AUDNZD AUDUSD CADCHF CADJPY CHFJPY EURAUD EURCAD EURCHF EURGBP EURJPY EURNZD EURUSD GBPAUD GBPCAD GBPCHF GBPJPY GBPNZD GBPUSD NZDCAD NZDCHF NZDJPY NZDUSD USDCAD USDCHF USDJPY O indicador funciona em qualquer gráfico
FREE

The LexusBO indicator is recommended for trading binary options . Signals are generated when the RSI, ADX, CCI indicators cross the customizable levels. The indicator displays signals using "up/down" arrows on the chart. Their values are available in the buffer arrays (buffer with index 0 - "up" arrow, with index 1 - "down" arrow). This makes the indicator easy to use for automated trading through specialized Expert Advisors. The recommended timeframe is M5. The indicator has a built-in counter
FREE

Análise de trading precisa na ponta dos dedos: software de análise de trading de última geração O software de análise de trading convencional disponível no mercado geralmente fornece apenas estatísticas de índice de lucro e perda por hora ou semana, o que não atende à necessidade de uma análise de trading mais precisa. No entanto, no mercado de trading real, cada dia apresenta circunstâncias únicas. As segundas-feiras são tranquilas, as quartas-feiras são ativas com juros noturnos triplos e as
FREE

Having trouble marking where the various forex sessions start and end? Or perhaps your strategy requires you trade only in a specific session, then this is for you.
The session indicator shades the session you require in a certain color so that you can identify it easily. The sessions shown include: London session, New York session, Asian Session, Asian - London overlap and London - New York Overlap.
Difference source give varying time ranges for the various session, mostly differing by not mo
FREE

TMA Classic – Visão geral do indicador Média Móvel Triangular O TMA Classic é um indicador muito simples e leve que exibe a Média Móvel Triangular (TMA) como uma única linha suave. Ele remove efetivamente o ruído excessivo e captura o movimento central do preço, sendo útil para identificar tendências e condições de mercado lateralizado. Por exibir apenas uma linha, oferece alta visibilidade no gráfico sem interferir com outros indicadores ou dados de velas. Principais Características Exibe a Méd
FREE

Nermal Round Levels is an indicator of round numbers in the form of a grid drawing horizontal lines. You can use it in many ways ... as it could be activating for an expert advisor to enter the market, confirmation of entry for your strategy, entrance area, mark areas of important levels, possible rebounds and others. Place it in your chart and verify as the price respects those round levels.
Inputs GridSpace linecolor lineStyle
FREE

Whether you are a scalper or daily trader, you will always look for bullish / bearish engulfing candles. This can be a bit tricky and stressful when you try to visually identify the engulfing candles on the chart. Not only that, you might be trading on the M15 time frame but the engulfing candle is forming or has already formed in the H4 time frame. This indicator is made to do that on your behalf. You can trade on any time frame and see Engulfing candles of another time frame, this means that y
FREE

Indicator ini berdasarkan Gain ADX - Follow Trend - Disertai Pivot, Support & Resistant Daily
Dengan indicator ini semoga menjadikan indicator yang porofit able, selama mengikuti signal yang tampil, apabila berwarna Hijau siap2 untuk Buy, dan berwarna Merah siap2 untuk Sell.
Akan tampil signal Sell/Buy di saat gain mencukupi, baik TF Kecil maupun TF Besar TF Besar / High TF adalah Trend Kuat TF Kecil / Low TF adalah Trend Lemah
Open Posisi pada High TF, signal akan menunjukkan Sell/Buy.
FREE

AdvaneZigZag Indicator
Are you tired of the limitations of the traditional ZigZag indicator? Meet AdvaneZigZag, the ultimate tool to simplify your market structure analysis and enhance your trading strategies. Designed with flexibility and precision in mind, AdvaneZigZag brings you advanced features to navigate the market with confidence.
Key Features:
1. Enhanced Flexibility:
- While maintaining the familiar simplicity of the conventional ZigZag indicator, AdvaneZigZag offers superior a
FREE
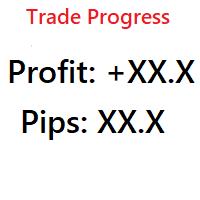
Simple indicator that shows your history in pips and profit. You can use it to follow your progress on the positions. It shows you the trade progress only for the symbol that the indicator is on and only for your trade history. Label text is updated when order is closed. The text can be displayed on each corner, it is in the parameters.
Basic input parameters: Label color Font size Conrner position Anchor position Note: corner and anchor have to be the same position.
FREE

This indicator helps you to find overbought and oversold prices based on William %R. Input Description: Wperiod: Period for %R indicator. OverBoughtLevel: Define the overbought level for %R. Must in between 0 and -50. OverSoldLevel: Define the oversold level for %R. Must in between -50 and -100. middle_value: When true, indicator also draw the middle points between upper and lower line. shift: Set an additional offset to the indicator.
Several Notes: Set 0 and -100 as Overbought and Oversold lev
FREE

The All Averages Scanner Dashboard is an MT4 Indicator designed to show the current state of different kinds of Moving averages. Read the blog post for detailed explanation with screenshots: https://www.mql5.com/en/blogs/post/762972
It is great if you are testing out different kinds of moving averages with respect to price and other averages. Also if your strategy is based on MA Stacking one on top of another, you can use this for validation. You can also create Custom baskets as shown below f
FREE

Limited time offer! For the launch of NextBot Scalper EA , the price of this indicator will drop to FREE !
Introducing a pragmatic and innovative tool for MetaTrader 4 (MT4) traders: the Linear Regression Next channel indicator, enhanced with the determination coefficient R 2 . This indicator serves as a foundational tool for traders seeking to understand market trends through the lens of statistical analysis, specifically linear regression.
The essence of this indicator lies in its ability t
FREE
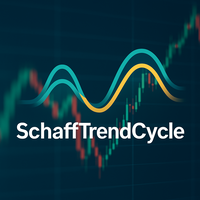
O que é o Schaff Trend Cycle? O Schaff Trend Cycle (STC) é um indicador do tipo oscilador desenvolvido para detectar reversões de tendência de forma rápida e eficaz. Ao contrário de indicadores tradicionais como médias móveis ou MACD, o STC combina ciclos de mercado com momento (momentum), facilitando a identificação clara do início e fim de uma tendência. Principais características Sinais claros de reversão: a linha do ciclo sobe durante tendências de alta e desce durante tendências de baixa. R
FREE

Título do produto Smart Bulls (MT4) – parte da série SmartView Descrição breve Indicador Bulls com experiência de usuário única na plataforma MetaTrader. Oferece capacidades avançadas não disponíveis anteriormente, como abrir configurações com duplo clique, ocultar e mostrar indicadores sem excluí-los, e exibir a janela do indicador em tamanho completo do gráfico. Projetado para funcionar perfeitamente com o restante da série SmartView Indicators. Visão geral A série SmartView oferece uma experi
FREE

Visão Geral O indicador True Strength Index (TSI) é um oscilador de momento exibido em uma janela separada no MT4. Ele suaviza o momento (MTM) e seu valor absoluto por meio de duas Médias Móveis Exponenciais (EMAs) sucessivas e, em seguida, calcula sua razão multiplicada por 100. O TSI ajuda a visualizar a força da tendência e possíveis pontos de reversão do mercado. Principais Recursos Suavização dupla com EMA para reduzir ruído e obter uma linha limpa Sobreposição de EMA de sinal para auxiliar
FREE
Stop Guessing, Start Confirming: Introducing Signal Sentinel Are you tired of signals that leave you hanging? The Signal Sentinel indicator is your ultimate weapon against market uncertainty, designed to deliver high-probability trading setups directly to your chart. We've combined the power of two MACDs with a long-term EMA filter to ensure you only trade in the strongest, most confirmed trends. This isn't just another indicator; it's a complete confirmation system that acts as your guard agai
FREE

Macd Predictor Macd's main chart indicator If you like this indicator , Dinapoli Levels Expansion and Retracement Demo is a helpful tool: https://www.mql5.com/en/market/product/35884
1. You can determine the price at which the MACD will change from buy to sell, and vice versa. It is the cousin of the oscillator predictor. If you know a position at the time, then the exact price, current and next (future) columns will need to reach the MACD crossover. You can also see how far the market has to
FREE
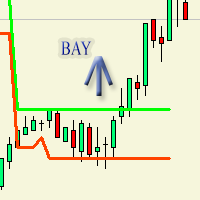
Индикатор изначально предназначался для торгового робота который в дальнейшем опубликуется. Рисует на графике флет. То-есть покой тренда. Очень отчетливо выражает флет по параметрам по умолчанию. flateWigth - допустимая ширина или разница между барами по которому индикатор будет засчитывать флет. Индикатор работает в реальном времени. Для наглядного просмотра работы можно запустить в тестере.
FREE

This indicator displays potential price levels, support and resistance levels, highest and lowest price levels for Asian, European and American sessions. It works for the day that you select from user interface. It is suitable for gold, bitcoin, all currencies, commodities, crypto currencies and all investment instruments on the metatrader. You can use on the your day trade transactions easily. This indicator is for metatrader4 platform.
FREE
As we know, МТ4 and МТ5 do not store tick history, which may be necessary to develop trading strategies and market analysis. I have developed a method allowing you to receive tick history very easily. The indicator gathers tick history in real time and writes it to XXXXXX2.hst file, where XXXXXX is a symbol name. This file can be used to create an offline chart or something else. If you use a trading robot, then launch the indicator and control your broker by examining the spread and quotes. All
FREE
Search for an entry with low risk for trading by Lisek Moving Average Indicator. There are many ways to trade with Lisek Moving Average Indicator: Trend continuation (Trend trading). Trade pullbacks (Range trading). Trade breakouts. Trade reversals. Take profits or set stop-loss based on your MA.
Moving Averages are a frequently used technical indicator in forex trading, especially over 10, 50, 100, and 200 periods. Moving Averages are lagging indicators, which means they don't predict where p
FREE
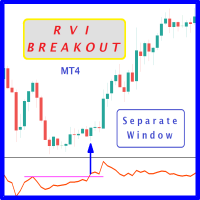
Probability emerges to record higher prices when RVi breaks out oscillator historical resistance level. It's strongly encouraged to confirm price breakout with oscillator breakout since they have comparable effects to price breaking support and resistance levels; surely, short trades will have the same perception. As advantage, a lot of times oscillator breakout precedes price breakout as early alert to upcoming event as illustrated by 6th screenshot. Furthermore, divergence is confirmed in case
FREE

The indicator measures volumes on different charts and instruments. Its main advantage is the ability to compare separate brokers. The less Middle Volume and Tick / Second , the more reliable is the broker. There is a comment in the upper left corner Comment data: Tick/Second — number of ticks per second for a selected instrument Middle Volume — average volumes in the penultimate bar This indicator allows tracking a relative market activity for different timeframes. If the volumes are lower than
FREE

What is Macro Kill Boxer? Macro Kill Boxer is a technical analysis indicator developed for the MetaTrader platform. It visualizes market movements during specific time intervals (e.g., Asia, London Open/Close, New York AM/PM) by drawing colored boxes on the chart. Each box represents the high and low price levels within the defined time period, often associated with macroeconomic events or high-volatility sessions. What Does It Do? Time-Based Analysis : Displays price movements as boxes for 58 c
FREE
The ATR Strategy Multiplier is designed to help traders assess market volatility using the Average True Range (ATR) across multiple timeframes. It calculates and displays ATR values along with recommended Stop Loss (SL) and Take Profit (TP) levels based on the ATR. These levels are essential for setting risk management parameters and optimizing trading strategies.
Parameters: Indicator Parameters : ATR Period : Determines the period over which the ATR is calculated. Timeframe : Select the time
FREE

...................................................................................................................... ............rsi................ ...........................................rsi for times M30 and D1............................................. ...............................almost every one uses rsi at 1 time frame but.............................. ..................................when we have 2times rsi what can see .....
FREE

This indicator shows in a subwindow the trend in M1, M5, H1, D1 timeframes based on MA, MACD, Stochastic This way you could see in once in different timeframes what happening. This is my first free indicator. Please follow I will put here some more. Thank you for you attention. . . . . .
lfknglkslksnlgslgnsflgjrpoesv ,msv lkrjpfjésmdg sd.npo4wsmdglknsp4jwpkeégmfs.lkmp Thank you
FREE

O indicador com alertas do Setup de Larry Williams que conseguiu fazer U$ 10.000 virar U$ 1.100,00 em um campeonato de Trade em 1987 e comprovou fazendo a filha, que é atriz, fazer o mesmo estrago no mercado! A média de 9 para cima é compra, para baixo é venda, simples assim! Com alertas de sons e visual de compra, venda e flat, você se mantendo posicionado até a o alerta inverso a sua posição. Aconselhável usar de H1 para cima.
FREE
Saiba como comprar um robô de negociação na AppStore do MetaTrader, a loja de aplicativos para a plataforma MetaTrader.
O Sistema de Pagamento MQL5.community permite transações através WebMoney, PayPay, ePayments e sistemas de pagamento populares. Nós recomendamos que você teste o robô de negociação antes de comprá-lo para uma melhor experiência como cliente.
Você está perdendo oportunidades de negociação:
- Aplicativos de negociação gratuitos
- 8 000+ sinais para cópia
- Notícias econômicas para análise dos mercados financeiros
Registro
Login
Se você não tem uma conta, por favor registre-se
Para login e uso do site MQL5.com, você deve ativar o uso de cookies.
Ative esta opção no seu navegador, caso contrário você não poderá fazer login.