YouTubeにあるマーケットチュートリアルビデオをご覧ください
ロボットや指標を購入する
仮想ホスティングで
EAを実行
EAを実行
ロボットや指標を購入前にテストする
マーケットで収入を得る
販売のためにプロダクトをプレゼンテーションする方法
MetaTrader 4のためのテクニカル指標 - 15

Future Trend Channel は、トレンドの方向性を識別し、価格変動の可能性を予測するために設計されたダイナミックで視覚的に直感的なインジケーターです。もともとChartPrimeによってTradingView用に開発されたこのツールは、MetaTrader 4用に適応されており、トレーダーに同等の機能を提供します。スウィングトレーダー、デイトレーダー、長期投資家のいずれであっても、Future Trend Channelはトレンドの強さを可視化し、反転を予測し、エントリー/エグジットポイントを最適化するのに役立ちます。 主な特徴: マルチタイムフレーム対応 - 外国為替、株式、商品、暗号通貨を含む全ての時間軸と金融商品で動作 スマートトレンド検出 - SMA、ATR、HL2(高値-安値の平均)を組み合わせて強気・弱気のトレンドチャネルを動的にプロット 未来価格予測 - 現在のトレンド勾配に基づいて潜在的な将来価格レベルを投影し、取引計画を支援 明確な視覚的シグナル - 強気・弱気シグナルがトレンド確認を示し、色分けされたチャネルが市場状況に適応 カスタマイズ可能なパラメー

Introduction Harmonic Patterns are best used to predict potential turning point. Traditionally, Harmonic Pattern was identified manually connecting peaks and troughs points in the chart. Manual harmonic pattern detection is painfully tedious and not suitable for everyone. You are often exposed under subjective pattern identification with manual pattern detection. To avoid these limitations, Harmonic Pattern Plus was designed to automate your harmonic pattern detection process. The functionality

Powerful non-repainting tool for intraday or swing tading, part of the Power Lines Trading System, used in real trading on a daily basis with proven solid trading signals. The Power Lines indicator is pretty straightforward and easy to set up and can be used perfectly on every timeframe and with every currency pair or other financial instrument. For intraday trading the using of M5, M15 or M30 timeframes and for swing trading H1, H4 or D are recommended. Avoid M1 and be careful with M5 timeframe
FREE

CS ATR FIBO CHANNELS MULTI TIMEFRAME
Additional tool to trade with Cycle Sniper Indicator.
Cycle Sniper : https://www.mql5.com/en/market/product/51950 Indicator Draws Channels based on: - Cycle Sniper Price and Moving Averages - ATR Deviations - Fibonacci Retracement and Extensions
Features: - Multi TimeFrame - Full alert and Notification options. - Simple Settings - Finds the trend change or extreme reversals.
Inputs: - Arrow Mode: ATR Levels or Median Line If Median Line is selected ind

The ACB Trade Filter indicator provides a solution for filtering out the low probability trading setups in a trading strategy. The indicator uses a sophisticated filtration algorithm based on the market sentiment and trend.
Applications Works great with our indicator " ACB Breakout Arrows ". Filter out low probability signals from any indicator. Avoid overtrading and minimize the losses. Trade in the direction of market sentiment and trend. Avoid the choppiness in the market.
How to use Only L
- Real price is 80$ - 60% Discount (It is 30$ now) - It is enabled for 1 purchase. Contact me for extra bonus tool, instruction or any questions! - Non-repaint, No lag - I just sell my products in Elif Kaya Profile, any other websites are stolen old versions, So no any new updates or support. - Lifetime update free
Introduction Smart Money Concepts (SMC) strategy was initially popularized the Inner Circle Trading (ICT) method which is claimed to be the evolved version of the SMC. Essenti

See RSI values turned into colored candles
This indicator provides both colored candles and a colored moving average. 6 drawaing styles are provided to allow customization of the color coding.
Applying coding to the chart may help in conceptualizing price trend and impulse movements defined through RSI values.
Features - optional colored candles - optional colored ma - 6 draw styles; RSI slope RSI above/below overbought/oversold levels RSI above/below level 50 RSI above/below it's moving average
FREE

Smart Fibo Zones are powerful, auto-generated Fibonacci Retracements that are anchored to key market structure shifts . These zones serve as critical Supply and Demand levels, guiding you to identify potential price reactions and confirm market direction. Fibonacci calculations, widely used by professional traders, can be complex when it comes to identifying highs and lows. However, Smart Fibo Zones simplify this process by automatically highlighting order blocks and key zones, complete with St
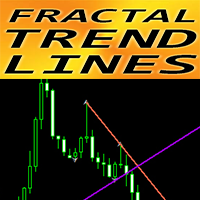
Crypto_Forex インジケーター「フラクタルトレンドライン」MT4用。
- このインジケーターは、ブレイクアウトを伴うグラフィカル分析を使用するトレーダーに最適です!!! - 「フラクタルトレンドライン」は、グラフィカルな上昇トレンド (紫色) と下降トレンド (赤色) のラインを表示します。 - 上昇トレンドと下降トレンドのラインは、2つの最も近い対応するフラクタルに基づいて構築されます。 - インジケーターには、トレンドラインの色と幅を決定するパラメーターがほとんどありません。 - インジケーターには、ブレイクアウトのモバイルおよびPCアラートが組み込まれています。
高品質のトレーディングロボットとインジケーターをご覧になるにはここをクリックしてください! これは、このMQL5 Webサイトでのみ提供されるオリジナル製品です。
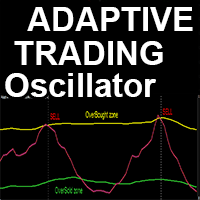
高度なカスタムCrypto_Forexインジケーター「アダプティブ・トレーディング・オシレーター」 - MT4用の効率的な補助取引ツール!
- このインジケーターは新世代のオシレーターです。使い方は画像をご覧ください。 - 「アダプティブ・トレーディング・オシレーター」には、調整可能な売られ過ぎ/買われ過ぎゾーンがあります。 - このオシレーターは、動的な売られ過ぎ/買われ過ぎエリアからの決済時に、正確なエントリーポイントを見つけるための補助ツールです。 - 売られ過ぎゾーン:グリーンラインより下。 - 買われ過ぎゾーン:イエローラインより上。 - このインジケーターは、プライスアクションパターンやトレンド戦略と組み合わせるのに最適です。 - 標準的なオシレーターよりもはるかに正確です。 - インジケーターは任意の時間枠で使用できます。 - PCとモバイルの両方にアラート機能を搭載しています。
高品質のトレーディングロボットとインジケーターをご覧になるにはここをクリックしてください! これは、このMQL5ウェブサイトでのみ提供されるオリジナル製品です。

40% off. Original price: $50
Moving Average Trend Scanner is a multi symbol multi timeframe triple MA crossover dashboard that helps traders to monitor, and identify potential market trends from one chart. This panel scans 3 moving averages in up to 28 configurable instruments and 9 timeframes for triple moving average alignment and moving average crossover with a deep scan feature to scan all market watch symbols (up to 1000 instruments!).
Download Demo here (Scans only M1 and M5) Settings

Trend Lines Cross This indicator will alert you on any cross of a Trendline. You can draw up to two trend lines and form a channel, a pennant , a triangle or a simple trend and when the price crosses either trend line the indicator will provide you with alerts that you define plus an up or down arrow when the cross happened. How to: Draw the 1st trendline and name it tl1. Draw the 2nd trendline and name it tl2. Select which type of alerts you would like in the indicator properties and you a
FREE

このインジケーターは、トレードチャート上でドンチャンチャネルを視覚的に表現するためのものです。ドンチャンチャネルは、特定の期間における最高値と最低値の間の範囲を描画するためのシンプルなテクニカルツールです。このインジケーターは、価格動向の視覚的な分析を向上させ、潜在的なブレイクアウトとトレンドの継続ポイントに関する洞察を提供します。ドンチャンチャネルは、現在の時間枠とより高い時間枠の両方に適用できるため、このオプションを有効にすることができます。 インジケーターの主な特徴: Use_System_Visuals: このパラメータを有効にすると、システムの視覚スタイルとインジケーターの外観を切り替えることができます。有効にすると、インジケーターの視覚的要素はトレードプラットフォーム全体のテーマに合わせられます。 Signal_from_HT_Timeframe: このオプションを有効にすると、より高い時間枠からのシグナルを受信できます。言い換えれば、現在の時間枠でのトレーディングの決定に影響を与えるために、より長い時間枠でのドンチャンチャネルの動作を考慮できます。 HT_Timefram
FREE
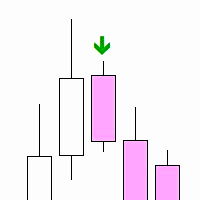
"Inside Bar PA" is a technical indicator designed to determine the inner bars on the chart. An internal bar is a bar or candle, the maximum and minimum of which are completely contained in the previous bar. This may signal a potential reversal or continuation of the trend, depending on the context.
Features: Automatic detection of internal bars. Visual marking of internal bars with arrows on the chart. The ability to adjust the distance of the mark from the bar. How to use: Attach the indicato
FREE
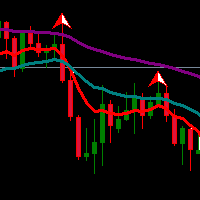
Exponential Moving Average (EMA) is an indicator that often be used by traders. Combination of two or three EMA indicators often applied to determine trend direction. Multiple EMA combined with fractals or oscillator indicator to detect overbought/oversold and divergence point also great to do in trading system.
If you like EMA indicator and want to get better indicator, highly recommended using EMA SuperTrend Strategy Indicator if you want to get better result in here:
https://www.mql5.com/en
FREE

RSI DIVERENCE INDICATOR
RSI divergence is very powerful pattern which is often used to detect a strong trend reversal. it also indicates the weakening of strong signal. So some traders want to use it as the exit criteria. This indicator works in all timeframe and send notification, alert or email to the user. It also show the Higher Highs and Lower Low Pattern with its corresponding RSI divergency. This indicator can be used in Expert Advisors as it has accessible buffers List of Inputs ______
FREE

The SPV Volatility indicator is one of the most effective filters. Volatility filter. Shows three volatility options. The so-called limit, real, and the last most effective filter for the filter is the percentage filter. Percentage display of folatility shows the ratio of limit to real volatility. And thus, if we trade in the middle of the channel, then it is necessary to set a condition that the percentage is less than a certain indicator value. If we trade on the channel breakout - following t

This indicator tool provides mini charts, with adjustable symbol/tf that can be dragged into place. Lightweight operation with multiple mini charts are supported.
Chart features: adjustable symbol and tf draggable multiple mini charts color styling and font sizing, foreground/background colors candle coloring candle styles; candles, bars, line, high-low channel
zoom in/out
FREE
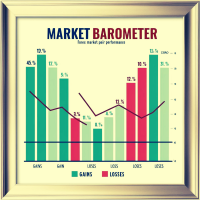
Market Barometer is a cheat code for trading, it acts as a "barometer" for market sentiment across various pairs, showcasing their changes. You can tell right away what to trade. You can trade trends or reversals. MT5 Version: https://www.mql5.com/en/market/product/127467 Market Barometer is a powerful tool designed to track and visualize the percentage changes across multiple currency pairs. By analyzing the price shifts of different forex pairs, it helps you understand how they are correlat
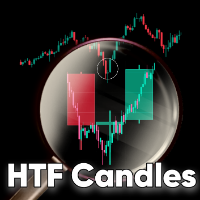
HTF Candles MT4 is a mt4 indicator which plots the outline of the higher time-frame candles on the lower candle, including any MT5 higher time-frame chosen. The indicator gives you the option to choose whether or not to view live current HTF candle, with no lag or repainting. Features MT5 Period Candles: This indicator plots any mt5 time-frame candle e.g m3, m5, m12, m15, m20... and so on, on the lower time-frame. Heiken Ashi Options: You have the option to view the HTF Heiken ashi instead of

This indicator is designed to detect high probability reversal patterns: Double Tops/Bottoms with fake breakouts . Please read also the blog post " How To Yield Big Winners Consistently! " which explains the concepts behind the ULTIMATE Double Top/Bottom indicator and how you can use a top-down approach to get 15 - 20R winning trades on a regular basis . The provided video shows the maximum performance of the indicator. With maximum performance, I mean that this could have been the profit if you
Gold Trend M1 - Optimized Scalping Tool for Gold (XAUUSD) Gold Trend M1 is a high-frequency trading indicator for the MetaTrader 4 platform, specifically optimized for the M1 timeframe on the Gold market. It combines a powerful SuperTrend trend filter with buy/sell signals derived from Heiken Ashi calculation logic, helping traders identify precise and disciplined entry points for optimal trading performance.
Key Features Optimized for M1 Scalping: Specifically developed for high-speed scalping
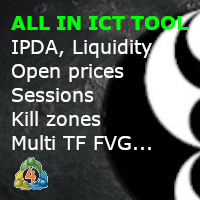
ICT Template Indicator visualizes and automatically updates all important ICT elements for Scalpers, Day and Swing traders. It allows you too keep your chart clean and bring any elements by just one click to the side buttons. Thanks to mobile notifications on external liquidity levels, you will not miss any opportunity and you don't have to sit behind the screens whole day. Each element has fully customizable colours, width, line types, max timeframe to be shown etc... so you can really tweak y
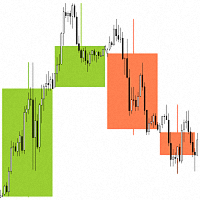
"Candlesticks MTF 4" is an information indicator that displays "Japanese Candlesticks" . The indicator analyzes and determines the opening and closing times of candles from higher time frames.
An algorithm has been developed for the "Candlesticks MTF 4" indicator that corrects the discrepancy between the opening and closing times of candles from higher time frames. For example, if the opening time of a candle on a weekly time frame is the 1st of the month, and on the smaller time frame this da
FREE
インジケータは、指定された係数に基づいて、低、高、極端なボリュームを検索し、指定された色でそれらをペイントします。 Metatraderターミナルの標準ボリューム描画機能に置き換えられます。 キャンドルは、ボリュームの色で着色することもできます。 極端なボリュームを持つローソク足では、最大水平ボリューム(クラスタ/POC)が決定されます。 その位置(押す、中立、停止)に応じて、クラスターにも独自の色があります。 クラスターが影の中にあり、ろうそくが極端なボリュームを持っている場合、反転のための矢印が得られます。 設定でアラートを有効にすることができます。 さらに、インジケーターには、クラスターをシャドウで表示する別のオプションがあります。
入力パラメータ 。 (色と視覚的な設定に関連するいくつかはスキップされます) 。
基本設定 。 Bars Count – 指標が機能する履歴バーの数 。 Data Source - 見積期間の選択。 あなたが切り捨てられ、不完全なように過去の歴史を見ると思われる場合は、あなたが勉強している楽器のためのより多くのM1引用符をダウンロー 。 Ver
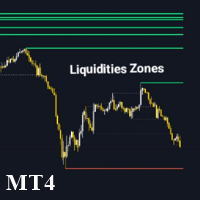
Liquidity Zone Detectorは、ZigZagインジケーターを使用して市場の重要な流動性ゾーンを特定し、強調するために設計された高度なテクニカルインジケーターです。このツールは、ZigZagによって検出された高値と安値にトレンドラインを描画することで、重要な流動性が存在する可能性のある価格レベルを特定します。Liquidity Zone Detectorは、流動性の蓄積や放出に基づいて、トレンドの反転や継続の可能性があるエリアを特定するのに役立ちます。 主な機能: 自動流動性ゾーン識別 : ZigZagインジケーターによって特定された高値と安値にトレンドラインを描画します。 高度なカスタマイズ : 流動性ラインの色、厚さ、スタイルを調整可能です。 動的な色変更 : 流動性レベルが突破された時にラインの色を変更するオプションがあります。 調整可能なZigZagパラメータ : より正確な検出のために、ZigZagの深さ、偏差、バックステップを調整できます。 Liquidity Zone Detectorは、市場の構造を分析し、重要な価格変動が発生する可能性のあるゾーンを特定
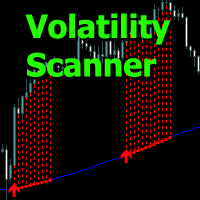
Volatility Scanner - このインジケーターは市場の状況を分析し、ヒストグラムでボラティリティが上昇しているゾーンを表示します。
このインジケーターを使用すると、ポジションのエントリーとホールド、トレンド方向への取引、あるいは取引をせずに時間を置くタイミングを判断できます。
入力パラメータにより、希望する取引商品や時間枠に合わせてインジケーターを個別に設定できます。
分足から日足まで、あらゆる時間枠に対応しています。
アラートの種類も複数あります。
すべてのインジケーターシグナルは再描画されず、遅延もなく、ローソク足の終値に表示されます。
スキャルピングからデイトレードまで、あらゆる取引システムに対応します。
インジケーターの仕組み
このインジケーターには移動平均線が含まれており、これに基づいてさらに計算を行います。「 Moving Average Period 」パラメータは、トレンド方向の期間を変更することで調整できます。 青い縦線は、弱気相場におけるボラティリティの上昇を示します。 赤い縦線は、強気相場におけるボラティリティの上昇を示します。 「 Candl
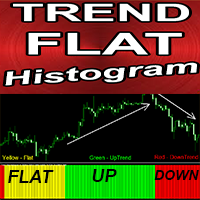
Crypto_Forex MT4用インジケーター「トレンドフラットヒストグラム」、リペイント不要。
- トレンドフラットヒストグラムインジケーターは非常に高感度で、標準的な移動平均線よりもはるかに効率的です。 - 現在の市場状況(フラット、上昇トレンド、下降トレンド)を表示するように設計されています。 - インジケーターは3色で表示されます。フラット市場状況は黄色、下降トレンドは赤、上昇トレンドは緑です(色は設定で変更できます)。 - モバイルとPCの両方でアラート機能を備えています。 - このインジケーターは、プライスアクション、スキャルピング、モメンタムトレード、その他のインジケーターなど、他の取引手法と組み合わせるのに最適です。
高品質のトレーディングロボットとインジケーターをご覧になるにはここをクリックしてください! これは、このMQL5ウェブサイトでのみ提供されるオリジナル製品です。
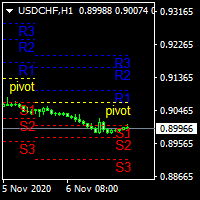
.................................if you need pivot point s levels............................... ............................this is a daily pivot point level creator........................... ...it is for daily pivots and show levels at times period H4 , H1 , M30 , M15 ,M 5... .................................also shows levels for 3 last days.............................. ................can use it with other indicators and see important levels...............
FREE

CustomMultiBarFractal Indicator Description
Overview The CustomMultiBarFractal indicator identifies and displays fractal patterns on price charts. Fractals represent significant price reversal points that can serve as signals for trading strategies.
Key Features - Detects fractals based on a user-defined analysis period - Displays upper and lower fractals with customizable colors - Allows offset adjustment from price extremes - Provides flexible visualization settings - Support
FREE

VWAP and Moving Average A combination of Supertrend and Moving Average to create a converging trade setup Input parameters: signal mode: set it to true if you want to plug it into STAT (Signal Tester and Trader) arrow shift: distance between fast EMA line to arrow on chart turn on moving average signal for converging setup VWAP period MA period MA averaging method MA pricing method upper level limit ( VWAP ) lower level limit ( VWAP ) You can find the best setting for 4 hour EURUSD on this v
FREE

本指标 基于 Zigzag 基础上... 增加了: 1.增加了箭头指示,使图表更鲜明 2.增加了价格显示,使大家更清楚的看清价格. 3.增加了报警等设置,可以支持邮件发送 原指标特性: 1.基本的波段指标构型. 2.最近的2个ZIGZAG点不具有稳定性,随着行情而改变,(就是网友所说的未来函数) 3.原指标适合分析历史拐点,波段特性,对于价格波动有一定的指导性.
Zigzag的使用方法一 丈量一段行情的起点和终点 (1)用ZigZag标注的折点作为起点和终点之后,行情的走势方向就被确立了(空头趋势); (2)根据道氏理论的逻辑,行情会按照波峰浪谷的锯齿形运行,行情确立之后会走回撤行情,回撤的过程中ZigZag会再次形成折点,就是回撤点; (3)在回撤点选择机会进场,等待行情再次启动,止损可以放到回撤的高点。 一套交易系统基本的框架就建立起来了。 Zigzag的使用方法二 作为画趋势线的连接点 趋势线是很常见的技术指标,在技术分析中被广泛地使用。 但一直以来趋势线在实战中都存在一个BUG,那就是难以保证划线的一致性。 在图表上有很多的高低点,到底该连接哪一个呢?不同的书上画趋势线的方法
FREE

製品名 Smart ATR (MT4) – SmartView シリーズ 短い説明 MetaTrader プラットフォームで独特なユーザー体験を提供する ATR インジケーター。以前は利用できなかった高度な機能を提供し、ダブルクリックで設定を開く、削除せずにインジケーターを非表示/表示する、インジケーターウィンドウをチャート全体のサイズで表示するなどの機能を備えています。SmartView Indicators シリーズの残りの部分とシームレスに連携するように設計されています。 概要 SmartView シリーズは、革新的な機能を通じて MetaTrader プラットフォーム上のインジケーターに独特で特徴的なユーザー体験を提供し、インジケーター管理をより速く、より簡単にします。各インジケーターには、チャート上のスマートコントロールパネルが装備されており、基本情報を表示し、すべての重要な機能への迅速なアクセスを提供します。 以前は利用できなかった独自の機能 SmartView シリーズは、インジケーターでの作業をより簡単で迅速にする高度な機能を提供します: ダブルクリックで設定を開く:
FREE

Summer Sale: 50% OFF!!! Promotion is valid until 08 August 2025! This indicator is unstoppable when combined with our other indicator called Katana. After purchase, send us a message and you could get Katana for FREE as a BONUS After purchase, send us a private message for your instructions. The Trend Forecasting indicator is a very unique & easy tool that is able to make prediction about future price movement based on the signals generated by MACD . It helps you have an estimation on the are
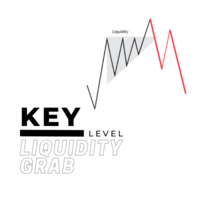
For a bullish move to occur for example, there should be alot of buying power. but you cannot buy if there is no sell on the other side, so the big players usually tend to manipulate the market in order to create available positions on the other side and be able to open their positions and one of the ways is by creating a fake breakout/ a liquidity grab. Before majority of big reversal moves and trends are formed, a liquidty grab would have occured in order to have enough orders to push for the

Scalping monster - ready trading system in the form of an indicator. Scalping monster is designed for the Metatrader4 platform. When placed on a forex chart, the indicator automatically analyzes the market using an adaptation algorithm and displays the signals to the trader in the form of red and blue dots. The indicator also shows in the upper right corner information about potential profit / loss.
Our other products at https://www.mql5.com/en/users/master-mql4/seller
How to trade using S
This automated VOLUME SCALPING INDICATOR can be utilized to manage trades and identify potential areas of support and resistance for both buying and selling. It is designed to identify zones for Sell/Buy trades based on the volume analysis and can be effectively used in conjunction with other indicators, such as order block indicators, and more. Currently designed for MT4, it will later be adapted to function on MT5. We also offer the opportunity to customize the robot according to your trading
FREE
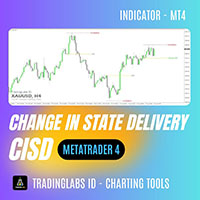
CISD (Change In State Delivery) Indicator TradingLabs ID – ICT Concept Tool The Change In State Delivery (CISD) Indicator is designed based on the ICT (Inner Circle Trader) concept, where price transitions from one delivery state to another often signal high-probability trade opportunities. This tool automatically detects and marks CISD levels on your MT4 charts, helping traders identify potential breakout and retest zones with great accuracy. It is especially useful for traders applying Smart
MTF Fair Value Gaps Alerts indicator is based on Fair Value Gaps (FVG), Volume imbalance (VI) and Gaps. This indicator will create 2 arrows pointing to the left showing the area of the FVG, VI and Gaps and will never repaint after the candle has been closed .
Inputs: TF (Timeframe of the Alert For Current timeframe use CURRENT)
barshilft : the barshift needs to be the same timeframe as the above TF. barshift format (CURRENT, M1, M5, M15, M30, H1, H4, D1, W1, MN) Send Email: Audible Alert Push N
FREE
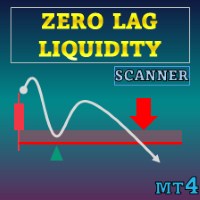
特別オファー : ALL TOOLS 、各 $35 ! 新ツール は 最初の1週間 または 最初の3回の購入 まで $30 ! MQL5 の Trading Tools チャンネル :最新情報を受け取るため、私の MQL5 チャンネルに参加してください Zero Lag Liquidity は、下位タイムフレームのヒゲプロファイルと高出来高のヒゲから流動性ゾーンを描画します。各異常ローソク足に対して、インジケーターはヒゲ内の出来高ヒストグラムを構築し、ローカルのポイント・オブ・コントロール(POC)を見つけ、その価格をレベルとして描画します。以降の価格の反応に基づき、ラベル、ブレイクシグナル、およびシンプルなトレンド状態をトリガーします。
MT5 版はこちら: Zero Lag Liquidity MT5 Scanner MT4 版はこちら: Zero Lag Liquidity MT4 Scanner その他の製品はこちら: All P roducts 概念 高出来高の長いヒゲ:上ヒゲ/下ヒゲが異常に長く出来高スパイクを伴うローソク足を、対向流動性イ
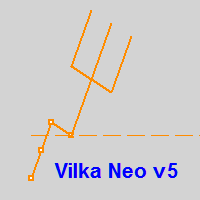
Вилка Нео v5, разрабатывалась для торговой системы "Оракул", но постепенно дополнялась, например - углами Ганна и другими опциями...
Можно создавать графические объекты с заданным цветом, стилем и толщиной, такие как: прямоугольники с заливкой и без, отрезки трендлиний и нестандартный инструмент - "вилка Нео" в виде трезубца, так же есть возможность интерактивно настраивать цветовую палитру прямо с графика, настраивать видимость объектов для разных ТФ, толщину и стили... Панель переключается кла
FREE

This indicator uses Bollinger Bands lines to detect markets trend. It's a very useful tool for manual trading. Furthermore it is possible to use the indicator with ATR as a filter , as well as the option to pop up an alert when a reverse trend occurs. The readings are very simple to use and understand. Indicator works best on H1 timeframe.
You can to get source code from here .
Parameters BarsCount - How many bars used to show the line. BBperiod - Period of Bollinger Bands. BBdeviations - Devi
FREE

Are you tired of drawing trendlines every time you're analyzing charts? Or perhaps you would like more consistency in your technical analysis. Then this is for you. This indicator will draw trend lines automatically when dropped on a chart. How it works Works similar to standard deviation channel found on mt4 and mt5. It has 2 parameters: 1. Starting Bar 2. Number of bars for calculation The starting bar is the bar which drawing of the trend lines will begin, while the number of bars for c
FREE
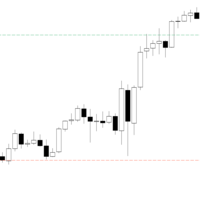
PDHL – simply displays the highs and lows of previous days directly on your chart, providing a quick and visual reference of past key levels. The indicator is lightweight and easily customizable , allowing you to adjust the number of days displayed, the colors, as well as the style and thickness of the lines to suit your preferences. It is designed to be simple and practical, but may not work on all instruments or platforms .
Only teste Tested only with CFDs
FREE
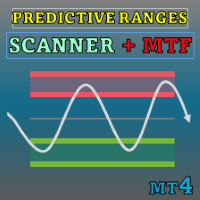
Special offer : ALL TOOLS , just $35 each! New tools will be $30 for the first week or the first 3 purchases ! Trading Tools Channel on MQL5 : Join my MQL5 channel to update the latest news from me 近年のボラティリティの高い金融取引市場では、サポートとレジスタンスを正確に見極めることが、トレーダーが的確な判断を下すために非常に重要です。 Predictive Ranges Scanner Multi-TF は、高度なツールであり、複数の通貨ペアと複数時間足にわたって将来のトレードレンジをスキャン・予測することで、市場トレンドを効果的かつ正確に把握できるようサポートします。 See more MT5 version at: Predictive Ranges MT5 Scanner Multi TF See more products at: All P ro

指定した時間枠の高値と安値に基づいて、自動的にフィボナッチレベルをプロットします 複数のバー を結合できます:例えば、10日間の高値と安値に基づいてフィボナッチを取得できます 私の #1 ツール : 66以上の機能、このインジケーターを含む | ご質問はこちら まで | MT5版 潜在的な反転レベルを確認するのに役立ちます; フィボナッチレベルで形成されるパターンはより強力になる傾向があります; 手動で プロットする 時間を 大幅に 削減 ; 設定: 基準となる高値と安値を計算する時間枠 基準価格を計算する期間の数 現在(フローティング)のバーを含める/除外する 各レベルはカスタマイズ可能、または無効化可能(0に設定でオフ) レベルグループ全体を無効にすることも可能:メイン、上方拡張、下方拡張を個別に ラインの色、スタイル、太さ レベルの価格を有効/無効にできます

A classical MACD indicator where both the MACD line and the Signal line are displayed as lines. The difference between MACD and Signal line is displayed as a histogram. A user can change the color and thickness of histogram lines. So, histogram lines can be grouped into four different groups: positive ascending, positive descending, negative descending and negative ascending. Multi-currency Dashboard for the indicator is available https://www.mql5.com/en/market/product/72354
FREE

The indicator defines a trading corridor, a flat market, and corrections.
Allows you to compare the significance of different flat and trend areas (by time of existence and by volatility). This makes it possible to assess the market cycle and its mood at a glance.
That is, how long does the flat last on average, and how long is the trend and what kind of volatility they have in points.
As a rule, the longer the flat lasts, the more likely it is to accumulate the potential for a strong movem
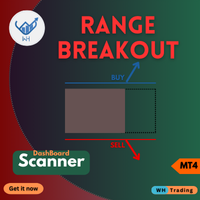
最先端のMQL4インジケーター、Range BreakOut MT4で、取引の新たな次元を解き放ちましょう。
この強力なツールは、価格が設定された範囲を突破したときに価格変動を特定し、それを活用するように設計されています。
金融市場のダイナミックな世界で成功するために必要な精度と自信を提供します。
MT5 バージョン : WH Range BreakOut MT5
特徴:
正確な範囲検出。 複数のシンボルと複数のタイムフレーム (スキャナー)。 リアルタイムのブレイクアウト信号。 カスタマイズ可能なパラメータ。 リスク管理ツール。
当社の製品を選ぶ理由:
精密トレーディング。 時間の節約。 汎用性。 継続的なアップデート。 Range BreakOut スキャナーを使用して、今すぐ取引体験を変革しましょう。
金融市場の複雑な状況を切り抜けるために当社のインジケーターを信頼している成功したトレーダーの仲間入りをしてください。
トレーディングのレベルを引き上げ、今すぐ Range BreakOut をダウンロードしましょう。

Introduction This indicator detects volume spread patterns for buy and sell opportunity. The patterns include demand and supply patterns. You might use each pattern for trading. However, these patterns are best used to detect the demand zone (=accumulation area) and supply zone (=distribution area). Demand pattern indicates generally potential buying opportunity. Supply pattern indicates generally potential selling opportunity. These are the underlying patterns rather than direct price action. T
FREE

ICT アジア レンジ インジケーターは、 ICT アジア レンジ トレーディング戦略に基づいて、トレーダーが主要な市場構造と流動性ゾーンを特定できるように設計された強力なツールです。アジア セッション (ニューヨーク時間午後 7 時から深夜まで) の最高価格レベルと最低価格レベルを示し、その後のトレーディング セッションの市場動向に関する重要な洞察を提供します。このインジケーターは、流動性スイープと公正価値ギャップ (FVG) を強調表示することで取引の精度を高め、ICT トレーダーにとって不可欠なツールとなっています。
アジアの範囲はなぜ重要ですか? アジアセッションは、その後の取引セッションにおける価格変動の基礎となります。この範囲を理解することで、トレーダーは市場センチメントを予測し、流動性ゾーンを見つけ、戦略的な取引のエントリーとエグジットを設定することができます。
ICT アジアレンジインジケーターの主な利点と使用方法 ICT アジア レンジ インジケーターは、トレーダーに早期の市場洞察を提供し、ロンドンとニューヨークのセッションが始まる前に毎日のトレンドとセ

Lord Auto Fibonnaci is a free indicator for Meta Trader, in order to show the most famous chart in the financial market known as "Fibonnaci".
As we can see in the images below, the fibonnaci table will automatically analyze the graph for you, with trend factors through percentage, almost infallible use, you can always work when the percentage is low or high, start shopping and sales on time, great for analyzing entries!
In the images below we can see an example in gold in H4, where we are at
FREE

What is G Force Trend? G Force Trend is a technical analysis indicator developed for the MetaTrader 4 platform. It analyzes price movements to identify trend direction and generates buy/sell signals. The indicator creates a dynamic channel to track price behavior within the channel and visualizes trend changes. What Does It Do? Trend Detection : Determines whether the price is in a bullish or bearish trend. Buy/Sell Signals : Generates clear buy and sell signals when the price crosses the channe
FREE

This comprehensive technical indicator calculates and plots up to 3 moving averages with 3 different periods. By employing three moving averages of distinct lookback periods, the trader can confirm whether the market has indeed experienced a change in trend or whether it is merely pausing momentarily before resuming its prior state. SX Golden MA Pack for MT5 is available here . The shorter the moving average period, the more closely it tracks the price curve. When a security initiates an upt
FREE
Stop missing powerful breakout opportunities! The Advanced Breakout Scanner Dashboard is a professional-grade trading tool that monitors up to 28 currency pairs in real-time, scanning for ten unique high-probability breakout strategies simultaneously. Attach it to a single chart to get a complete overview of the entire market, instantly identifying the best trading setups as they happen. This is not just a signal indicator; it's a complete trading dashboard designed for serious breakout traders.

Этот индикатор является уникальным в своём роде, больше всего подходит для скальпинга на XAUUSD а также для торговли на более старших таймфреймах!
Уведомление сообщит самые важные точки входа, поэтому следует торговать по тренду. Идеален для скальпинга! The Best Trend Signals - трендовый мультивалютный индикатор, может использоваться на любых финансовых инструментах валюта, криптовалюта, металлы, акции, индексы. Рекомендуемый тайм-фрейм M15, M30, H1, H4, D1.
Как торговать с помощью индикатора
FREE

Solarwind No Repaintは、正規化された価格データにフィッシャー変換を適用する技術的オシレーターで、潜在的な市場転換点を特定するヒストグラムベースの指標を作成します。この指標は価格変動をガウス正規分布に変換し、周期的パターンとモメンタムシフトをトレーダーにとってより見やすくします。 動作原理 この指標は、いくつかの計算ステップを通じて価格データを処理します: 高値安値分析 :指定期間内の最高値と最安値を計算 価格正規化 :各バーの高値安値レンジの中点を取り、期間レンジに対して正規化し、-1から+1の間で値をスケーリング フィッシャー変換適用 :数学的フィッシャー変換式 0.5 * ln((1+x)/(1-x)) をスムージングとともに適用 トレンドシグナル処理 :値の変化とモメンタム閾値に基づいて方向性シグナルを生成 主要機能 ヒストグラム表示 :別のインジケーターウィンドウでカラーバーとして描画 トレンドベースの色分け :強気モメンタムには緑バー、弱気モメンタムには赤バー ノーリペイント設計 :現在バーでのシグナル変更を防ぐため、完了したバーのみを使用 適応感度 :市
FREE

Mouse Calculation は、マウスで指した価格で決済した場合の各注文の損益を素早く計算します。 グリッド、マーチン、分割エントリーなど、複数注文の運用で素早い判断に最適です。回本価格(損益分岐)や目標価格がひと目で分かります。 主な機能 Mouse PnL (M) :注文ごとの損益と合計損益を表示(swap を含む)。 Break even Price (B) :全体の回本価格/損益分岐ラインを表示。 Time_Sync_Lines (T) :直近 N 日の同時刻を揃えて比較;ドラッグで重要局面を振り返り。 Panel (P) :操作パネルの表示/非表示。 About (A) :使い方と情報。 チャート上の表示 B / S :注文の現在損益 M :マウス価格で決済した場合の「決済損益」推定 T :合計損益 おすすめの場面 グリッド :全体の利確水準を素早く決定。 マーチン :どこまで戻れば回本/プラスになるかを素早く確認。 複数注文 :部分決済や調整が直感的に。 パラメータ sync_lines :Time_Sync_Lines の縦線本数(初期値 8)
(その他は色/表
FREE

This indicator lets you easily mark the daily open levels on a chart with several possibilities of customization. For many trading strategies, the daily open level is an important level to base trading decisions on. That is why I chose to create this indicator that is designed to assist you with trading these strategies, as well as further optimizing them and getting a general understanding of the markets movements. With this tools help, you can easily take a look at the previous price action ar
FREE

his indicator automatically identifies key support and resistance levels by analyzing volume patterns. Unlike traditional S/R tools that rely only on price, Volume S/R finds levels where the market truly reacted. DETECTION LOGIC: - High Volume Zones: Price levels where strong buying/selling occurred - Low Volume Zones: Areas of weak interest - potential breakout or reversal zones
SMART FILTERING: - Nearby levels are automatically merged to avoid chart clutter - Maximum levels limit keeps yo
FREE

Looking for entry points along the local trend without repaint! Arrows indicate entry points. Based on classic indicators. The indicator is easy to use. Settings Наименование Описание Frequency factor Signal frequency. The less, the more often.
This affects the quality.
Recommendations Recommended for use on major currency pairs. Timeframe from m5, m15, m30 Subscribe to my telegram channel, where we discuss intraday trading, ideas, indicators, etc., a link in my profile contacts.
FREE
ALL MOVING AVERAGES:多様な戦略に対応する究極のカスタムインジケーター ALL MOVING AVERAGES カスタムインジケーターは、 31種類以上の人気のある移動平均線 を網羅した、奥深いテクニカル分析のための不可欠なツールです。経験豊富なトレーダーから初心者まで、このインジケーターは比類のない柔軟性を提供し、幅広い取引戦略に合わせて移動平均線を完璧に調整できます。 期間やさまざまな価格計算タイプを含む包括的な入力パラメーター群により、取引スタイルや分析ニーズに合わせてインジケーターを簡単にカスタマイズできます。 主な機能と利点: 広範な移動平均ライブラリ: 従来の単純移動平均(SMA)から、ハル移動平均やゼロラグ指数移動平均などの高度なオプションまで、31種類以上の移動平均線の中から膨大な選択肢にアクセスでき、必要なすべてのツールが手に入ります。 高度なカスタマイズ性: 期間を調整し、標準的な終値、始値、高値、安値、および高度な平均足オプションを含む 20種類の異なる価格計算タイプ から選択することで、分析を微調整できます。 包括的なアラートシステム: タイム
FREE
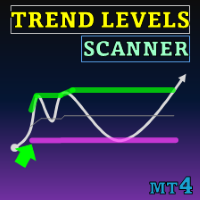
Special offer : ALL TOOLS , just $35 each! New tools will be $30 for the first week or the first 3 purchases ! Trading Tools Channel on MQL5 : Join my MQL5 channel to update the latest news from me トレンドレベル (Trend Levels) インジケーターは、相場の動きにおける重要なトレンドレベル(高値、中値、安値)を特定するために綿密に作られています。カスタマイズ可能な過去期間の最高値、最安値、および中値に基づくリアルタイム計算により、トレーダーにトレンドの動向と強さについて構造化された視点を提供し、精密かつ情報に基づいた取引判断を支援します。 MT5バージョンはこちら: Trend Levels MT5 他の製品を見るには: 全製品 トレンドレベルインジケーターの主な特徴と使用方法 トレンド変化シグナル インジケーターは、選択した入力期間内の最高値と
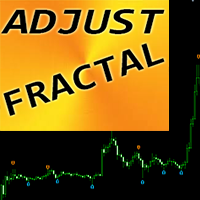
「調整可能なフラクタル」はフラクタル インジケーターの高度なバージョンで、非常に便利なトレーディング ツールです。
- ご存知のとおり、標準フラクタル mt4 インジケーターには設定がまったくありません。これはトレーダーにとって非常に不便です。 - 調整可能なフラクタルは、この問題を解決しました。必要な設定がすべて揃っています。 - インジケーターの調整可能な期間 (推奨値 - 7 以上)。 - 価格の高値/安値からの距離を調整可能。 - フラクタル矢印のデザインを調整可能。 - インジケーターにはモバイルおよび PC アラートが組み込まれています。 高品質のトレーディングロボットとインジケーターをご覧になるにはここをクリックしてください! これは、この MQL5 Web サイトでのみ提供されるオリジナル製品です。

【V 1.00】MTF NRPA 5 移動平均RTDがリリースされました!
非再描画矢印リアルタイム ダッシュボード。
最適な移動平均インジケーターをお探しなら、ここが正しいページです。 一般に、2 つの移動平均の交点 (クロスオーバー) が次の価格トレンドの方向を決定するため、2 つの移動平均を設定します。 高速移動平均が低速移動平均と交差し、高速 > 低速の場合、トレンドは上昇しています。 逆に、速い移動平均が遅い移動平均と交差し、速い < 遅い場合、トレンドは下降しています。 2 つの移動平均の欠点は、長期的な傾向が見えないことです。 それが私がこの取引ツールを開発した理由です。
それは次のように説明されています。
この取引ツールでは、5 つの移動平均を使用します。 はい、5つです! デフォルトでは、MA 1 と MA 2 を大きな時間枠 (H1) に設定します。 MA 1 と MA 2 の交差は、上半期の時間枠でトレンドの変化があることを意味します。 次に、現在の時間枠(小さい)に MA 3 と MA 4 を設定します。たとえば、M5 でチャートを開きます。 MA 3

The Pivot Point indicator automatically calculates and displays the pivot point line and support and resistance levels. Pivot can be calculated according to the Classic, Floor, Fibonacci, Woodie, Camarilla or DeMark formula. It is also possible to select the period for calculating the indicator. A trader can choose from daily, weekly, monthly, or user-defined periods.
Types of pivots Classic Floor Fibonacci Woodie Camarilla DeMark
Main features The indicator shows the current and historic
FREE

The indicator synchronizes eight types of markings on several charts of one trading instrument.
This indicator is convenient to use in conjunction with "Multichart Dashboard" or other similar assistant that allows you to work with several charts at the same time.
"Multichart Dashboard" can be found under the link on my youtube channel.
Settings:
enable vertical line synchronization
enable horizontal line synchronization
enable Trend Line synchronization
enabling Fibonacci Retracement synchron
FREE

Flat Reminder Overview Flat Reminder is a powerful technical analysis tool that identifies and highlights price consolidation zones on your chart. It detects when price action slows down and moves sideways, indicating potential reversal points, continuation setups, or key decision zones in the market. Key Features Consolidation Detection : Automatically identifies flat price zones where market momentum decreases Range Measurement : Calculates and displays the exact range of each consolidation in
FREE

This indicator is the basis for an Expert Advisor that can be categorized as "almost Grail". See details below. This indicator displays the projection of the Renko chart on the price chart. This projection is displayed as a stepped line, not as "bricks" (rectangles). See slides 1 and 2. Abbreviated name of the indicator: LRC – L ine of R enko on the price C hart. The principle of its construction is very simple. First, a grid of horizontal lines (levels) is bu
FREE
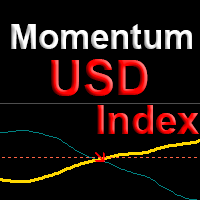
The indicator shows points for the continuation of the trend for currency pairs with the participation of the USD dollar with a probability of more than 80%. The algorithm is based on comparing the momentum of the current currency pair with the momentum of the DX dollar index at the current time. Using the dollar index allows us to evaluate not only the current pair, but the entire picture for all major currencies at once. This approach increases the reliability and reduces the number of false p
MetaTraderマーケットは、開発者がトレーディングアプリを販売するシンプルで便利なサイトです。
プロダクトを投稿するのをお手伝いし、マーケットのためにプロダクト記載を準備する方法を説明します。マーケットのすべてのアプリは暗号化によって守られ、購入者のコンピュータでしか動作しません。違法なコピーは不可能です。
取引の機会を逃しています。
- 無料取引アプリ
- 8千を超えるシグナルをコピー
- 金融ニュースで金融マーケットを探索
新規登録
ログイン